This report contains an erratum d.d. 21-01-2021 on page 51 RIVM letter report 2020-0117 G.R. Lagerweij et al.
Colophon
© RIVM 2020Parts of this publication may be reproduced, provided acknowledgement is given to: National Institute for Public Health and the Environment, along with the title and year of publication.
DOI 10.21945/RIVM-2020-0117 G.R. Lagerweij (author), RIVM R. Pijnacker (author), RIVM I.H.M. Friesema (author), RIVM L. Mughini Gras (author), RIVM E. Franz (author), RIVM
Contact:
Giske Lagerweij
Centre for Infectious Disease Control giske.lagerweij@rivm.nl
This investigation has been performed by order and for the account of Ministerie van VWS, within the framework of Programma 5
Published by:
National Institute for Public Health and the Environment, RIVM
P.O. Box 1 | 3720 BA Bilthoven The Netherlands
Synopsis
The burden of disease from foodborne pathogens in the Netherlands in 2019
Every year, RIVM investigates how many people become sick or die from 14 pathogens that can infect the stomach or intestines. This is termed the ‘burden of disease’ and it is expressed in DALYs (Disability Adjusted Life Years), an international measure for the number of healthy years of life that are lost to disease or because of people dying earlier than ‘normal’.
Not only can the 14 pathogens in question enter the human body via food (approximately 40% of infections), but also via the environment (for example, via surface water), animals and other people. The percentages of routes by which humans become infected vary
depending on the pathogen concerned. The total number of DALYs these 14 pathogens caused in 2019 was the same as in 2018 and 2017
(11,000 DALYs). The burden of disease via food in 2019 was estimated at 4,200 and was slightly lower than in 2018 (4,300 DALYs).
The total cost of this burden of disease was estimated at EUR 423 million, which is lower than in 2018 (EUR 426 million). This cost of illness comprises direct medical costs and costs for patients and/or their families, including travel expenses, and costs for other sectors, such as those due to absenteeism.
The cost of the burden of disease caused by infected food has risen slightly: EUR 174 million in 2019 compared to EUR 171 million in 2018. The difference in DALYs and costs are mainly due to the fact that the number of infections caused by some of the pathogens has changed. This is particularly the case with norovirus, rotavirus, and
Cryptosporidium and Campylobacter spp.
RIVM was commissioned to carry out this study by the Ministry of Health, Welfare and Sport (VWS). The results will help to provide a better understanding of the burden of disease and exposure routes of foodborne infections among the Dutch population. They also show the developments over the years.
Publiekssamenvatting
Ziektelast van voedseloverdraagbare ziekteverwekkers in Nederland in 2019
Het RIVM onderzoekt elk jaar hoeveel mensen ziek worden of sterven door 14 ziekteverwekkers die de maag of darm kunnen infecteren. Deze zogeheten ziektelast wordt uitgedrukt in DALY’s (Disability Adjusted Life Year), een internationale maat voor het aantal gezonde levensjaren dat verloren gaat aan ziekte of eerder dan ‘normaal’ overlijden.
De 14 ziekteverwekkers kunnen niet alleen via voedsel in het lichaam van de mens terechtkomen (ongeveer 40 procent). Het kan ook via het milieu (bijvoorbeeld via oppervlaktewater), dieren, en van mens op mens. Het aandeel van deze routes verschilt per ziekteverwekker. Het totaal aantal DALY’s die deze 14 ziekteverwekkers in 2019
veroorzaakten, is hetzelfde als in 2018 en 2017 (11.000 DALY’s). De ziektelast via voedsel is in 2019 geschat op 4.200, en is daarmee iets lager dan in 2018 (4.300 DALY’s).
De totale kosten van deze ziektelast worden geschat op 423 miljoen euro. Dat is lager dan in 2018 (426 miljoen). Deze cost of illness zijn directe medische kosten, maar ook de kosten voor de patiënt en/of zijn familie. Dat zijn bijvoorbeeld reiskosten, en de kosten binnen andere sectoren, zoals door werkverzuim.
De kosten van de ziektelast door besmet voedsel zijn iets gestegen: 174 miljoen euro in 2019 ten opzichte van 171 miljoen euro in 2018. De verschillen in DALY’s en kosten komen vooral doordat het aantal infecties dat een aantal van de ziekteverwekkers veroorzaakte
veranderde. Het gaat om norovirus, rotavirus, Cryptosporidium spp., en Campylobacter spp.
Het RIVM heeft dit onderzoek in opdracht van het ministerie van VWS uitgevoerd. De resultaten geven handvatten om meer zicht te krijgen op de ziektelast en blootstellingsroutes van voedselinfecties bij de
Nederlandse bevolking. Ook laten ze de ontwikkelingen hierin door de jaren heen zien.
Contents
Introduction ─ 9 1 Methods ─ 11 1.1 Trend information ─ 11 1.2 Burden of disease ─ 12 1.3 Cost of illness ─ 12 1.4 Attribution ─ 12 2 Results ─ 15 2.1 Trend information ─ 152.2 Number of incident cases ─ 18
2.3 Disease burden by pathogen ─ 21
2.4 Cost-of-illness by pathogen ─ 24
2.5 Attribution ─ 27
3 Discussion ─ 33
4 References ─ 35
5 Annex: Detailed results ─ 37 Erratum ─ 51
Introduction
Foodborne diseases encompass acute and chronic syndromes with varying duration and severity, as well as mortality. Risk-based food safety management (i.e. decisions on control, prevention and surveillance) requires a consistent, quantitative assessment of the relative public health importance of foodborne diseases [1]. As such, we express the public health impact of foodborne pathogens in burden of disease (BoD) and cost-of-illness (COI). The methodology that is used to estimate the burden of disease (in terms of Disability Adjusted Life Years (DALY)) is described in detail in a peer-reviewed paper [1], and in the disease burden report of food-related pathogens over the year 2015 [2]. Since 2008, the RIVM regularly publishes estimates of the number of incident cases, burden of disease, and costs of food-related infectious disease on its webpages1, and since 2010 in publicly available reports (e.g. [3, 4]). In the current report, trend information from surveillance, demographic information and consumer price index (a measure for changes in price levels of consumer goods and services) were used to update the information to the year 2019. For 2019 (and onwards), we did not estimate the burden of disease and costs for toxin-producing bacteria Bacillus cereus, Clostridium perfringens and Staphylococcus aureus, due to the absence of surveillance on these infections. However, for the overall 2019 estimates, these three pathogens were included in the tables and figures (based on data from previous years [4]) to have no breach in trend over time regarding the total burden and costs.
1
Methods
1.1 Trend information
Data on the size and age distribution of the Dutch population (Table 1), as well as mortality risks and the number of live births and stillbirths (Table 2) were obtained from Statistics Netherlands2.
Table 1 Population in the Netherlands by age group, 2015-2019
Age group 2019 2018 2017 2016 2015 0 168,443 169,566 172,288 170,341 174,681 1-4 697,619 698,533 700,001 706,513 713,641 5-11 1,294,145 1,303,023 1,307,281 1,313,978 1,324,894 12-17 1,197,548 1,214,974 1,224,528 1,225,749 1,215,977 18-64 10,610,404 10,555,872 10,517,749 10,477,231 10,463,848 65+ 3,314,004 3,239,116 3,159,660 3,085,308 3,007,685 Total 17,282,163 17,181,084 17,081,507 16,979,120 16,900,726 Table 2 Live births by age of mothers in the Netherlands, 2015-2019
Age of mother 2019* 2018 2017 2016 2015 -19 890 950 1,023 1,076 1,109 20-24 10,485 11,223 11,722 12,580 13,125 25-29 44,660 45,974 47,197 48,557 48,724 30-34 68,165 68,110 67,575 67,760 66,373 35-39 34,452 34,715 34,905 35,205 34,070 40-44 7,151 7,089 6,941 6,922 6,733 45+ 496 464 473 420 376 Total 166,299 168,525 169,836 172,520 170,510
* Estimates based on observed trend from 2016-2018
Trend information on the incidence of gastro-enteritis (GE) by pathogen in the general population and consulting the general practitioner was obtained from the following sources:
• Thermophilic Campylobacter spp.: RIVM ISIS-AMR laboratory surveillance;
• Non-typhoidal Salmonella spp.: RIVM passive laboratory surveillance;
• Shiga-toxin producing Escherichia coli O157 (STEC O157): mandatory notification and active laboratory surveillance; • Perinatal and acquired listeriosis: mandatory notification and
active laboratory surveillance;
• Norovirus: estimated norovirus-associated hospitalized cases derived from RIVM laboratory surveillance;
• Rotavirus: RIVM laboratory surveillance;
• Hepatitis A virus: mandatory notification and active laboratory surveillance;
• Hepatitis E virus: RIVM laboratory surveillance data; Note this was adapted in 2017 [5] and is therefore different with earlier publications [2] where a stable incidence based on Borgen et al. was assumed [6].
• Cryptosporidium spp.: RIVM laboratory surveillance data since 2013 until 2018, for 2019 the incidence is estimated based on observed trend from 2016-2018. Note that the incidence was adapted in 2017 [5] and is therefore different with earlier publications [2] where a stable incidence was assumed since 2003.
• Giardia spp.: a stable incidence was assumed since 2007 (i.e. the last year of RIVM laboratory surveillance data for Giardia spp.). Note this was adapted in 2017 [5] and is therefore different with earlier publications [2, 5] where a continuing decrease with the rate of -1.03% per year observed between 2001 and 2007 was assumed.
• No trend information was available for the GE toxin-producing bacteria (Bacillus cereus, Clostridium perfringens and
Staphylococcus aureus), and toxoplasmosis. For the latter, trends in reported fatalities are included.
Trends in hospitalizations for gastro-enteritis as primary cause (ICD codes 20-93; 558.9) were obtained from the Dutch Hospital Data (DHD) for 2011-2014. Since 2015 the number of hospitalized patients is
indirectly estimated from the observed time series of RIVM laboratory surveillance data on rotavirus, norovirus, campylobacteriosis and salmonellosis.
Excess mortality risks from campylobacteriosis and salmonellosis were assumed constant across the years. Fatalities due to listeriosis and STEC O157 were obtained from active surveillance based on mandatory
notification to RIVM. Age-specific case fatality ratios for norovirus and rotavirus, originally obtained from German surveillance data, and for protozoan pathogens, originally obtained from the international literature, were assumed constant throughout the years (changes in years of life lost therefore reflect changes in incidence on which mortality is based).
1.2 Burden of disease
The method for the burden of disease calculations, in terms of Disability Adjusted Life Years (DALYs), was not changed since 2018 (i.e. reporting over 2017) [3].
1.3 Cost of illness
The method for COI estimates was not changed since the previous 2018 report [3]. The cost prices used for the different resources was updated to 2019 euros using consumer price indexes as provided by Statistics Netherlands3. In order to allow comparison with earlier results we also updated the earlier cost-of-illness estimates (i.e., 2015-2018) to 2019 euros; hence all differences in the results for the year 2019 compared to earlier years will reflect the impact of trends in the underlying
information on demographics and pathogen incidence. 1.4 Attribution
The fraction of human cases of enterically transmitted illness by five major pathways
(food, environment, direct animal contact, human–human transmission, and travel) and by 11 groups within the food pathway was estimated using structured expert elicitation and is described in detail in Havelaar et al. [7]. The method and estimates for attribution were not changed since then.
2
Results
2.1 Trend information
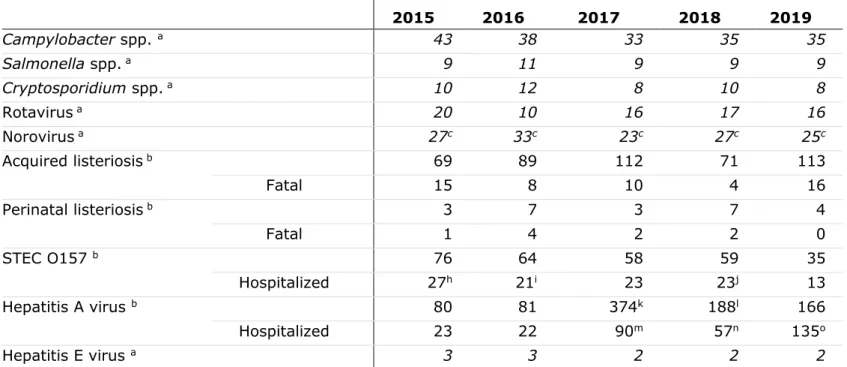
Trend information for the last five years for specific pathogens is presented in Table 3. For trend information since 1999 for the 14 pathogens, see Annex - Table A.1.
A summary of trends (in comparison with 2018) is discussed below: • The incidence of campylobacteriosis (laboratory confirmed cases)
stayed similar compared with 2018, i.e. 35 cases per 100,000 inhabitants in 2019.
• The incidence of salmonellosis (laboratory confirmed cases) is with 9 cases per 100,000 inhabitants similar to 2015-2018 (range: 9 to 11 per 100,000 inhabitants).
• Because the incidence of cryptosporidiosis (laboratory confirmed cases) was based on data from 2016-2018, no trend information was available.
• The incidence of gastroenteritis due to rotavirus (laboratory confirmed cases) in 2019 (16 per 100,000 inhabitants) was similar to 2018 (17 per 100,000 inhabitants). The observed biannual trend of a low epidemic year followed by a high
epidemic year that was observed in 2014-2017 did not continue. • The incidence of gastroenteritis by norovirus (laboratory
confirmed cases) was with 25 cases per 100,000 inhabitants slighter lower than in 2018 (27 per 100,000 inhabitants).
• The incidence of acquired listeriosis (laboratory confirmed cases, active surveillance) increased from 71 cases in 2018 to 113 cases in 2019. The recorded fatalities increased from 4 cases (2018) to 16 cases in 2019. In the last 10 years, it occurred once that the recorded fatalities were higher than 10 (i.e. 15 cases in 2015). • In 2019 the incidence of perinatal listeriosis (laboratory
confirmed cases, active surveillance) was 4 cases with 0 fatalities. This was lower than in 2018, with 7 cases and 2 fatalities.
• The incidence of diseases caused by STEC O157 (laboratory confirmed cases, active surveillance) in 2019 was 35 laboratory confirmed cases of which 13 were hospitalized, which is the lowest incidence within the last 10 years. The number of patients with HUS was with 2 cases in 2019 lower than in 2018 (5 cases) and comparable with 2014-2017 with 2 or 3 cases annually. • The incidence of hepatitis A virus (notified cases, active
surveillance) was 166 reported cases and 135 hospitalized cases far higher than in earlier years (~ 80 cases in 2016 and 2015), but lower than in 2017 and 2018 (i.e. 374 and 188 cases). The high number of cases in 2017 was due to an international
outbreak in men having sex with men, which peaked in 2017 and decreased throughout 2018 and 2019.
• With 2 cases per 100,000 inhabitants the incidence of hepatitis E virus (laboratory confirmed cases) was lower than in 2016 and in 2015 (i.e. 3 cases per 100,000) but similar to 2017 and 2018 (2 cases per 100,000 inhabitants).
• The number of patients that were admitted to the hospital due to GE was estimated to be 21.599 in 2019, compared with 21.845 in 2018.
Table 3 Trends in incidence per 100,000 inhabitants and reported cases, respectively, of food-related pathogens, 2015-2019 Year 2015 2016 2017 2018 2019 Campylobacter spp. a 43 38 33 35 35 Salmonella spp. a 9 11 9 9 9 Cryptosporidium spp. a 10 12 8 10 8 Rotavirus a 20 10 16 17 16 Norovirus a 27c 33c 23c 27c 25c Acquired listeriosis b 69 89 112 71 113 Fatal 15 8 10 4 16 Perinatal listeriosis b 3 7 3 7 4 Fatal 1 4 2 2 0 STEC O157 b 76 64 58 59 35 Hospitalized 27h 21i 23 23j 13 Hepatitis A virus b 80 81 374k 188l 166 Hospitalized 23 22 90m 57n 135o Hepatitis E virus a 3 3 2 2 2
Notes: a) Incidences per 100,000 habitants are presented in italics and the presented numbers are rounded: ≥10 to two significant numbers (e.g. 12.5
= 12) and <10 to 1 significant number (e.g. 0.89=0.9); b) reported cases; c) estimated norovirus-associated hospitalized cases derived from RIVM laboratory surveillance data and therefore not directly comparable to numbers from before 2012; d) known for 57/65 cases; e) known for 77/85 cases; f) known for 84/90 cases; g) known for 71/79 cases; h) known for 68/76 cases; i) known for 60/64 cases; j) known for 58 out of 59 cases; k) ~ 275 cases are (in)directly linked to an international outbreak in men having sex with men (MSM); l) 65 cases are (in)directly linked to an international outbreak of MSM m) known for 368/374 cases; n) known for 187/188 cases; o) known for 159/166 cases
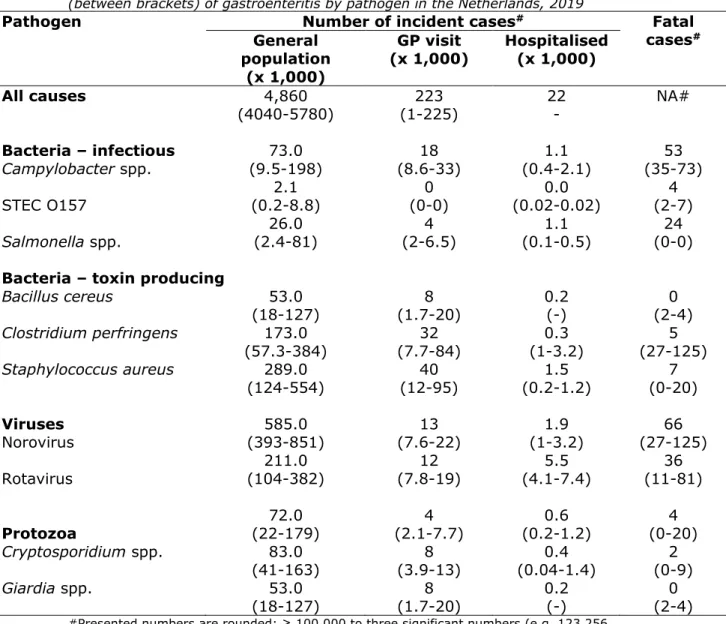
2.2 Number of incident cases
Ten of the selected pathogens (i.e. Campylobacter spp.; STEC O157; Salmonella spp.; all three toxin-producing bacteria; norovirus; rotavirus; Cryptosporidium spp.; Giardia spp.) cause acute
gastroenteritis. The other four pathogens (i.e. Listeria monocytogenes; Toxoplasma gondii; hepatitis A virus; hepatitis E virus) cause other diseases (e.g. meningitis, sepsis, hepatitis). The estimated number of incident cases of (acute) gastroenteritis by pathogen in 2019 is presented in Table 4. The estimated number of incident cases of
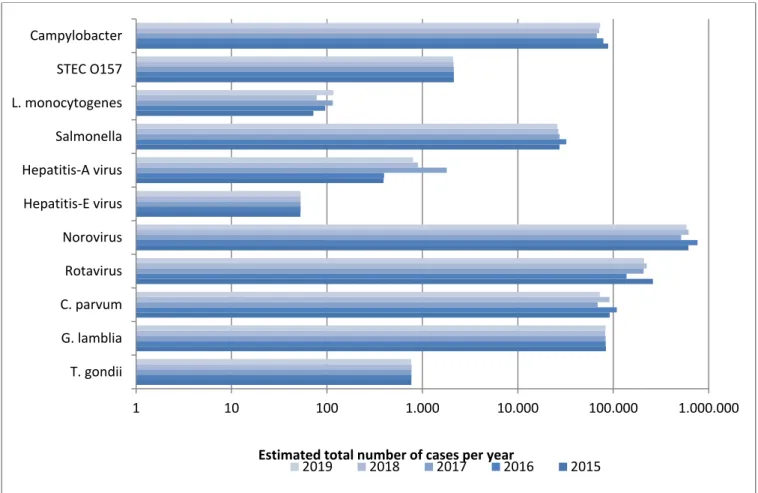
diseases by non-gastrointestinal pathogens in 2019 is presented in Table 5. The number of incident cases by the 14 pathogens for the years 2015-2019 is presented in Figure 1 and in Table A.2 in Annex I.
There was a small decrease of the estimated total number of cases due to the 14 food-related pathogens from 1,630,000 in 2018 to 1,570,000 in 2019, a result mostly due to the lower number of incident cases of norovirus, rotavirus, and Cryptosporidium spp.. The estimated incidence of the remaining pathogens did hardly change, mostly because of the following two reasons:
a) estimates were based on surveillance data from previous years because no data was available for these pathogens for 2019 (i.e. three toxin producing bacteria and Giardia)
b) estimates who were based on (active/passive) laboratory
surveillances for 2019 hardly differed from the data of 2018 (i.e. the other pathogens; Campylobacter spp., Salmonella spp., STEC, Listeria, and hepatitis-A and -E).
Table 4 Mean estimated number of incident cases and 95% uncertainty interval (between brackets) of gastroenteritis by pathogen in the Netherlands, 2019
Pathogen Number of incident cases# Fatal
cases# General population (x 1,000) GP visit (x 1,000) Hospitalised (x 1,000)
All causes 4,860 223 22 NA#
(4040-5780) (1-225) - Bacteria – infectious 73.0 18 1.1 53 Campylobacter spp. (9.5-198) (8.6-33) (0.4-2.1) (35-73) 2.1 0 0.0 4 STEC O157 (0.2-8.8) (0-0) (0.02-0.02) (2-7) 26.0 4 1.1 24 Salmonella spp. (2.4-81) (2-6.5) (0.1-0.5) (0-0)
Bacteria – toxin producing
Bacillus cereus 53.0 8 0.2 0 (18-127) (1.7-20) (-) (2-4) Clostridium perfringens 173.0 32 0.3 5 (57.3-384) (7.7-84) (1-3.2) (27-125) Staphylococcus aureus 289.0 40 1.5 7 (124-554) (12-95) (0.2-1.2) (0-20) Viruses 585.0 13 1.9 66 Norovirus (393-851) (7.6-22) (1-3.2) (27-125) 211.0 12 5.5 36 Rotavirus (104-382) (7.8-19) (4.1-7.4) (11-81) 72.0 4 0.6 4 Protozoa (22-179) (2.1-7.7) (0.2-1.2) (0-20) Cryptosporidium spp. 83.0 8 0.4 2 (41-163) (3.9-13) (0.04-1.4) (0-9) Giardia spp. 53.0 8 0.2 0 (18-127) (1.7-20) (-) (2-4)
#Presented numbers are rounded: ≥ 100,000 to three significant numbers (e.g. 123,256 = 123,000); between <100,000 and ≥10 to two significant numbers (e.g. 1,325 = 1,300) and <10 to 1 significant number (e.g. 0.0023=0.002). The presented numbers are estimates that rely on annual surveillance data being corrected for: i) coverage (where applicable); ii) underdiagnosis and underreporting; and iii) under-ascertainment (i.e. being sick without requiring medical help).
Table 5 Mean estimated number of incident cases and 95% uncertainty interval (between brackets) of non-gastrointestinal pathogen in the Netherlands, 2019
Pathogen Number of incident
cases mean (95% CI) Fatal cases mean (95% CI) Listeria monocytogenes Perinatal 4 * 16 * Acquired 113 * 0 * Hepatitis A virus# 700 (500-1300) 3 (2-4) Hepatitis E virus# 1,200 (680-1800) 13 (4-29) Toxoplasma gondii# Congenital 334 (174-587) 12 (8-19) Acquired** 430 (201-729) 0
*No uncertainty because Listeria cases were acquired through surveillance; **
chorioretinitis only. #The presented numbers are rounded: ≥10 to two significant numbers
(e.g. 1,325 = 1,300) and <10 to 1 significant number (e.g. 0.0023=0.002). The presented numbers are estimates that rely on annual surveillance data being corrected for: i) coverage (where applicable); ii) underdiagnosis and underreporting; and iii) under-ascertainment (i.e. being sick without requiring medical help).
Figure 1 Comparison of mean estimated number of incident cases of food-related pathogens, 2015-2019
* Since the 2017-update new incidence estimates for hepatitis E virus, Cryptosporidium spp. and Giardia spp. are used, therefore estimates presented here for 2015 are different from the one presented in earlier publications (i.e. [2]).
1 10 100 1.000 10.000 100.000 1.000.000 T. gondii G. lamblia C. parvum Rotavirus Norovirus Hepatitis-E virus Hepatitis-A virus Salmonella L. monocytogenes STEC O157 Campylobacter
The total number of estimated deaths due to foodborne disease in 2019 was slightly higher than in 2018, with 245 deaths compared to 238 (see Table A.3 in Annex).
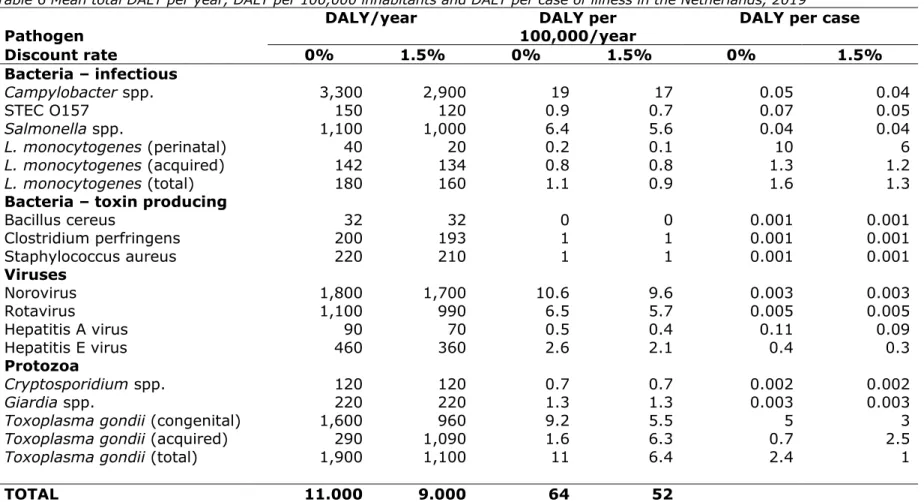
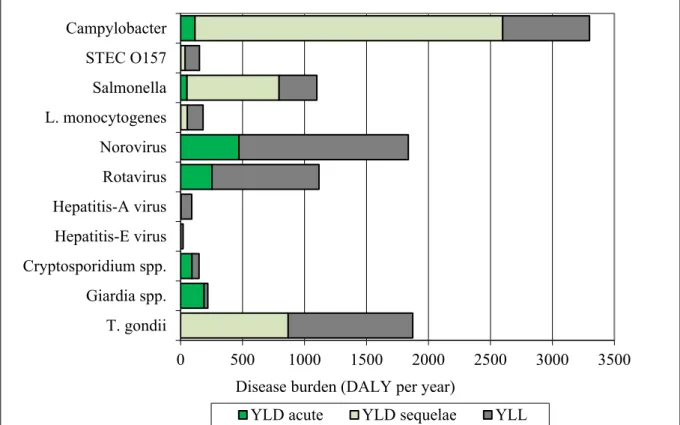
2.3 Disease burden by pathogen
Table 6 presents the estimated burden of disease by pathogen for the total Dutch population in 2019, expressed as DALY per 100,000 inhabitants and DALY per case, both undiscounted and discounted. The total burden of disease of the 14 pathogens in 2019 was similar to 2018 and 2017, with 11,000 DALYs, but lower than 2015-2016 (Table A.4 in Annex). An increase in the burden of disease between 2018 and 2019 was found for Campylobacter spp. (+100 DALYs). For norovirus and rotavirus, the largest decrease in disease burden was found, i.e. -100 DALYs. The largest burden at population level was caused by Campylobacter spp. (3,300 DALY), followed by T. gondii (1,900 DALYs) and norovirus (1,800 DALYs). Regarding zoonotic foodborne pathogens, Salmonella ranked second after Campylobacter spp. with 1,100 DALYs. Interestingly, although the disease burden for Campylobacter spp. has continually decreased since 2010, the disease burden slightly increased in 2018 and this increase continued in 2019. Perinatal listeriosis was the disease outcome with the highest individual burden among all pathogens (10 DALY per case), followed by congenital toxoplasmosis (5 DALY per case).
In Figure 2 we show per pathogen the contribution of years lived with disability (YLD) associated with acute infections, YLD associated with sequelae and years of life lost (YLL) due to premature mortality to total DALY. YLD associated with acute infections contributed 14% to the total disease burden; YLD associated with sequelae/residuals contributed 40% and YLL 46% of the total disease burden. The distribution between the different categories varied between pathogens, see Figure 2 for details.
Table 6 Mean total DALY per year, DALY per 100,000 inhabitants and DALY per case of illness in the Netherlands, 2019#
Pathogen DALY/year 100,000/year DALY per DALY per case
Discount rate 0% 1.5% 0% 1.5% 0% 1.5% Bacteria – infectious Campylobacter spp. 3,300 2,900 19 17 0.05 0.04 STEC O157 150 120 0.9 0.7 0.07 0.05 Salmonella spp. 1,100 1,000 6.4 5.6 0.04 0.04 L. monocytogenes (perinatal) 40 20 0.2 0.1 10 6 L. monocytogenes (acquired) 142 134 0.8 0.8 1.3 1.2 L. monocytogenes (total) 180 160 1.1 0.9 1.6 1.3
Bacteria – toxin producing
Bacillus cereus 32 32 0 0 0.001 0.001 Clostridium perfringens 200 193 1 1 0.001 0.001 Staphylococcus aureus 220 210 1 1 0.001 0.001 Viruses Norovirus 1,800 1,700 10.6 9.6 0.003 0.003 Rotavirus 1,100 990 6.5 5.7 0.005 0.005 Hepatitis A virus 90 70 0.5 0.4 0.11 0.09 Hepatitis E virus 460 360 2.6 2.1 0.4 0.3 Protozoa Cryptosporidium spp. 120 120 0.7 0.7 0.002 0.002 Giardia spp. 220 220 1.3 1.3 0.003 0.003
Toxoplasma gondii (congenital) 1,600 960 9.2 5.5 5 3
Toxoplasma gondii (acquired) 290 1,090 1.6 6.3 0.7 2.5
Toxoplasma gondii (total) 1,900 1,100 11 6.4 2.4 1
TOTAL 11.000 9.000 64 52
Presented numbers are rounded: ≥ 100,000 to three significant numbers (e.g. 123,256 = 123,000); between <100,000 and ≥10 to two significant numbers (e.g. 1,325 = 1,300) and <10 to 1 significant number (e.g. 0.0023=0.002). The presented numbers are estimates that rely on annual surveillance data being corrected for: i) coverage (where applicable); ii) underdiagnosis and underreporting; and iii) under-ascertainment (i.e. being sick without requiring medical help).
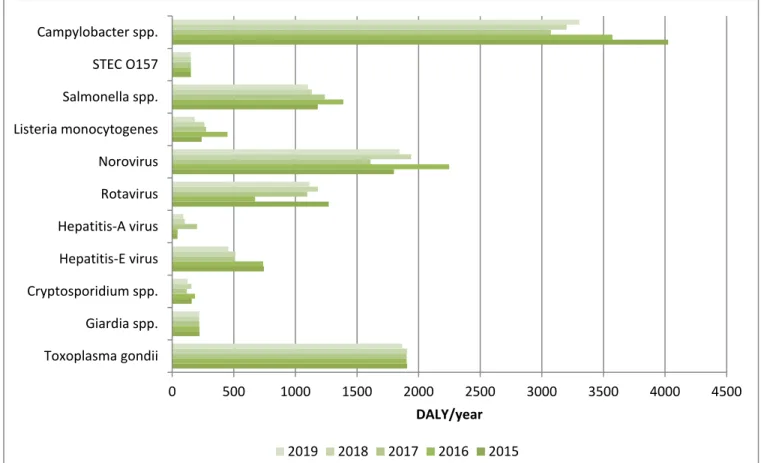
Figure 2 Mean DALY per year of food-related pathogens in 2019, split up into YLD associated with acute infections; YLD associated with sequelae and YLL. The mean disease burden by the 14 pathogens for the years 2015-2019 is presented in Figure 3 and in Table A.4 in Annex.
0 500 1000 1500 2000 2500 3000 3500 Campylobacter STEC O157 Salmonella L. monocytogenes Norovirus Rotavirus Hepatitis-A virus Hepatitis-E virus Cryptosporidium spp. Giardia spp. T. gondii
Disease burden (DALY per year)
Figure 3 Comparison of disease burden (undiscounted DALYs) of food-related pathogens in 2015-2019
* Since the 2017-update new incidence estimates for hepatitis E virus, Cryptosporidium spp. and Giardia spp. are used, therefore estimates presented here for 2015 are different from the one presented in earlier publications (i.e. [2]).
2.4 Cost-of-illness by pathogen
The total COI in 2019 (423 M€; discounted at 4%) was slightly lower than in 2018 (426 M€) (Table 7, Figures 4-5, and Annex Table A.5). The four pathogens causing the largest COI were norovirus (106 M€),
rotavirus (64 M€), Staphylococcus aureus toxin (63 M€), and Campylobacter (62 M€). The lowest contribution to the COI was by hepatitis A virus (1.3 M€). The largest changes in COI compared to 2018 were for Cryptosporidium (- 3.6 M€) and norovirus (-3.2 M€). The
average cost per case was largest for perinatal Listeria monocytogenes infections (€291,000/case). 0 500 1000 1500 2000 2500 3000 3500 4000 4500 Toxoplasma gondii Giardia spp. Cryptosporidium spp. Hepatitis-E virus Hepatitis-A virus Rotavirus Norovirus Listeria monocytogenes Salmonella spp. STEC O157 Campylobacter spp. DALY/year 2019 2018 2017 2016 2015
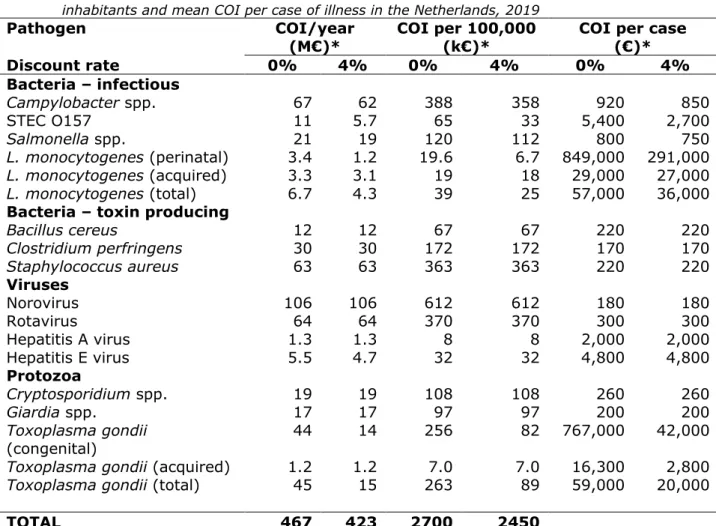
Table 7 Estimated mean total costs of illness (COI), mean COI per 100,000 inhabitants and mean COI per case of illness in the Netherlands, 2019
Pathogen COI/year
(M€)* COI per 100,000 (k€)* COI per case (€)*
Discount rate 0% 4% 0% 4% 0% 4% Bacteria – infectious Campylobacter spp. 67 62 388 358 920 850 STEC O157 11 5.7 65 33 5,400 2,700 Salmonella spp. 21 19 120 112 800 750 L. monocytogenes (perinatal) 3.4 1.2 19.6 6.7 849,000 291,000 L. monocytogenes (acquired) 3.3 3.1 19 18 29,000 27,000 L. monocytogenes (total) 6.7 4.3 39 25 57,000 36,000
Bacteria – toxin producing
Bacillus cereus 12 12 67 67 220 220 Clostridium perfringens 30 30 172 172 170 170 Staphylococcus aureus 63 63 363 363 220 220 Viruses Norovirus 106 106 612 612 180 180 Rotavirus 64 64 370 370 300 300 Hepatitis A virus 1.3 1.3 8 8 2,000 2,000 Hepatitis E virus 5.5 4.7 32 32 4,800 4,800 Protozoa Cryptosporidium spp. 19 19 108 108 260 260 Giardia spp. 17 17 97 97 200 200 Toxoplasma gondii (congenital) 44 14 256 82 767,000 42,000
Toxoplasma gondii (acquired) 1.2 1.2 7.0 7.0 16,300 2,800
Toxoplasma gondii (total) 45 15 263 89 59,000 20,000
TOTAL 467 423 2700 2450
Used abbreviations: million € (M€); 1000 € (k€). * Total COI per year are presented in million € (M€) and if less than 1 million rounded to 1 significant number (e.g. 0.0023 million =0.002). COI per 100,000 and COI per case are rounded: ≥ 100,000 to three significant numbers (e.g. 123,256 = 123,000 or 123 k€); between <100,000 and ≥10 to two significant numbers (e.g. 1,325 = 1,300 or 1.3 k€). The presented numbers are estimates that rely on annual surveillance data being corrected for: i) coverage (where applicable); ii) underdiagnosis and underreporting; and iii) under-ascertainment (i.e. being sick without requiring medical help).
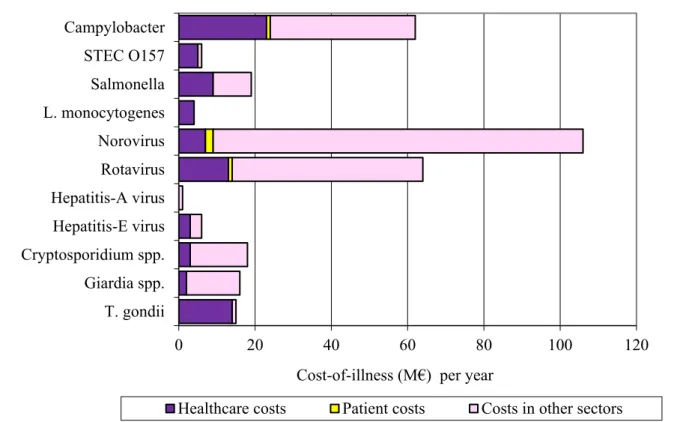
In Figure 4, the mean COI per year was split up in healthcare costs, patient/family costs and costs in other sectors. The latter was mostly productivity losses of patients and caregivers being absent from work. Healthcare costs accounted for 21% of the total costs for the 14 pathogens, patient/family costs for 2% and costs in other sectors accounted for 77%. The distribution between the different cost categories varied between pathogens.
Figure 4 Mean cost-of-illness (discounted) per year of food-related pathogens in 2019, split up into healthcare costs, patient costs and costs in other sectors. The mean COI estimates per pathogen for the years 2015-2019 is presented in Figure 5 and in Table A.4 in Annex.
0 20 40 60 80 100 120 Campylobacter STEC O157 Salmonella L. monocytogenes Norovirus Rotavirus Hepatitis-A virus Hepatitis-E virus Cryptosporidium spp. Giardia spp. T. gondii
Cost-of-illness (M€) per year
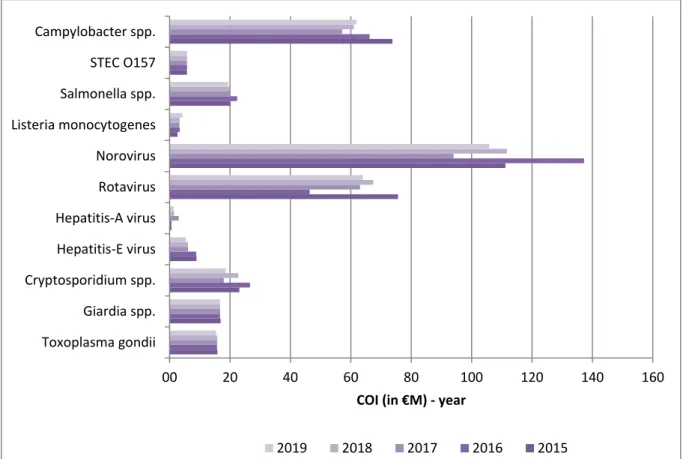
Figure 5 Comparison of cost-of-illness (M€, discounted at 4% and expressed in 2019 euros) of food-related pathogens in 2015-2019*
* Since the 2017-update new incidence estimates for hepatitis E virus, Cryptosporidium spp. and Giardia spp. are used, therefore estimates presented here for 2015 are different from the one presented in earlier publications (i.e. [2]).
2.5 Attribution
The attribution results (expert elicitation) for DALYs and COI of foodborne diseases in 2019 are presented in Table 8 for the main pathways and in Table 9 for the different food groups. More details can be found in the Tables A.6–A.13 in Annex. Foodborne disease burden accounted for 38% of the total burden (i.e. 4,200 DALYs of the total burden of 11,000 DALYs per year), and 41% of the total COI (i.e. 174 M€ of the 423 M€). About 41% of the foodborne burden was associated with meat (i.e. poultry, pork, beef & lamb). These foods caused 33% of all food-related fatal cases, indicating that the pathogens associated with these foods are considered to cause more severe infections than pathogens associated with other foods.
The attribution results for incidence, number of fatal cases, DALYs and COI estimates of foodborne diseases for the years 2015-2019 are presented in Tables 10-13. The foodborne disease burden slightly decreased by 100 DALYs from 4,300 DALYs in 2018 to 4,200 DALYs in 2019 and the COI increased by 3 M€ from 171 M€ in 2017 to 174 M€ in 2019. 00 20 40 60 80 100 120 140 160 Toxoplasma gondii Giardia spp. Cryptosporidium spp. Hepatitis-E virus Hepatitis-A virus Rotavirus Norovirus Listeria monocytogenes Salmonella spp. STEC O157 Campylobacter spp.
COI (in €M) - year
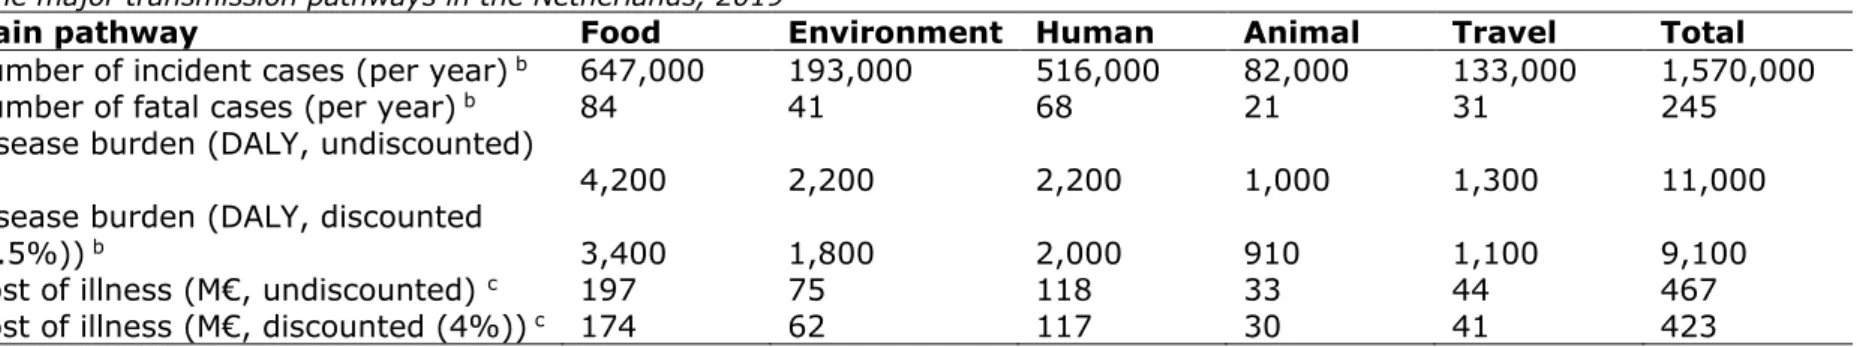
Table 8 Attribution of the mean estimated number of incident cases, fatalities, disease burden and cost-of-illness of foodborne diseasea to the major transmission pathways in the Netherlands, 2019
Main pathway Food Environment Human Animal Travel Total
Number of incident cases (per year) b 647,000 193,000 516,000 82,000 133,000 1,570,000
Number of fatal cases (per year) b 84 41 68 21 31 245
Disease burden (DALY, undiscounted)
b 4,200 2,200 2,200 1,000 1,300 11,000
Disease burden (DALY, discounted
(1.5%)) b 3,400 1,800 2,000 910 1,100 9,100
Cost of illness (M€, undiscounted) c 197 75 118 33 44 467
Cost of illness (M€, discounted (4%)) c 174 62 117 30 41 423
a) Due to the 14 pathogens included in this study
b) Presented numbers are rounded: ≥ 100,000 to three significant numbers (e.g. 123,256 = 123,000); between <100,000 and ≥10 to two significant numbers (e.g. 1,325 = 1,300) and <10 to 1 significant number (e.g. 0.0023=0.002). The presented numbers are estimates that rely on annual surveillance data being corrected for: i) coverage (where applicable); ii) underdiagnosis and underreporting; and iii)
under-ascertainment (i.e. being sick without requiring medical help). c) Costs are expressed in 2017 euros and in million € (M€).
Table 9 Attribution of the mean incidence, fatalities, disease burden and cost-of-illness of foodborne diseasea to food group in the Netherlands, 2019
Food groups Beef &
Lamb Pork Poultry Eggs Dairy shellfish Fish& Produce Beverages Grains Other foods Humans& animals Total Number of
incident cases (per year) b
108,000 44,000 54,000 21,000 54,000 52,000 38,000 15,000 39,000 121,000 101,000 647,000 Number of fatal
cases (per year) b 9 9 16 5 7 8 6 2 3 5 12 82
Disease burden (DALY, undiscounted) b 530 740 940 200 300 290 270 74 120 220 430 4,100 Disease burden (DALY, discounted (1.5%)) b 410 510 810 180 250 250 230 66 110 200 370 3,400 Cost of illness (M€, undiscounted)c 30 25 26 7 17 15 12 4 10 28 25 197 Cost of illness (M€, discounted (4%)) c 25 16 23 7 15 13 11 4 9 27 23 174
a) Due to the 14 pathogens included in this study
b) Presented numbers are rounded: ≥100,000 to three significant numbers (e.g. 123,256 = 123,000); between <100,000 and ≥10 to two significant numbers (e.g. 1,325 = 1,300) and <10 to 1 significant number (e.g. 0.0023=0.002). The presented numbers are estimates that rely on annual surveillance data being corrected for: i) coverage (where applicable); ii) underdiagnosis and underreporting; and iii) under-ascertainment (i.e. being sick without requiring medical help).
Table 10 Attribution of mean incidence to food in the Netherlands for 2015-2019, total and by pathogen
Pathogen Incidence/year 2015* 2016 2017 2018 2019 Campylobacter spp. 37,000 33,000 28,000 30,000 31,000 STEC O157 860 860 860 860 850 Salmonella spp. 15,000 18,000 15,000 14,000 14,000 Listeria monocytogenes 50 66 80 54 81 B. cereus toxin 46,000 47,000 47,000 47,000 48,000 C. perfringens toxin 154,000 154,000 155,000 155,000 157,000 S. aureus toxin 251,000 250,000 251,000 251,000 252,000 Norovirus 103,000 128,000 86,000 103,000 98,000 Rotavirus 34,000 18,000 27,000 29,000 27,000 Hepatitis A virus 45 45 55 69 75 Hepatitis E virus 260 260 180 180 160 Cryptosporidium spp. 11,000 13,000 8,200 10,900 8,600 Giardia spp. 11,000 11,000 11,000 11,000 11,000 Toxoplasma gondii 430 430 430 430 430 Total 663,000 673,000 629,000 652,000 647,000
Presented numbers are rounded: ≥ 100,000 to three significant numbers (e.g. 123,256 = 123,000); between <100,000 and ≥10 to two significant numbers (e.g. 1,325 = 1,300) and <10 to 1 significant number (e.g. 0.0023=0.002). The presented numbers are estimates that rely on annual surveillance data being corrected for: i) coverage (where applicable); ii) underdiagnosis and underreporting; and iii) under-ascertainment (i.e. being sick without requiring medical help).
* Since the 2017-update new incidence estimates for hepatitis E virus, Cryptosporidium spp. and Giardia spp. are used, therefore estimates presented here for 2015 are different from the one presented in earlier publications (i.e. [2]).
Table 11 Attribution of mean number of fatal cases to food in the Netherlands for 2015-2019, total and by pathogen
Pathogen Number of fatal cases/year
2015* 2016 2017 2018 2019 Campylobacter spp. 27 24 21 20 22 STEC O157 2 2 2 2 2 Salmonella spp. 15 18 19 14 13 Listeria monocytogenes 11 8 8 4 11 B. cereus toxin 0 0 0 0 0 C. perfringens toxin 4 4 4 4 4 S. aureus toxin 6 6 6 6 6 Norovirus 11 14 9 11 11 Rotavirus 6 3 5 5 5 Hepatitis A virus 0 0 0 0 0.3 Hepatitis E virus 3 3 2 2 2 Cryptosporidium spp. 1 1 1 1 0.5 Giardia spp. 0 0 0 0 0.3 Toxoplasma gondii 7 7 7 7 7 Total 93 90 83 76 84
* Since the 2017-update new incidence estimates for hepatitis E virus, Cryptosporidium spp. and Giardia spp. are used, therefore estimates presented here for 2015 are different from the one presented in earlier publications (i.e. [2]).
Table 12 Attribution of mean disease burden (DALY per year, undiscounted) to food in the Netherlands for 2015-2019, total and by pathogen
Pathogen DALY(undiscounted)/year 2015* 2016 2017 2018 2019 Campylobacter spp. 1,700 1,500 1,300 1,300 1,400 STEC O157 61 61 61 61 61 Salmonella spp. 640 760 680 620 600 Listeria monocytogenes 170 310 190 180 130 B. cereus toxin 28 28 29 29 29 C. perfringens toxin 180 180 180 180 180 S. aureus toxin 190 190 190 190 190 Norovirus 300 380 270 320 310 Rotavirus 170 88 140 150 150 Hepatitis A virus 5 5 6 8 8 Hepatitis E virus 100 100 70 71 63 Cryptosporidium spp. 19 22 14 19 15 Giardia spp. 29 29 29 28 29 Toxoplasma gondii 1,100 1,100 1,100 1,100 1,000 Total 4,600 4,700 4,200 4,300 4,200
Presented numbers are rounded: ≥ 100,000 to three significant numbers (e.g. 123,256 = 123,000); between <100,000 and ≥10 to two significant numbers (e.g. 1,325 = 1,300) and <10 to 1 significant number (e.g. 0.0023=0.002). The presented numbers are estimates that rely on annual surveillance data being corrected for: i) coverage (where applicable); ii) underdiagnosis and underreporting; and iii) under-ascertainment (i.e. being sick without requiring medical help). * Since the 2017-update new incidence estimates for hepatitis E virus, Cryptosporidium spp. and Giardia spp. are used, therefore estimates presented here for 2015 are different from the one presented in earlier publications (i.e. [2]).
Table 13 Attribution of mean COI (M€/year discounted at 4% and expressed in 2019 euros) to food in the Netherlands for 2015-2019, total and by pathogen
Pathogen COI per year (4%)/year
(Million €, expressed in 2019 euros)
2015* 2016 2017 2018 2019 Campylobacter spp. 30 27 23 25 26 STEC O157 2 2 2 2 2 Salmonella spp. 11 12 11 11 11 Listeria monocytogenes 2 2 2 2 3 B. cereus toxin 10 10 10 10 10 C. perfringens toxin 26 26 26 27 27 S. aureus toxin 52 52 52 53 55 Norovirus 18 22 15 18 18 Rotavirus 9 6 8 9 8 Hepatitis A virus 0.07 0.07 0.3 0.1 0.1 Hepatitis E virus 1 1 0.8 0.8 0.8 Cryptosporidium spp. 3 3 2 3 2 Giardia spp. 2 2 2 2 2 Toxoplasma gondii 8 8 8 9 9 Total 174 173 163 171 174
Total COI per year are presented in million € (M€) and if less than 1 million rounded to 1 significant number (e.g. 0.0023 million =0.002). The presented numbers are estimates that rely on annual surveillance data being corrected for: i) coverage (where applicable); ii) underdiagnosis and underreporting; and iii) under-ascertainment (i.e. being sick without requiring medical help).
* Since the 2017-update new incidence estimates for hepatitis E virus, Cryptosporidium spp. and Giardia spp. are used, therefore estimates presented here for 2015 are different from the one presented in earlier publications (i.e. [2]).
3
Discussion
This report provides an integrated public health perspective on the burden of 14 food-related pathogens in the Netherlands. The ranking of foodborne pathogens when using burden of disease metrics is very different compared to ranking based on incidence only. T. gondii, Campylobacter spp., norovirus and Salmonella spp. are the pathogens with the highest burden in the whole population of the Netherlands. T. gondii and L. monocytogenes are the pathogens with the highest burden at an individual level. We observed an overall decrease in the number of incident cases of the 14 enteric food-related pathogens, especially for norovirus, Cryptosporidium spp. and rotavirus. Since, the
aforementioned pathogens had a relatively low disease burden per case, the overall burden of disease in 2019 was similar to 2018 (11,000 DALYs). The burden of disease is still lower than in 2015-2016 (range: 12,000 to 14,000 DALYs). Overall, the proportion of foodborne
transmission was about 40%, and the attributable burden decreased slightly compared to 2018 (from 4,300 to at 4,200 DALYs). The overall COI slightly decreased and the foodborne-related COI slightly increased in 2019 compared to 2018. This discrepancy in decrease and increase in costs is due to the distribution of cases over the five pathways. In 2019, the incident cases (and burden of disease and costs) of norovirus, rotavirus and Cryptosporidium spp. decreased, resulted in less cases in the five pathways. Furthermore, the incident cases of Campylobacter spp. increased in 2019, but this mainly attributed to the food pathway. In other words, the cases in the food pathway increased and in the other four pathways decreased.
The slight change of overall burden and overall costs falls within the range of natural fluctuations observed in disease incidence.
A limitation is that for some of the pathogens, a stable incidence has been assumed due to lack of surveillance data, which may not
accurately reflect the current incidence. For example, for T. gondii there is no trend information. However, we aim to update the incidence estimates of T.gondii in the coming year since serological results of the PIENTER3 will become available. Besides the assumed stable incidence of T.gondii, there are some more assumptions made for this infectious disease. Firstly, it is uncertain how many congenitally infected children actually experience or develop long-term complication due to this parasite. The actual percentage of infected children that later in life experience problems, and the severity of these complications are
uncertain. Secondly, the number of acquired infections with Toxoplasma is uncertain. The
(sero-)incidence is based on seroprevalence in the population and this may overestimate the actual occurrence of symptoms due to acquired infections. Updating the incidence of symptoms due to congenitally or acquired infections of Toxoplasma requires a new study or (active) surveillance with (long) follow-up time.
Additionally, based on our surveillance data, we estimated the number of incident cases in the general population and visiting the GP using multiplication factors mostly from studies (i.e. SENSOR study)
conducted in the late 90s. However, as these might not reflect the current situation they should be updated, requiring a new study. We also aim to update some disease models using insights from literature, e.g. the addition of long-term complications of
Cryptosporidium spp. and Giardia spp. infections, and extrahepatic symptoms of hepatitis E. Furthermore, updating the source attribution on the fraction of human Campylobacter and Salmonella cases that is attributed to the five different major pathways (i.e. food, environment, etc.) is another recommendation for further research.
4
References
1. Havelaar, A.H., et al., Disease burden of foodborne pathogens in the Netherlands, 2009. Int J Food Microbiol, 2012. 156(3): p. 231-8. 2. Mangen, M.J.J., Disease burden of food-related pathogens in the
Netherlands, 2015, in RIVM Letter report 2017-0060. 2017, National Institute for Public Health and the Environment: Bilthoven. p. 42. 3. Mangen, M.J.J., Disease burden of food-related pathogens in the
Netherlands, 2017, in RIVM Letter report 2018-0037. 2018, National Institute for Public Health and the Environment: Bilthoven. p. 52. 4. Pijnacker, R., Disease burden of food-related pathogens in the
Netherlands, 2018, in RIVM Letter report 2019-0086. 2019, National Institute for Public Health and the Environment: Bilthoven. p. 50. 5. Mangen, M.J.J., Disease burden of food-related pathogens in the
Netherlands, 2016, in RIVM Letter report 2017-0097 2017, National Institute for Public Health and the Environment: Bilthoven. p. 58. 6. Borgen, K., et al., Non-travel related Hepatitis E virus genotype 3
infections in the Netherlands; a case series 2004 - 2006. BMC Infect Dis, 2008. 8: p. 61.
7. Havelaar, A.H., et al., Attribution of foodborne pathogens using structured expert elicitation. Foodborne Pathog Dis, 2008. 5(5): p. 649-59.
5
Annex: Detailed results
Table A.1 Trends in incidence per 100,000 inhabitants and reported cases, respectively, of food-related pathogens, 1999-2019
Year Caa Saa Crypa RVa NVa aLmb aLm fatal b pLm b pLm
fatal b O157 b O157 hosp b HAV b HAV hosp b HEV a 1999 39 21 19 14 32 2000 42 20 16 13 43 2001 44 20 18 11 41 2002 41 15 17 12 49 2003 33 21 18 13 57 2004 40 16 15 13 37 2005 44 13 21 16 85 15 6 53 2006 40 16 26 17 59 17 5 1 40 258 39 2007 41 12 20 15 60 12 6 1 83 168 27 2008 39 16 27 18 51 6 1 1 45 183 35 2009 44 12 31 18 76 4 3 1 57 21 176 29 2010 50 14 35 23 73 13 4 1 51 21 262 52 0.8 2011 51 12 24 21 79 4 9 1 65 18 d 125 25 0.9 2012 49 21 20 26 c 71 8 6 0 85 31 e 121 28 1 2013 48 9 6 23 26 c 76 7 3 0 90 36 f 109 30 0.9 2014 48 9 6 9 25 c 92 9 4 2 79 31 g 105 23 2 2015 43 9 10 20 27 c 69 15 3 1 76 27 h 80 23 3 2016 38 11 12 10 33 c 89 8 7 4 64 21 i 81 22 3 2017 33 9 8 16 23 c 112 10 3 2 58 23 374k 90m 2 2018 35 9 10 17 27 c 71 4 7 2 59 23 j 188l 57n 2 2019 35 9 8 16 25 113 16 4 0 35 13 166 1350 2
Used abbreviations: Ca: Campylobacter spp. ; Sa: Salmonella spp.; Cryp: Cryptosporidium spp.; RV: rotavirus; NV: norovirus; aLm: acquired
listeriosis; pLm: perinatal listeriosis: O157: STEC o157; HAV: hepatitis A virus; hosp: hospitalized; HEV: hepatitis E virus.
Notes: a).per 100,000 inhabitants whereby presented numbers are rounded: ≥10 to two significant numbers (e.g. 12.5 = 12) and <10 to 1 significant
number (e.g. 0.89=0.9); b) reported cases; c) estimated norovirus-associated hospitalized cases derived from RIVM laboratory surveillance data and therefore not directly comparable to numbers from before 2012; d) known for 57/65 cases; e) known for 77/85 cases; f) known for 84/90 cases; g) known for 71/79 cases; h) known for 68/76 cases; i) known for 60/64 cases; j) known for 58 out of 59 cases; k) ~ 275 cases are (in)directly linked to an international outbreak in men-having sex with men (MSM); l) 65 cases are (in)directly linked to an international outbreak of MSM m) known for 368/374 cases; n) known for 187/188 cases; o) known for 159/166 cases
Table A.2 Mean number of incident cases by pathogen in the Netherlands, 2015-2019
Pathogen Estimated mean number of incident cases/year
2015* 2016 2017 2018 2019 Campylobacter spp. 89,000 79,000 67,000 71,000 73,000 STEC O157 2,100 2,100 2,100 2,100 2,100 Salmonella spp. 27,00 32,000 27,000 27,000 26,000 Listeria monocytogenes 72 96 115 78 120 B. cereus toxin 52,000 52,000 53,000 53,000 53,000 C. perfringens toxin 170,000 171,000 171,000 171,000 173,000 S. aureus toxin 288,000 287,000 287,000 288,000 289,000 Norovirus 615,000 765,000 515,000 615,000 585,000 Rotavirus 261,000 138,000 209,000 224,000 211,000 Hepatitis A virus 390 400 1,800 900 700 Hepatitis E virus 1,900 1,900 1,300 1,300 1,200 Cryptosporidium spp. 92,000 109,000 69,000 91,000 72,000 Giardia spp. 84,000 83,000 83,000 82,000 83,000 Toxoplasma gondii 770 770 770 770 760 Total 1,680,000 1,720,000 1,490,000 1,630,000 1,570,000
Presented numbers are rounded: ≥ 100,000 to three significant numbers (e.g. 123,256 = 123,000); between <100,000 and ≥10 to two significant numbers (e.g. 1,325 = 1,300) and <10 to 1 significant number (e.g. 0.0023=0.002). The presented numbers are estimates that rely on annual surveillance data being corrected for: i) coverage (where applicable); ii) underdiagnosis and underreporting; and iii) under-ascertainment (i.e. being sick without requiring medical help). There is one exception, Listeria monocytogenes which are acquired through surveillance.
* Since the 2017-update new incidence estimates for hepatitis E virus, Cryptosporidium spp. and Giardia spp. are used, therefore estimates presented here for 2015 are different from the one presented in earlier publications (i.e. [2]).
Table A.3 Mean number of fatal cases by pathogen in the Netherlands, 2015-2019
Pathogen Estimated mean number of fatal cases/year
2015* 2016 2017 2018 2019 Campylobacter spp. 65 57 49 47 53 STEC O157 4 4 4 4 4 Salmonella spp. 28 32 34 25 24 Listeria monocytogenes 16 12 12 6 16 B. cereus toxin 0 0 0 0 0 C. perfringens toxin 5 5 5 5 5 S. aureus toxin 7 7 7 7 7 Norovirus 65 82 56 69 66 Rotavirus 43 23 35 38 36 Hepatitis A virus 1 1 6 3 3 Hepatitis E virus 22 21 15 15 13 Cryptosporidium spp. 6 7 4 6 4 Giardia spp. 2 2 2 2 2 Toxoplasma gondii 12 12 12 12 12 Total 280 270 240 238 245
Presented numbers are rounded: ≥ 100,000 to three significant numbers (e.g. 123,256 = 123,000); between <100,000 and ≥10 to two significant numbers (e.g. 1,325 = 1,300) and <10 to 1 significant number (e.g. 0.0023=0.002). The presented numbers are estimates that rely on annual surveillance data being corrected for: i) coverage (where applicable); ii) underdiagnosis and underreporting; and iii) under-ascertainment (i.e. being sick without requiring medical help). There is one exception, Listeria monocytogenes which are acquired through surveillance.
* Since the 2017-update new incidence estimates for hepatitis E virus, Cryptosporidium spp. and Giardia spp. are used, therefore estimates presented here for 2015 are different from the one presented in earlier publications (i.e. [2]).
Table A.4 Mean estimated disease burden (undiscounted DALY/year) in the Netherlands for the years 2015- 2019, total and by pathogen Pathogen DALY(undiscounted)/year 2015* 2016 2017 2018 2019 Campylobacter spp. 4,000 3,600 3,100 3,200 3,300 STEC O157 150 150 150 150 150 Salmonella spp. 1,200 1,400 1,200 1,100 1,100 Listeria monocytogenes 240 450 280 260 180 B. cereus toxin 32 32 32 32 33 C. perfringens toxin 200 200 200 200 200 S. aureus toxin 220 220 220 220 220 Norovirus 1,800 2,200 1,600 1,900 1,800 Rotavirus 1,300 670 1,100 1,200 1,100 Hepatitis A virus 43 44 200 100 90 Hepatitis E virus 740 740 510 510 460 Cryptosporidium spp. 160 190 120 160 120 Giardia spp. 220 220 220 220 220 Toxoplasma gondii 1,900 1,900 1,900 1,900 1,900 Total 12,000 12,000 11,000 11,000 11,000
Presented numbers are rounded: ≥ 100,000 to three significant numbers (e.g. 123,256 = 123,000); between <100,000 and ≥10 to two significant numbers (e.g. 1,325 = 1,300) and <10 to 1 significant number (e.g. 0.0023=0.002). The presented numbers are estimates that rely on annual surveillance data being corrected for: i) coverage (where applicable); ii) underdiagnosis and underreporting; and iii) under-ascertainment (i.e. being sick without requiring medical help). There is one exception, Listeria monocytogenes which are acquired through surveillance.
* Since the 2017-update new incidence estimates for hepatitis E virus, Cryptosporidium spp. and Giardia spp. are used, therefore estimates presented here for 2015 are different from the one presented in earlier publications (i.e. [2]).
Table A.5 Mean discounted COI (4%) in million euros in the Netherlands for 2015-2019, total and by pathogen
Pathogen COI per year (4%)/year
(Million €, expressed in 2019 euros)
2015* 2016 2017 2018 2019 Campylobacter spp. 72 65 56 60 62 STEC O157 6 6 6 6 6 Salmonella spp. 20 22 20 19 19 Listeria monocytogenes 3 3 3 3 4 B. cereus toxin 11 11 11 11 12 C. perfringens toxin 29 29 29 29 30 S. aureus toxin 61 61 61 61 63 Norovirus 109 134 92 109 106 Rotavirus 74 45 62 66 64 Hepatitis A virus 0.6 0.6 3 1 1 Hepatitis E virus 9 9 6 6 5 Cryptosporidium spp. 23 26 17 22 19 Giardia spp. 16 16 16 16 17 Toxoplasma gondii 15 15 15 15 15 Total 447 443 397 426 423
COI per year are presented in million € (M€) and if less than 1 million rounded to 1 significant number (e.g. 0.0023 million =0.002). The presented numbers are estimates that rely on annual surveillance data being corrected for: i) coverage (where applicable); ii) underdiagnosis and underreporting; and iii) under-ascertainment (i.e. being sick without requiring medical help).
* Since the 2017-update new incidence estimates for hepatitis E virus, Cryptosporidium spp. and Giardia spp. are used, therefore estimates presented here for 2015 are different from the one presented in earlier publications (i.e. [2]).
Table A.6 Attribution of mean estimated number of incident cases by pathogen to main pathways in the Netherlands, 2019
Main pathway Food Environment Human Animal Travel Total
Campylobacter spp. 31,000 15,000 4,600 14,000 8,800 73,000 STEC O157 850 360 210 430 250 2,100 Salmonella spp. 14,000 3,400 2,400 2,400 3,700 26,000 Listeria monocytogenes 81 8 6 6 16 120 B. cereus toxin 48,000 590 640 590 3,900 53,000 C. perfringens toxin 157,000 3,800 3,600 3,600 5,500 173,000 S. aureus toxin 252,000 10,000 9,000 6,300 11,000 289,000 Norovirus 98,000 83,000 324,000 29,000 51,000 585,000 Rotavirus 27,000 36,000 122,000 6,300 19,000 211,000 Hepatitis A virus 75 73 100 0 390 700 Hepatitis E virus 160 290 88 120 490 1,200 Cryptosporidium spp. 8,600 20,000 20,000 9,700 14,000 72,000 Giardia spp. 11,000 20,000 29,000 8,900 15,000 83,000 Toxoplasma gondii 430 280 7 19 35 760 Total 647,000 193,000 516,000 82,000 133,000 1,570,000
Presented numbers are rounded: ≥ 100,000 to three significant numbers (e.g. 123,256 = 123,000); between <100,000 and ≥10 to two significant numbers (e.g. 1,325 = 1,300) and <10 to 1 significant number (e.g. 0.0023=0.002). The presented numbers are estimates that rely on annual surveillance data being corrected for: i) coverage (where applicable); ii) underdiagnosis and underreporting; and iii) under-ascertainment (i.e. being sick without requiring medical help).
Table A.7 Attribution of mean estimated number of fatal cases to main pathways in the Netherlands, 2019
Main pathway Food Environment Human Animal Travel Total
Campylobacter spp. 22 11 3 10 6 53 STEC O157 2 0.7 0.4 0.8 0.5 4.0 Salmonella spp. 13 3 2 2 3 24 Listeria monocytogenes 11 1.1 0.8 0.9 2 16 B. cereus toxin 0 0 0 0 0 0.0 C. perfringens toxin 4 0.1 0.1 0.1 0.1 4.7 S. aureus toxin 6 0.3 0.2 0.2 0.3 7.2 Norovirus 11 9 36 3 6 66 Rotavirus 5 6 21 1 3 36 Hepatitis A virus 0.2 0.2 0.9 0.0 1.2 2.6 Hepatitis E virus 2 3 1 1 6 13 Cryptosporidium spp. 0.5 1 1 0.6 0.9 4.4 Giardia spp. 0.3 0.5 0.8 0.2 0.4 2.3 Toxoplasma gondii 7 4 0.1 0.3 0.5 12 Total 84 41 68 21 31 245
Presented numbers are rounded: ≥10 to two significant numbers (e.g. 1,325 = 1,300) and <10 to 1 significant number
(e.g. 0.0023=0.002). The presented numbers are estimates that rely on annual surveillance data being corrected for: i) coverage (where applicable); ii) underdiagnosis and underreporting; and iii) under-ascertainment (i.e. being sick without requiring medical help).
Table A.8 Attribution of mean disease burden (DALY per year, undiscounted) to main pathways in the Netherlands, 2019
Main pathway Food Environment Human Animal Travel Total
Campylobacter spp. 1,400 680 210 630 400 3,300 STEC O157 61 26 15 31 18 150 Salmonella spp. 600 140 100 100 160 1,100 Listeria monocytogenes 130 12 10 10 24 180 B. cereus toxin 29 0 0 0 2 33 C. perfringens toxin 180 4 4 4 6 200 S. aureus toxin 190 8 7 5 8 220 Norovirus 310 260 1,020 92 160 1,800 Rotavirus 150 190 650 33 99 1,100 Hepatitis A virus 8 8 30 0 43 90 Hepatitis E virus 63 110 35 49 200 460 Cryptosporidium spp. 15 34 34 17 24 120 Giardia spp. 29 53 76 24 39 220 Toxoplasma gondii 1,000 680 17 47 86 1,900 Total 4,200 2,200 2,200 1,000 1,300 11,000
Presented numbers are rounded: ≥10 to two significant numbers (e.g. 1,325 = 1,300) and <10 to 1 significant number (e.g. 0.0023=0.002). The presented numbers are estimates that rely on annual surveillance data being corrected for: i) coverage (where applicable); ii) underdiagnosis and underreporting; and iii) under-ascertainment (i.e. being sick without requiring medical help).
Table A.9 Attribution of mean cost-of-illness (M€ per year, discounted at 4% and in 2019 euros) to main pathways in the Netherlands, 2019
Main pathway Food Environment Human Animal Travel Total
Campylobacter spp. 26 13 4 12 7 62 STEC O157 2 1 0.6 1 0.7 6 Salmonella spp. 11 3 2 2 3 19 Listeria monocytogenes 3 0.3 0.2 0.2 0.6 4 B. cereus toxin 10 0.1 0.1 0.1 0.8 12 C. perfringens toxin 27 0.7 0.6 0.6 1.0 30 S. aureus toxin 55 2 2 1 2 63 Norovirus 18 15 59 5 9 106 Rotavirus 8 11 37 2 6 64 Hepatitis A virus 0.1 0.1 1 0.0 0.6 1 Hepatitis E virus 0.0 1 0.4 0.6 2 5 Cryptosporidium spp. 2 5 5 3 4 19 Giardia spp. 2 4 6 2 3 17 Toxoplasma gondii 9 6 0.1 0.4 0.7 15 Total 174 62 117 30 41 423
COI per year are presented in million € (M€) and if less than 1 million rounded to 1 significant number (e.g. 0.0023 million =0.002). The presented numbers are estimates that rely on annual surveillance data being corrected for: i) coverage (where applicable); ii) underdiagnosis and underreporting; and iii) under-ascertainment (i.e. being sick without requiring medical help).
Table A.10 Attribution of mean incidence by pathogen to food groups in the Netherlands, 2019
Food groups Beef &
Lamb Pork Poultry Eggs Dairy shellfish Fish& Produce Beverages Grains Other foods Humans & animals Total Campylobacter spp. 1,300 1,600 17,000 950 2,700 2,100 1,600 520 710 1,010 1,600 31,000 STEC O157 370 54 26 18 63 25 60 31 25 30 140 850 Salmonella spp. 1,800 2,000 2,100 3,100 930 580 890 440 610 850 810 14,000 Listeria monocytogenes 9 8 5 3 20 14 6 2 5 5 4 81 B. cereus toxin 3,400 1,700 760 1,700 2,700 950 950 800 8,000 25,000 1,100 47,000 C. perfringens toxin 75,000 13,000 11,000 4,400 6,400 10,000 11,000 3,900 4,100 12,000 5,600 156,000 S. aureus toxin 19,000 20,000 20,000 8,300 37,000 15,000 5,000 4,500 19,000 74,000 30,000 251,000 Norovirus 3,100 3,000 2,800 1,800 1,900 15,000 7,100 3,000 5,100 4,900 49,000 97,000 Rotavirus 0 770 0 0 470 5,300 6,500 1,200 2,100 1,200 9,800 27,000 Hepatitis A virus 0 0 0 0 0 12 12 4 4 3 58 93 Hepatitis E virus 0 10 0 0 0 0 1 0 0 0 1 10 Cryptosporidium spp. 2,300 380 250 230 790 1,800 1,900 260 0 260 530 8,600 Giardia spp. 2,100 520 330 0 830 1,400 3,600 350 0 360 1,300 11,000 Toxoplasma gondii 98 210 21 0 20 16 25 0 0 10 24 430 Total 108,000 44,000 54,000 21,000 54,000 52,000 38,000 15,000 39,000 121,000 101,000 647,000
Presented numbers are rounded: ≥ 100,000 to three significant numbers (e.g. 123,256 = 123,000); between <100,000 and ≥10 to two significant numbers (e.g. 1,325 = 1,300) and <10 to 1 significant number (e.g. 0.0023=0.002). The presented numbers are estimates that rely on annual surveillance data being corrected for: i) coverage (where applicable); ii) underdiagnosis and underreporting; and iii) under-ascertainment (i.e. being sick without requiring medical help).
Table A.11 Attribution of mean number of fatal cases by pathogen to food groups in the Netherlands, 2019
Food groups Beef&
lamb Pork Poultry Eggs Dairy shellfish Fish& Produce Beverages Grains Other foods Humans& animals Total
Campylobacter spp. 0.9 1 12 0.7 2 2 1 0.4 0.5 0.7 1 22 STEC O157 0.7 0.1 0.1 0.0 0.1 0.0 0.1 0.1 0.0 0.1 0.3 1.6 Salmonella spp. 2 2 2 3 1 0.5 1 0.4 0.6 1 1 13 Listeria monocytogenes 1.2 1.0 0.7 0.4 3 2 0.8 0.3 0.7 0.6 0.5 11 B. cereus toxin 0.0 0.0 0.0 0.0 0.0 0.0 0.0 0.0 0.0 0.0 0.0 0.0 C. perfringens toxin 2 0.3 0.3 0.1 0.2 0.3 0.3 0.1 0.1 0.3 0.1 4.2 S. aureus toxin 0.5 0.5 0.5 0.2 0.9 0.4 0.1 0.1 0.5 2 0.7 6.2 Norovirus 0.4 0.3 0.3 0.2 0.2 2 0.8 0.3 0.6 0.5 6 11 Rotavirus 0.0 0.1 0.0 0.0 0.1 0.9 1 0.2 0.4 0.2 2 4.7 Hepatitis A virus 0.0 0.0 0.0 0.0 0.0 0.0 0.0 0.0 0.0 0.0 0.2 0.3 Hepatitis E virus 0.0 1.4 0.0 0.0 0.0 0.1 0.1 0.1 0.0 0.0 0.2 1.8 Cryptosporidium spp. 0.1 0.0 0.0 0.0 0.0 0.1 0.1 0.0 0.0 0.0 0.0 0.5 Giardia spp. 0.1 0.0 0.0 0.0 0.0 0.0 0.1 0.0 0.0 0.0 0.0 0.3 Toxoplasma gondii 2 3 0.3 0.0 0.3 0.2 0.4 0.0 0.0 0.2 0.4 6.6 Total 9 10 16 5 7 8 6 2 3 5 12 84
Presented numbers are rounded: ≥10 to two significant numbers (e.g. 1,325 = 1,300) and <10 to 1 significant number (e.g. 0.0023=0.002). The presented numbers are estimates that rely on annual surveillance data being corrected for: i) coverage (where applicable); ii) underdiagnosis and underreporting; and iii) under-ascertainment (i.e. being sick without requiring medical help).