Speech Intelligibility
Knowledge Base Building Physics, Module A11
Based on the lecture notes ct4220 Building Physics II, TU Delft, Faculty of Civil Engineering and Geosciences, put together by prof.ir. J.J.M. Cauberg and translated and improved by dr.ir. M.J. Tenpierik
1. Introduction
For someone in an auditorium listening to a speaker, it is of the utmost importance that the speech is clearly and easily heard and understood. Besides, it is desirable that the listener perceives the sound as coming from the position where the speaker is. Speech intelligibility depends on the speaker (vocal effort and articulation), the listener (ear sensitivity) and the transmission channel, i.e. the room (reverberation and background noise).
Speech intelligibility in fact is defined as the percentage spoken words that are understood correctly by the listener. For speech intelligibility tests typically so-called logatoms are used as ‘words’. These are one-syllable combinations of vowels sandwiched between a consonant on either side, not necessarily being existing words (for instance duk, zwat, keeg). When putting together logatoms lists, the frequency with which sounds occur in normal language is often considered; the lists are phonetically balanced.
During tests with a listener panel the logatoms are embedded in carrier sentences, for example: “first you hear ‘duk’, then I say ‘zwat’, followed by ‘keeg’”. If the results of these kinds of listener tests are averaged over a number of ‘normal’ speakers and listeners, we obtain the speech
intelligibility for a certain speaker and listener position in a certain room. By repeating these tests at different positions inside a room the speech intelligibility of that room can be mapped.
2. Speech Transmission Index (STI)
The procedure with listener panels is very laborious and time-consuming. Therefore, many researchers, also in the Netherlands, have tried to define physical parameters that measure speech intelligibility. Houtgast and Steeneken introduced the ‘Speech Transmission Index’ (STI) based on the analogy between running speech and intensity-modulated noise.
The starting point for determining STI is a special test signal: noise of which the intensity is modulated with a cosine function. The intensity of this signal can be written as
ሺ ሻ i 1 cos 2 i I t I Ft (1), in which iI is the time-averaged intensity [W/m2]
F is the modulation frequency [Hz]
If the noise spectrum is weighted in a certain way and if the modulation frequency is chosen between 0 and 20 Hz, this test signal is representative for running speech because the syllables in running speech follow each other with a similar frequency. When this signal progresses through a room with reflections, reverberation and background noise, the modulation depth of the intensity decreases; at a receiver position, the intensity of the received signal can then be written as
0 0ሺ ሻ 1 cos 2 I t I m F t (2), in whichm is the resulting modulation depth
is the phase shift in the modulation frequency domain [rad].
m depends on F; the curve that relates m to F is known as the Modulation Transfer Function, MTF.
Houtgast and Steeneken used the MTF as a basis for the Speech Transmission Index (STI) which was found to show a strong correlation with speech intelligibility in a room. In order to determine
STI, this MTF needs to be determined for the different frequency bands of the speech spectrum
(125 Hz to 8000 Hz). From that we obtain the modulation depth, m(F), for these 7 octave bands in combination with 14 modulation frequencies F (from 0.63 Hz to 12.5 Hz) resulting in 98 different
m(F) values1. m(F) is calculated from
2 0.1 1 1 ሺ ሻ 2 1 10 1 13.8 S N m F FT (3), with
T the reverberation time [s]
S/N the signal-to-noise ratio [dB].
As can be seen from this equation, m(F) is influenced by two acoustical aspects of a room: reverberation (first part of the equation) and background noise (second part of the equation). The signal-to-noise ratio is the difference between the signal level and the noise level near the receiver. If the noise is as loud as the signal, S/N equals zero and the second part of equation (3) becomes 0.5.
The next step is to translate these m(F) values into an apparent signal-to-noise ratio, S/Napp,F [dB]
, ሺ ሻ 10log 1 ሺ ሻ app F S m F N m F (4).
Because of the dynamic range of the human voice, these values are maximised (and minimised) to values between +15 dB and -15 dB; and subsequently averaged over the considered modulation frequencies
12.5 0.63 , 1 14 app app F S S N N (5).1 RaSTI, or Rapid Speech Transmission Index, is a simplified version of STI. Instead of 7 octaves, only the
two octaves 500 and 2000 Hz are considered. For the 500 Hz octave band 4 modulation frequencies are considered: 1, 2, 4 and 8 Hz; for the 2000 Hz octave band 5 modulation frequencies are considered: 0.7, 1.4, 2.8, 5.6 and 11.2 Hz. Instead of 98 m(F) values, RaSTI only uses 9 m(F) values.
For each octave band, we now have an averaged apparent signal-to-noise ratio which is used for calculating a speech intelligibility index per octave by scaling this value such that it lies between 0 and 1. This octave-based index is called the Modulation Transfer Index MTI:
15 30 app f S N MTI (6).
Because not every frequency contributes equally to speech intelligibility, these MTI values need to be summed with weight factors in order to obtain a single-number value. This single-number value is called the Speech Transmission Index STI.
8000
125 f f
STI w MTI (7),
with
wf the weight factor for each octave band (table 1).
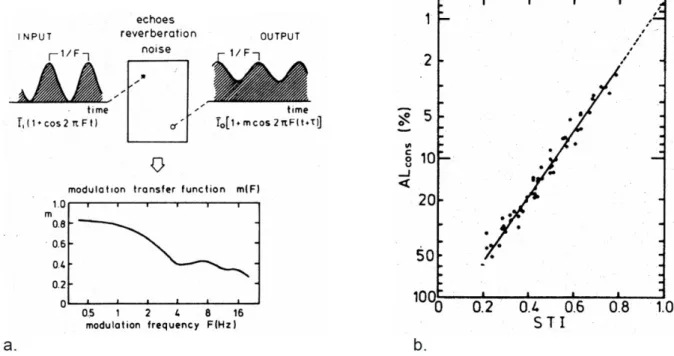
Figure 1a illustrates the whole procedure, while figure 1b shows how STI corresponds with ‘PB-word score’ which is the percentage of nonsense syllables correctly heard by test subjects considering the frequency with which certain letters occur in our language (PB, Phonetically Balanced).
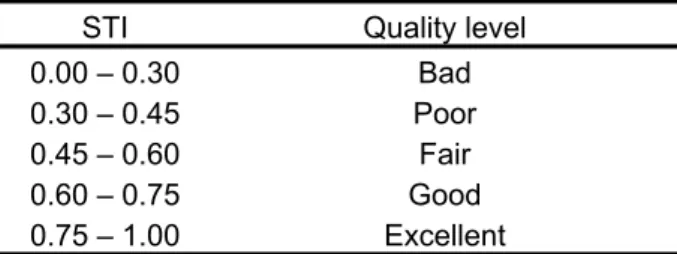
Table 2 finally shows how STI values correspond to the quality of speech intelligibility. For good speech intelligibility STI should be higher than 0.60.
Table 1: Weight factors for determining STI. Table 2: Quality levels for speech intelligibility
Octave band [Hz] wf STI Quality level
125 0.129 0.00 – 0.30 Bad 250 0.143 0.30 – 0.45 Poor 500 0.114 0.45 – 0.60 Fair 1000 0.114 0.60 – 0.75 Good 2000 0.186 0.75 – 1.00 Excellent 4000 0.171 8000 0.143
3. Articulation Loss of Consonants (ALcons)
Another method was developed by Peutz and Klein [1]. They proposed the Articulation Loss of Consonants (ALcons) as a measure for speech intelligibility. This is the percentage of consonants in
phonetically balanced vowel-consonant-vowel words embedded in carrier sentences that is misunderstood. For a more-or-less noise-free speech signal, ALcons depends on the reverberation
time T and the reverberation-to-direct ratio:
0.73 2 2 / cons g T AL r r for r ≤ 3.5 rg (8a), 9 cons AL T for r > 3.5 rg (8b), in which
T is the reverberation time [s]
r is the distance between speaker and listener [m]
rg is the reverberation radius [m].
Higher values of ALcons mean lower speech intelligibility. For listener positions far in the reverberant
field, where the distance towards the source is more than 3.5 times the reverberation radius, ALcons
increases directly proportional to reverberation time; speech intelligibility thus reduces if the reverberation time increases. For distances where also the direct sound plays a role, i.e. for distances shorter than 3.5 times the reverberation radius, ALcons is inversely proportional to the
reverberation-to-direct ratio; the speech intelligibility thus increases for decreasing distance between speaker and listener. Table 3 provides quality levels for ALcons concerning speech
intelligibility.
Table 3: Quality levels for speech intelligibility
ALcons Quality level
around 15% People start to complain about the speech intelligibility unless the information being conveyed is very simple.
between 10% and 15% If the speaker is not articulating very well or if the listener has difficulties with hearing, complaints may arise in case of difficult messages.
less than 10% Good speech intelligibility.
4. Speech Interference Level (SIL)
Not only speech intelligibility but also speech privacy, i.e. creating an acoustic environment in which the content of a conversation remains private, can be goal of room acoustical measures. Such privacy measures can be important in large open offices or for a counter in a reception hall. A measure for the intelligibility of a conversation in an acoustical environment is the Speech Interference Level (SIL). The difference with STI and ALcons is that in case of SIL the sound level is
not caused by the speaker but by other disturbing sources. SIL is therefore a measure of the influence of background noise on speech intelligibility. For determining SIL the average of the background noise level in the 500, 1000, 2000 and 4000 Hz octave bands is used. Background noise levels with the same SIL are considered to have the same effect on speech intelligibility. SIL can be used to determine the maximum allowable distance between speaker and listener (face-to-face communication) for acceptable speech intelligibility. Table 4 provides an overview of maximum allowable SIL values of the background noise for good speech intelligibility. In general, in case of a female speaker, these SIL values can be reduced with 5 dB.
Table 4: Maximum allowable SIL values [dB] of background noise for obtaining good speech intelligibility
Distance between speaker and listener [m]
voice level
normal raised loud very loud
0.3 65 71 77 83 0.9 55 61 67 73 1.5 51 57 63 69 1.8 49 55 61 67 3.7 43 49 55 61
5. Articulation Index (AI)
The SIL method only limitedly considers the frequency spectrum of the background noise; for the
SIL value is the average value of 4 octave bands. For speech the octaves 2000 and 4000 Hz are
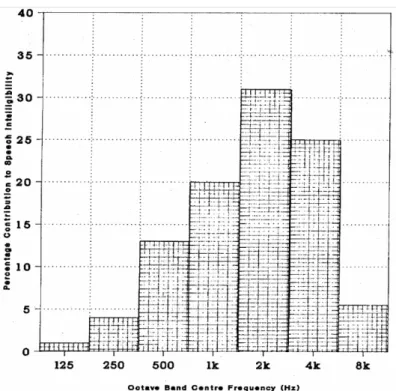
the most important as can be seen from Figure 2 that shows per octave band the percentage contribution of a speech signal to the speech intelligibility. The Articulation Index (AI) considers this by taking the signal-to-noise ratio per third octave band as starting point. This method was already normalised in 1969 (ANSI 53.5).
The signal-to-noise ratio of the speech signal and the background noise is determined and then weighed for each of the 20 relevant third octave bands (from 200 Hz to 5000 Hz); table 5 presents an overview of these weight factors. The sum of these weighted signal-to-noise ratios is the articulation index
5000
; ; ; ; 200 f p signal f p noise f AI w L L (9), withLp;signal the signal level [dB]
Lp;noise the noise level [dB]
The articulation index varies between 0 and 1 meaning there is 0% respectively 100% speech intelligibility. The relation between AI and speech intelligibility is given in Figure 3 and global quality levels in Table 6. Of secondary importance to AI is the type of information that is conveyed, the speed of speech , etc.
Figure 2: contribution of each octave band to the speech intelligibility.
Table 5: Maximum allowable SIL values [dB] of background noise for obtaining good speech intelligibility
1/3 octave band [Hz] wf 1/3 octave band [Hz] wf
200 0.0004 1250 0.0030 250 0.0010 1600 0.0037 315 0.0010 2000 0.0037 400 0.0014 2500 0.0034 500 0.0014 3150 0.0034 630 0.0020 4000 0.0024 800 0.0020 5000 0.0020 1000 0.0024
Table 6: Quality levels for speech intelligibility
AI Quality level 0.0 - 0.2 Unacceptable 0.2 - 0.3 Marginal 0.3 - 0.4 Acceptable 0.4 - 0.5 Good 0.5 - 0.6 Very good 0.6 - 0.7 Excellent
Figure 3: relation between articulation index, communication and speech privacy
6. General remarks on speech intelligibility
Speech intelligibility strongly depends on reverberation time, reverberation radius and signal-to-noise ratio. In general one can say that for good speech intelligibility a strong direct sound field is required, if possible, augmented with several early reflection (first 15 ms; at least well before 50 ms); strong here refers to the amount of energy compared to late reflections and reverberation. Additionally, a low background noise level should ensure a high enough signal-to-noise ratio; in auditoriums it is often required that the background noise level is less than 25 dB(A). Moreover, echo’s, i.e. strong late reflections that are clearly visible in the impulse-response of the room and are clearly audible as a repetition of the direct sound pulse, are disastrous for speech intelligibility and should be avoided.
Optimal transfer of the direct sound is ensured if good lines of sight between speaker and listener exist: good sight is a prerequisite for good hearing! For speech intelligibility as well as for the perception of music it is therefore favourable to arrange the seats in a room rising from the stage (tribune, amphitheatre) as the Greeks and Romans already did in their open-air theatres.
Sound bouncers behind or above the speaker, like above pulpits in a church, generate early reflections which are by the listener’s hearing mechanism integrated with the direct sound and perceived as an amplification of this direct sound. They thus positively contribute to the direct-to-reverberation ratio. Early reflections can also be generated electronically.
Further increase of the direct-to-reverberation ratio is achieved by reducing the reverberation time of the room by both keeping the dimensions of the room, especially its height, limited and by adding additional sound absorption to walls and ceiling. Because of the openness of the mentioned classical theatres, reverberation is completely absent. Particularly if a ‘sound bouncing wall’
provides early reflections and if the background noise level is low, speech intelligibility in these theatres is very good, even so good that no electronic amplification is required.
From this discussion, one could conclude that in an auditorium reverberation is only negative for speech intelligibility. For the speech intelligibility of the listener this is indeed the case; however, for the speaker it is not. For the speaker it is important that his/her words are reflected in the room. Otherwise he or she unconsciously but mistakenly gets the impression that his/her words are not heard by the audience; he/she starts speaking louder starts overstretching his/her voice. For an auditorium, therefore, a reverberation time of between 0.5 to 1.0 s is recommended.
7. References
[1] Peutz and Klein, “Spraakverstaanbaarheid onder gecombineerde invloed van ruis, nagalm en echo, NAG-publication 28.
![Table 4: Maximum allowable SIL values [dB] of background noise for obtaining good speech intelligibility Distance between](https://thumb-eu.123doks.com/thumbv2/5doknet/3008775.6301/5.892.129.790.513.661/table-maximum-allowable-values-background-obtaining-intelligibility-distance.webp)