3
Global emissions trends and
G20 status and outlook
Lead authors:
Takeshi Kuramochi (NewClimate Institute, Germany), Michel den Elzen (PBL Netherlands Environmental Assessment Agency, the Netherlands) and Glen P. Peters (Center for International Climate Research – CICERO, Norway)
Contributing authors:
Caitlin Bergh (University of Cape Town, South Africa), Monica Crippa (Joint Research Centre/European Commission, European Union (EU)), Andreas Geiges (Climate Analytics, Germany), Catrina Godinho (HUMBOLDT-VIADRINA Governance Platform, Germany), Sofia Gonzales-Zuñiga (NewClimate Institute, Germany), Ursula Fuentes Hutfilter (Climate Analytics, Germany), Kimon Keramidas (Joint Research Centre/European Commission, EU), Yong Gun Kim (Korea Environment Institute, the Republic of Korea), Swithin Lui (NewClimate Institute, Germany), Zhu Liu (Tsinghua University, China), Jos Olivier (PBL Netherlands Environmental Assessment Agency, the Netherlands), Leonardo Nascimento (NewClimate Institute, Germany), Joana Portugal Pereira (Graduate School of Engineering (COPPE), Universidade Federal do Rio de Janeiro, Brazil), Değer Saygin (SHURA, Turkey), Claire Stockwell (Climate Analytics, Germany), Jorge Villareal (Iniciativa Climática de México, Mexico), William Wills (COPPE, Universidade Federal do Rio de Janeiro, Brazil)
2
2.1 Introduction
This chapter assesses the latest trends in greenhouse gas (GHG) emissions and the progress of G20 members towards both the Cancun Pledges for 2020 and nationally determined contributions (NDCs) for 2025 and 2030. Throughout the chapter, the implications of the COVID-19 pandemic on emissions in 2020 and by 2030 are considered.
The chapter is organized as follows: section 2.2 takes stock of the current trends in total global GHG and carbon dioxide (CO2) emissions from fossil fuel use and industry-related
sources. These trends are discussed in the context of global peaking of emissions and general economic trends. Sections 2.3 and 2.4 assess G20 members’ progress, both collectively and individually, towards their Cancun Pledges and NDCs.1 The assessment covers all individual G20
members and regions, including the European Union and its three individual Member States (France, Germany and Italy), as well as the United Kingdom (hereafter EU27+UK) as one member.2 Section 2.5 provides an update of
announced net-zero emissions goals and the implications for short- to medium-term action in the context of new and updated NDCs.
1 Turkey has not ratified the Paris Agreement, so its 2030 target remains an intended nationally determined contribution (INDC). Hereinafter, both INDCs and NDCs are referred to as NDCs, except when specifically referring to Turkey’s INDC.
2 The United Kingdom has left the European Union but is in a transition period until the end of 2020, during which the NDC submitted by the European Union still applies to it.
3 This change was made to be more in line with the decisions made at the twenty-fourth session of the Conference of the Parties (COP 24) in Katowice, where Parties agreed to use GWPs from the IPCC Fifth Assessment Report (AR5) for reporting reasons. However, a full switch to using AR5 GWPs in this report is not yet possible as the literature is still not up to date on this decision.
All GHG emission figures in this report are expressed using the 100-year global warming potentials (GWPs) from the Intergovernmental Panel on Climate Change (IPCC) Fourth Assessment Report (AR4),3 unless otherwise noted.
With regard to historical emissions data, section 2.2 uses globally consistent and independent data sets rather than officially reported United Nations Framework Convention on Climate Change (UNFCCC) inventory reports, whereas sections 2.3 and 2.4 use UNFCCC inventory reports when comparing historical emissions to individual G20 members’ NDC targets. Please see Annex I for more information about the definitions of scenarios, GWPs and land use, land-use change and forestry (LULUCF) accounting used in the chapter.
The methodology and preliminary findings of this chapter were made available to the governments of the countries specifically mentioned to provide them with the opportunity to comment on the findings.
4
2.2 Current global emissions: status and
trends
2.2.1 GHG emissions up to 2019
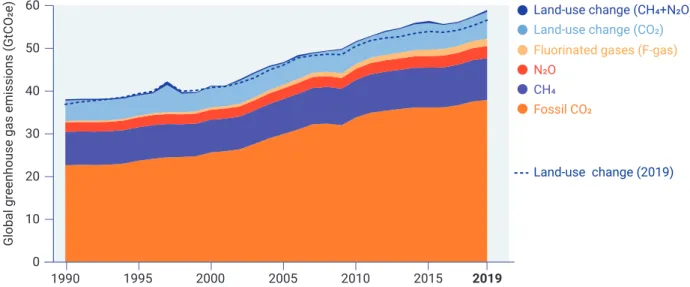
Global trendsGHG emissions grew in 2019 for the third consecutive year, indicating that the slowdown in emissions growth during 2015 and 2016 was short-lived (figure 2.1). Since 2010, GHG emissions (excluding land-use change (LUC)) have grown 1.4 per cent per year on average, with preliminary data suggesting a 1.1 per cent increase in 2019. When including the more uncertain and variable emissions from LUC, global GHG emissions also grew 1.4 per cent per year since 2010 on average, but increased a more rapid 2.6 per cent in 2019
4 Emissions data used in this report are based on analysis from EDGAR (Crippa et al. 2020), PBL (Olivier and Peters 2020, in preparation) and the Global Carbon Project (GCP) for LUC. These data sets are used in order to provide globally consistent and updated emissions estimates, which means that there may be minor differences to officially reported UNFCCC inventory reports. Fossil CO2, CH4 and N2O emissions are based on the methods used in previous Emissions Gap Reports (Olivier and Peters 2019), with updates based on the most recently available data. In this 2020 report, LUC emissions from the GCP are used, which takes the average of two bookkeeping data sets (Hansis, Davis and Pongratz 2015; Houghton and Nassikas 2017). Previous Emissions Gap Reports only used one bookkeeping model (Houghton and Nassikas 2017), which means that total GHG emissions are higher than in previous reports, with LUC emissions exhibiting no significant trend over time. For the first time, this year’s report includes CH4 and N2O emissions from LUC (Olivier, Schure and Peters 2017), though these are small in comparison to LUC CO2 emissions. The report also includes uncertainties with one standard deviation of ±5 per cent for CO2, ±30 per cent for CH4, ±50 per cent for N2O and ±100 per cent for fluorinated gases (Olivier et al. 2017), and 2.6 GtCO2 for LUC (Friedlingstein et al. 2019). The presented uncertainty ranges are consistent with IPCC AR5 (Blanco et al. 2014). GWPs are from the IPCC AR4. All estimates for 2019 emissions should be considered preliminary. Uncertainties are added in quadrature and assumed independent.
5 Fossil CO2 emissions include CO2 emissions from fossil fuels and from carbonates.
6 In this report, CO2 emissions from fossil fuels and industry grew 0.9 per cent in 2019 (Crippa et al. 2020). The updated Global Carbon Budget
estimates that fossil fuel emissions grew 0.1 per cent in 2019 (Friedlingstein et al. in review). Most other estimates do not include process emissions from cement manufacturing. EDGAR estimates that process emissions from cement manufacturing grew 5.1 per cent in 2019, while the GCP estimates 3.3 per cent in 2019. For combustion-related emissions only, BP estimated a 0.5 per cent growth in emissions (BP 2020), with the IEA and GCP both estimating no change (IEA 2020b), which differs to the EDGAR estimate of 0.6 per cent. The differences in these estimates for 2019 (EDGAR and BP versus GCP and IEA) are primarily due to uncertainty in the growth of Chinese coal use in 2019.
due to a significant increase in forest fires, particularly in Asia and the Amazon. GHG emissions4 reached a record
high of 52.4 GtCO2e (range: ±5.2) in 2019 without LUC
emissions and increased by 5.5 GtCO2 (range: ±2.6) when
including the more uncertain LUC, which pushes the total to 59.1 GtCO2e (range: ±5.9) (fi gure 2.1). Land-use emission
estimates used in this report are based on the average of two separate models (leading to higher overall emissions) (Friedlingstein et al. 2019) and included CO2 and nitrous
oxide (N2O) emissions from LUC (Olivier and Peters 2020, in
preparation). If the same data set was used as in previous years (Houghton and Nassikas 2017; blue dotted line in figure 2.1), global 2019 emissions would have been lower at 57.1 GtCO2e or 56.7 GtCO2e if excluding methane (CH4) and
N2O emissions from LUC.
Figure 2.1. Global GHG emissions from all sources
0 10 20 30 40 50 60 2015 2010 2005 1990 1995 2000 2019 Global greenhouse gas emissi ons (GtCO 2e)
Land-use change (CO2) Land-use change (CH4+N2O) Fluorinated gases (F-gas)
N2O
CH4
Fossil CO2
Land-use change (2019)
Note: The dotted line shows the global emissions using a different data set for LUC (Houghton and Nassikas 2017), as in earlier Emissions Gap Reports.
Sources: Crippa et al. (2020); Olivier and Peters (2020, in preparation); Friedlingstein et al. (2019)
Each GHG contributes differently to total GHG emissions (fi gure 2.1 and table 2.1). Fossil CO2 emissions5 account
for most GHG emissions, including LUC, as well as the growth in GHG emissions. Preliminary data suggest that
fossil CO2 emissions reached a record 38.0 GtCO2 (range:
±1.9) in 2019, with some differences among data sets due to uncertainty in Chinese coal use in 2019.6 Fossil CO2 has
5
0.9 per cent in 2019. The growth in fossil CO2 emissionsin 2019 was due to a modest increase in energy use (~1.3 per cent in 2019), offset by favourable weather patterns reducing heating and cooling needs (International Energy Agency [IEA] 2020a). CO2 emissions from LUC significantly
change from year-to-year due to climatic conditions. Over the last decade, CO2 emissions from LUC have had
a downward trend according to Houghton and Nassikas (2017) and upward trend according to Hansis, Davis and Pongratz (2015). The average of these two data sets for the last decade is 5.5 GtCO2 (range: ±2.6, one standard
deviation) and shows little change in trend given the large uncertainties7 (Friedlingstein et al. 2019; Shukla et al.
7 The Houghton and Nassikas (2017) and Hansis, Davis and Pongratz (2015) data sets are both updated for 2019 in Friedlingstein et al. (2019).
2019). In this report, the average of these two data sets are used as there is currently no scientific justification to use one data set over the other. CH4 emissions, the next most
significant GHG, have grown 1.2 per cent per year on average since 2010 and grew 1.3 per cent in 2019. N2O emissions
have grown 1.1 per cent per year on average from 2010 to 2019, while fluorinated gases (sulphur hexafluoride (SF6), hydrofluorocarbons (HFCs) and perfluorochemicals (PFCs)) have grown 4.7 per cent per year on average since 2010 and grew 3.8 per cent in 2019. All GHGs continue to increase in line with trends over the last decade, with only fossil CO2
emissions showing a significant change in trend since the 2000s (2000–2009).
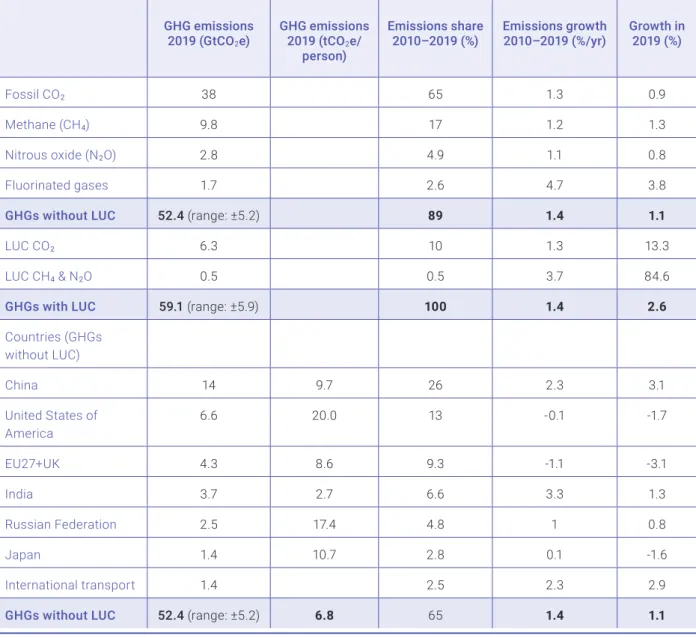
Table 2.1. Key statistics for GHG emissions shares and trends and highest emitting countries and regions GHG emissions 2019 (GtCO2e) GHG emissions 2019 (tCO2e/ person) Emissions share
2010–2019 (%) Emissions growth 2010–2019 (%/yr) Growth in 2019 (%)
Fossil CO2 38 65 1.3 0.9
Methane (CH4) 9.8 17 1.2 1.3
Nitrous oxide (N2O) 2.8 4.9 1.1 0.8
Fluorinated gases 1.7 2.6 4.7 3.8
GHGs without LUC 52.4 (range: ±5.2) 89 1.4 1.1
LUC CO2 6.3 10 1.3 13.3
LUC CH4 & N2O 0.5 0.5 3.7 84.6
GHGs with LUC 59.1 (range: ±5.9) 100 1.4 2.6
Countries (GHGs without LUC) China 14 9.7 26 2.3 3.1 United States of America 6.6 20.0 13 -0.1 -1.7 EU27+UK 4.3 8.6 9.3 -1.1 -3.1 India 3.7 2.7 6.6 3.3 1.3 Russian Federation 2.5 17.4 4.8 1 0.8 Japan 1.4 10.7 2.8 0.1 -1.6 International transport 1.4 2.5 2.3 2.9
6
Regional trends excluding LUC
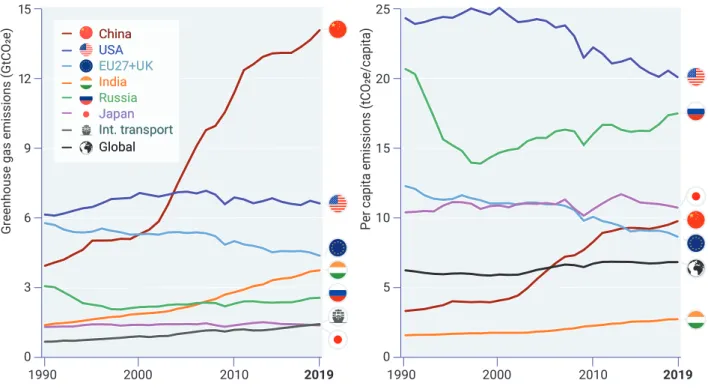
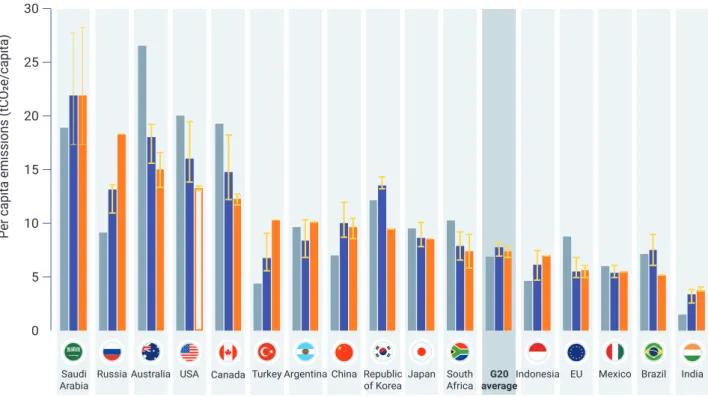
While global emissions data provide important information on collective progress, they mask the dynamics at the country level (fi gure 2.2 – left: absolute; right: per capita). This section focuses on trends excluding LUC emissions, which are discussed later. The top four emitters (China,
United States of America, EU27+UK and India) contributed to 55 per cent of total GHG emissions without LUC over the last decade. The top seven emitters (including the Russian Federation, Japan and international transport) account for 65 per cent, while G20 members account for 78 per cent. Figure 2.2. Absolute GHG emissions of the top six emitters (excluding LUC emissions) and international transport (left)
and per capita emissions of the top six emitters and the global average (right)
2019 1990 2000 2010 1990 2000 2010 2019 0 3 6 9 12 15 0 5 10 15 20 25 China China Russia Russia USA USA Int. transport Int. transport Japan Japan India India EU27+UK EU27+UK Global Global Greenhouse gas emissi ons (GtCO 2e)
Per capita emissions (t
CO
2e/capita)
Source: Crippa et al. (2020)
China emits more than one-quarter of global GHG emissions and has per capita emissions that are around 40 per cent above the global average. Despite rapid growth during the 2000s, the increase in GHG emissions has slowed in China over the last decade. From 2014 to 2016 GHG emissions showed little to no growth due to a reduction in coal use, but started to grow again from 2016. In the last decade, GHG emissions have grown 2.4 per cent on average, growing 3.1 per cent in 2019 to reach a record high 14.0 GtCO2e.
Chinese coal use may have peaked in 2013, but that peak may be crossed given its growth from 2016 onwards. The United States of America emits 13 per cent of global GHG emissions and has per capita emissions that are three times the global average. However, over the last decade, the country’s GHG emissions have been in decline (0.4 per cent per year), decreasing by 1.7 per cent in 2019, which partially offsets the increase of 3.0 per cent in 2018 that was due to greater energy demand in response to an unusually warm summer and cold winter. Changes in the United States of America’s emissions continue to be driven by the shift away from coal towards gas and renewables. The EU27+UK emits 8.6 per cent of global GHG emissions and has per capita emissions that are 25 per cent above the global average. Emissions have steadily declined by 1.5 per cent per year in the last decade, with a steeper decline of 3.0 per cent observed in 2019. Europe had a stronger decline in coal use
in 2019, following the European Union Emissions Trading System’s (EU ETS) higher allowance prices. India emits 7.1 per cent of global emissions and has per capita emissions that are 60 per cent lower than the global average. Emissions grew just 1.4 per cent in 2019, which is much lower than the average of 3.3 per cent per year over the last decade. This slower-than-expected growth was primarily due to increased hydropower from a record monsoon and weaker economic growth, along with the country’s continued growth in renewables. The Russian Federation (4.9 per cent) and Japan (2.7 per cent) are the next largest emitters, followed by international transport (aviation and shipping), which represents around 2.6 per cent of GHG emissions that are growing strongly at a rate of 2.3 per cent per year (fi gure 2.2).
In today’s globalized world there is a weakened connection between where goods and services are purchased (consumed) and where emissions occur. Consumption-based emissions are allocated to countries where goods and services are consumed, which differs to territorial-based emissions, as they exclude national emissions required to produce exported products, instead including emissions from other countries to import products (consumption ~ territorial – exports + imports). Rich countries generally tend to have higher consumption-based emissions (fi gure 2.3),
7
as they have cleaner production, relatively more servicesand more imports of primary and secondary products. In the 2000s, the gap between consumption and production was growing in rich countries but stabilized following the 2007–2008 global financial crisis (Pan et al. 2017). Despite rich countries having greater consumption-based emissions than territorial-based emissions, both have
declined at similar rates in the last decade (Le Quéré et al. 2019). Consumption-based emissions can also be used to allocate emissions to the products purchased (food, clothing, electronic products), and not the sectors emitting (agriculture, electricity, industry). Although consumption-based emissions are more uncertain, they provide additional information to help refine climate policies (see chapter 6). Figure 2.3. Consumption-based CO2 emissions (dotted line) compared with territorial-based CO2 emissions (solid line) for
the top six emitters
2018 1990 1995 2000 2005 2010 2015 0 2 4 6 8 10 2018 1990 1995 2000 2005 2010 2015 0 5 10 15 20 25 China China Russia Russia USA USA Japan Japan India India EU27+UK EU27+UK consumption consumption territorial territorial territorial territorial consumption consumption Carbon dio xide emissi ons (GtCO 2)
Per capita emissions (t
CO
2/capita)
Note: Shading shows the net trade difference for absolute emissions (left) and per capita emissions (right).
Source: Friedlingstein et al. (2019)
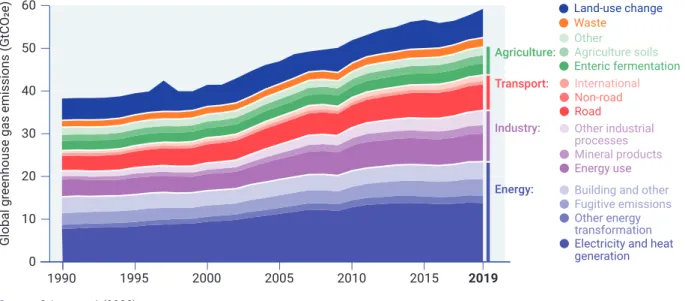
Sector trends in GHG emissions
The distribution of GHG emissions across sectors is an important consideration for policymaking (figure 2.4). Many studies primarily focus on fossil CO2 emissions
(65 per cent of total global GHG emissions), which are primarily associated with energy use. The inclusion of CH4 and N2O emissions highlights the importance of the
agriculture sector in emission trends. This section considers the sector distribution of all GHG emissions, including non-CO2 emissions.
Energy transformation dominates GHG emissions, with electricity and heat generation accounting for 24 per cent of total GHG emissions in the last decade and other energy transformation and fugitive emissions adding another 10 per cent. Emissions from energy use in buildings and other sectors, such as agriculture and fishing, are around 7 per cent. The industry sector has significant emissions from energy use (11 per cent of total GHG emissions), in additional to industrial processes (9 per cent) from mineral
products (such as cement) and other chemical reactions. The transport sector has contributed to around 14 per cent of global GHG emissions on average over the last decade, with road transport – a sector that continues to have strong growth – primarily responsible. Shipping and aviation are relatively smaller than road transport, with emissions in international territory comprising 2.2 per cent of total GHG emissions. Agriculture and waste are 15 per cent of total GHG emissions, with most emissions from enteric fermentation (ruminant animals, such as cattle), nitrogen fertilizers on agricultural soils, and municipal waste. LUC, primarily associated with agricultural activities, is around 11 per cent of the total and has larger inter-annual variations. Emissions are growing in all sectors, though there are signs that growth is slowing for electricity and heat generation, due to a stronger growth in renewables and decline in coal.
8
Figure 2.4. GHG emissions at the sectoral level
0 10 20 30 40 50 60 Global greenhouse gas emissi ons (GtCO
2e) WasteLand-use change
Other Agriculture soils Enteric fermentation Agriculture: International Non-road Road Transport: Other industrial processes Mineral products Energy use Industry:
Building and other Fugitive emissions Other energy transformation Energy:
Electricity and heat generation 2015
2010 2005
1990 1995 2000 2019
Source: Crippa et al. (2020)
Regional LUC trends
Emissions from LUC are around 11 per cent of the global total, but the bulk of these emissions are from relatively few countries. Unfortunately, there is no globally consistent and widely accepted country-level data set of LUC emissions. This is due to two main reasons: data availability and definitions. First, the two land-use models used in this report (Hansis, Davis and Pongratz 2015; Houghton and Nassikas 2017) have country-level estimates, but they are not sufficiently robust at the country level to conduct a reliable assessment (Friedlingstein et al. 2019). Similarly, data from the Food and Agriculture Organization of the United Nations (FAO) cover all countries, but do not fully capture carbon dynamics and only report five- or ten-year averages due to the relatively simple method used (Tubiello et al. in review). Furthermore, country-reported UNFCCC emission inventories only cover Annex I countries. Second, LUC is defined in several different manners. For example, the scientific community often only considers direct influences on land use, while FAO and UNFCCC emission inventories include a more expansive definition of ‘managed lands’, which captures a much larger component of the carbon sink (Grassi et al. 2018). Estimates using these different definitions should not be compared as they report quite different emissions.
Emissions from LUC predominantly originate from several key countries (Tubiello et al. in review). The largest emitters from land conversions (for example, forests converted to cropland or pastures) are Brazil, Indonesia and the Democratic Republic of the Congo. The largest managed sinks (for example, forests remaining forests) are in China, the Russian Federation, the United States of America and Brazil. When combining the conversions (sources) and managed sinks (Grassi et al. 2018), the countries with the biggest net LUC emissions are the Democratic Republic of the Congo, Brazil and Indonesia, while China, the Russian Federation and the United States of America have the largest net sinks. Reducing deforestation and enhancing
carbon sinks can lead to significant emissions reductions and benefits for biodiversity conservation and ecosystem services in key countries, while also greatly contributing to global mitigation efforts.
How close are peak GHG emissions?
Growth in global GHG emissions has averaged 1.4 per cent per year since 2010, which is lower than the growth rate of 2.4 per cent per year from 2000 to 2009. In the past decade, two years (2015 and 2016) have had almost zero growth (after removing inter-annual variations from LUC), indicating to some extent that the growth in global GHG emissions is slowing. From 2010 to 2015, GHG emissions without the variable LUC data grew at a rate of 2.2 per cent per year, which slowed to 1.2 per cent per year from 2015 to 2019. Despite the indication that global GHG emissions growth is slowing, dynamics at the country level are significantly different, with GHG emissions declining in Organisation of Economic Co-operation and Development (OECD) economies and increasing in non-OECD economies. Many OECD economies have had a peak in GHG emissions, as efficiency improvements, structural change and growth in low-carbon energy sources have been enough to overcome the growth in economic activity. Despite improving energy efficiency and increasing low-carbon sources, emissions continue to rise in countries with strong growth in energy use to meet development needs (Le Quéré et al. 2019). Globally, emissions from coal may have peaked, with rapid declines observed in Europe and the United States of America, and slower growth in China, despite an increase in other regions. Oil and particularly gas are increasingly driving the growth in global emissions, with gas now the largest contributor to fossil CO2 emissions (Peters et al. 2020). Non-fossil energy
sources continue to grow rapidly and now exceed that of fossil sources in electricity generation. However, whether these factors have been sufficient to cause global GHG
9
emissions to peak is unknown, due to the rapidly unfoldingand tragic consequences of COVID-19.
2.2.2 How might COVID-19 affect GHG emissions in
2020?
In response to the health crises created by COVID-19, most countries have implemented various measures to help avoid its spread. These measures have had unprecedented effects on many aspects of the global economy, and consequently emissions. This section provides a synthesis of the estimated effects of the COVID-19 crisis on emissions in 2020 based on available studies. Most studies have focused on changes in energy use and CO2 emissions, with less attention given
to how non-CO2 emissions may have changed.
CO2 emissions are generally estimated based on reported
energy use, but these data are not available in real time. To estimate emissions during 2020, studies have used various proxy data, such as information on mobility from Google, Apple and TomTom, real-time data on electricity generation and other similar statistics that indicate activity levels. Some studies have estimated emissions for the year to date (Liu et
al. 2020), while others have additionally estimated emissions
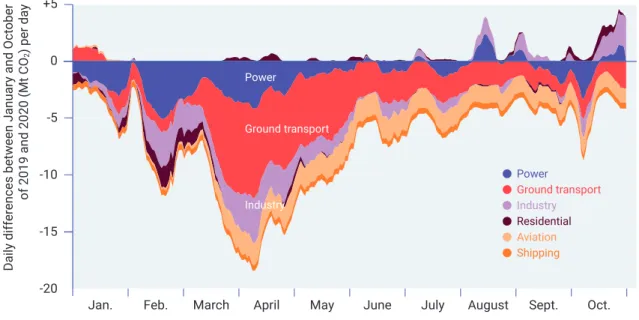
for the full year (Le Quéré et al. 2020). For the year to date, Liu et al. found that emissions have declined 7.1 per cent cumulatively to 1 November 2020, including both the effects of COVID-19 restrictions and underlying changes in the global energy system (figure 2.5). Le Quéré et al. (2020) focused only on changes due to the COVID-19 restrictions, finding that global daily emissions decreased a maximum of 17 per cent in April 2020, with emissions reductions for the full year estimated at 7 per cent (range: 2–12 per cent, updated to mid-June) if some restrictions remain to the end of 2020, which is now the case. A key driver for the uncertainty is the extent of COVID-19 restrictions for the remainder of 2020. Recent full-year estimates for 2020 emissions compared with 2019 include a decrease of 7 per cent (IEA 2020b) and 8.5 per cent (Enerdata 2020) in CO2 emissions. Based on
this, emissions reductions in 2020 are likely to fall within the range of 2–12 per cent per cent as suggested by Le Quéré
et al. (2020). All studies indicate that the biggest changes
have occurred in transport, as COVID-19 restrictions were targeted to limit mobility, though small reductions have also occurred in other sectors (fi gure 2.5).
Figure 2.5. Reduction in emissions in 2020 relative to 2019 levels due to COVID-19 lockdowns +5 0 -5 -10 -15 -20
Jan. Feb. March April May June July August Sept. Oct.
Daily differences
between
January and Oct
ober of 2019 and 2020 (Mt CO 2 ) per day Power Ground transport Industry Residential Aviation Shipping Power Industry Ground transport
Source: Liu et al. (2020)
Based on these studies, the expected reduction in CO2
emissions is 7 per cent in 2020 (range: 2–12 per cent), with a smaller drop in GHG emissions as non-CO2 is likely
to be less affected (Forster et al. 2020). The reduction is unprecedented and significantly larger than the reduction of 0.9 per cent in CO2 emissions during the 2007–2008 global
financial crisis (0.6 per cent for all GHGs).
Most relevant for climate, is how countries respond in the years beyond 2020. Previous analysis has shown that emissions often rebound after crises (Peters et al. 2012), though the nature of the rebound depends on the crisis
(Hanna, Xu and Victor 2019). As the COVID-19 crisis eases emissions will rebound, but how far and how fast is highly uncertain (IEA 2020d) and depends primarily on the choices made by governments. If COVID-19 recovery packages focus on accelerating the ongoing renewable energy transition, then emissions may continue to decline depending on how large and long-term the recovery packages are (see chapter 4).
10
2.3 Achievement of Cancun Pledges
by G20 members, considering the
potential impact of COVID-19
Collectively, G20 members are projected to overachieve their Cancun Pledges.8 Even without consideration of the
potential impacts of COVID-19, Australia, Brazil, China, EU27+UK, India, Japan, the Russian Federation, and this year, also South Africa, are projected to meet their 2020 pledges with currently implemented policies. For South Africa, the change compared with the 2019 assessment reflects revised (lower) historical emissions data as well as lower projections from the new Integrated Resource Plan (Climate Action Tracker 2019; Keramidas et al. 2020). For Australia, the Government projected in December 2019 that they would miss its “point in time” 2020 target, but will overachieve its carbon budget target for the 2013–2020 period (Commonwealth of Australia 2019). Several individual members (Canada, Indonesia, Mexico, the Republic of Korea and the United States of America) are still projected to miss their pledges or are not expected to achieve them with great certainty.
Consideration of the potential impacts of COVID-19 is only likely to change this conclusion for the United States of America, where available assessments suggest that the country will achieve its Cancun Pledge (reducing GHG emissions to 17 per cent below 2005 levels) when accounting for the expected impact of COVID-19. The latest analysis by the U.S. Energy Information Administration projects a 10 per cent decrease in energy-related CO2 emissions
in 2020 compared with 2019 (U.S. Energy Information Administration [EIA] 2020), partly due to the effects of fuel switching. The Rhodium Group (Larsen et al. 2020) and Climate Action Tracker (2020b) estimate reductions of 10–16 per cent and 10–11 per cent (excluding LULUCF), respectively, for all GHGs.
Few country-specific estimates are available for other countries. If it is assumed that the 2–12 per cent reduction in CO2 emissions in 2020 (referred to earlier in this chapter; Le
Quéré et al. 2020) applies to all GHG emissions of individual G20 members, Canada, Mexico and the Republic of Korea are still unlikely to achieve their pledges based on latest GHG inventory data (2017 for Mexico and the Republic of Korea, 2018 for Canada) and emission trends in recent years. For Indonesia, it remains uncertain whether 2020 emissions would meet their Cancun Pledge, due to the uncertainty on LULUCF emissions.
8 European Union Member States are not assessed individually. Argentina, Saudi Arabia and Turkey have not made 2020 pledges.
9 Current policy scenario projections assume that no additional mitigation action is taken beyond current policies, even if it results in NDC targets not being achieved or being overachieved (United Nations Environment Programme [UNEP] 2015; den Elzen et al. 2019). Current policy projections reflect all adopted and implemented policies, which for the purpose of this report are defined as legislative decisions, executive orders or their equivalent. This implies that officially announced plans or strategies alone would not qualify, while individual executive orders to implement such plans or strategies would qualify.
10 As Turkey has not ratified the Paris Agreement, its submission to the UNFCCC remains an INDC. Acknowledging this, the report refers to NDCs for simplicity in the rest of the chapter.
2.4 Assessment of G20 members’
progress towards NDC targets
This section assesses the progress of G20 members towards their NDC targets based on emissions projections published before the COVID-19 pandemic (section 4.2.1), and also provides some preliminary findings regarding the potential impact of COVID-19 and related policy responses on G20 emissions by 2030 (section 4.2.2).
Projections of GHG emissions were compiled and reviewed to assess the emission levels expected for G20 members under existing policies (the ‘current policies scenario’)9 and
whether the members are likely to meet their respective emissions reduction targets for 2030. Projections of the current policies scenario assume that no additional mitigation policies and measures are taken beyond those adopted and/or implemented as of a certain cut-off date (den Elzen et al. 2019).
The progress assessment is based on the first NDCs (INDC for Turkey).10 As at mid-November 2020, no G20
member has officially submitted a new or updated NDC to reflect a revised NDC target (Japan resubmitted its original NDC target in March 2020) (United Framework Convention on Climate Change [UNFCCC] undated a). This report follows the methodology of den Elzen et al. (2019) to enable a robust comparison of projections from different data sources, including both official sources published by G20 governments and sources published by independent research institutions. European Union Member States are not assessed individually, and all projections for the European Union include the United Kingdom.
The most important caveat for the 2020 assessment is the impact of the COVID-19 pandemic on the current policies scenario projections. As most projections to date were published or prepared before the pandemic was declared, they do not account for its potentially significant impact not only for emission trends in 2020 and 2021, but also until 2030. As previously mentioned, the impact of the pandemic on 2030 emissions projections for some individual G20 members is discussed in section 2.4.2. Other important caveats are similar to those of previous Emissions Gap Reports (adapted from den Elzen et al. 2019). First, whether a country is projected to achieve or miss its Cancun Pledge or NDC targets with existing policies depends on both the strength and stringency of the existing climate policy packages and the ambition level of the targets given structural factors (such as demographic and
11
macroeconomic trends) that shape how easy or difficult atarget is to achieve. Although targets have been assessed as diverging in ambition, this report does not assess the degree of each country’s efforts to achieve a certain mitigation projection, and does not assess the ambition of the targets in the context of equity principles. Countries that are projected to achieve their NDCs with existing policies are therefore not necessarily undertaking more mitigation actions than countries that are projected to miss them, and vice versa. Second, current policies scenario projections are subject to the uncertainty associated with macroeconomic trends, such as gross domestic product (GDP), population growth and technology developments, as well as the impact of policies. Some Cancun Pledges and NDCs are also subject to the uncertainty of future GDP growth and other underlying assumptions. These all add to the fundamental uncertainty resulting from COVID-19.
Up-to-date emissions projections published since November 2019 were collected from official documents, namely
11 Japan’s ‘with measures’ scenario is excluded as it also considers the expected impact of planned policy measures (Government of Japan 2019a) and is therefore not considered a current policy scenario under the definition used in the UNEP Emissions Gap Report series.
countries’ recently published National Communications and fourth biennial reports of five G20 members (‘with measures’ scenarios).11 Estimates were also collected for
the current policies scenario and NDC scenario projections from independent studies and several new national models and integrated assessment model studies for China, India, Japan, the Russian Federation and the United States of America through the Linking Climate and Development Policies – Leveraging International Networks and Knowledge Sharing (CD-LINKS) project (Roelfsema et al. 2020), as well as independent global studies, such as the Climate Action Tracker (2019), Joint Research Centre of the European Commission (Keramidas et al. 2020) and PBL Netherlands Environmental Assessment Agency (Kuramochi et al. 2019; PBL 2020; Roelfsema et al. 2020). All data sources, including the updated studies, are presented in table 2.2. Policy cut-off dates ranged from 2017 to 2019 across studies. The emissions figures include LULUCF, unless otherwise stated.
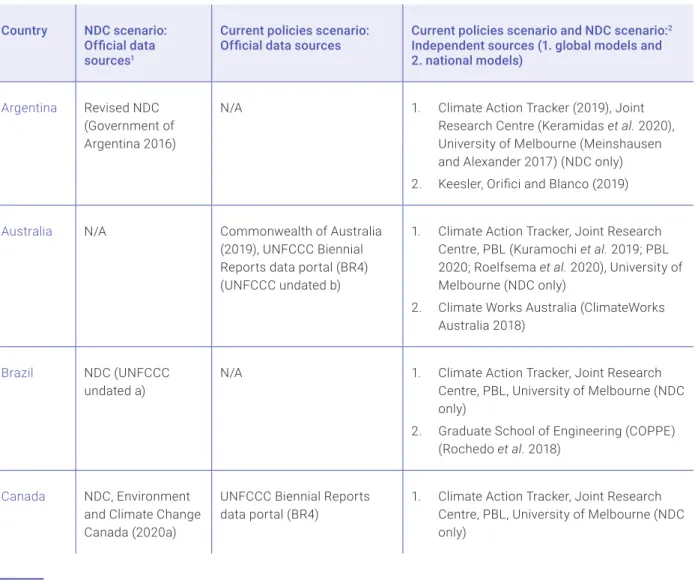
Table 2.2. Official and independent sources used to estimate emissions in the target year under the NDC and current
policies scenarios for G20 members
Country NDC scenario: Official data sources1
Current policies scenario:
Official data sources Current policies scenario and NDC scenario:
2
Independent sources (1. global models and 2. national models)
Argentina Revised NDC (Government of Argentina 2016)
N/A 1. Climate Action Tracker (2019), Joint
Research Centre (Keramidas et al. 2020), University of Melbourne (Meinshausen and Alexander 2017) (NDC only) 2. Keesler, Orifici and Blanco (2019)
Australia N/A Commonwealth of Australia (2019), UNFCCC Biennial Reports data portal (BR4) (UNFCCC undated b)
1. Climate Action Tracker, Joint Research Centre, PBL (Kuramochi et al. 2019; PBL 2020; Roelfsema et al. 2020), University of Melbourne (NDC only)
2. Climate Works Australia (ClimateWorks Australia 2018)
Brazil NDC (UNFCCC undated a)
N/A 1. Climate Action Tracker, Joint Research
Centre, PBL, University of Melbourne (NDC only)
2. Graduate School of Engineering (COPPE) (Rochedo et al. 2018)
Canada NDC, Environment and Climate Change Canada (2020a)
UNFCCC Biennial Reports data portal (BR4)
1. Climate Action Tracker, Joint Research Centre, PBL, University of Melbourne (NDC only)
12
China N/A N/A 1. Climate Action Tracker, Joint Research
Centre, PBL, CD-LINKS (Roelfsema et al. 2020), University of Melbourne (NDC only), Pacific Northwest National Laboratory (PNNL) (NDC only) (Fawcett et al. 2015) 2. National Center for Climate Change
Strategy and International Cooperation (NCSC) (Fu, Zou and Liu 2017),3 Energy
Research Institute (ERI) – Integrated Policy Assessment Model for China (IPAC) (Roelfsema et al. 2020), Tsinghua University – The Integrated MARKAL-EFOM System (TIMES) (Roelfsema et al. 2020) EU27+UK European Environment Agency (EEA) (2019) EEA (2019), European Commission (2018; 2020b) UNFCCC Biennial Reports data portal (BR4, ‘with measures’ scenario only)
1. Climate Action Tracker, Joint Research Centre, PBL, University of Melbourne (NDC only)
India N/A N/A 1. Climate Action Tracker, Joint Research
Centre, PBL, CD-LINKS (Roelfsema et al. 2020), University of Melbourne (NDC only), PNNL (NDC only)
2. Mitra et al. (2017), Dubash et al. (2018), The Energy and Resources Institute (TERI) – MARKAL (Roelfsema et al. 2020), Indian Institute of Management (IIM) – Asian-Pacific Integrated Model (AIM) India (Roelfsema et al. 2020)
Indonesia NDC N/A 1. Climate Action Tracker, Joint Research
Centre, PBL, University of Melbourne (NDC only)
Japan NDC N/A4 1. Climate Action Tracker, Joint Research
Centre, PBL, CD-LINKS (Roelfsema et al. 2020), University of Melbourne (NDC only) 2. National Institute for Environmental
Studies (NIES) – AIM/Enduse model (Roelfsema et al. 2020), Research Institute of Innovative Technology for the Earth (RITE) – DNE model (Roelfsema et al. 2020)
Mexico NDC, Government of Mexico (2015)
N/A 1. Climate Action Tracker, Joint Research
Centre, PBL
Russian Federation
NDC (UNFCCC 2017)
UNFCCC Biennial Reports data portal (BR4)
1. Climate Action Tracker, Joint Research Centre, PBL, CD-LINKS (Roelfsema et al. 2020), PNNL (NDC only)
2. HSE – TIMES model (Roelfsema et al. 2020)
13
SaudiArabia
N/A: Saudi Arabia did not formulate a post-2020 GHG target (UNFCCC undated a)
N/A 1. Climate Action Tracker (based on
King Abdullah University of Science and Technology [KAUST] 2014), Joint Research Centre
South Africa
NDC N/A 1. Climate Action Tracker, Joint Research
Centre, PBL
Republic of Korea
NDC N/A 1. Climate Action Tracker, Joint Research
Centre, PBL
Turkey INDC (UNFCCC 2017)
UNFCCC Biennial Reports data portal (BR4)
1. Climate Action Tracker, Joint Research Centre, PBL United States of America NDC, United States Department of State (2016)
N/A 1. Climate Action Tracker, Joint Research
Centre, PBL, CD-LINKS (Roelfsema et al. 2020)
2. PNNL – GCAM model (Roelfsema et al. 2020), Chai et al. (2017), Rhodium Group (Larsen et al. 2020)
Notes:
1. References provided only when the NDC emission levels are available in absolute terms.
2. Data collected when NDC target emission levels in absolute terms were not available in official documents.
3. Augmented with historical non-CO2 GHG emissions data from China’s First Biennial Update Report on Climate Change (People’s
Republic of China 2016), combined with the median estimate of the 2010–2030 non-CO2 emissions growth rates for China from
five integrated assessment models (Tavoni et al. 2014), to produce economy-wide figures.
4. The ‘with measures’ scenario from the latest biennial report is not included because it is an NDC achievement scenario, which includes planned policies.
Source: Updated from den Elzen et al. (2019)
12 All emissions projections for the European Union reviewed in this report include the United Kingdom.
2.4.1 Progress assessment based on pre-COVID-19
studies
This section assesses progress of G20 members towards their NDC targets based on emissions projections published before the COVID-19 pandemic, as few updates considering the potential impact of COVID-19 and related policy responses were available as at October 2020. An assessment of the potential impact of the pandemic on emissions by 2030 based on a limited set of studies is provided in section 2.4.2. Although, the emissions projections reviewed here do not consider the implications of COVID-19 on future GHG emissions, they provide important information about the impact of recent policy developments in respective G20 member countries and regions.
Collectively, G20 members are not on track to achieve their unconditional NDCs based on current policies. Nine of the 16 G20 members, counting the EU27+UK as one member, are likely to achieve their unconditional NDC targets (INDC for Turkey) under current policies (fi gure 2.6). These members are Argentina (new compared with the 2019 assessment),
China, EU27+UK,12 India, Japan (back in this group since
the 2018 assessment), Mexico, the Russian Federation, South Africa (new) and Turkey (see table 2.3). Among them, four countries (Argentina, India, the Russian Federation and Turkey) are projected to reach emission levels that are 14–34 per cent lower than their respective NDC emissions target levels (fi gure 2.6).
The assessment has changed compared with the 2019 assessment for the following three countries:
▶ Argentina is now expected to achieve its
unconditional NDC target with current policies. The median projection from independent analyses has been revised downward, partially due to downward-revised economic growth and LULUCF projections (see table 2.4 for recent developments).
▶ For Japan, current policies scenario projections for 2030 have been close to the NDC target for the past several years. The country’s GHG emissions
14
have been decreasing continually since 2013 due to increased renewable electricity generation, reduced electricity consumption and reduced total end-use energy consumption.
▶ For South Africa, the central estimate from independent analyses (see table 2.2) has been revised significantly downward. This is mainly due to the consideration of the recently updated Integrated Resource Plan (see table 2.4 for details) (Republic of South Africa, Department of Energy 2019) and the likelihood of its implementation, as well as the most recent national GHG inventory report that noted flattened emission trends between 2010 and 2015. Substantial changes in the current policies projections compared with the 2019 assessment are also observed for other G20 members projected to achieve their unconditional NDC targets:
▶ The central estimate for the EU27+UK was
revised downward, meaning it is now projected to overachieve its 40 per cent GHG reduction target for 2030. The change in assessment mainly reflects that the underlying studies now account for the full implementation of directives, regulations and legislation adopted in 2018 and 2019 that comprise the Clean Planet for All policy package. According to a baseline scenario that assumes
full implementation of adopted policies in climate, energy and transport, emissions for the EU27 could reduce around 45 per cent below 1990 levels by 2030 (European Commission 2020b). If the status of policy implementation is considered at the level of European Union Member States, studies indicate that additional collective effort is required both by Member States and the European Union to meet its energy efficiency target as part of the NDC (EEA 2019). Additional Member State measures are in preparation, as indicated by the national energy and climate plans submitted in 2020, which have been assessed by the European Commission as being consistent with a 41 per cent reduction (European Commission 2020a) .
▶ The central estimate for the Russian Federation’s 2030 emissions projections decreased by about 300 MtCO2e due to the independent analyses’
consideration of the 2019 national GHG inventory report, which made significant downward revisions on the historical emissions data compared with previous inventory reports.
For other G20 members that are projected to meet their NDC targets, India’s 2030 emissions projections show a small decrease, partly due to a strong growth in renewable energy deployment, while the projections for China, Mexico and
Turkey have not changed substantially compared with the
2019 assessment.
Figure 2.6. GHG emission projections (all gases and sectors, including LULUCF) for individual G20 members by 2030
under different scenarios published before the COVID-19 outbreak and compared with historical emissions from national GHG inventories
Figure 2.6a.
China India USA (2025) EU27+UK
0 3 6 9 12 18 15 4 GtCO2e 4 GtCO2e Emissions (GtCO 2e/yr) 0.0 0.5 1.0 1.5 2.0 2.5 3.0 3.5 4.0 Turkey Republic
of Korea SouthAfrica
Saudi Arabia
Russia Indonesia Brazil Japan Mexico Canada Argentina Australia
4 GtCO2e 4 GtCO2e Emissions (GtCO 2e/yr) 4 GtCO2e 4 GtCO2e 1990 2010 2015
Current policies (official data) Current policies (independent studies) Unconditional NDC Conditional NDC 1990 2010 2015 Current policies (independent studies) Unconditional NDC Conditional NDC
15
For five G20 members, GHG emissions by 2030 are projectedto fall short of their unconditional NDC target and require further action of varying degree: Australia, Brazil, Canada, the Republic of Korea and the United States of America.
▶ For Australia and the Republic of Korea, the central estimates of independent analyses remain consistent with those of the 2019 assessment.
▶ For Brazil, the central estimates of independent analyses have increased from the 2019 assessment due to an upward revision of emissions projections in the land-use sector.
▶ For Canada, the emissions projections are revised downward compared with their previous assessments in both official (Environment and Climate Change Canada 2020b) and independent analyses (in part due to a large downward revision by the Joint Research Centre (Keramidas et al. 2020)). However, overall, the nation is still projected to miss its NDC target, unless policies are strengthened. Canada has acknowledged this and in September 2020 it committed to bring forward enhanced measures that will allow the country to meet and exceed its target.
▶ For the United States of America, the government has revised, rescinded and/or replaced regulations, but the GHG emissions projections remain similar
to previous projections. The central estimate for 2025 under current policies scenario projections is still far from the NDC target level (central estimate: 5.8 GtCO2e compared with 4.7 GtCO2e). As the
withdrawal of the United States of America from the Paris Agreement took effect on 4 November 2020, the country no longer has an official NDC. However, its former NDC for 2025 is still included as a reference. In November 2020, Joe Biden won the presidential election (NBC News 2020). President-elect Biden intends an immediate return to the Paris Agreement (Biden 2020). This can be achieved in 2021, without the intervention of Congress.
▶ For the Republic of Korea, it should be noted that the current policies scenario projections could be revised downward significantly, when the total amount of emissions allowances (caps) under Korean Emissions Trading Scheme (K-ETS) are set for years towards 2030 and reflected in the emissions projections. According to the third Master Plan for the K-ETS established in December 2019, the emissions caps for Phase III (2021–2025) will be strictly set to be consistent with the annual target emissions from the 2030 Greenhouse Gas Reduction Roadmap, while the emission caps for Phase IV will be set to achieve the NDC target for 2030. The emissions cap for Phase III has recently been set (see table 2.4).
Figure 2.6b.
China India USA (2025) EU27+UK
0 3 6 9 12 18 15 4 GtCO2e 4 GtCO2e Emissions (GtCO 2e/yr) 0.0 0.5 1.0 1.5 2.0 2.5 3.0 3.5 4.0 Turkey Republic
of Korea SouthAfrica
Saudi Arabia
Russia Indonesia Brazil Japan Mexico Canada Argentina Australia
4 GtCO2e 4 GtCO2e Emissions (GtCO 2e/yr) 4 GtCO2e 4 GtCO2e 1990 2010 2015
Current policies (official data) Current policies (independent studies) Unconditional NDC Conditional NDC 1990 2010 2015 Current policies (independent studies) Unconditional NDC Conditional NDC
Notes: i) The data sources of the scenarios are described in table 2.2. ii) For reporting reasons, the emission projections for China, the EU27+UK, India and the United States of America are shown in figure 2.6a, and the other countries shown in figure 2.6b, using two different vertical axes. iii) For the United States of America, which withdrew from the Paris Agreement on 4 November 2020, the former NDC for 2025 is presented for reference (hatched).
16
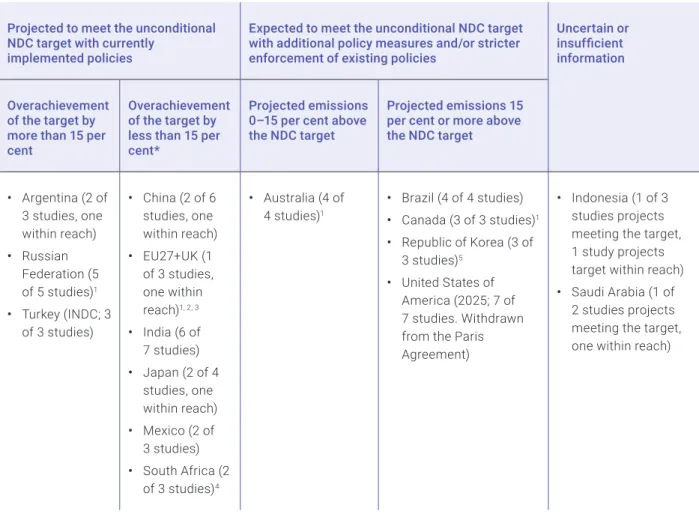
Table 2.3. Assessment of G20 member’s progress towards achieving unconditional NDC targets under current policies
based on independent studies published before the COVID-19 outbreak
Projected to meet the unconditional NDC target with currently
implemented policies
Expected to meet the unconditional NDC target with additional policy measures and/or stricter enforcement of existing policies
Uncertain or insufficient information Overachievement
of the target by more than 15 per cent
Overachievement of the target by less than 15 per cent*
Projected emissions 0–15 per cent above the NDC target
Projected emissions 15 per cent or more above the NDC target • Argentina (2 of 3 studies, one within reach) • Russian Federation (5 of 5 studies)1 • Turkey (INDC; 3 of 3 studies) • China (2 of 6 studies, one within reach) • EU27+UK (1 of 3 studies, one within reach)1, 2, 3 • India (6 of 7 studies) • Japan (2 of 4 studies, one within reach) • Mexico (2 of 3 studies) • South Africa (2 of 3 studies)4 • Australia (4 of 4 studies)1 • Brazil (4 of 4 studies) • Canada (3 of 3 studies)1 • Republic of Korea (3 of 3 studies)5 • United States of America (2025; 7 of 7 studies. Withdrawn from the Paris Agreement)
• Indonesia (1 of 3 studies projects meeting the target, 1 study projects target within reach) • Saudi Arabia (1 of
2 studies projects meeting the target, one within reach)
Notes: The assessment is based on the number of independent studies (table 2.2) that support the findings. These are compared to the available studies, as indicated in brackets, and the average estimate (median for countries with five studies or more) of the current policies scenario projections across all studies with the average 2030 NDC target.
1. Current policies scenario projections from official publications were also examined. The number of scenarios that support
the above findings out of the total number of official scenarios are: Australia: 1 of 1; Canada: 1 of 1; Russian Federation: 1 of 1; European Union: 2 of 4 (see chapter footnote 4).
2. Climate Action Tracker indicates that upper-end projections would miss the NDC target range. Joint Research Centre analysis
projected that the European Union would almost reach the target, with less than 10 MtCO2e difference by 2030.
3. Three official studies for EU27+UK (European Commission 2018; EEA 2019; UNFCCC undated b (BR4, ‘with measures scenario’))
and one official study for EU27 (European Commission 2020b) were assessed in addition to three independent studies. The evaluation was made based on an independent analysis by PBL that took into account the best recently adopted policy packages (Kuramochi et al. 2019) and official projections that considered full implementation of current European Union-wide policies (European Commission 2018; European Commission 2020b).
4. South Africa’s current policies scenario projections were compared with the upper-bound estimate of the NDC range. 5. The Korean Emissions Trading Scheme (K-ETS) is an instrument to fully achieve the country’s NDC target and covers about
70 per cent of its GHG emissions. At the time when three studies containing emissions projections for the Republic of Korea were conducted, a Master Plan for K-ETS Phase III (2021–2025) and IV (2026–2030) and a National Emission Allowance Allocation Plan for Phase III were not established. Thus, the three independent studies do not explicitly assume an implementation of the emissions caps consistent with the NDC target for the phases after 2020, which partially explains why they project the Republic of Korea to miss its NDC target under current policies.
Studies do not agree on whether Indonesia and Saudi
Arabia are on track to meet their unconditional NDCs.
For Indonesia, this mainly results from the uncertainty surrounding LULUCF emissions due to peat fires. The projection this year is considerably lower than the previous assessment due to updated GHG inventory data and the upward revision of renewable electricity generation
projections (Kuramochi et al. 2019). For Saudi Arabia, the limited information about its NDC target and policies to achieve this target prevented a detailed assessment of the country’s progress.
Collectively, G20 members are not on track to achieve their unconditional NDCs based on current policies. The aggregate
17
emissions of G20 members by 2030 are projected to be 40.1GtCO2e13 (range: 35.8–42.6 GtCO2e), which is 0.9 GtCO2e
lower than projected in the 2019 report and about 26 per cent above 2010 levels (range: 7–48 per cent). These estimates do not consider the potential implications of the COVID-19 pandemic and related economic responses, but instead reflect various factors, including the impact of policies adopted in recent years, as well as revisions in GHG inventory data, changes in emissions scenario methodologies and underlying assumptions on macroeconomic drivers. Current policies imply increased 2030 emissions compared with 2010 levels for several G20 members (Argentina, Brazil, China, India, Indonesia, Mexico, the Republic of Korea, Russia, Saudi Arabia and South Africa).
Collectively, G20 members need to reduce their GHG emissions further by about 0.3 GtCO2e per year by 2030 to
achieve unconditional NDC target emission levels and by about 2.4 GtCO2e per year to achieve conditional NDC target
emission levels. If the 1.7 GtCO2e per year overachievement
of unconditional NDCs by India, the Russian Federation and Turkey are excluded, and it is assumed that these countries will follow their current policies trajectory rather than that
13 Central estimate of three studies that cover all G20 members (Climate Action Tracker 2019a; Kuramochi et al. 2019; Keramidas et al. 2020). 14 The values presented here are smaller than those reported in the 2019 report, though this is largely due to the 2019 report using an extrapolated
2030 estimate for the NDC of the United States of America, which was for 2024, whereas this year’s report uses the former NDC emission levels for 2025 as they are.
implied by their unconditional NDCs (as done in many NDC scenario projections from global models presented in chapter 3), then the G20 members will be collectively short of achieving both unconditional and conditional NDCs by about 2.1 GtCO2e per year and 3.4 GtCO2e per year, respectively, by
2030. The estimated difference between the current policies scenario and NDC scenario projections for G20 members remains similar to 2019 Emissions Gap Report projections.14
A sizeable number of policies adopted by G20 members over the past year have the potential to positively and negatively affect progress towards NDC targets (table 2.4). Many of these policies were adopted after the publication of the scenario studies reviewed in this section and were therefore not taken into account. Although several policies are expected to have positive mitigation outcomes, there are many that have negative implications for emissions, such as fossil fuel extraction projects, coal-fired power plant construction plans, and rollbacks of environmental regulations during the COVID-19 pandemic, as table 2.4 illustrates (for COVID-19 implications, see section 2.4.2 and chapter 4).
18
Table 2.4. Overview of key policy measures adopted by G20 members in 2019 and 2020 that would significantly affect the
achievement of NDC targets, including selected COVID-19 measures
Country/
region Key policy measures adopted in 2019 and 2020
Argentina • In November 2019, the National Climate Change Law on Adaptation and Mitigation was approved in Congress by consensus.
• The future of ‘Vaca Muerta’ (large reserve of shale oil and gas) remains highly uncertain. Its economic viability and attractiveness are at stake due to a plunge in oil prices and reduced demand. The Government is renegotiating its foreign debt with the International Monetary Fund (IMF), with the future of Vaca Muerta dependent on the results of these negotiations.
Australia • No new renewable energy targets for post-2020 have been put forward (the 2020 target was achieved a year early).
• The Government has announced plans to support investment in natural gas, in a gas-led recovery to the pandemic, including through government investment in gas infrastructure.
• The Technology Investment Roadmap Discussion Paper, published in May 2020, proposes changing the remit of two renewable energy government agencies and advocates for natural gas and carbon capture and storage (CCS).
• The First Low Emissions Technology Statement, published in September 2020, outlines the five technologies requiring investment for emissions reduction: clean hydrogen, energy storage, low-carbon materials, CCS and soil low-carbon sequestration. A new AUD 1.9 billion investment package was also announced in September 2020 to support the above activities and energy productivity, excluding support for renewable energy technologies.
Brazil • The Government has recently approved the Forest+ project, which will fund environmental services linked with conservation efforts. However, rollbacks continue to hinder efforts to stop deforestation. • Three-quarters of the latest energy auction (October 2019) went to renewable energy, with the
remainder going to natural gas. Solar (18 per cent) had the lowest cost of all technologies. Despite this, investments in fossil fuel energy infrastructure still dominate the current 10-year energy plan. The spring 2020 auction was postponed due the pandemic.
Canada • The Minister of Environment and Climate Change reversed his 2019 decision not to subject a coal mine expansion project to a federal environmental impact assessment after claims that such action was inconsistent with Canada’s founding member status of the Powering Past Coal Alliance.
• Canada has announced that it will establish a Clean Power Fund to help finance the development and linking of clean energy to transmission systems, including support for an Atlantic Loop that will help the country’s most eastern provinces transition away from coal-fired electricity generation.
• Regulations regarding fugitive and venting CH4 emissions from upstream oil and gas production came
into effect at the beginning of 2020. These regulations are part of Canada’s commitment to reduce CH4 emissions in the sector by 40–45 per cent below 2012 levels by 2025.
• Canada continues to invest in electric vehicle (EV) charging infrastructure and has provided funding to support EV purchase incentives as part of its sales targets for EVs of 10 per cent by 2025, 30 per cent by 2030 and 100 per cent by 2040. Further support measures are anticipated as part of COVID-19 economic recovery measures.
19
• Mandatory carbon pricing has been in effect across Canada since 2019. Provinces and territoriesmay implement their own pricing systems, provided that they meet certain criteria, or apply the federal system. The federal carbon pricing system consists of a charge on fossil fuels and a regulated emissions trading system for heavy industry. For direct pricing systems in Canada, the carbon price is CAD 30/tCO2e in 2020, which will rise to CAD 10/year to CAD 50/tCO2e in 2022. Some provinces have
challenged the constitutionality of the carbon pricing legislation, with lower courts split on the issue. Canada’s top court heard the case in September 2020 and reserved judgment.
China • The new coal-fired power monitor up to 2023 allows or restricts provinces to permit construction of new coal-fired power plants. Restrictions were rolled back compared with the 2019 monitor, with more provinces permitted to construct new plants.
• The target for the new energy vehicles (NEVs) market share in total car sales was raised from 20 per cent to 25 per cent by 2025, with the Government extending the NEV purchase tax exemption programme and subsidies programme until 2022.
• Partly in response to COVID-19, the Government will prioritize acceleration of its New Infrastructure Plan. In 2020, China added 200,000 EV charging facilities nationwide, which is an increase of about 16.5 per cent compared with 2019. As at October 2020, 21 ultra-high voltage (UHV) power transmission projects have been commissioned, six of which are under construction. Infrastructure to connect large-scale rural renewable projects to densely populated areas, along with new inter-city high-speed rail networks will also be promoted.
• China will scale up its NDC by adopting more vigorous policies and measures. China aims to peak CO2
emissions before 2030 and achieve carbon neutrality before 2060 (Ministry of Foreign Affairs of the People’s Republic of China 2020).
European Union
• The European Union adopted the European Green Deal to become climate neutral by 2050 in December 2019. The European Green Deal includes the development of a climate law, which was proposed by the European Commission in March 2020 and is in discussion between the European Council and European Parliament.
• In July 2020, the European Council (European Union Heads of State and government) agreed on the main elements of a proposed recovery package known as NextGenerationEU. This package is additional to the European Union’s 2021–2027 budget and would total EUR 750 billion in grants and loans. Thirty per cent of NextGenerationEU funds and the European Union’s long-term budget for 2021–2027 have been earmarked for climate action. All funds will support the 2030 climate target and 2050 climate neutrality objective.
• In September 2020, the European Commission proposed that the European Union increase its domestic emissions target to at least 55 per cent below 1990 levels by 2030 (including LULUCF). In October 2020, the European Parliament voted for a reduction of 60 per cent. Considerations are ongoing in the European Council on how to revise the target.
India • No new coal-fired power plants were built in the first half of 2020 and the country’s coal fleet shrank by 0.3 GW. However, there are still plans to expand coal-fired power generation in the future. Domestic coal production could reach record levels in 2020.
• India plans to expand solar investments in its agriculture sector to develop 25 GW of capacity by 2022 through the Pradhan Mantri-Kisan Urja Suraksha evam Utthan (PM-KUSUM) scheme. (At the national level, India has a renewable energy capacity target of 175 GW by 2022).
• The second phase of the Faster Adoption and Manufacturing of Electric Vehicles (FAME II) project, which came into effect in April 2019, provides support to EV purchases and charging infrastructure. • Indian railways aims to completely electrify the network by 2023 and in July 2020 announced its plans
20
Indonesia • In January 2020, the Government put a cap on domestic coal below market value to boost
consumption. It also plans to subsidize fuel for industries and businesses using roughly 14 per cent of the budget reserved for its National Economic Recovery programme.
• Indonesia has postponed the 2020 geothermal auctions, with the demand for solar photovoltaic (PV) panels dropping 70 per cent during the pandemic, due to reduced household and government spending for rooftop installations.
Japan • The Government aims to establish a concrete plan to phase out the country’s inefficient coal-fired power plants.
• According to Japan’s new strategy on coal-fired power plant finance overseas, the Government will not, in principle, support the installation of projects in countries whose energy issues and decarbonization policies have not been deeply accounted for in a bilateral context (the strategy does not apply to ongoing projects).
• The new midterm deployment plan for offshore wind power will be proposed by the end of 2020 through the Public-Private Council on Enhancement of Industrial Competitiveness for Offshore Wind Power Generation.
Mexico • Mexico passed a bill on fiscal support to its state-owned petroleum company (Pemex), which would allow Pemex to continue its investments in oil exploration and extraction.
• The Government established a policy to strengthen energy security in the country, which effectively halts private renewable energy investment in Mexico and prioritizes state-owned fossil fuel-fired power plants supplied with coal, heavy oil and natural gas. However, as the judiciary processes against this policy are still ongoing, the renewable electricity dispatch continues and its use has not been affected. No significant renewable power capacity has been added in 2020, with the dispatch of renewables in the country’s electricity matrix (excluding large hydropower) reaching just 13 per cent in September 2020.
Republic of Korea
• The Ninth Electricity Plan is currently in development, but its draft already includes electricity generation targets that are lower for coal and nuclear and higher for renewables and natural gas, compared with the Eighth Electricity Plan. The new plan’s targets for 2034 are 17 per cent for nuclear, 15 per cent for coal, 32.3 per cent for natural gas and 40 per cent for renewables.
• The Government’s Green New Deal includes a plan to boost renewable energy deployment (with the focus on offshore wind farms and building installations) and low-carbon infrastructure, as well as support to build a smart grid for efficient energy management and put 1.13 million EVs and 200,000 hydrogen vehicles on the roads by 2025.
• In October 2020, the National Emission Allowance Allocation Plan for Phase III (2021–2025) was established. The plan sets the total emission allowances (caps) for Phase III. According to the plan, the portion of allowances allocated through an auction is being increased to 10 per cent, with the number of industries that have a benchmark methodology applied for free allocation also set to increase compared with Phase II.
Russian Federation
• The long-delayed 2035 Energy Strategy was adopted in June 2020, which focuses on expanding fossil fuel production, exports and domestic consumption. Plans for expanding renewable energy generation are absent.
• A draft energy efficiency plan, published in August 2020, sets a 2030 target of reducing total energy intensity of GDP by 20 per cent below 2017 levels.