RIVM Letter report 2018-0037 M.J. Mangen et al.
Disease burden of food-related pathogens
in the Netherlands, 2017
RIVM Letter report 2018-0037 M.J. Mangen et al.
Colophon
© RIVM 2018
Parts of this publication may be reproduced, provided acknowledgement is given to: National Institute for Public Health and the Environment, along with the title and year of publication.
DOI 10.21945/RIVM-2018-0037
M.J. Mangen (author), RIVM I.H.M. Friesema (author), RIVM R. Pijnacker (author), RIVM L. Mughini Gras (author), RIVM W. van Pelt (author), RIVM Contact:
Marie-Josee J. Mangen CIb
marie-josee.mangen@rivm.nl
This investigation has been performed by order and for the account of Ministerie van VWS, within the framework of Programma 5
This is a publication of:
National Institute for Public Health and the Environment
P.O. Box 1 | 3720 BA Bilthoven The Netherlands
Synopsis
Disease burden of food-related pathogens in the Netherlands, 2017
The Ministry of VWS has requested RIVM to present an annual update on the number of illnesses, disease burden and cost-of-illness caused by 14 enteric pathogens. These pathogens can be transmitted by food, the environment, animals and humans. The disease burden is expressed in DALYs (Disability Adjusted Life Years), a metric integrating morbidity and mortality into one unit. Furthermore, the cost-of-illness (COI) related to the 14 food-related pathogens was estimated and expressed in euros. The COI estimate includes healthcare costs, the costs for the patient and / or his family, such as travel expenses, as well as costs in other sectors, for example due to productivity losses. The total disease burden caused by the 14 pathogens decreased slightly from around 12,000 DALYs in 2016 to 11,000 DALYs in 2017. The share of foodborne transmission in this estimated burden was comparable with earlier years, mounting to 4,200 DALYs in 2017. The total COI caused by the 14 pathogens decreased slightly from 436 €M in 2016 to 391 €M in 2017. The food-related COI was with 163 M€ in 2017, which is slightly lower than in 2016 (i.e. 173 €M). The differences in DALYs and COI between 2016 and 2017 are largely due to fluctuations in the type of infections that occur, the burden of disease they cause and the varying costs per infection.
The research presented in this report results in more insight in the number of incident cases of foodborne diseases and the associated disease burden and costs-of-illness and enables researchers and policy-makers to monitor trends in time for these 14 pathogens.
Keywords: food-related disease, disease burden, DALY, cost-of-illness, costs.
Publiekssamenvatting
Ziektelast van via voedsel overdraagbare ziekteverwekkers in Nederland in 2017
Het RIVM onderzoekt jaarlijks hoeveel mensen ziek worden van 14 ziekteverwekkers die via voedsel in het menselijk lichaam terechtkomen (darmpathogenen). Deze ziektelast wordt uitgedrukt in DALY’s
(Disability Adjusted Life Year), een internationaal gehanteerde maat voor het aantal gezonde levensjaren dat verloren gaat aan ziekte of vroegtijdig overlijden. Het aantal DALY’s als gevolg van de 14 ziekteverwekkers, via voedsel, is in 2017 geschat op 4.200, en is daarmee iets lager dan in 2016 (4.700 DALY’s).
Ook kosten die aan deze ziekteverwekkers verbonden zijn, zijn lager: 163 miljoen euro in plaats van 173 miljoen euro in 2016. Deze cost of
illness omvatten directe medische kosten, maar ook de kosten voor de
patiënt en/of zijn familie, zoals reiskosten, en de kosten binnen andere sectoren, bijvoorbeeld door werkverzuim.
De onderzochte ziekteverwekkers kunnen niet alleen via voedsel aan de mens worden overgedragen (circa 40 procent), maar ook via het milieu (bijvoorbeeld via oppervlaktewater), dieren, en van mens op mens. Het verschilt per ziekteverwekker hoe groot het aandeel in de
‘blootstellingsroute’ is. De totale ziektelast van alle routes is geschat op 11.000 DALY’s, en is daarmee lager dan in 2016 (12.000 DALY’s). De totale kosten zijn geschat op 391 miljoen euro en waren daarmee lager dan in 2016 (436 miljoen). De verschillen in DALY’s en kosten zijn grotendeels een gevolg van schommelingen in het aantal infecties dat de 14 ziekteverwekkers veroorzaakten, net als de daaruit volgende ziektelast en kosten.
Het ministerie van VWS is de opdrachtgever van dit onderzoek. De resultaten bieden handvatten om meer zicht te krijgen op het
daadwerkelijke aantal voedselinfecties dat mensen jaarlijks oplopen, de bijbehorende ziektelast en de blootstellingsroutes.
Contents
1 Introduction — 9 2 Methods — 11 2.1 Trend information — 11 2.2 Disease burden — 12 2.3 Cost of illness — 12 2.4 Attribution — 12 3 Results — 13 3.1 Trend information — 133.2 Number of incident cases — 16
3.3 Disease burden by pathogen — 18
3.4 Cost-of-illness by pathogen — 21
3.5 Attribution — 24
4 Discussion — 33
5 References — 35
1
Introduction
Since 2008, RIVM regularly publishes estimates of the number of incident cases, disease burden and costs-of-illnesses of food-related disease on its web pages1 and since 2010 in publicly available reports
(e.g. [1-7]).
The health impact of food-related disease is expressed in Disability Adjusted Life Years (DALY) and cost-of-illness (COI). The methodology that is used to estimate the DALYs is described in detail in a peer-reviewed paper [8], and in the report from 2017 [6], when estimates were updated by using available RIVM laboratory surveillance data for Hepatitis-E virus and Cryptosporidum spp.; no negative trend correction for Giardia spp.; newly available European disability weights by
Haagsma et al. [9] and more recent life expectancy tables from the Global burden of disease (GBD) 2010 study [10]. The COI, expressed in euros for all 14 food-related pathogens, was calculated for the first time in 2011 [11] and equally updated in 2017 using more recent reference prices for health economic evaluations from the Dutch healthcare institute [12, 13]. The economic module was integrated to the existing disease burden model in 2011, and annual updates of both, disease burden and COI have followed [3-7].
In the current report, trend information from surveillance, demographic information and consumer price index (a measure for changes in price levels of consumer goods and services) were used to update the information to the year 2017.
2
Methods
2.1 Trend information
Data on the size and age distribution of the Dutch population, as well as mortality risks and the number of live births and stillbirths were
obtained from Statistics Netherlands2.
Table 1. Population in the Netherlands by age group, 2013-2017
Age group 2017 2016 2015 2014 2013 0 172,288 170,341 174,681 170,953 175,587 1-4 700,001 706,513 713,641 726,716 736,615 5-11 1,307,281 1,313,978 1,324,894 1,338,448 1,354,657 12-17 1,224,528 1,225,749 1,215,977 1,206,685 1,196,634 18-64 10,517,749 10,477,231 10,463,848 10,467,463 10,491,7378 65+ 3,159,660 3,085,308 3,007,685 2,919,024 2,824,345 Total 17,081,507 16,979,120 16,900,726 16,829,289 16,779,575
Table 2. Live births by age of mothers in the Netherlands, 2013-2017
Age of mother 2017* 2016 2015 2014 2013 -19 954 1,076 1,109 1,276 1,360 20-24 11,673 12,580 13,125 14,213 14,581 25-29 47,446 48,557 48,724 50,307 49,342 30-34 67,058 67,760 66,373 68,120 65,925 35-39 35,765 35,205 34,070 33,797 32,939 40-44 6,776 6,922 6,733 7,046 6,836 45+ 404 420 376 422 358 Total 170,076 172,520 170,510 175,181 171,341
* Estimates based on observed trend from 2014-2016
Trend information on the incidence of gastro-enteritis (GE) by pathogen in the general population and consulting the general practitioner was obtained from the following sources:
• Thermophilic Campylobacter spp.: RIVM laboratory surveillance; • Non-typhoidal Salmonella spp.: RIVM laboratory surveillance; • Shiga-toxin producing Escherichia coli O157 (STEC O157):
mandatory notification and active laboratory surveillance; • Perinatal and acquired listeriosis: mandatory notification and
active laboratory surveillance;
• Norovirus: estimated norovirus-associated hospitalized cases derived from RIVM laboratory surveillance;
• Rotavirus: RIVM laboratory surveillance;
• Hepatitis-A virus: mandatory notification and active laboratory surveillance;
• Hepatitis-E virus: RIVM laboratory surveillance data; Note this was adapted in 2017 [7] and is therefore different with earlier publications [1-6, 8, 11] where a stable incidence based on Borgen et al. [14] was assumed.
• Cryptosporidium spp.: RIVM laboratory surveillance data since
2013. Note this was adapted in 2017 [7] and is therefore
different with earlier publications [1-6, 8, 11] where a stable incidence was assumed since 2003.
• Giardia spp.: a stable incidence was assumed since 2007 (i.e. the
last year of RIVM laboratory surveillance data for Giardia spp.). Note this was adapted in 2017 [7] and is therefore different with earlier publications [1-6, 8, 11] where a continuing decrease with the rate of -1.03% per year observed between 2001 and 2007 was assumed.
• No trend information was available for the GE toxin-producing bacteria (Bacillus cereus, Clostridium perfringens and
Stapylococcus aureus), and toxoplasmosis. For the latter, trends
in reported fatalities are included.
Trends in hospitalizations for gastro-enteritis as primary cause (ICD codes 20-93; 558.9) were obtained from the Dutch Hospital Data (DHD) for 2011-2014. Since 2015 the number of hospitalized patients is
indirectly estimated from the observed time series of RIVM laboratory surveillance data (i.e. primarily tested faeces) of rotavirus, norovirus, campylobacteriosis and salmonellosis.
Excess mortality risks from campylobacteriosis and salmonellosis were assumed constant across the years. Fatalities due to listeriosis and STEC O157 were obtained from active surveillance. Age-specific case fatality ratios for norovirus and rotavirus, originally obtained from German surveillance data, and for protozoan pathogens, originally obtained from the international literature, were assumed constant throughout the years (changes in years of life lost therefore reflect changes in incidence on which mortality is based).
2.2 Disease burden
The method for DALY calculations was not changed since last year (i.e. the 2017-updates) [7].
2.3 Cost of illness
The method for COI estimates was not changed since the 2017-updates [7], only the cost prices used for the different resources had to be updated to 2017 euros using consumer price indexes as provided by Statistics Netherlands3. In order to allow comparison with earlier results
we also updated the earlier cost-of-illness estimates (i.e., 2012- 2016) to 2017 euros; hence all differences in the results for the year 2017 compared to earlier years will reflect the impact of trends in the underlying information on demographics and pathogen incidence.
2.4 Attribution
The fraction of human cases of enterically transmitted illness by five major pathways (food, environment, direct animal contact, human– human transmission, and travel) and by 11 groups within the food pathway was estimated using structured expert elicitation and is described in detail in Havelaar et al. [15]. The method for attribution was not changed since then.
3
Results
3.1 Trend information
Trend information for specific pathogens is presented in Table 3. A summary of trends (in comparison with 2016) is discussed below:
• The incidence of campylobacteriosis (laboratory confirmed cases) decreased from 38 cases per 100,000 inhabitants in 2016 to 33 cases per 100,000 inhabitants in 2017, showing a continuously decreasing trend since 2011.
• The incidence of salmonellosis (laboratory confirmed cases) is with 9 cases per 100,000 inhabitants lower than in 2016 (11 per 100,000 inhabitants), but similar to the years 2013-2015. • The incidence of cryptosporidiosis (laboratory confirmed cases)
decreased from 12 per 100,000 in 2016 to 8 per 100,000 in 2017.
• The incidence of gastroenteritis by rotavirus (laboratory confirmed cases) increased by ~60% to 16 per 100,000
inhabitants (10 per 100,000 inhabitants in 2016). The biannual trend of a low epidemic year being followed by a high epidemic year, and observed since 2013, seems to continue.
• The incidence of gastroenteritis by norovirus (laboratory confirmed cases) was with 23 cases per 100,000 inhabitants lower than in earlier years (e.g. 33 per 100,000 in habitants in 2016 and 27 per 100,000 inhabitants in 2015).
• The incidence of acquired listeriosis (laboratory confirmed cases, active surveillance) increased from 89 cases in 2016 to 112 cases in 2017. This was the highest number of acquired listerisosis cases so far ever recorded. The recorded fatalities was with 10 comparable with last year (i.e. 8 in 2016).
• In 2017 the incidence of perinatal listeriosis (laboratory confirmed cases, active surveillance) was 3 cases with 2 fatalities. This was lower than in 2016, with 7 cases and 4 fatalities, but similar to earlier years (i.e. 2014-2015).
• The incidence of diseases caused by STEC O157 (laboratory
confirmed cases, active surveillance) was 58 laboratory
confirmed cases of which 23 were hospitalized. The number of STEC O157 cases is slightly lower than in 2016 (64 cases). The number of HUS cases was with 2 in 2017 slightly lower than in 2016 with 3 cases.
• The incidence of hepatitis-A virus (notified cases) was 374 reported cases and 90 hospitalized cases (of 368 known cases) far higher than in earlier years (~ 80 cases in 2016 and 2015). This sharp increase is mainly due to an international outbreak in men-having sex with men (approximately 275 cases of the 374 cases).
• With 2 cases per 100,000 inhabitants was the incidence of
hepatitis-E virus (laboratory confirmed cases) lower than in 2016 and in 2015 (i.e. 3 cases per 100,000) but similar to 2014 (2 cases per 100,000 inhabitants).
• The number of patients that were admitted to the hospital due to GE was estimated to be 21,400 in 2017 and therefore slightly
higher than in 2016 (20,800). The observed increase in 2017 was mainly driven by the far higher number of rotavirus infections in 2017 compared to 2016.
Table 3. Trends in incidence per 100,000 inhabitants and reported cases, respectively, of food-related pathogens, 1999-2017
Year Caa Saa Crypa RVa NVa aLmb aLm
fata b pLm b pLm fatal b O157 b O157 hosp b HAV b HAV hosp b HEV a 1999 39 21 19 14 32 2000 42 20 16 13 43 2001 44 20 18 11 41 2002 41 15 17 12 49 2003 33 21 18 13 57 2004 40 16 15 13 37 2005 44 13 21 16 85 15 6 53 2006 40 16 26 17 59 17 5 1 40 258 39 2007 41 12 20 15 60 12 6 1 83 168 27 2008 39 16 27 18 51 6 1 1 45 183 35 2009 44 12 31 18 76 4 3 1 57 21 176 29 2010 50 14 35 23 73 13 4 1 51 21 262 52 0.8 2011 51 12 24 21 79 4 9 1 65 18 d 125 25 0.9 2012 49 21 20 26 c 71 8 6 0 85 31 e 121 28 1 2013 48 9 6 23 26 c 76 7 3 0 90 36 f 109 30 0.9 2014 48 9 6 9 25 c 92 9 4 2 79 31 g 105 23 2 2015 43 9 10 20 27 c 69 15 3 1 76 27 h 80 23 3 2016 38 11 12 10 33 c 89 8 7 4 64 21 i 81 22 3 2017 33 9 8 16 23 c 112 10 3 2 58 23 374j 90k 2 Used abbreviations:
Ca: Campylobacter spp. ; Sa: Salmonella spp.; Cryp: Cryptosporidium spp.; RV: rotavirus; NV: norovirus; aLm: acquired listeriosis; pLm: perinatal listeriosis: O157: STEC o157; HAV: hepatitis-A-virus; hosp: hospitalized; HEV: hepatitis-E-virus.
Notes:
a).per 100,000 inhabitants whereby presented numbers are rounded: ≥10 to two significant numbers (e.g. 12.5 = 12) and <10 to 1 significant number (e.g. 0.89=0.9); b) reported cases; c) estimated norovirus-associated hospitalized cases derived from RIVM laboratory surveillance data and therefore not directly comparable to numbers from before 2012; d) known for 57 of the 65 cases; e) known for 77 of the 85 cases; f) known for 84 of the 90 cases; g) known for 71 of the 79 cases; h) known for 68 of the 76 cases; i) known for 60 of the 64 cases; j) ~ 275 cases are (in)directly linked to an international outbreak in men-having sex with men; k) known for 368 of the 374 cases.
3.2 Number of incident cases
Ten of the selected pathogens (i.e. Campylobacter spp.; STEC O157;
Salmonella spp.; all three toxin-producing bacteria; norovirus;
rotavirus; Cryptosporidium spp.; Giardia spp.) cause acute GE. The other four pathogens (i.e. Listeria monocytogenes; Toxoplasma gondii; hepatitis-A virus; hepatitis-E virus) cause other diseases (e.g.
meningitis, sepsis, hepatitis). The estimated number of incident cases of gastroenteritis by pathogen in 2017 is presented in Table 4. The
estimated number of incident cases of diseases by non-gastrointestinal pathogens in 2017 is presented in Table 5. The number of incident cases by the 14 pathogens for the years 2012-2017 is presented in Figure 1 and in Table A.1 in Annex I.
There was an overall decrease of the estimated total number of
foodborne diseases due to the 14 pathogens from 1,720,000 in 2016 to 1,490,000 in 2017, a result mostly due to the lower number of incident cases of norovirus and cryptosporidiosis, and to a lesser extend due to salmonellosis and campylobacteriosis in 2017 compared to 2016. The incident cases of gastroenteritis due to rotavirus increased. The
estimated incidence of the remaining pathogens did not changed, mostly because no trend information based on surveillance data was available.
Table 4. Mean estimated number of incident cases and 95% uncertainty interval (between brackets) of gastroenteritis by pathogen in the Netherlands, 2017
Pathogen Number of incident cases# Fatal
cases#
General population
(x 1,000) (x 1,000) GP visit Hospitalised (x 1,000)
All causes 4830 223 21 NA#
(4000-5740) (71-524) - Bacteria – infectious Campylobacter spp. 67 16 1.1 49 (9.2-185) (7.9-30) (0.4-2.2) (32-69) STEC O157 2.1 0.08 0.02 4 (0.2-8.9) (0.02-0.3.1) (0.02-0.02) (2-7) Salmonella spp. 27 4.1 1.1 34 (2.5-84) (2.2-7.0) (0.5-2.1) (30-39)
Bacteria – toxin producing
Bacillus cereus 53 7.3 0.2 0 (19-121) (1.7-21) (0.1-0.5) - Clostridium perfringens 171 31 0.3 5 (61-356) (7.5-81) (0.1-0.6) (0-19) Staphylococcus aureus 287 40 1.5 7 (134-518) (12-94) (0.6-2.8) (0-28) Viruses Norovirus 515 12 1.8 56 (354-738) (6.8-19) (1.0-3.2) (24-110) Rotavirus 209 13 5.4 35 (107-366) (7.9-19) (3.9-7.2) (11-78) Protozoa Cryptosporidium spp. 69 4.2 0.6 4 (24-170) (2.0-7.5) (0.2-1.2) (0-19) Giardia spp. 83 7.5 0.4 2 (46-156) (3.9-13) (0.04-1.4) (0-9)
#Presented numbers are rounded: ≥ 100,000 to three significant numbers (e.g. 123,256 =
123,000); between <100,000 and ≥10 to two significant numbers (e.g. 1,325 = 1,300) and <10 to 1 significant number (e.g. 0.23=0.2). The presented numbers are estimates that rely on annual surveillance data being corrected for: i) coverage (where applicable); ii) underdiagnosis and underreporting; and iii) under-ascertainment (i.e. being sick without requiring medical help).
Table 5. Mean estimated number of incident cases and 95% uncertainty interval (between brackets) of non-gastrointestinal pathogen in the Netherlands, 2017
Pathogen Number of incident cases
mean (95% CI) mean (95% CI) Fatal cases
Listeria monocytogenes Perinatal 3 * 2 * Acquired 112 * 10 * Hepatitis-A virus# 1800 (1200-3000) 6 (4-10) Hepatitis-E virus# 1300 (750-2000) 15 (5-32) Toxoplasma gondii# Congenital 340 (180-600) 12 (8-19) Acquired** 420 (200-720) 0
*No uncertainty because Listeria cases were acquired through surveillance; **
chorioretinitis only. #The presented numbers are rounded: ≥10 to two significant numbers
(e.g. 1,325 = 1,300) and <10 to 1 significant number (e.g. 0.0023=0.002). The presented numbers are estimates that rely on annual surveillance data being corrected for: i) coverage (where applicable); ii) underdiagnosis and underreporting; and iii) under-ascertainment (i.e. being sick without requiring medical help).
Figure 1. Comparison of mean estimated number of incident cases of food-related pathogens, 2012- 2017
* Since the 2017-update new incidence estimates for hepatitis-E virus, Cryptosporidium spp. and Giardia spp. are used, why estimates presented here for 2012-2015 are different from the one presented in earlier publications (i.e. [3-6]).
The total number of deaths due to foodborne disease decreased from 270 in 2016 to 240 in 2017 (see Table A.2 in Annex).
3.3 Disease burden by pathogen
Table 6 presents the estimated burden of disease by pathogen for the year 2017 for the total Dutch population, as DALY per 100,000
inhabitants and as DALY per 1,000 cases, both undiscounted and discounted.
The total burden of disease of the 14 pathogens decreased by 1,000 DALY from 12,000 DALY in 2016 (Table A.3 in Annex) to 11,000 in 2017, and is the year with the lowest disease burden in the past six years. Large differences in burden of disease between 2016 and 2017 were found for rotavirus (+420 DALYs), Campylobacter (-500 DALYs), norovirus (-640 DALYs), Hepatitis E virus (-230 DALY) and Listeria infections (-170 DALYs). The largest burden at population level was caused by Campylobacter spp. (3,100 DALY) and Toxoplama gondii (1,900 DALYs) followed by Norovirus (1,600 DALYs). Perinatal listeriosis was the disease outcome with the highest individual burden among all pathogens (60 DALY per case), followed by congenital toxoplasmosis (5 DALY per case).
Table 6 Mean total DALY per year, DALY per 100,000 inhabitants and DALY per
1000 cases of illness in the Netherlands, 2017#
Pathogen DALY/year DALY per
100,000/year DALY per case
Discount rate 0% 1.5% 0% 1.5% 0% 1.5% Bacteria – infectious Campylobacter spp. 3,100 2,700 18 16 0.05 0.04 STEC O157 150 120 0.9 0.7 0.07 0.06 Salmonella spp. 1,200 1,100 7 6 0.05 0.04 L. monocytogenes (perinatal) 180 100 1 0.6 60 34 L. monocytogenes (acquired) 96 91 0.6 0.5 0.9 0.8 L. monocytogenes (total) 280 190 2 1 2 2
Bacteria – toxin producing
Bacillus cereus 32 32 0.2 0.2 0.001 0.001 Clostridium perfringens 200 190 1 1 0.001 0.001 Staphylococcus aureus 220 210 1 1 0.001 0.001 Viruses Norovirus 1,600 1,400 9 8 0.003 0.003 Rotavirus 1,100 960 6 6 0.005 0.005 Hepatitis-A virus 200 160 1 0.9 0.1 0.09 Hepatitis-E virus 510 410 3 2 0.4 0.3 Protozoa Cryptosporidium spp. 120 110 0.7 0.7 0.002 0.002 Giardia spp. 220 220 1 1 0.003 0.003 Toxoplasma gondii (congenital) 1,600 920 9 5 5 3 Toxoplasma gondii (acquired) 280 210 2 1 0.7 0.5
Toxoplasma gondii (total) 1,900 1,100 11 7 2 1
TOTAL 11,000 9,000 64 53
#Presented numbers are rounded: ≥ 100,000 to three significant numbers (e.g. 123,256 =
123,000); between <100,000 and ≥10 to two significant numbers (e.g. 1,325 = 1,300) and <10 to 1 significant number (e.g. 0.0023=0.002). The presented numbers are estimates that rely on annual surveillance data being corrected for: i) coverage (where applicable); ii) underdiagnosis and underreporting; and iii) under-ascertainment (i.e. being sick without requiring medical help).
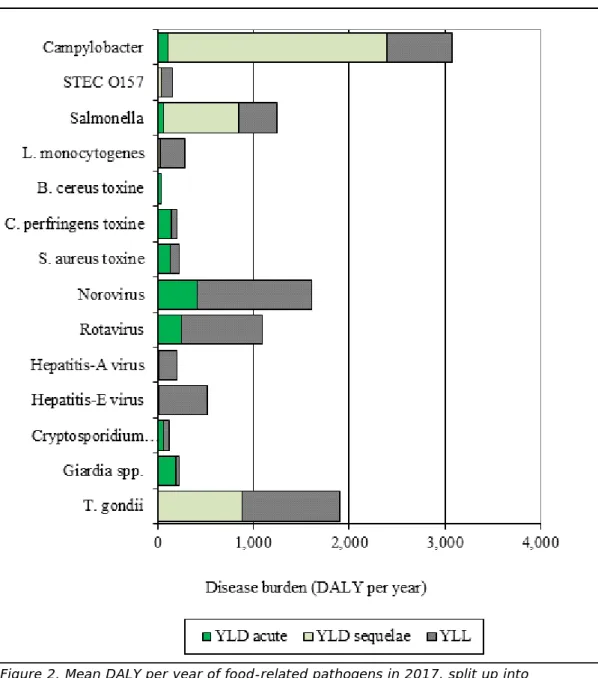
In Figure 2 we show per pathogen the contribution of years lived with disability (YLD) associated with acute infections, YLD associated with sequelae and years of life lost (YLL) due to premature mortality to total DALY. YLD associated with acute infections contributed 13% to the total disease burden; YLD associated with sequelae/residuals contributed 37% and YLL 50% of the total disease burden. The distribution between the different categories varied between pathogens, see Figure 2 for details.
Figure 2. Mean DALY per year of food-related pathogens in 2017, split up into YLD associated with acute infections; YLD associated with sequelae and YLL.
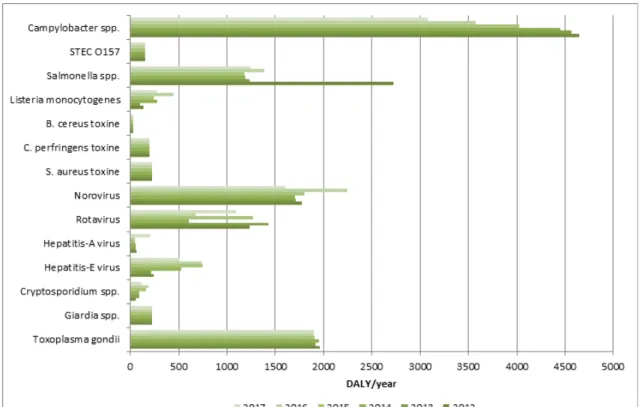
The mean disease burden by the 14 pathogens for the years 2012-2017 is presented in Figure 3 and in Table A.3 in Annex.
Figure 3. Comparison of disease burden (undiscounted DALYs) of food-related pathogens in 2012-2017
* Since the 2017-update new incidence estimates for hepatitis-E virus, Cryptosporidium spp. and Giardia spp. and new disability weights are used, why estimates presented here for 2012-2015 are different from the one presented in earlier publications (i.e. [3-6]). 3.4 Cost-of-illness by pathogen
The total COI was 45 €M lower in 2017 compared to 2016 (see Table A.4 in Annex) and was estimated at 391 M€ (discounted at 4%) in 2017 (Table 7 and Figures 4-5). The three pathogens causing the largest COI are norovirus (90 M€), rotavirus (61 M€) and GE due to Staphylococcus
aureus toxin (60 M€). The lowest contribution to the COI was by
hepatitis-A virus (2.9 M€). Predominated changes compared to 2016 were for norovirus 41 M€), rotavirus (+16 M€), Campylobacter spp. (-9 M€), and Cryptosporidium spp. (-8 M€). The average cost per case were largest for perinatal Listeria monocytogenes infections
Table 7 Estimated mean total costs of illness (COI), mean COI per 100,000 inhabitants and mean COI per case of illness in the Netherlands, 2017
Pathogen COI/year
(M€)* COI per 100,000 (k€)* COI per case (€)*
Discount rate 0% 4% 0% 4% 0% 4% Bacteria – infectious Campylobacter spp. 59 55 348 321 880 820 STEC O157 11 5.5 64 32 5,100 2,600 Salmonella spp. 21 19 122 113 760 710 L. monocytogenes (perinatal) 0.9 0.3 5 2 294,000 116,000 L. monocytogenes (acquired) 3.0 2.8 17 16 27,000 25,000 L. monocytogenes (total) 3.9 3.1 23 18 34,000 27,000
Bacteria – toxin producing
Bacillus cereus 11 11 64 64 210 210 Clostridium perfringens 29 29 169 169 170 170 Staphylococcus aureus 60 60 351 351 210 210 Viruses Norovirus 90 90 529 529 180 180 Rotavirus 61 61 355 355 290 290 Hepatitis-A virus 2.9 2.9 17 17 1,600 1,600 Hepatitis-E virus 5.8 5.8 34 34 4,600 4,600 Protozoa Cryptosporidium spp. 17 17 101 101 250 250 Giardia spp. 16 16 94 94 190 190 Toxoplasma gondii (congenital) 44 14 257 82 128,000 41,000 Toxoplasma gondii (acquired) 1.2 1.2 7 7 2,700 2,700 Toxoplasma gondii (total) 45 15 264 89 59,000 20,000 TOTAL 433 391 2530 2290
* Total COI per year are presented in million € (M€) and if less than 1 million rounded to 1 significant number (e.g. 0.0023 million =0.002). COI per 100,000 and COI per case are rounded: ≥ 100,000 to three significant numbers (e.g. 123,256 = 123,000 or 123 k€); between <100,000 and ≥10 to two significant numbers (e.g. 1,325 = 1,300 or 1.3 k€). The presented numbers are estimates that rely on annual surveillance data being corrected for: i) coverage (where applicable); ii) underdiagnosis and underreporting; and iii) under-ascertainment (i.e. being sick without requiring medical help).
In Figure 4 the mean COI per year was split up in healthcare costs, patient/family costs and costs in other sectors. The latest were mostly productivity losses of patients and caregivers being absent from work. Healthcare costs accounted for 23% of the total costs for the 14 pathogens, patient/family costs for 2% and costs in other sectors accounted for 75%. The distribution between the different cost categories varied between pathogens, as can be seen in Figure 4.
Figure 4. Mean cost-of-illness (discounted) per year of food-related pathogens in 2017, split up into healthcare costs, patient costs and costs in other sectors.
The mean COI estimates by the 14 pathogens for the years 2012-2017 is presented in Figure 3 and in Table A.4 in Annex.
Figure 5. Comparison of cost-of-illness (M€, discounted at 4% and expressed in 2017 euros) of food-related pathogens in 2012-2017*
* Since the 2017-update new incidence estimates for hepatitis-E virus, Cryptosporidium spp. and Giardia spp. and new reference prices as well as a shorter friction period are used, why estimates presented here for 2012-2015 are different from the one presented in earlier publications (i.e. [3-6]).
3.5 Attribution
The attribution results (expert elicitation) for DALYs and COI of foodborne diseases in 2017 are presented in Table 8 for the main pathways and in Table 9 for the different food groups. More details can be found in the Tables A.5–A.12 in Annex. Foodborne disease burden accounted for 39% of the total burden (i.e. 4,200 DALYs per year), and 42% of the total COI (i.e. 163 M€). About 54% of the foodborne burden was associated with meat (i.e. poultry, pork, beef & lamb). These foods
caused 32% of all food-related cases, indicating that the pathogens associated with these foods tend to cause more severe infections than pathogens associated with other foods.
The attribution results for incidence, number of fatal cases, DALYs and COI estimates of foodborne diseases for the years 2012-2017 are presented in Tables 10-13. There was an overall decrease in foodborne infections from 2016 to 2017. The foodborne disease burden decreased by 500 DALYs from 4,700 DALYs in 2016 to 4,200 DALYs in 2017 and the COI decreased by 10 M€ from 173 M€ in 2016 to 163 M€ in 2017.
diseasea to the major transmission pathways in the Netherlands, 2017
Main pathway Food Environment Human Animal Travel Total
Number of incident cases ( per year) b 629,000 181,000 476,000 77,000 125,000 1,490,000
Number of fatal cases (per year) b 83 40 67 21 30 240
Disease burden (DALY, undiscounted)) b 4,200 2,200 2,200 1,000 1,300 11,000
Disease burden (DALY, discounted (1.5%)) b 3,400 1,700 1,900 870 1,100 9,000
Cost of illness (M€, undiscounted) c 185 70 108 30 40 433
Cost of illness (M€, discounted (4%)) c 163 57 107 27 38 391
a) Due to the 14 pathogens included in this study
b) Presented numbers are rounded: ≥ 100,000 to three significant numbers (e.g. 123,256 = 123,000); between <100,000 and ≥10 to two significant numbers (e.g. 1,325 = 1,300) and <10 to 1 significant number (e.g. 0.0023=0.002). The presented numbers are estimates that rely on annual surveillance data being corrected for: i) coverage (where applicable); ii) underdiagnosis and underreporting; and iii) under-ascertainment (i.e. being sick without requiring medical help).
Table 9 Attribution of the mean incidence, fatalities, disease burden and cost-of-illness of foodlborne diseasea to food group in the
Netherlands, 2017
Food groups Beef &
Lamb Pork Poultry Eggs Dairy shellfish Fish& Produce Beverages Grains Other foods Humans & animals
Total
Number of incident
cases ( per year) b 107,000 43,000 52,000 20,000 53,000 50,000 37,000 15,000 39,000 119,000 94,000 629,000
Number of fatal cases
(per year) b 9 11 16 6 7 7 6 2 3 5 11 83
Disease burden (DALY,
undiscounted)) b 550 810 900 220 310 300 280 77 120 230 420 4,200
Disease burden (DALY,
discounted (1.5%)) b 420 560 780 190 250 250 230 67 110 200 350 3,400
Cost of illness (M€,
undiscounted)c 29 24 23 7 15 13 11 4 9 26 23 185
Cost of illness (M€,
discounted (4%)) c 24 16 21 6 14 12 10 4 9 26 21 163
a) Due to the 14 pathogens included in this study
b) Presented numbers are rounded: ≥ 100,000 to three significant numbers (e.g. 123,256 = 123,000); between <100,000 and ≥10 to two significant numbers (e.g. 1,325 = 1,300) and <10 to 1 significant number (e.g. 0.0023=0.002). The presented numbers are estimates that rely on annual surveillance data being corrected for: i) coverage (where applicable); ii) underdiagnosis and underreporting; and iii) under-ascertainment (i.e. being sick without requiring medical help).
Pathogen Incidence/yeara 2012b 2013b 2014b 2015b 2016 2017 Campylobacter spp. 43,000 42,000 41,000 37,000 33,000 28,000 STEC O157 860 860 860 860 860 860 Salmonella spp. 33,000 15,000 15,000 15,000 18,000 15,000 Listeria monocytogenes 50 55 66 50 66 80 B. cereus toxine 45,000 46,000 46,000 46,000 47,000 47,000 C. perfringens toxine 154,000 153,000 154,000 154,000 154,000 155,000 S. aureus toxine 254,000 253,000 252,000 251,000 250,000 251,000 Norovirus 103,000 99,000 98,000 103,000 128,000 86,000 Rotavirus 34,000 39,000 16,000 34,000 18,000 27,000 Hepatitis-A virus 68 61 59 45 45 55 Hepatitis-E virus 85 74 180 260 260 180 Cryptosporidium spp. 3,300 6,200 6,200 11,000 13,000 8,200 Giardia spp. 11,000 11,000 11,000 11,000 11,000 11,000 Toxoplasma gondii 440 430 430 430 430 430 Total 682,000 665,000 640,000 663,000 673,000 629,000
a) Presented numbers are rounded: ≥ 100,000 to three significant numbers (e.g. 123,256 = 123,000); between <100,000 and ≥10 to two significant numbers (e.g. 1,325 = 1,300) and <10 to 1 significant number (e.g. 0.0023=0.002). The presented numbers are estimates that rely on annual surveillance data being corrected for: i) coverage (where applicable); ii) underdiagnosis and underreporting; and iii) under-ascertainment (i.e. being sick without requiring medical help).
b) Since the 2017-update new incidence estimates for hepatitis-E virus, Cryptosporidium spp. and Giardia spp. are used, why estimates presented here for 2012-2015 are different from the one presented in earlier publications (i.e. [3-6]).
Table 11 Attribution of mean number of fatal cases to food in the Netherlands for 2012-2017, total and by pathogen
Pathogen Number of fatal cases /year
2012a 2013a 2014a 2015a 2016 2017 Campylobacter spp. 33 32 30 27 24 21 STEC O157 2 2 2 2 2 2 Salmonella spp. 36 16 15 15 18 19 Listeria monocytogenes 6 5 8 11 8 8 B. cereus toxine 0 0 0 0 0 0 C. perfringens toxine 4 4 4 4 4 4 S. aureus toxine 6 6 6 6 6 6 Norovirus 10 10 10 11 14 9 Rotavirus 5 6 3 6 3 5 Hepatitis-A virus 0 0 0 0 0 0 Hepatitis-E virus 1 1 2 3 3 2 Cryptosporidium spp. 0 0 0 1 1 1 Giardia spp. 0 0 0 0 0 0 Toxoplasma gondii 7 7 7 7 7 7 Total 111 90 88 93 90 83
a)Since the 2017-update new incidence estimates for hepatitis-E virus, Cryptosporidium spp. and Giardia spp. are used, why estimates presented here for 2012-2015 are different from the one presented in earlier publications (i.e. [3-6]).
by pathogen Pathogen DALY(undiscounted)/yeara 2012b 2013b 2014b 2015b 2016 2017 Campylobacter spp. 2,000 1,900 1,900 1,700 1,500 1,300 STEC O157 60 61 61 61 61 61 Salmonella spp. 1,500 670 650 640 760 680 Listeria monocytogenes 90 68 190 170 310 190 B. cereus toxine 28 28 28 28 28 29 C. perfringens toxine 180 180 180 180 180 180 S. aureus toxine 190 190 190 190 190 190 Norovirus 300 290 280 300 380 270 Rotavirus 160 190 78 170 88 140 Hepatitis-A virus 7 7 6 5 5 6 Hepatitis-E virus 34 30 73 100 100 70 Cryptosporidium spp. 10 11 11 19 22 14 Giardia spp. 30 29 29 29 29 29 Toxoplasma gondii 1,100 1,100 1,100 1,100 1,100 1,100 Total 5,600 4,700 4,700 4,600 4,700 4,200
a) Presented numbers are rounded: ≥ 100,000 to three significant numbers (e.g. 123,256 = 123,000); between <100,000 and ≥10 to two significant numbers (e.g. 1,325 = 1,300) and <10 to 1 significant number (e.g. 0.0023=0.002). The presented numbers are estimates that rely on annual surveillance data being corrected for: i) coverage (where applicable); ii) underdiagnosis and underreporting; and iii) under-ascertainment (i.e. being sick without requiring medical help).
b) Since the 2017-update new incidence estimates for hepatitis-E virus, Cryptosporidium spp. and Giardia spp. are used, why estimates presented here for 2012-2015 are different from the one presented in earlier publications (i.e. [3-6]).
Table 13– Attribution of mean COI (M€/year discounted at 4% and expressed in 2017 euros) to food in the Netherlands for 2012-2017, total and by pathogen
Pathogen COI per year (4%)/yeara
(Million €, expressed in 2017 euros)
2012b 2013b 2014b 2015b 2016 2017 Campylobacter spp. 34 33 33 30 27 23 STEC O157 2 2 2 2 2 2 Salmonella spp. 20 11 10 11 12 11 Listeria monocytogenes 2 2 2 2 2 2 B. cereus toxine 9 9 10 10 10 10 C. perfringens toxine 26 26 26 26 26 26 S. aureus toxine 53 53 53 52 52 52 Norovirus 18 17 17 18 22 15 Rotavirus 9 11 5 9 6 8 Hepatitis-A virus 0.1 0.1 0.09 0.07 0.07 0.3 Hepatitis-E virus 0.4 0.3 0.8 1 1 0.8 Cryptosporidium spp. 1 2 2 3 3 2 Giardia spp. 2 2 2 2 2 2 Toxoplasma gondii 9 9 9 8 8 8 Total 187 177 171 174 173 163
a) Total COI per year are presented in million € (M€) and if less than 1 million rounded to 1 significant number (e.g. 0.0023 million =0.002). The presented numbers are estimates that rely on annual surveillance data being corrected for: i) coverage (where applicable); ii) underdiagnosis and underreporting; and iii) under-ascertainment (i.e. being sick without requiring medical help).
b) Since the 2017-update new incidence estimates for hepatitis-E virus, Cryptosporidium spp. and Giardia spp. and new reference prices as well as a shorter friction period are used, why estimates presented here for 2012-2015 are different from the one presented in earlier publications (i.e. [3-6]).
4
Discussion
Although we observed an increasing trend in number of incident cases, disease burden and cost-of-illness for rotavirus and hepatitis-A virus, the overall estimated disease burden of 14 enteric pathogens in 2017 is lower than in 2016 (11,000 DALYs versus 12,000 DALYs), in fact, netto, a continuing decrease since 2012. The share of foodborne transmission is about 40%, and decreased from 4,700 DALYs in 2016 to 4,200 DALYs in 2017, i.e. the lowest burden since 2012. Both the overall COI and the foodborne-related COI show a decreasing trend over the years, and were lowest since 2012. However, to what extent/in how far/whether this trend will continue is speculative as for example, the drop of norovirus-associated COI was in 2017 partly compensated by a sharp increase in rotavirus-associated costs-of-illnesses.
5
References
1. Havelaar, A.H., I.H. Friesema, and W. Van Pelt, Disease burden
of food-related pathogens in the Netherlands, 2010. 2012,
National Institute of Public Health and the Environment: Bilthoven. RIVM Letter report 330331004/2012
2. Bouwknegt, M., et al., Disease burden of food-related pathogens
in the Netherlands, 2011. 2012, National Institute of Public
Health and the Environment: Bilthoven. RIVM Letter Report 330331006/2013
3. Bouwknegt, M., et al., Disease burden of food-related pathogens
in the Netherlands, 2012. 2013, National Institute of Public
Health and the Environment: Bilthoven. 330331009/2013
4. Bouwknegt, M., et al., Disease burden of food-related pathogens
in the Netherlands, 2013. 2017, National Institute of Public
Health and the Environment: Bilthoven. RIVM Letter Report 2014-0115.
5. Bouwknegt, M., et al., Disease burden of food-related pathogens
in the Netherlands, 2014. 2017, National Institute of Public
Health and the Environment: Bilthoven. RIVM Letter Report 2017-0061.
6. Mangen, M.J.J., et al., Disease burden of food-related pathogens
in the Netherlands, 2015. 2017, National Institute of Public
Health and the Environment: Bilthoven. RIVM Letter Report 2017-0060.
7. Mangen, M.J., et al., Disease burden of food-related pathogens in
the Netherlands, 2016. 2017, National Institute of Public Health
and the Environment: Bilthoven. RIVM Letter Report 2017-0097. 8. Havelaar, A.H., et al., Disease burden of foodborne pathogens in
the Netherlands, 2009. Int J Food Microbiol, 2012. 156(3): p.
231-8.
9. Haagsma, J.A., et al., Assessing disability weights based on the
responses of 30,660 people from four European countries. Popul
Health Metr, 2015. 13: p. 10.
10. WHO, WHO methods and data sources for global burden of
disease estimates 2000-2011. 2013, World Health Organization
(WHO) - Department of Health Statistics and Information Systems: Geneva.
11. Mangen, M.J., et al., Cost-of-illness and disease burden of
food-related pathogens in the Netherlands, 2011. Int J Food Microbiol,
2015. 196: p. 84-93.
12. ZIN, Richtlijn voor het uitvoeren van economische evaluaties in
de gezondheidszorg. 2015, Zorginstituut Nederland.
13. ZIN, Kostenhandleiding: Methodologie van kostenonderzoek en
referentieprijzen voor economische evaluaties in de gezondheidszorg. 2015, Zorginstituut Nederland (ZIN).
14. Borgen, K., et al., Non-travel related Hepatitis E virus genotype 3
infections in the Netherlands; a case series 2004 - 2006. BMC
15. Havelaar, A.H., et al., Attribution of Foodborne Pathogens Using
Structured Expert Elicitation. Foodborne Pathogens and Disease,
6
Annex: Detailed results
Table A.1 – Mean number of incident cases by pathogen in the Netherlands, 2012-2017
Pathogen Estimated mean number of incident cases/yeara
2012b 2013 b 2014 b 2015 b 2016 2017 Campylobacter spp. 102,000 100,000 98,000 89,000 79,000 67,000 STEC O157 2,100 2,100 2,100 2,100 2,100 2,100 Salmonella spp. 61,000 28,000 28,000 27,00 32,000 27,000 Listeria monocytogenes 77 79 96 72 96 115 B. cereus toxine 51,000 51,000 52,000 52,000 52,000 53,000 C. perfringens toxine 170,000 170,000 170,000 170,000 171,000 171,000 S. aureus toxine 291,000 290,000 288,000 288,000 287,000 287,000 Norovirus 617,000 592,000 585,000 615,000 765,000 515,000 Rotavirus 258,000 297,000 124,000 261,000 138,000 209,000 Hepatitis-A virus 590 530 510 390 400 1,800 Hepatitis-E virus 620 540 1,300 1,900 1,900 1,300 Cryptosporidium spp. 28,000 52,000 52,000 92,000 109,000 69,000 Giardia spp. 86,000 85,000 84,000 84,000 83,000 83,000 Toxoplasma gondii 780 770 780 770 770 770 Total 1,670,000 1,670,000 1,490,000 1,680,000 1,720,000 1,490,000
a) Presented numbers are rounded: ≥ 100,000 to three significant numbers (e.g. 123,256 = 123,000); between <100,000 and ≥10 to two significant numbers (e.g. 1,325 = 1,300) and <10 to 1 significant number (e.g. 0.0023=0.002). The presented numbers are estimates that rely on annual surveillance data being corrected for: i) coverage (where applicable); ii) underdiagnosis and underreporting; and iii) under-ascertainment (i.e. being sick without requiring medical help). There is one exception, Listeria monocytogenes which are acquired through surveillance.
b) Since the 2017-update new incidence estimates for hepatitis-E virus, Cryptosporidium spp. and Giardia spp. are used, why estimates presented here for 2012-2015 are different from the one presented in earlier publications (i.e. [3-6]).
Table A.2 – Mean number of fatal cases by pathogen in the Netherlands, 2012-2017
Pathogen Estimated mean number of fatal cases/yeara
2012b 2013b 2014b 2015b 2016 2017 Campylobacter spp. 78 77 72 65 57 49 STEC O157 4 4 4 4 4 4 Salmonella spp. 67 30 28 28 32 34 Listeria monocytogenes 8 7 11 16 12 12 B. cereus toxine 0 0 0 0 0 0 C. perfringens toxine 5 5 5 5 5 5 S. aureus toxine 7 7 7 7 7 7 Norovirus 60 59 60 65 82 56 Rotavirus 40 47 20 43 23 35 Hepatitis-A virus 2 2 2 1 1 6 Hepatitis-E virus 7 6 15 22 21 15 Cryptosporidium spp. 2 3 3 6 7 4 Giardia spp. 2 2 2 2 2 2 Toxoplasma gondii 13 12 12 12 12 12 Total 290 260 240 280 270 240
a) Presented numbers are rounded: ≥10 to two significant numbers (e.g. 1,325 = 1,300) and <10 to 1 significant number (e.g. 0.0023=0.002). The presented numbers are estimates that rely on annual surveillance data being corrected for: i) coverage (where applicable); ii)
underdiagnosis and underreporting; and iii) under-ascertainment (i.e. being sick without requiring medical help). There is one exception,
Listeria monocytogenes which are acquired through surveillance.
b) Since the 2017-update new incidence estimates for hepatitis-E virus, Cryptosporidium spp. and Giardia spp. are used, why estimates presented here for 2012-2015 are different from the one presented in earlier publications (i.e. [3-6]).
Table A.3 – Mean estimated disease burden (undiscounted DALY/year) in the Netherlands for the years 2012- 2017, total and by pathogen Pathogen DALY(undiscounted)/yeara 2012b 2013b 2014b 2015b 2016 2017 Campylobacter spp. 4,600 4,600 4,500 4,000 3,600 3,100 STEC O157 150 150 150 150 150 150 Salmonella spp. 2,700 1,200 1,200 1,200 1,400 1,200 Listeria monocytogenes 140 98 280 240 450 280 B. cereus toxine 31 31 31 32 32 32 C. perfringens toxine 200 200 200 200 200 200 S. aureus toxine 220 220 220 220 220 220 Norovirus 1,800 1,700 1,700 1,800 2,200 1,600 Rotavirus 1,200 1,400 600 1,300 670 1,100 Hepatitis-A virus 65 59 57 43 44 200 Hepatitis-E virus 240 210 530 740 740 510 Cryptosporidium spp. 53 92 91 160 190 120 Giardia spp. 230 230 220 220 220 220 Toxoplasma gondii 2,000 1,900 2,000 1,900 1,900 1,900 Total 14,000 12,000 12,000 12,000 12,000 11,000
a) Presented numbers are rounded to two significant numbers (e.g. 1,325 = 1,300). The presented numbers are estimates that rely on annual surveillance data being corrected for: i) coverage (where applicable); ii) underdiagnosis and underreporting; and iii) under-ascertainment (i.e. being sick without requiring medical help).
b) Since the 2017-update new incidence estimates for hepatitis-E virus, Cryptosporidium spp. and Giardia spp. and new disability weights are used, why estimates presented here for 2012-2015 are different from the one presented in earlier publications (i.e. [3-6]).
Table A.4– Mean discounted COI (4%) in million euros in the Netherlands for 2012-2017, total and by pathogen
Pathogen COI per year (4%)/yeara
(Million €, expressed in 2017 euros)
2012b 2013b 2014b 2015b 2016 2017 Campylobacter spp. 80 79 78 71 64 55 STEC O157 6 6 6 6 6 6 Salmonella spp. 37 20 19 19 21 19 Listeria monocytogenes 4 3 3 3 3 3 B. cereus toxine 11 11 11 11 11 11 C. perfringens toxine 29 29 29 29 29 29 S. aureus toxine 61 61 60 60 60 60 Norovirus 107 103 101 107 132 90 Rotavirus 73 81 41 73 45 61 Hepatitis-A virus 0.9 0.8 0.8 0.6 0.6 3 Hepatitis-E virus 3 2 6 9 8 6 Cryptosporidium spp. 9 14 13 22 26 17 Giardia spp. 17 16 16 16 16 16 Toxoplasma gondii 16 15 16 15 15 15 Total 452 440 399 440 436 391
a) COI per year are presented in million € (M€) and if less than 1 million rounded to 1 significant number (e.g. 0.0023 million =0.002). The presented numbers are estimates that rely on annual surveillance data being corrected for: i) coverage (where applicable); ii) underdiagnosis and underreporting; and iii) under-ascertainment (i.e. being sick without requiring medical help).
b) Since the 2017-update new incidence estimates for hepatitis-E virus, Cryptosporidium spp. and Giardia spp. and new reference prices as well as a shorter friction period are used, why estimates presented here for 2012-2015 are different from the one presented in earlier publications (i.e. [3-6]).
Table A.5 – Attribution of mean estimated number of incident cases by pathogen to main pathways in the Netherlands, 2017 a
Main pathway Food Environment Human Animal Travel Total
Campylobacter spp. 28,000 14,000 4,200 13,000 8,100 67,000 STEC O157 860 370 220 440 250 2,140 Salmonella spp. 15,000 3,500 2,600 2,500 3,900 27,000 Listeria monocytogenes 80 8 6 6 15 120 B. cereus toxine 47,000 580 630 580 3,800 53,000 C. perfringens toxine 155,000 3,800 3,600 3,600 5,500 171,000 S. aureus toxine 251,000 10,000 9,000 6,300 11,000 287,000 Norovirus 86,000 73,000 285,000 26,000 45,000 515,000 Rotavirus 27,000 35,000 121,000 6,300 19,000 209,000 Hepatitis-A virus 55 54 1,400 0 290 1,800 Hepatitis-E virus 180 320 97 140 550 1,300 Cryptosporidium spp. 8,200 19,000 19,000 9,200 13,000 69,000 Giardia spp. 11,000 20,000 29,000 8,900 15,000 83,000 Toxoplasma gondii 430 280 7 19 35 770 Total 629,000 181,000 476,000 77,000 125,000 1,490,000
a) Presented numbers are rounded: ≥ 100,000 to three significant numbers (e.g. 123,256 = 123,000); between <100,000 and ≥10 to two significant numbers (e.g. 1,325 = 1,300) and <10 to 1 significant number (e.g. 0.0023=0.002). The presented numbers are estimates that rely on annual surveillance data being corrected for: i) coverage (where applicable); ii) underdiagnosis and underreporting; and iii) under-ascertainment (i.e. being sick without requiring medical help).
Table A.6 – Attribution of mean estimated number of fatal cases to main pathways in the Netherlands, 2017 a
Main pathway Food Environment Human Animal Travel Total
Campylobacter spp. 21 10 3 9 6 49 STEC O157 2 0.7 0.4 0.8 0.5 4 Salmonella spp. 19 4 3 3 5 34 Listeria monocytogenes 8 0.8 0.6 0.6 2 12 B. cereus toxine 0 0 0 0 0 0 C. perfringens toxine 4 0.1 0.1 0.1 0.1 5 S. aureus toxine 6 0.3 0.2 0.2 0.3 7 Norovirus 9 8 31 3 5 56 Rotavirus 5 6 21 1 3 35 Hepatitis-A virus 0.2 0.2 5 0 0.9 6 Hepatitis-E virus 2 4 1 2 6 15 Cryptosporidium spp. 0.5 1 1 0.6 0.8 4 Giardia spp. 0.3 0.6 0.8 0.2 0.4 2 Toxoplasma gondii 7 4 0.1 0.3 0.6 12 Total 83 40 67 21 30 240
a) Presented numbers are rounded: ≥10 to two significant numbers (e.g. 1,325 = 1,300) and <10 to 1 significant number (e.g. 0.0023=0.002). The presented numbers are estimates that rely on annual surveillance data being corrected for: i) coverage (where applicable); ii)
Table A.7 – Attribution of mean disease burden (DALY per year, undiscounted) to main pathways in the Netherlands, 2017a
Main pathway Food Environment Human Animal Travel Total
Campylobacter spp. 1,300 630 190 590 370 3,100 STEC O157 61 26 15 31 18 150 Salmonella spp. 680 160 120 110 170 1,200 Listeria monocytogenes 190 18 15 15 37 280 B. cereus toxine 29 0 0 0 2 32 C. perfringens toxine 180 4 4 4 6 200 S. aureus toxine 190 8 7 5 8 220 Norovirus 270 230 890 81 140 1,600 Rotavirus 140 190 640 33 98 1,100 Hepatitis-A virus 6 6 160 0 32 200 Hepatitis-E virus 70 130 39 55 220 510 Cryptosporidium spp. 14 33 33 16 23 120 Giardia spp. 29 53 76 24 39 220 Toxoplasma gondii 1,100 690 17 48 88 1,900 Total 4,200 2,200 2,200 1,000 1,300 11,000
a) Presented numbers are rounded: ≥10 to two significant numbers (e.g. 1,325 = 1,300) and <10 to 1 significant number (e.g. 0.0023=0.002). The presented numbers are estimates that rely on annual surveillance data being corrected for: i) coverage (where applicable); ii)
Table A.8 – Attribution of mean cost-of-illness (M€ per year, discounted at 4% and in 2017 euros) to main pathways in the Netherlands, 2017
Main pathway Food Environment Human Animal Travel Total
Campylobacter spp. 23 11 4 11 7 55 STEC O157 2 1 0.6 1 0.6 6 Salmonella spp. 11 3 2 2 3 19 Listeria monocytogenes 2 0.2 0.2 0.2 0.4 3 B. cereus toxine 10 0.1 0.1 0.1 0.8 11 C. perfringens toxine 26 0.6 0.6 0.6 0.9 29 S. aureus toxine 52 2 2 1 2 60 Norovirus 15 13 50 5 8 90 Rotavirus 8 10 35 2 5 61 Hepatitis-A virus 0.1 0.1 2 0.0 0.5 3 Hepatitis-E virus 0.8 2 0.4 0.6 3 6 Cryptosporidium spp. 2 5 5 2 3 17 Giardia spp. 2 4 6 2 3 16 Toxoplasma gondii 9 6 0.1 0.4 0.7 15 Total 163 57 107 27 38 391
a) COI per year are presented in million € (M€) and if less than 1 million rounded to 1 significant number (e.g. 0.0023 million =0.002). The presented numbers are estimates that rely on annual surveillance data being corrected for: i) coverage (where applicable); ii) underdiagnosis and underreporting; and iii) under-ascertainment (i.e. being sick without requiring medical help).
Table A.9 – Attribution of mean incidence by pathogen to food groups in the Netherlands, 2017a Food groups Beef &
Lamb Pork Poultry Eggs Dairy shellfish Fish& Produce Beverages Grains Other foods Humans & animals Total Campylobacter spp. 1,200 1,400 15,000 880 2,500 2,000 1,500 480 650 930 1,500 28,000 STEC O157 380 55 27 18 64 25 61 31 25 30 150 860 Salmonella spp. 1,900 2,100 2,200 3,300 990 610 940 460 640 900 850 15,000 Listeria monocytogenes 9 7 5 3 20 14 6 2 5 4 4 80 B. cereus toxine 3,400 1,600 750 1,700 2,700 940 940 800 7,900 25,000 1,100 47,000 C. perfringens toxine 74,000 13,000 11,000 4,300 6,400 10,000 11,000 3,900 4,000 12,000 5,600 155,000 S. aureus toxine 19,000 20,000 20,000 8,300 37,000 15,000 5,000 4,500 19,000 74,000 30,000 251,000 Norovirus 2,800 2,700 2,500 1,600 1,700 13,000 6,300 2,700 4,500 4,300 44,000 86,000 Rotavirus 0 760 0 0 460 5,300 6,500 1,200 2,000 1,200 9,700 27,000 Hepatitis-A virus 0 0 0 0 0 7 7 2 2 2 35 55 Hepatitis-E virus 0 130 0 0 0 9 13 6 0 0 18 180 Cryptosporidium spp. 2,100 360 240 220 750 1,800 1,700 250 0 250 500 8,200 Giardia spp. 2,100 520 330 0 830 1,400 3,600 350 0 360 1,300 11,000 Toxoplasma gondii 98 220 21 0 20 16 25 0 0 10 24 430 Total 107,000 43,000 52,000 20,000 53,000 50,000 37,000 15,000 39,000 119,000 94,000 629,000 a) Presented numbers are rounded: ≥ 100,000 to three significant numbers (e.g. 123,256 = 123,000); between <100,000 and ≥10 to two
significant numbers (e.g. 1,325 = 1,300) and <10 to 1 significant number (e.g. 0.0023=0.002). The presented numbers are estimates that rely on annual surveillance data being corrected for: i) coverage (where applicable); ii) underdiagnosis and underreporting; and iii) under-ascertainment (i.e. being sick without requiring medical help).
Table A.10 – Attribution of mean number of fatal cases by pathogen to food groups in the Netherlands, 2017a
Food groups Beef
& lamb
Pork Poultry Eggs Dairy Fish & shellfish
Produce Beverages Grains Other
foods Humans & animals Total Campylobacter spp. 0.8 1 11 0.6 2 1 1 0.4 0.5 0.7 1 21 STEC O157 0.7 0.1 0.1 0.0 0.1 0.0 0.1 0.1 0.0 0.1 0.3 2 Salmonella spp. 2 3 3 4 1 0.8 1 0.6 0.8 1 1 19 Listeria monocytogenes 0.9 0.8 0.5 0.3 2 1 0.6 0.2 0.5 0.5 0.4 8 B. cereus toxine 0.0 0.0 0.0 0.0 0.0 0.0 0.0 0.0 0.0 0.0 0.0 0.0 C. perfringens toxine 2 0.3 0.3 0.1 0.2 0.3 0.3 0.1 0.1 0.3 0.1 4 S. aureus toxine 0.5 0.5 0.5 0.2 0.9 0.4 0.1 0.1 0.5 2 0.7 6 Norovirus 0.3 0.3 0.3 0.2 0.2 1 0.7 0.3 0.5 0.5 5 9 Rotavirus 0.0 0.1 0.0 0.0 0.1 0.9 1 0.2 0.3 0.2 2 5 Hepatitis-A virus 0.0 0.0 0.0 0.0 0.0 0.0 0.0 0.0 0.0 0.0 0.1 0.2 Hepatitis-E virus 0.0 2 0.0 0.0 0.0 0.1 0.2 0.1 0.0 0.0 0.2 2 Cryptosporidium spp. 0.1 0.0 0.0 0.0 0.0 0.1 0.1 0.0 0.0 0.0 0.0 1 Giardia spp. 0.1 0.0 0.0 0.0 0.0 0.0 0.1 0.0 0.0 0.0 0.0 0.3 Toxoplasma gondii 2 3 0.3 0.0 0.3 0.2 0.4 0.0 0.0 0.2 0.4 7 Total 9 11 16 6 7 7 6 2 3 5 11 83
a) Presented numbers are rounded: ≥10 to two significant numbers (e.g. 1,325 = 1,300) and <10 to 1 significant number (e.g. 0.0023=0.002). The presented numbers are estimates that rely on annual surveillance data being corrected for: i) coverage (where applicable); ii)
Table A.11 – Attribution of mean disease burden (DALY per year, undiscounted) by pathogen to food groups in the Netherlands, 2017 a Food groups Beef &
Lamb Pork Poultry Eggs Dairy shellfish Fish& Produce Beverages Grains Other foods Humans & animals Total Campylobacter spp. 53 66 700 40 115 90 68 22 30 43 68 1,300 STEC O157 27 4 2 1 5 2 4 2 2 2 10 61 Salmonella spp. 85 97 100 150 45 28 43 21 29 41 38 680 Listeria monocytogenes 21 18 13 7 47 34 14 5 11 11 9 190 B. cereus toxine 2 1 0.5 1 2 0.6 0.6 0.5 5 15 0.7 29 C. perfringens toxine 85 15 13 5 7 12 12 4 5 14 6 180 S. aureus toxine 14 16 15 6 28 11 4 3 14 57 23 190 Norovirus 9 8 8 5 5 42 20 8 14 13 140 270 Rotavirus 0 4 0 0 2 28 34 6 11 6 51 140 Hepatitis-A virus 0 0 0 0 0 0.8 0.8 0.3 0.3 0.2 4 6 Hepatitis-E virus 0 52 0 0 0 3 5 2 0 0 7 70 Cryptosporidium spp. 4 0.6 0.4 0.4 1 3 3 0.4 0 0.4 1 14 Giardia spp. 6 1 0.9 0 2 4 9 0.9 0 0.9 4 29 Toxoplasma gondii 240 530 51 0 49 39 62 0 0 24 61 1,100 Total 550 810 900 220 310 300 280 77 120 230 420 4,200
a) Presented numbers are rounded: ≥10 to two significant numbers (e.g. 1,325 = 1,300) and <10 to 1 significant number (e.g. 0.0023=0.002). The presented numbers are estimates that rely on annual surveillance data being corrected for: i) coverage (where applicable); ii)
Table A.12 – Attribution of mean cost-of-illness (M€ per year, discounted at 4% and expressed in 2017 euros) by pathogen to food
groups in the Netherlands, 2017a
Food groups Beef &
Lamb Pork Poultry Eggs Dairy shellfish Fish& Produce Beverages Grains Other foods Humans & animals Total Campylobacter spp. 0.9 1 12 0.7 2 2 1 0.4 0.5 0.8 1 23 STEC O157 1.0 0.1 0.07 0.05 0.2 0.06 0.2 0.08 0.06 0.08 0.4 2 Salmonella spp. 1 2 2 2 0.7 0.4 0.7 0.3 0.5 0.6 0.6 11 Listeria monocytogenes 0.2 0.2 0.1 0.08 0.5 0.4 0.2 0.06 0.1 0.1 0.1 2 B. cereus toxine 0.7 0.3 0.2 0.4 0.6 0.2 0.2 0.2 2 5 0.2 10 C. perfringens toxine 13 2 2 0.7 1 2 2 0.7 0.7 2 0.9 26 S. aureus toxine 4 4 4 2 8 3 1 0.9 4 16 6 52 Norovirus 0.5 0.5 0.4 0.3 0.3 2 1 0.5 0.8 0.8 8 15 Rotavirus 0 0.2 0 0 0 2 2 0.3 0.6 0.4 3 8 Hepatitis-A virus 0 0 0 0 0 0.01 0.01 0.004 0.004 0.003 0.05 0.09 Hepatitis-E virus 0 0.6 0 0 0 0.04 0.06 0.03 0 0 0.08 0.8 Cryptosporidium spp. 0.5 0.1 0.1 0.1 0.2 0.4 0.4 0.1 0 0.1 0.13 2 Giardia spp. 0.4 0.1 0.1 0 0.2 0.3 0.7 0.1 0 0.1 0.3 2 Toxoplasma gondii 2 4.2 0.4 0.0 0.4 0.3 0.5 0.0 0 0.2 0.5 9 Total 24 16 21 6 14 12 10 4 9 26 21 163
a) COI per year are presented in million € (M€) and if less than 1 million rounded to 1 significant number (e.g. 0.0023 million =0.002). The presented numbers are estimates that rely on annual surveillance data being corrected for: i) coverage (where applicable); ii) underdiagnosis and underreporting; and iii) under-ascertainment (i.e. being sick without requiring medical help).