State of Infectious Diseases
in the Netherlands, 2016
Appendix
Appendix
Updated disease
burden model
parameters
Table A.1 Updated life expectancies (Source: http://www.who.int/healthinfo/statistics/GlobalDALYmethods_2000_2011.pdf)
Age-group (years) West Level 26* (previously used) GBD 2010 (currently used)
Males Females Persons
1–4 77.77 80.28 83.63 5–9 72.89 75.47 78.76 10–14 67.91 70.51 73.79 15–19 62.93 65.55 68.83 20–24 57.95 60.63 63.88 25–29 52.99 55.72 58.94 30–34 48.04 50.83 54.00 35–39 43.10 45.96 49.09 40–44 38.20 41.13 44.23 45–49 33.38 36.36 39.43 50–54 28.66 31.68 34.72 55–59 24.07 27.10 30.10 60–64 19.65 22.64 25.55 65–69 15.54 18.32 21.12 70–74 11.87 14.24 16.78 75–79 8.81 10.59 12.85 80–84 6.34 7.56 9.34 85+ 3.54 4.25 5.05
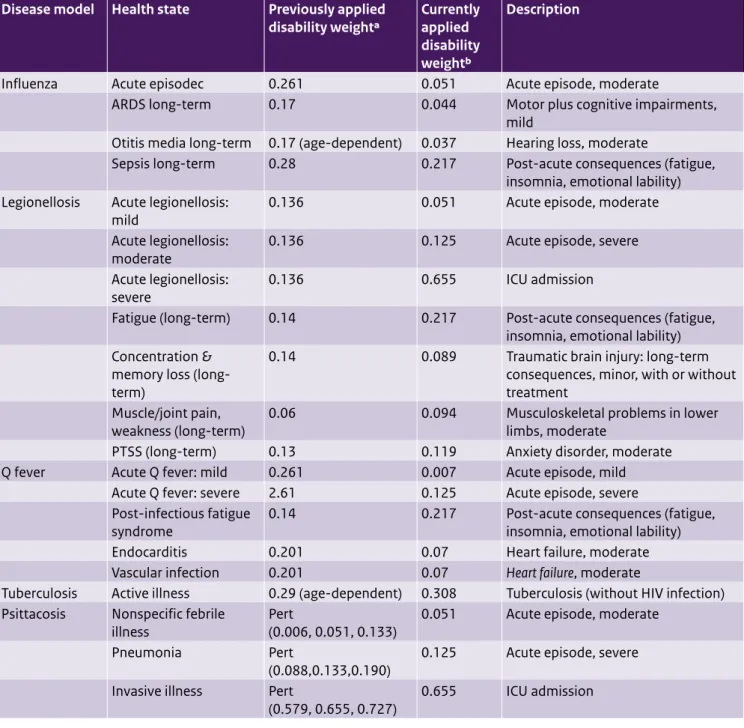
Table A2. Updated disability weights for respiratory disease models
Disease model Health state Previously applied
disability weighta Currently applied disability weightb
Description
Influenza Acute episodec 0.261 0.051 Acute episode, moderate
ARDS long-term 0.17 0.044 Motor plus cognitive impairments,
mild
Otitis media long-term 0.17 (age-dependent) 0.037 Hearing loss, moderate
Sepsis long-term 0.28 0.217 Post-acute consequences (fatigue,
insomnia, emotional lability) Legionellosis Acute legionellosis:
mild 0.136 0.051 Acute episode, moderate
Acute legionellosis:
moderate 0.136 0.125 Acute episode, severe
Acute legionellosis:
severe 0.136 0.655 ICU admission
Fatigue (long-term) 0.14 0.217 Post-acute consequences (fatigue,
insomnia, emotional lability) Concentration &
memory loss (long-term)
0.14 0.089 Traumatic brain injury: long-term
consequences, minor, with or without treatment
Muscle/joint pain,
weakness (long-term) 0.06 0.094 Musculoskeletal problems in lower limbs, moderate
PTSS (long-term) 0.13 0.119 Anxiety disorder, moderate
Q fever Acute Q fever: mild 0.261 0.007 Acute episode, mild
Acute Q fever: severe 2.61 0.125 Acute episode, severe
Post-infectious fatigue
syndrome 0.14 0.217 Post-acute consequences (fatigue, insomnia, emotional lability)
Endocarditis 0.201 0.07 Heart failure, moderate
Vascular infection 0.201 0.07 Heart failure, moderate
Tuberculosis Active illness 0.29 (age-dependent) 0.308 Tuberculosis (without HIV infection) Psittacosis Nonspecific febrile
illness Pert (0.006, 0.051, 0.133) 0.051 Acute episode, moderate
Pneumonia Pert
(0.088,0.133,0.190) 0.125 Acute episode, severe
Invasive illness Pert
(0.579, 0.655, 0.727) 0.655 ICU admission
a Source: Bijkerk et al. [1, 2]. b Source: Haagsma et al. [3].
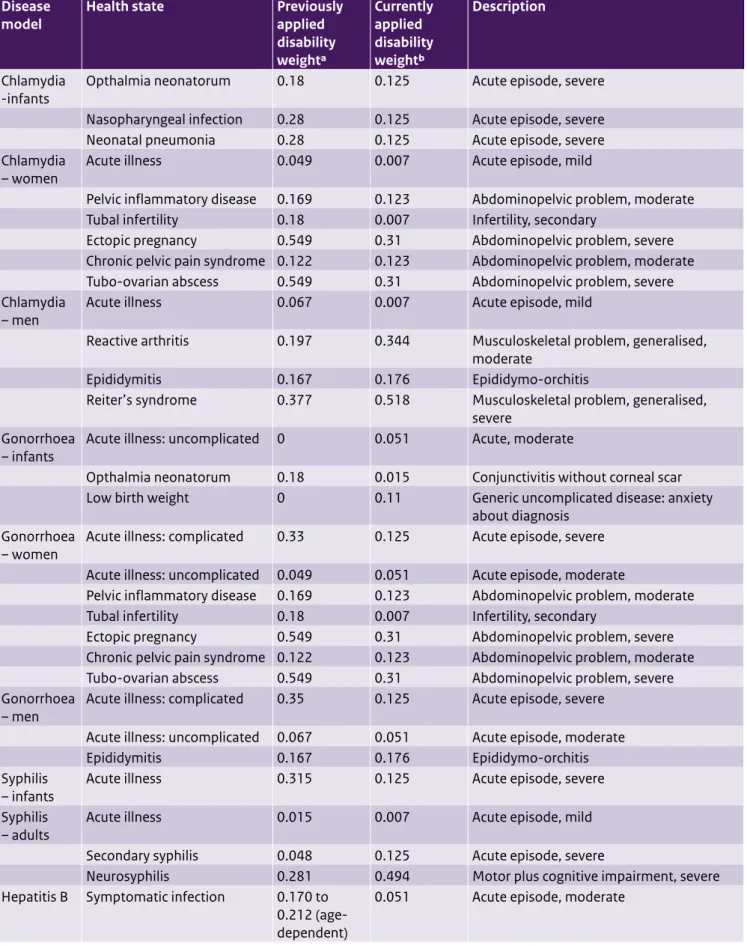
Table A3. Updated disability weights for sexually transmitted disease models
Disease
model Health state Previously applied disability weighta Currently applied disability weightb Description Chlamydia
-infants Opthalmia neonatorum 0.18 0.125 Acute episode, severe
Nasopharyngeal infection 0.28 0.125 Acute episode, severe
Neonatal pneumonia 0.28 0.125 Acute episode, severe
Chlamydia
– women Acute illness 0.049 0.007 Acute episode, mild
Pelvic inflammatory disease 0.169 0.123 Abdominopelvic problem, moderate
Tubal infertility 0.18 0.007 Infertility, secondary
Ectopic pregnancy 0.549 0.31 Abdominopelvic problem, severe
Chronic pelvic pain syndrome 0.122 0.123 Abdominopelvic problem, moderate
Tubo-ovarian abscess 0.549 0.31 Abdominopelvic problem, severe
Chlamydia
– men Acute illness 0.067 0.007 Acute episode, mild
Reactive arthritis 0.197 0.344 Musculoskeletal problem, generalised,
moderate
Epididymitis 0.167 0.176 Epididymo-orchitis
Reiter’s syndrome 0.377 0.518 Musculoskeletal problem, generalised,
severe Gonorrhoea
– infants Acute illness: uncomplicated 0 0.051 Acute, moderate
Opthalmia neonatorum 0.18 0.015 Conjunctivitis without corneal scar
Low birth weight 0 0.11 Generic uncomplicated disease: anxiety
about diagnosis Gonorrhoea
– women Acute illness: complicated 0.33 0.125 Acute episode, severe
Acute illness: uncomplicated 0.049 0.051 Acute episode, moderate
Pelvic inflammatory disease 0.169 0.123 Abdominopelvic problem, moderate
Tubal infertility 0.18 0.007 Infertility, secondary
Ectopic pregnancy 0.549 0.31 Abdominopelvic problem, severe
Chronic pelvic pain syndrome 0.122 0.123 Abdominopelvic problem, moderate
Tubo-ovarian abscess 0.549 0.31 Abdominopelvic problem, severe
Gonorrhoea
– men Acute illness: complicated 0.35 0.125 Acute episode, severe
Acute illness: uncomplicated 0.067 0.051 Acute episode, moderate
Epididymitis 0.167 0.176 Epididymo-orchitis
Syphilis
– infants Acute illness 0.315 0.125 Acute episode, severe
Syphilis
– adults Acute illness 0.015 0.007 Acute episode, mild
Secondary syphilis 0.048 0.125 Acute episode, severe
Neurosyphilis 0.281 0.494 Motor plus cognitive impairment, severe
Hepatitis B Symptomatic infection 0.170 to 0.212 (age-dependent)
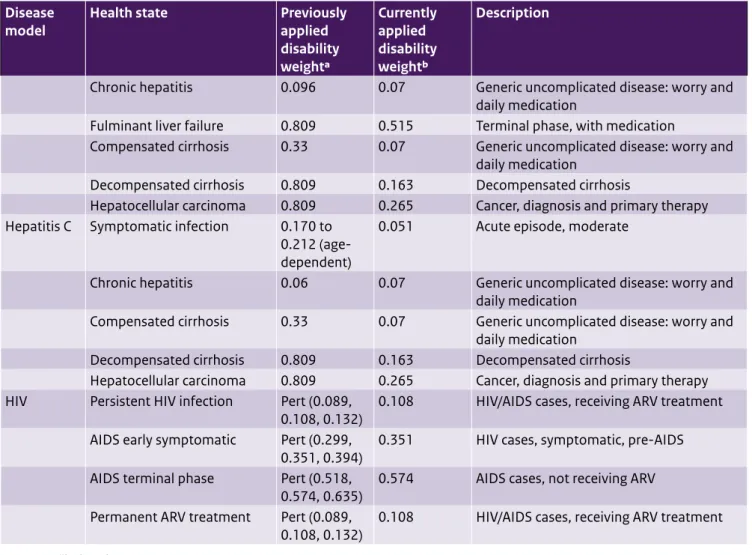
Table A3. (continued) Updated disability weights for sexually transmitted disease models
Disease
model Health state Previously applied disability weighta Currently applied disability weightb Description
Chronic hepatitis 0.096 0.07 Generic uncomplicated disease: worry and
daily medication
Fulminant liver failure 0.809 0.515 Terminal phase, with medication
Compensated cirrhosis 0.33 0.07 Generic uncomplicated disease: worry and
daily medication
Decompensated cirrhosis 0.809 0.163 Decompensated cirrhosis
Hepatocellular carcinoma 0.809 0.265 Cancer, diagnosis and primary therapy
Hepatitis C Symptomatic infection 0.170 to 0.212 (age-dependent)
0.051 Acute episode, moderate
Chronic hepatitis 0.06 0.07 Generic uncomplicated disease: worry and
daily medication
Compensated cirrhosis 0.33 0.07 Generic uncomplicated disease: worry and
daily medication
Decompensated cirrhosis 0.809 0.163 Decompensated cirrhosis
Hepatocellular carcinoma 0.809 0.265 Cancer, diagnosis and primary therapy
HIV Persistent HIV infection Pert (0.089,
0.108, 0.132) 0.108 HIV/AIDS cases, receiving ARV treatment AIDS early symptomatic Pert (0.299,
0.351, 0.394) 0.351 HIV cases, symptomatic, pre-AIDS AIDS terminal phase Pert (0.518,
0.574, 0.635) 0.574 AIDS cases, not receiving ARV Permanent ARV treatment Pert (0.089,
0.108, 0.132) 0.108 HIV/AIDS cases, receiving ARV treatment
a Source: Bijkerk et al. [1, 2]. b Source: Haagsma et al. [3].
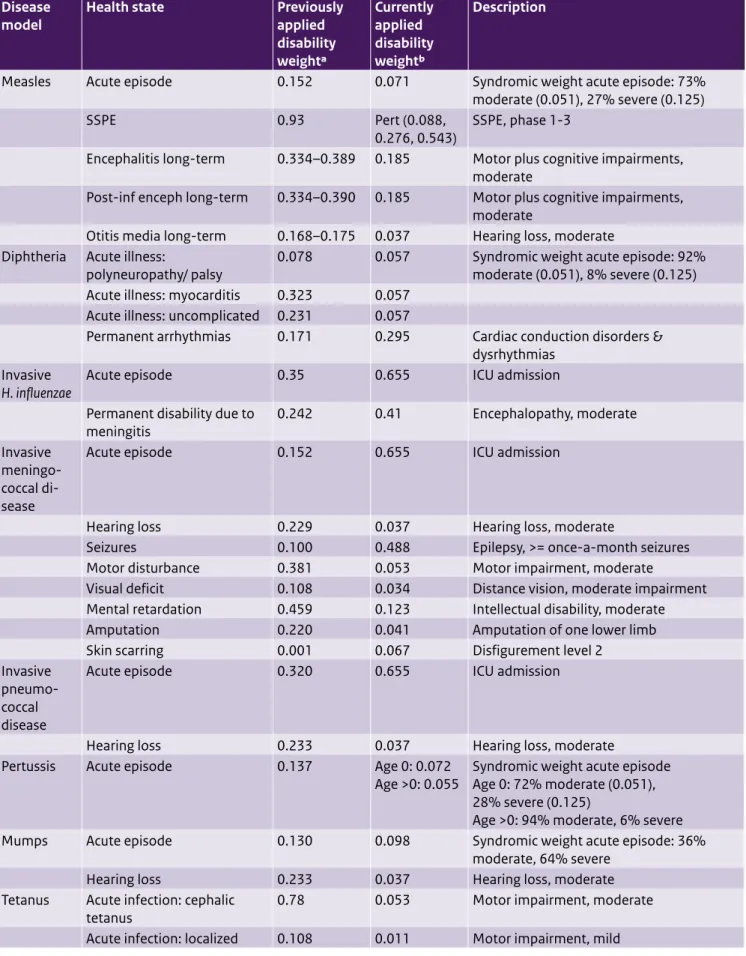
Table A4. Updated disability weights for vaccine-preventable disease models
Disease
model Health state Previously applied disability weighta Currently applied disability weightb Description
Measles Acute episode 0.152 0.071 Syndromic weight acute episode: 73%
moderate (0.051), 27% severe (0.125)
SSPE 0.93 Pert (0.088,
0.276, 0.543) SSPE, phase 1-3
Encephalitis long-term 0.334–0.389 0.185 Motor plus cognitive impairments, moderate
Post-inf enceph long-term 0.334–0.390 0.185 Motor plus cognitive impairments, moderate
Otitis media long-term 0.168–0.175 0.037 Hearing loss, moderate
Diphtheria Acute illness:
polyneuropathy/ palsy 0.078 0.057 Syndromic weight acute episode: 92% moderate (0.051), 8% severe (0.125)
Acute illness: myocarditis 0.323 0.057
Acute illness: uncomplicated 0.231 0.057
Permanent arrhythmias 0.171 0.295 Cardiac conduction disorders &
dysrhythmias Invasive
H. influenzae Acute episode 0.35 0.655 ICU admission
Permanent disability due to
meningitis 0.242 0.41 Encephalopathy, moderate
Invasive meningo-coccal di-sease
Acute episode 0.152 0.655 ICU admission
Hearing loss 0.229 0.037 Hearing loss, moderate
Seizures 0.100 0.488 Epilepsy, >= once-a-month seizures
Motor disturbance 0.381 0.053 Motor impairment, moderate
Visual deficit 0.108 0.034 Distance vision, moderate impairment
Mental retardation 0.459 0.123 Intellectual disability, moderate
Amputation 0.220 0.041 Amputation of one lower limb
Skin scarring 0.001 0.067 Disfigurement level 2
Invasive pneumo-coccal disease
Acute episode 0.320 0.655 ICU admission
Hearing loss 0.233 0.037 Hearing loss, moderate
Pertussis Acute episode 0.137 Age 0: 0.072
Age >0: 0.055 Syndromic weight acute episode Age 0: 72% moderate (0.051), 28% severe (0.125)
Age >0: 94% moderate, 6% severe
Mumps Acute episode 0.130 0.098 Syndromic weight acute episode: 36%
moderate, 64% severe
Hearing loss 0.233 0.037 Hearing loss, moderate
Tetanus Acute infection: cephalic
tetanus 0.78 0.053 Motor impairment, moderate
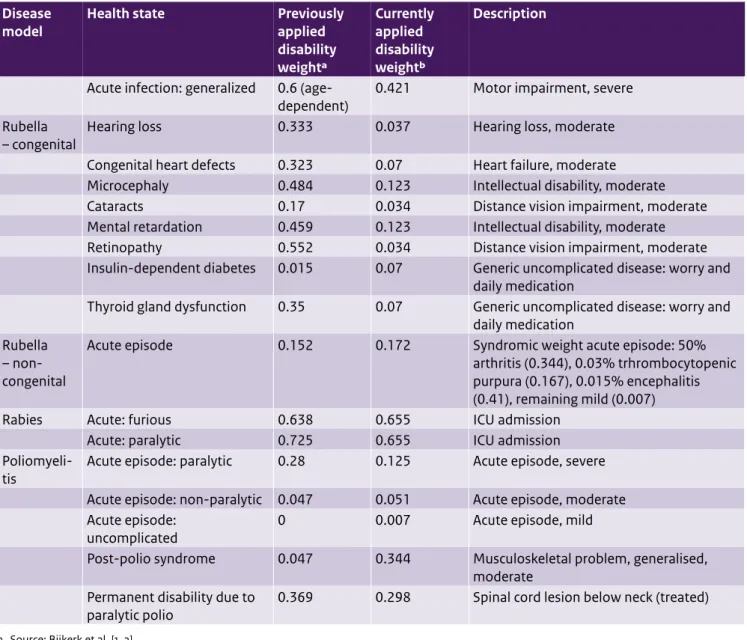
Table A4. (continued) Updated disability weights for vaccine-preventable disease models
Disease
model Health state Previously applied disability weighta Currently applied disability weightb Description
Acute infection: generalized 0.6
(age-dependent) 0.421 Motor impairment, severe
Rubella
– congenital Hearing loss 0.333 0.037 Hearing loss, moderate
Congenital heart defects 0.323 0.07 Heart failure, moderate
Microcephaly 0.484 0.123 Intellectual disability, moderate
Cataracts 0.17 0.034 Distance vision impairment, moderate
Mental retardation 0.459 0.123 Intellectual disability, moderate
Retinopathy 0.552 0.034 Distance vision impairment, moderate
Insulin-dependent diabetes 0.015 0.07 Generic uncomplicated disease: worry and daily medication
Thyroid gland dysfunction 0.35 0.07 Generic uncomplicated disease: worry and
daily medication Rubella
– non-congenital
Acute episode 0.152 0.172 Syndromic weight acute episode: 50%
arthritis (0.344), 0.03% trhrombocytopenic purpura (0.167), 0.015% encephalitis (0.41), remaining mild (0.007)
Rabies Acute: furious 0.638 0.655 ICU admission
Acute: paralytic 0.725 0.655 ICU admission
Poliomyeli-tis Acute episode: paralytic 0.28 0.125 Acute episode, severe
Acute episode: non-paralytic 0.047 0.051 Acute episode, moderate Acute episode:
uncomplicated 0 0.007 Acute episode, mild
Post-polio syndrome 0.047 0.344 Musculoskeletal problem, generalised,
moderate Permanent disability due to
paralytic polio 0.369 0.298 Spinal cord lesion below neck (treated)
a Source: Bijkerk et al. [1, 2]. b Source: Haagsma et al. [3].
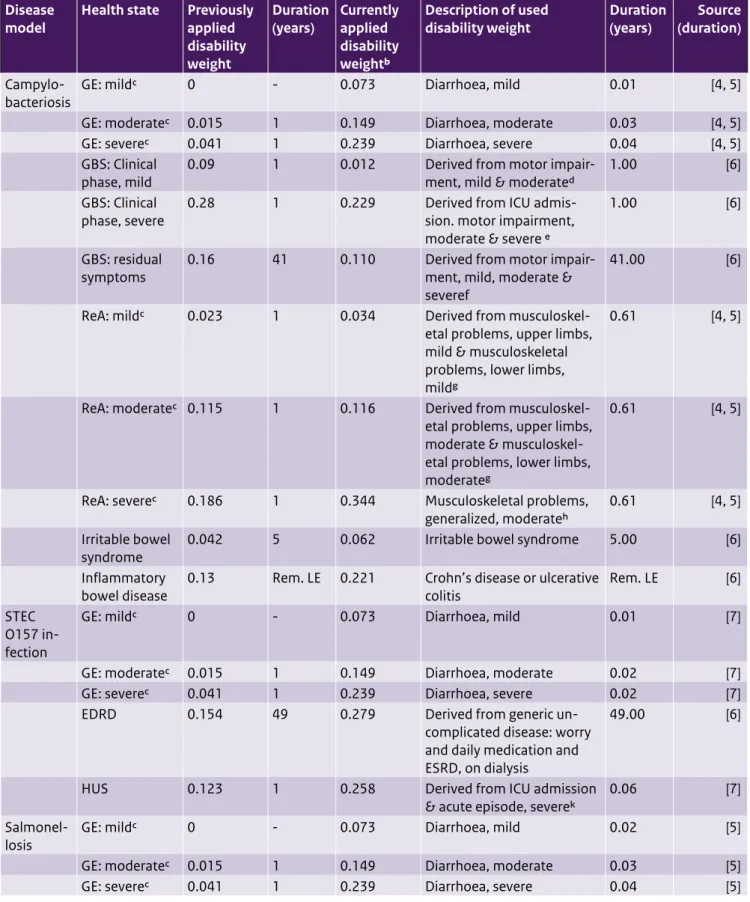
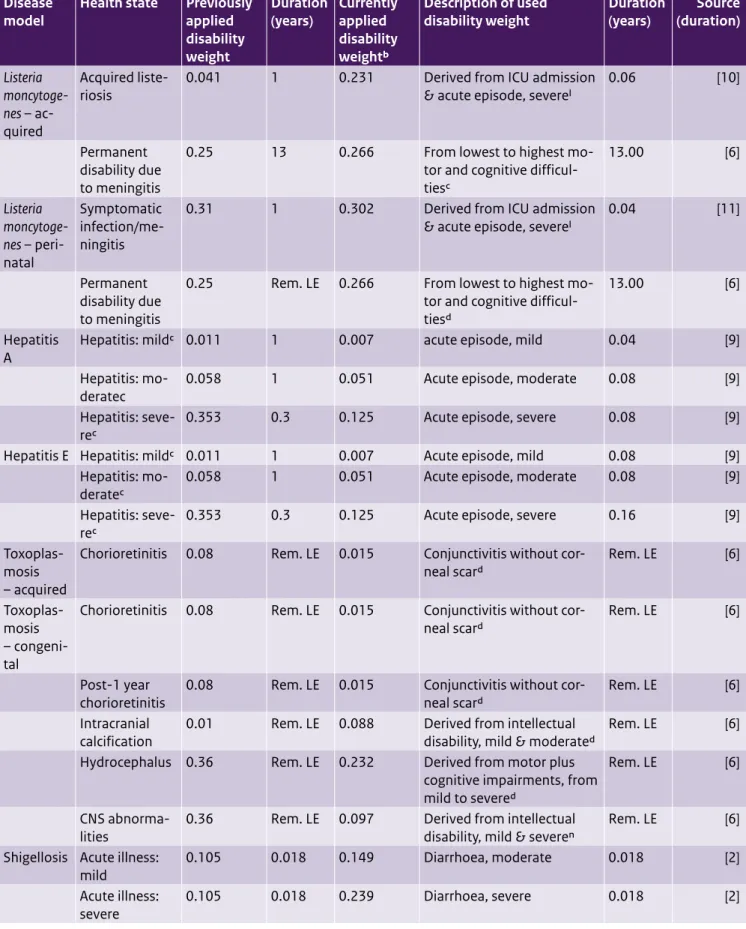
Table A5. Updated disability weights and durations for foodborne disease models
Disease
model Health state Previously applied disability weight
Duration
(years) Currently applied disability weightb
Description of used
disability weight Duration (years) (duration)Source
Campylo-bacteriosis GE: mildc 0 - 0.073 Diarrhoea, mild 0.01 [4, 5]
GE: moderatec 0.015 1 0.149 Diarrhoea, moderate 0.03 [4, 5]
GE: severec 0.041 1 0.239 Diarrhoea, severe 0.04 [4, 5]
GBS: Clinical
phase, mild 0.09 1 0.012 Derived from motor impair-ment, mild & moderated 1.00 [6] GBS: Clinical
phase, severe 0.28 1 0.229 Derived from ICU admis-sion. motor impairment, moderate & severe e
1.00 [6]
GBS: residual
symptoms 0.16 41 0.110 Derived from motor impair-ment, mild, moderate & severef
41.00 [6]
ReA: mildc 0.023 1 0.034 Derived from
musculoskel-etal problems, upper limbs, mild & musculoskeletal problems, lower limbs, mildg
0.61 [4, 5]
ReA: moderatec 0.115 1 0.116 Derived from
musculoskel-etal problems, upper limbs, moderate & musculoskel-etal problems, lower limbs, moderateg
0.61 [4, 5]
ReA: severec 0.186 1 0.344 Musculoskeletal problems,
generalized, moderateh 0.61 [4, 5]
Irritable bowel
syndrome 0.042 5 0.062 Irritable bowel syndrome 5.00 [6]
Inflammatory
bowel disease 0.13 Rem. LE 0.221 Crohn’s disease or ulcerative colitis Rem. LE [6] STEC
O157 in-fection
GE: mildc 0 - 0.073 Diarrhoea, mild 0.01 [7]
GE: moderatec 0.015 1 0.149 Diarrhoea, moderate 0.02 [7]
GE: severec 0.041 1 0.239 Diarrhoea, severe 0.02 [7]
EDRD 0.154 49 0.279 Derived from generic
un-complicated disease: worry and daily medication and ESRD, on dialysis
49.00 [6]
HUS 0.123 1 0.258 Derived from ICU admission
& acute episode, severek 0.06 [7]
Salmonel-losis GE: mildc 0 - 0.073 Diarrhoea, mild 0.02 [5]
GE: moderatec 0.015 1 0.149 Diarrhoea, moderate 0.03 [5]
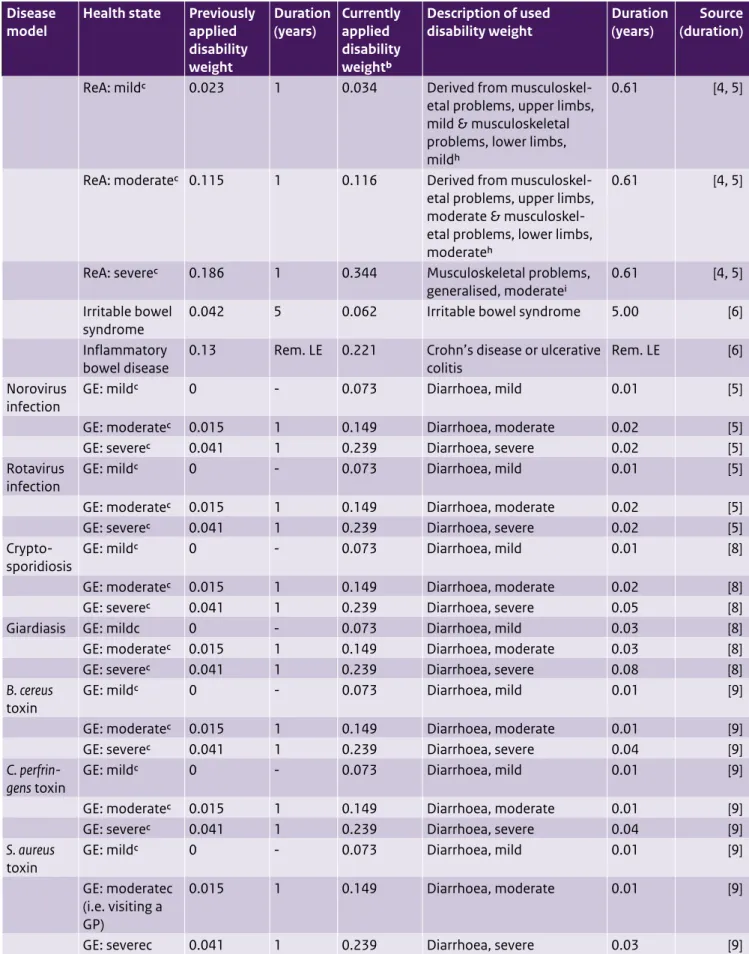
Table A5. (continued) Updated disability weights and durations for foodborne disease models
Disease
model Health state Previously applied disability weight
Duration
(years) Currently applied disability weightb
Description of used
disability weight Duration (years) (duration)Source
ReA: mildc 0.023 1 0.034 Derived from
musculoskel-etal problems, upper limbs, mild & musculoskeletal
0.61 [4, 5]
problems, lower limbs, mildh
ReA: moderatec 0.115 1 0.116 Derived from
musculoskel-etal problems, upper limbs, moderate &
musculoskel-0.61 [4, 5]
etal problems, lower limbs, moderateh
ReA: severec 0.186 1 0.344 Musculoskeletal problems,
generalised, moderatei 0.61 [4, 5]
Irritable bowel
syndrome 0.042 5 0.062 Irritable bowel syndrome 5.00 [6]
Inflammatory
bowel disease 0.13 Rem. LE 0.221 Crohn’s disease or ulcerative colitis Rem. LE [6] Norovirus
infection GE: mildc 0 - 0.073 Diarrhoea, mild 0.01 [5]
GE: moderatec 0.015 1 0.149 Diarrhoea, moderate 0.02 [5]
GE: severec 0.041 1 0.239 Diarrhoea, severe 0.02 [5]
Rotavirus
infection GE: mildc 0 - 0.073 Diarrhoea, mild 0.01 [5]
GE: moderatec 0.015 1 0.149 Diarrhoea, moderate 0.02 [5]
GE: severec 0.041 1 0.239 Diarrhoea, severe 0.02 [5]
Crypto-sporidiosis GE: mildc 0 - 0.073 Diarrhoea, mild 0.01 [8]
GE: moderatec 0.015 1 0.149 Diarrhoea, moderate 0.02 [8]
GE: severec 0.041 1 0.239 Diarrhoea, severe 0.05 [8]
Giardiasis GE: mildc 0 - 0.073 Diarrhoea, mild 0.03 [8]
GE: moderatec 0.015 1 0.149 Diarrhoea, moderate 0.03 [8]
GE: severec 0.041 1 0.239 Diarrhoea, severe 0.08 [8]
B. cereus
toxin GE: mildc 0 - 0.073 Diarrhoea, mild 0.01 [9]
GE: moderatec 0.015 1 0.149 Diarrhoea, moderate 0.01 [9]
GE: severec 0.041 1 0.239 Diarrhoea, severe 0.04 [9]
C.
Table A5. (continued) Updated disability weights and durations for foodborne disease models
Disease
model Health state Previously applied disability weight
Duration
(years) Currently applied disability weightb
Description of used
disability weight Duration (years) (duration)Source
Listeria
moncytoge- Acquired liste-riosis 0.041 1 0.231 Derived from ICU admission & acute episode, severel 0.06 [10]
nes – ac-quired
Permanent disability due to meningitis
0.25 13 0.266 From lowest to highest
mo-tor and cognitive difficul-tiesc 13.00 [6] Listeria moncytoge-nes – peri-natal Symptomatic infection/me-ningitis
0.31 1 0.302 Derived from ICU admission
& acute episode, severel 0.04 [11] Permanent
disability due to meningitis
0.25 Rem. LE 0.266 From lowest to highest
mo-tor and cognitive difficul-tiesd
13.00 [6]
Hepatitis
A Hepatitis: mildc 0.011 1 0.007 acute episode, mild 0.04 [9]
Hepatitis:
mo-deratec 0.058 1 0.051 Acute episode, moderate 0.08 [9]
Hepatitis: seve- 0.353 0.3 0.125 Acute episode, severe 0.08 [9]
rec
Hepatitis E Hepatitis: mildc 0.011 1 0.007 Acute episode, mild 0.08 [9]
Hepatitis:
mo-deratec 0.058 1 0.051 Acute episode, moderate 0.08 [9]
Hepatitis: seve- 0.353 0.3 0.125 Acute episode, severe 0.16 [9]
rec
Toxoplas-mosis Chorioretinitis 0.08 Rem. LE 0.015 Conjunctivitis without cor-neal scard Rem. LE [6] – acquired
Toxoplas-mosis Chorioretinitis 0.08 Rem. LE 0.015 Conjunctivitis without cor-neal scard Rem. LE [6] –
congeni-tal
Post-1 year
chorioretinitis 0.08 Rem. LE 0.015 Conjunctivitis without cor-neal scard Rem. LE [6] Intracranial
calcification 0.01 Rem. LE 0.088 Derived from intellectual disability, mild & moderated Rem. LE [6]
Hydrocephalus 0.36 Rem. LE 0.232 Derived from motor plus
cognitive impairments, from mild to severed
Rem. LE [6]
CNS
abnorma-lities 0.36 Rem. LE 0.097 Derived from intellectual disability, mild & severen Rem. LE [6] Shigellosis Acute illness:
mild 0.105 0.018 0.149 Diarrhoea, moderate 0.018 [2]
Acute illness: 0.105 0.018 0.239 Diarrhoea, severe 0.018 [2]
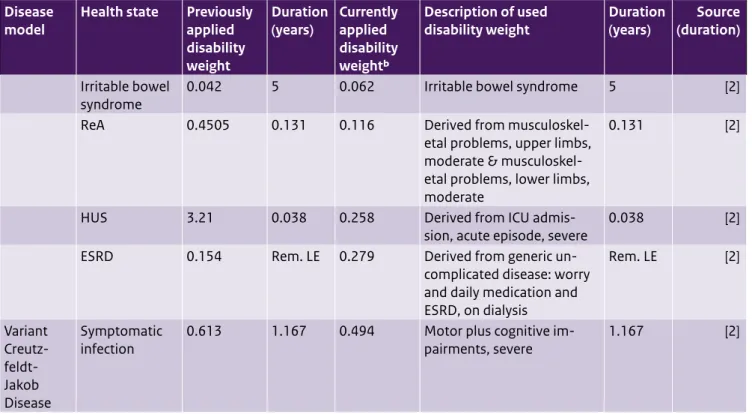
Table A5. (continued) Updated disability weights and durations for foodborne disease models
Disease Health state Previously Duration Currently Description of used Duration Source model applied (years) applied disability weight (years) (duration)
disability disability weight weightb
Irritable bowel 0.042 5 0.062 Irritable bowel syndrome 5 [2]
syndrome
ReA 0.4505 0.131 0.116 Derived from
musculoskel-etal problems, upper limbs, moderate &
musculoskel-0.131 [2]
etal problems, lower limbs, moderate
HUS 3.21 0.038 0.258 Derived from ICU
admis-sion, acute episode, severe 0.038 [2]
ESRD 0.154 Rem. LE 0.279 Derived from generic
un-complicated disease: worry and daily medication and ESRD, on dialysis
Rem. LE [2]
Variant Symptomatic 0.613 1.167 0.494 Motor plus cognitive im- 1.167 [2]
Creutz- infection pairments, severe
feldt-Jakob Disease
Abbreviations: CNS = central nervous system; ESRD = end-stage renal disease; GBS = Guillain-Barré Syndrome; GE = gastroenteritis; GP = general practitioner; HUS = hemolytic uremic syndrome; ICU = intensive care unit; ReA = Reactive arthritis; Rem.LE = remaining life expectancy
a. For details see Havelaar et al. [6]. b. Source: Haagsma et al. [3].
c. Mild= not visiting a GP; moderate= visiting a GP; severe= hospitalised. d. Same description as in Colzani et al. [12] to be used in the BCoDE model.
e. Assuming that in the first 3 months 50% have an F-score of 1 (motor impairment, mild) and 50% an F-score of 2 (motor impairment, moderate). After 3 months 50% have an F-score of 0 (= recovered) and the remaining cases have an F-score of 1 [4, 13].
f. Assuming that 25% require ventilation (= ICU admission) during 0.25 years and severe motor impairment for the remaining days during the clinical phase. Further assuming that 75% have severe motor impairment for 0.25 years and moderate motor impairment for the remaining days during the clinical phase [4, 14].
g. 15% to 20% of all GBS cases are left with severe neurological deficit, assuming 100% motor impairment, severe. And assuming for the remaining cases that 50% have an F1-score (motor impairment, mild) and 50% have an F2-score (motor impairment, moderate) [4].
h. Assuming 50% and 50%.
i. Same as Colzani et al. [12], but only for the severe ReA cases.
j. Average length on dialysis before transplantation is age-dependent and is, according to Havelaar et al. [7], for 0–15 years; 16–44 years; 45–64 years and 65 years and older ESRD patients on average 2.1 years; 3.4 years; 9.9 years and remaining LE, respectively; graft survival is according to the same authors 19.8 years. But taking into account that some ESRD patients die during dialysis and/or due to transplantation, we assume for simplification that it is 50% ESRD on dialysis and 50% generic uncomplicated disease: worry and daily medication.
k. According to McPherson et al. [15], all HUS cases were admitted at ICU. Jenssen et al. [16] finds severe complications, most of them probably requiring intensive care as well. Information on length of ICU stay is scarce. Hospital duration is, according to Ruzante et al. [10], 13.3 days on average; Jenssen et
References:
1. Bijkerk P, De Gier B, Nijsten DRE, Duijster JW, Soetes LC, Hahné SJM. State of infectious diseases in the
Netherlands, 2015. Bilthoven: National Institute for Public Health and the Environment (RIVM); 2016;Report 2016-0069.
2. Bijkerk P, van Lier A, McDonald S, Kardamanidis K, Fanoy EB, Wallinga J, et al. State of infectious diseases in the Netherlands, 2013. RIVM; 2014.
3. Haagsma JA, Maertens de Noordhout C, Polinder S, Vos T, Havelaar AH, Cassini A, et al. Assessing disability weights based on the responses of 30,660 people from four European countries. Popul Health Metr. 2015;13:10. 4. Mangen MJJ, Havelaar AH, Bernsen RA, Van Koningsveld
R, De Wit GA. The costs of human campylobacter infections and sequelae in the Netherlands: a DALY and cost-of-illness approach. Food Economics – Acta Agriculturæ Scandinavica C. 2005;2:35–51.
5. Kemmeren JM, Mangen MJJ, van Duynhoven YTHP, Havelaar AH. Priority setting of foodborne pathogens – disease burden and costs of selected enteric pathogens. Bilthoven: National Institute of Public Health and the Environment (RIVM); 2006;Report 330080001/2006.
6. Havelaar AH, Haagsma JA, Mangen MJ, Kemmeren JM, Verhoef LP, Vijgen SM, et al. Disease burden of foodborne pathogens in the Netherlands, 2009. Int J Food Microbiol. 2012;156(3):231–8.
7. Havelaar AH, Van Duynhoven YT, Nauta MJ, Bouwknegt M, Heuvelink AE, De Wit GA, et al. Disease burden in The Netherlands due to infections with Shiga toxin-producing Escherichia coli O157. Epidemiol Infect. 2004;132(3):467–84.
8. Vijgen SM, Mangen MJ, Kortbeek LM, van Duynhoven YTHP, Havelaar AH. Disease burden and related costs of cryptosporidiosis and giardiasis in the Netherlands. Bilthoven: National Institute of Public Health and the Environment (RIVM); 2007;Report 330081001. 9. Haagsma J, Van den Zanden BP, Tariq L, Van Pelt W,
Van Duynhoven YTPH, Havelaar AH. Disease burden and costs of selected foodborne pathogens in the Netherlands, 2006. Bilthoven: National Institute of Public Health and the Environment (RIVM); 2009;Report 330331001/2009.
10. Ruzante JM, Majowicz SE, Fazil A, Davidson VJ. Hospitalization and deaths for select enteric illnesses and associated sequelae in Canada, 2001–2004. Epidemiol Infect. 2011;139(6):937–45.
11. Bos JM, Rumke HC, Welte R, Postma MJ, Jager JC. Health economics of a hexavalent meningococcal outer-membrane vesicle vaccine in children: potential impact of introduction in the Dutch vaccination program. Vaccine. 2001;20(1–2):202–7.
12. Colzani E, Cassini A, Lewandowski D, Mangen MJ, Plass D, McDonald SA, et al. A software tool for estimation of burden of infectious diseases in Europe using incidence-based disability adjusted life years. PLoS One.
2017;12(1):e0170662.
13. van Leeuwen N, Lingsma HF, Vanrolleghem AM, Sturkenboom MC, van Doorn PA, Steyerberg EW, et al. Hospital admissions, transfers and costs of Guillain-Barré syndrome. PLoS One. 2016;11(2):e0143837. 14. van der Maas NA, Kramer MA, Jacobs BC, van Soest EM,
Dieleman JP, Kemmeren JM, et al. Guillain-Barré syndrome: background incidence rates in The Netherlands. J Peripher Nerv Syst. 2011;16(3):243–9.
15. McPherson M, Kirk MD, Raupach J, Combs B, Butler JR. Economic costs of Shiga toxin-producing Escherichia coli infection in Australia. Foodborne Pathog Dis. 2011;8(1):55–62.
16. Jenssen GR, Vold L, Hovland E, Bangstad HJ, Nygard K, Bjerre A. Clinical features, therapeutic interventions and long-term aspects of hemolytic-uremic syndrome in Norwegian children: a nationwide retrospective study from 1999-2008. BMC Infect Dis. 2016;16:285.
17. Torgerson PR, Devleesschauwer B, Praet N, Speybroeck N, Willingham AL, Kasuga F, et al. World Health
Organization Estimates of the Global and Regional Disease Burden of 11 Foodborne Parasitic Diseases, 2010: A Data Synthesis. PLoS Med. 2015;12(12):e1001920.
B. de Gier, D.R.E. Nijsten, J.W. Duijster, S.J.M. Hahné
RIVM Report 2017-0029
Published by
National Institute for Public Health and the Environment