Published by:
A query for Coxiella in veterinary and
environmental matrices
RIVM Letter report 330291003/2009
Colofon
© RIVM 2009
Parts of this publication may be reproduced, provided acknowledgement is given to the 'National Institute for Public Health and the Environment', along with the title and year of publication.
Arnout de Bruin (Researcher), RIVM
Bart van Rotterdam (Project Leader), RIVM
Contact:
Bart van Rotterdam
Laboratory for Zoonoses and Environmental Microbiology
bart.van.rotterdam@rivm.nl
This investigation has been performed by order and for the account of the Food and Consumer Product Safety Authority, within the framework of Deelproject 9.2.3.D Coxiella in kennisvraag livestock-borne zoonoses
Abstract
A query for Coxiella in veterinary and environmental matrices
Q fever, caused by Coxiella burnetii, is a zoonosis with a worldwide distribution that affects both humans and animals. In 2007, 2008, and 2009 large
community outbreaks of Q fever were observed in the Netherlands. In 2008, several studies were started to investigate potential sources of C. burnetii infection and possible transmission routes. Temporal studies focussed on C.
burnetii DNA content on farms, and their direct surroundings. Coxiella burnetii
was found in veterinary and environmental samples obtained from a single farm, with an abortion wave among its goats in April 2007, during two successive years of Q fever outbreaks in 2007 and 2008. Within the Q fever outbreak of 2009, investigations at one location in Zuid-Limburg over a 16 week-interval demonstrated that the C. burnetii DNA content in both veterinary and environmental samples declined over time after the initial wave of abortions among goats. Although a decline of the C. burnetii DNA content was observed, environmental and veterinary samples were still found to be positive up to several months after the abortion wave at the farm.
Human outbreak linked source investigations focussed on veterinary and environmental matrices on farms, which in previous studies were found to contain the highest C. burnetii DNA content. These matrices included vaginal swabs from animals and surface area swabs from horizontal surfaces, to investigate the potential link between the putative Q fever-affected goat farms and (clusters of) human Q fever cases in the near vicinity of these farms. Screening results for vaginal swabs obtained from goats and/or sheep are consistent with results for surface area swabs taken on the same farm. Keywords:
Contents
1 Introduction—7
1.1 Q fever outbreaks in the Netherlands—7
1.2 Report Outline—7
2 Methods—9
2.1 Origin of samples screened for C. burnetii DNA presence—9
2.2 Sampling procedures for environmental and veterinary matrices—9 2.3 DNA extraction from environmental and veterinary matrices—9
2.4 Detection of C. burnetii DNA by quantitative multiplex real-time PCR—10
3 Results—13
3.1 Temporal study I: monitoring a single farm in 2007 & 2008—13
3.2 Temporal study II: a single farm in 2009, unrelated to human cases—14 3.3 Temporal study III: a single farm in 2009, related to human cases—15 3.4 Q fever source finding investigations in 2008 & 2009—16
4 Discussion—21
4.1 Temporal studies—21
4.2 Source investigations—21
5 Conclusions—23 6 Literature—25
1
Introduction
1.1 Q fever outbreaks in the Netherlands
The impact of various transmission routes of Q fever is not well understood. Two years before the first documented outbreak in the Netherlands in 2007 (1), large abortion waves were reported on (primarily goat) farms in the same region as the Q fever outbreaks in humans in subsequent years (Figure 1). This implicated (goat) farms as potential sources for human Q fever infection, as later supported by another epidemiological study of a local outbreak (1,6).
Coxiella burnetii infection in humans can occur via close contact with infected
animals, or contaminated animal products. In addition, C. burnetii can persist for long periods of time in the environment and transmission to animals and
humans by inhalation of contaminated aerosols is thought to be the primary route (2,3). Infected animals, like goats, sheep, and cattle, often show no clinical signs of infection except for abortions or stillbirths that may occur due to infection of the placenta. When animals are infected, the main sources of C.
burnetii shedding to the environment are manure, urine, milk, and most
importantly birth materials like amnion fluid and placenta (4,5).
1.2 Report Outline
This report describes the current status of our investigations to investigate important environmental and veterinary sources of Coxiella burnetii that are relevant for source finding and risk assessment.
Temporal studies and source investigations were carried out during the Q fever outbreaks in 2007, 2008, and 2009, in which a large number of different environmental and veterinary matrices were screened for the presence of C.
burnetii DNA by molecular detection via quantitative multiplex real time PCR.
Samples were taken as part of source finding on request of municipal health services (GGD’s), and for a project for the Ministry of Health, Welfare and Sport on persistence of C. burnetii DNA in contaminated farms and the environment over time.
A
B
C
Figure 1. Q fever on dairy goat farms in 2005-09 (A, Animal Health Service), and in humans in 2008 (B) and 2009 (C, RIVM Epidemiology & Surveillance).
2
Methods
2.1 Origin of samples screened for C. burnetii DNA presence
Environmental and veterinary samples were obtained from several locations in the Netherlands, during three successive years of Q fever outbreaks:
1. A farm involved in the first main human cluster area (Herpen) in two subsequent years (week 35 in 2007 & week 25 in 2008).
2. A farm, mandatory notified by the farmer, veterinarian, and the Animal Health Services, thought to be involved in a human Q fever cluster in Zuid-Limburg at three different weeks (14, 21 and 30) in 2009. 3. A farm mandatory notified by the farmer, veterinarian and the Animal
Health Services in Overijssel at week 10 in 2009.
4. From several suspected Q fever affected locations, reported by the municipal health services based on human cases in 2008 (409 samples from 30 farms) and 2009 (1139 samples from 57 farms).
2.2 Sampling procedures for environmental and veterinary matrices
Goat farms, implicated as potential sources for Q fever in humans, were visited by employees of the Food and Consumer Product Safety Authority (VWA), or employees from the National Institute for Public Health and the Environment (RIVM) in 2007, 2008, and 2009. Potential sources of C. burnetii shedding to the environment are manure, urine, milk, and birth materials like amnion fluid and placenta. Therefore, veterinary matrices included samples from manure
(droppings), milk (bulk or individuals), and (when available) placenta materials. In addition, vaginal swabs were obtained from a subset of the goat population on farms. Environmental matrices included samples from surface areas (swabs), water (drinking buckets), and aerosols (air samples).
Manure, water, and milk samples were collected in 50 ml Greiner tubes (Greiner Bio-one, the Netherlands). Surface area swabs and vaginal swabs of animals were taken using sterile cotton swabs (VWR International, the Netherlands). Placenta materials were obtained in frozen condition (-20ºC) from the Animal Health Service (GD). Aerosol samples were collected by using a Sartorius MD8 Airport. Aerosols were captured on nitrate-cellulose filters (pore size 8 µm), by sampling 500L of air using the pre-installed program of 50L per minute. After collection, all obtained environmental and veterinary samples were transported to the laboratory, stored at 4ºC, and processed within one week.
2.3 DNA extraction from environmental and veterinary matrices
DNA was extracted from environmental and animal samples using a single DNA extraction method, the Nuclisens Magnetic Extraction Kit (Biomerieux, France). Small modifications were made to the manufacturer’s guidelines for DNA
isolation from liquid samples, swabs, and manure samples. For the processing of liquid samples, 1 ml of liquid sample was added to 10 ml of NucliSens
lysisbuffer. Surface area swabs and vaginal swabs were added to 10 ml of Nuclisens lysisbuffer. Processing manure samples was carried out by adding goat droppings to Phosphate-buffered Saline (PBS) in 50 ml Greiner tubes (Greiner Bio-one, the Netherlands), using a 1:1 ratio of manure and PBS.
This sample was homogenized for about 2 hours on a rotating tube holder at 10 rpm. Greiner tubes were centrifuged (Varifuge 3.2RS, Heraeus) at 2000 rpm for 10 minutes. The supernatant was transferred to a new Greiner tube, and 1 ml of
supernatant was added to 10 ml of NucliSens lysisbuffer. Cellulose Nitrate filters, used in aerosol sample collection, were placed in Petri dishes and submerged in 10 ml NucliSens lysisbuffer. Petri-dishes were then placed on a horizontal shaker for 2 hours at 50 rpm. To all samples, 1.2 x 10⁵ spores of Bacillus thuringiensis
were added as internal control for DNA extraction. In addition, 50 µl of magnetic beads were added to each sample and samples were placed at room
temperature for one hour to complete lysis and hybridization of DNA to the magnetic beads. After lysis, samples were placed in a magnetic holder for 1 minute and the supernatant was removed. Further steps in DNA extraction were carried out according to the manufacturer’s protocol. DNA from (positive) placenta materials was extracted under BSL-3 conditions using a QIAamp DNA Mini Kit according the manufacturer’s protocol in the QIAamp DNA Blood Mini Kit Handbook (September 2001).
2.4 Detection of C. burnetii DNA by quantitative multiplex real-time PCR
To investigate possible routes of dispersion and transmission, serology cannot be applied. DNA based methods, like quantitative real time PCR (QPCR), detects DNA of the organism of interest directly and are more sensitive than serology based methods. In addition, QPCR can generate data not only on the presence of C. burnetii DNA, but also on the C. burnetii DNA content in various human, animal, and environmental matrices. For the current study we developed a quantitative multiplex real time PCR assay (QPCR) in which three genomic targets commonly used for the detection of C. burnetii DNA (icd, com1 &
IS1111) are combined into a single assay (Table 1). The development of this
assay is extensively described in the 2008 report “Molecular detection and typing of Coxiella burnetii ”. The three genomic targets selected are: the isocitrate dehydrogenase gene (icd), an outer membrane protein coding gene (com1) and a multi copy insertion element (IS1111). In addition, an internal control target (B. thuringiensis gene cry 1) was added to the assay to
investigate possible inhibition on the QPCR assay, by the complex environmental and animal samples. PCR assays were carried out on a Roche LightCycler 480 PCR machine.
The results of qPCR assays on DNA extracts obtained from animal and veterinary matrices are categorised as negative or positive. In the following paragraphs the number and percentages of negative and positive samples are reported for the different studies.
The level of C. burnetii DNA in the various matrices is mentioned, however, the actual Cq values for the different C. burnetii targets are not reported.
Primer and probe sequences (5'-> 3') Positions Product length target icd
forward primer icdpri_f GACCGACCCATTATTCCCT 1144122 - 1144138
reverse primer icdpri_r CGGCGTAGATCTCCATCCA 1144001 - 1144019
probe (FAM) Tqpro_icd CGCCCGTCATGAAAAACGTGGTC 1144065 - 1144087 target com1
forward primer compri_f AAGCAATTAAAGAAAATGCAAAGAAATTAT 1829595 - 1829624 reverse primer compri_r ACAGAATTCATGGCTTTGCAAT 1829706 - 1829727 probe (JOE) Tqpro_com CACATTGATAATCGAAAAATTCAACCAATG 1829673 - 1829702 target IS1111
forward primer IS1pri_f CGCAGCACGTCAAACCG 1715999 - 1716016
reverse primer IS1pri_r TATCTTTAACAGCGCTTGAACGTC 1716122 - 1716145 probe (T-red) Tqpro_IS1 ATGTCAAAAGTAACAAGAATGATCGTAAC 1716018 - 1716046 target Cry1
forward primer Btpri_f GCAACTATGAGTAGTGGGAGTAATTTAC
reverse primer Btpri_r TTCATTGCCTGAATTGAAGACATGAG
probe (Cy5) Tqpro_Bt ACGTAAATACACTTGATCCATTTGAAAAG
n/a 132
Primers & probe names
139
133
146
Table 1. Primers and probes for each target developed in Visual Omp 6 for the multiplex Q-PCR for C. burnetii DNA. Primer and probe sequences, the annealing positions on C. burnetii strain Nine Mile RSA phase I (RSA493) and product lengths obtained are given for C. burnetii targets icd, com1, and
3
Results
3.1 Temporal study I: monitoring a single farm in 2007 & 2008
In 2007, a single (goat)farm was implicated as one of the potential sources for the human Q fever outbreak in the vicinity of Herpen. On this farm a large abortion wave was reported among goats prior to the Q fever outbreak. In week 35 of 2007, samples of various environmental and animal matrices were
obtained and screened to investigate if C. burnetii DNA was present.
Environmental samples included surface area swabs, manure, and water. Animal samples were represented by milk and vaginal swabs of individual animals. A schematic representation of the farm can be found in Figure 2. In 2008, the same farm was visited again, this time in week 25 during the peak of the Q fever outbreak in the same rural area. Again, environmental and animal matrices were obtained from the same locations within the farm as in 2007. A total of 68 animal and environmental samples were collected in the two successive years. The number of samples per category can be found in Table 2. Samples were screened using the multiplex quantitative real time PCR assay and were scored as positive when at least one of the C. burnetii DNA targets (icd,
com1, or IS1111) showed a positive signal in combination with a positive signal
in the internal control target (cry1). Samples were scored as negative when no
C. burnetii targets showed positive signals in combination with a positive result
for the internal control.
In 2007, 17 out of 27 samples were found to be positive for C. burnetii DNA. In 2008, the number of positive samples was 40, out of a total of 41 samples. All vaginal swabs, taken from goats, were found to be positive for C. burnetii DNA in the two successive years. Two out of the four milk samples were positive in 2007, while in 2008 all 10 milk samples were found to contain C. burnetii DNA. The number of manure samples showed comparable numbers of samples and positive samples between the two years. Water samples showed 3 out of 5 samples positive in 2007, while in 2008 all 6 water samples were found to be positive.
# Samples # Positives # Samples # Positives
Vaginal Swabs (goats) 5 5 10 10
Milk 4 2 10 10 Manure 5 4 6 5 Surface Swabs 8 3 9 9 Water 5 3 6 6 2007 2008 Environment Animal Category Description
Table 2. Animal and environmental samples obtained from a commercial goat farm and screened with the multiplex real-time PCR assay.
Inhibition of the QPCR assay was occasionally observed. The strongest inhibition on the PCR assay was observed in environmental samples, like surface area swabs. In some PCR runs on these samples, the internal control (B. thuringiensis gene cry1) failed to produce a signal when undiluted DNA template was added to the PCR reaction mixture. Only after the samples were diluted 10 or 100 times, a positive signal could be observed for cry 1, indicating that these environmental matrices can inhibit our multiplex real time PCR assay quite strongly. The assay, however, was still able to detect C. burnetii DNA in these diluted samples.
A
E
F
D
C
B
C
G
A
E
F
D
C
B
C
G
Surface swabs Vaginal swabs Milk Manure Water Surface swabs Vaginal swabs Milk Manure Water Small stable Goats F Stable compartment Milking Unit G Small stable Sick lambs E Small stable Sick lambs D Stable compartment Goats C Middle section Walking area B Stable compartment Goats A Location Description Code Small stable Goats F Stable compartment Milking Unit G Small stable Sick lambs E Small stable Sick lambs D Stable compartment Goats C Middle section Walking area B Stable compartment Goats A Location Description CodeFigure 2. Schematic representation of a dairy goat farm, implicated in the 2007 Q fever outbreak. Letters indicate different compartments within the farm where samples were taken. Symbols indicate the different sample categories. Symbols in red indicate positive samples, and symbols in green negative samples. The monitoring of a single farm during two distinct Q fever outbreak seasons showed that a number of animals are at least carriers of the bacterium. These carriers may shed C. burnetii directly into the environment during lambing or regular excretion. In addition, C. burnetii DNA accumulates onto surface areas in relatively high concentrations compared to manure, milk, and water. This
indicates that C. burnetii transmission from the environment (in stables) to animals and humans by contaminated aerosols is plausible.
Results from 2008 showed more positive samples than in 2007. The reason for this is not quite clear, since the number of abortions during the 2008 lambing season was below 5%, while this exceeded the 5% level substantially in 2007. The C. burnetii DNA content may vary over time and between matrices which may explain the results obtained from the two different outbreak seasons.
3.2 Temporal study II: a single farm in 2009, unrelated to human cases
A second temporal study was started in February 2009, when a large abortion wave among goats was observed on a farm in the province of Overijssel. Q fever among goats was diagnosed by the Animal Health Service (GD). This was the first reported Q fever positive farm in 2009 and located outside the vaccination area established in February 2009. No human cases were reported in the vicinity of this farm in the weeks following this abortion wave. Eventually, in 2009, 2 cases were reported in this area.
Environmental samples included surface area swabs and aerosol samples within the stables and in the courtyard of the farm. In addition, aerosol samples were
Within the stable, surface area swabs contained the highest level of C. burnetii DNA in comparison to aerosol samples. In contrast, aerosol samples obtained from 8 locations (North, South, East, and West) within 1 and 5 km distance radius of the farm showed no C. burnetii DNA content. These findings are in concordance with the lack of human cases in this region. Despite the lack of human cases, the farmer was quite reluctant to cooperate when we announced to obtain aerosol samples in the direct surroundings of the farm.
3.3 Temporal study III: a single farm in 2009, related to human cases
We started a third temporal study in March 2009, when a large abortion wave among goats was observed on a farm in the province of Zuid-Limburg. Q fever among goats was diagnosed by the Animal Health Service. In addition, Q fever among humans on the farm was diagnosed by the Municipal Health Service (GGD) Zuid-Limburg. The farmer on this location was very cooperative and it was decided to follow the presence of C. burnetii DNA in environmental samples on this farm for at least 90 days as part of a newly started project for the Ministry of VWS. Ninety days is the time interval that manure excreted by the goats has to be confined and isolated on the farm itself and cannot be dispersed over meadows in fertilisation procedures.
In weeks 14, 21, and 30 of 2009, samples of various environmental and animal matrices were obtained and screened to investigate if C. burnetii DNA content changed during this time period. Environmental samples included surface area swabs, and aerosol samples within the stables and in the courtyard of the farm. In addition, aerosol samples were also taken within a 1 km radius of the farm in all directions (North, East, South & West). Animal samples were represented by manure droppings and mouth swabs of individual animals.
# Samples # Positives # Samples # Positives # Samples # Positives
Mouth Sw ab 1 1 - - 4 4 Manure 4 4 - - 4 4* Surface Sw abs 5 5 - - 4 4 Aerosols (stables) 2 2 - - 2 2 Aerosols (courtyard) 2 2 - - 2 2 Aerosols (1 km North) 1 1 1 0 1 1 Aerosols (1 km South) 1 1 1 1 1 1 Aerosols (1 km East) 1 1 1 0 1 1 Aerosols (1 km West) 1 1 1 1 1 1 Week 30 Environment Animal
Category Description Week 14 Week 21
Table 3. Animal and environmental samples obtained from a location in Zuid-Limburg in 2009.
Samples obtained in week 14 were all found to be positive, but differed in C.
burnetii DNA content. Coxiella burnetii content in aerosol samples obtained in
the courtyard was found to be lower compared to aerosol samples obtained in the stable. In addition, C. burnetii DNA content in aerosol samples, obtained from 4 locations (north, south, east, and west) within a 1 km distance radius of the farm was lower compared to aerosol samples obtained in the courtyard. In week 21 we were able to take only aerosol samples from a 1 km distance radius in the 4 directions (north, west, east & south) from the farm. Two aerosol samples were found to be positive: the southern and western locations. The level of C. burnetii DNA content on these locations was lower than in week 14. In week 30, Aerosol samples in stables again contained more C. burnetii DNA than aerosol samples obtained from the courtyard. Aerosol samples obtained from within a 1 km distance from the farm showed lower C. burnetii DNA
content than aerosol samples obtained from the courtyard. Surface area swabs again inhibited the PCR assay to some extent. In contrast, manure samples inhibited the PCR-assay quite severely, with one sample showing a negative result for the internal control even after a 100-fold dilution.
When all three sampling dates are compared, the number of positive samples is the same between weeks 14 and 30. However, C. burnetii DNA content detected within and around this farm is highest in week 14, just after the abortion wave among the goats and emerging human Q fever cases on the farm and in its near vicinity based. C. burnetii DNA content in all matrices sampled is quite
consistent when samples from weeks 14 and 30 are compared. The highest level of C. burnetii DNA content, within sampling dates, is found in surface area swabs obtained in the stables and mouth swabs of goats, followed by aerosols sampled in the stables. The level of C. burnetii DNA in manure obtained from stables is lower and comparable to the content of C. burnetii DNA in aerosols sampled in the courtyard. The lowest C. burnetii DNA content is found in aerosols obtained from 1 km distance in all four wind directions.
3.4 Q fever source finding investigations in 2008 & 2009
In 2008, the Q fever outbreak started in the month May around week 19. One of the first reports of human Q fever started to emerge in the province of
Gelderland, in the city of Nijmegen on a mental health care centre (7). In the subsequent weeks more human Q fever cases occurred all over the province. The Municipal Health Service (GGD) ‘Hart voor Brabant’ started an active source finding study by plotting human Q fever cases on the map of the province using 4-digit zip code addresses. This information was used, together with address information of (commercial) dairy goat farms, to pinpoint potential sources of C.
burnetii infection.
The Municipal Health Service, in close collaboration with the Food and Consumer Product Safety Authority (VWA) made selections of the most likely sources of C.
burnetii infection during the outbreak. Employees of the Food and Consumer
Product Safety Authority sampled primarily animal matrices (vaginal swabs) on dairy goat farms, which were considered the most likely source for human Q fever cases. Samples were transported to the National Institute for Public Health and the Environment (RIVM), which conducted the actual screening for C.
burnetii DNA by multiplex quantitative real time PCR (QPCR).
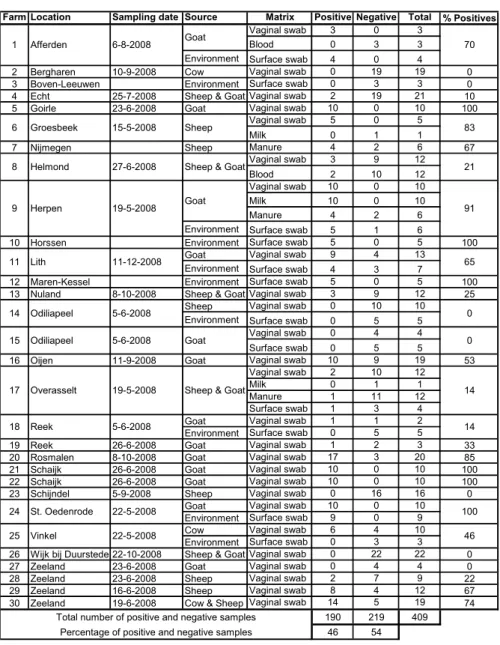
Between May and December of 2008, 409 samples divided over 30 farms were screened by the Laboratory for Zoonosis and Environmental Microbiology (LZO) of the RIVM. Samples screened were primarily animal matrices: vaginal swabs of goats, sheep & cattle, and to some extend blood, milk, and manure was
screened. Environmental matrices were represented by surface area swabs. Results of this screening can be found in Table 4. Seven locations (23%) were unlikely sources for the Q fever human cases in their near vicinity, because none of the samples tested positive. On 23 locations (77%), at least one sample scored positive and in 16 locations (53%), 50% or more of the samples tested positive. The total number of positive samples was found to be 190 (46%). On most farms, positive results for vaginal swabs in goats and/or sheep were accompanied by positive results for the surface area swabs taken on the same farm, and vice versa, if animal matrices scored negative in the assay, surface area swabs on the same farm also scored negative. These results indicate that
In 2009, the Q fever outbreak started in April around week 14. Again, most cases started to emerge in the province of Brabant. The relevant Municipal Health Services (GGD’s) started active source finding, again in close
collaboration with the Food and Consumer Product Safety Authority (VWA) and RIVM. Between April and October of 2009, 1008 samples divided over 57 farms were screened by RIVM-LZO. The same matrices were sampled and screened as in 2008. Results of this screening can be found in Table 5.
The percentage of positive samples per location again showed a large variation. Sixteen locations (26%) were unlikely sources for the human cases in their near vicinity, because none of the samples tested positive. In 41 locations (72%), at least one sample scored positive and in 30 locations (53%), 50% or more of the samples tested positive. The total number of positive samples was found to be 488 (48%).
Again, on most farms, positive results for vaginal swabs in goats and/or sheep were accompanied by positive results for the surface area swabs taken on the same farm, and vice versa, if animal matrices scored negative in the qPCR assay, surface area swabs on the same farm also scored negative. Screening results were forwarded by the Food and Consumer Product Safety Authority (VWA) to the Municipal Health Service (GGD’s).
Farm Location Sampling date Source Matrix Positive Negative Total % Positives Vaginal swab 3 0 3
Blood 0 3 3
Environment Surface swab 4 0 4 2 Bergharen 10-9-2008 Cow Vaginal swab 0 19 19 0 3 Boven-Leeuwen Environment Surface swab 0 3 3 0 4 Echt 25-7-2008 Sheep & Goat Vaginal swab 2 19 21 10 5 Goirle 23-6-2008 Goat Vaginal swab 10 0 10 100
Vaginal swab 5 0 5
Milk 0 1 1
7 Nijmegen Sheep Manure 4 2 6 67
Vaginal swab 3 9 12
Blood 2 10 12
Vaginal swab 10 0 10
Milk 10 0 10
Manure 4 2 6
Environment Surface swab 5 1 6
10 Horssen Environment Surface swab 5 0 5 100 Goat Vaginal swab 9 4 13
Environment Surface swab 4 3 7
12 Maren-Kessel Environment Surface swab 5 0 5 100 13 Nuland 8-10-2008 Sheep & Goat Vaginal swab 3 9 12 25
Sheep Vaginal swab 0 10 10 Environment Surface swab 0 5 5
Vaginal swab 0 4 4 Surface swab 0 5 5
16 Oijen 11-9-2008 Goat Vaginal swab 10 9 19 53 Vaginal swab 2 10 12
Milk 0 1 1
Manure 1 11 12
Surface swab 1 3 4 Goat Vaginal swab 1 1 2 Environment Surface swab 0 5 5
19 Reek 26-6-2008 Goat Vaginal swab 1 2 3 33 20 Rosmalen 8-10-2008 Goat Vaginal swab 17 3 20 85 21 Schaijk 26-6-2008 Goat Vaginal swab 10 0 10 100 22 Schaijk 26-6-2008 Goat Vaginal swab 10 0 10 100 23 Schijndel 5-9-2008 Sheep Vaginal swab 0 16 16 0
Goat Vaginal swab 10 0 10 Environment Surface swab 9 0 9 Cow Vaginal swab 6 4 10 Environment Surface swab 0 3 3 26 Wijk bij Duurstede 22-10-2008 Sheep & Goat Vaginal swab 0 22 22 0 27 Zeeland 23-6-2008 Goat Vaginal swab 0 4 4 0 28 Zeeland 23-6-2008 Sheep Vaginal swab 2 7 9 22 29 Zeeland 16-6-2008 Sheep Vaginal swab 8 4 12 67 30 Zeeland 19-6-2008 Cow & Sheep Vaginal swab 14 5 19 74
190 219 409 46 54 Total number of positive and negative samples
Percentage of positive and negative samples 1 Afferden 6-8-2008 11 Lith 11-12-2008 6 Groesbeek 15-5-2008 Goat 8 Helmond 27-6-2008 9 Herpen 19-5-2008 Odiliapeel 5-6-2008 15 Odiliapeel 5-6-2008 Goat Sheep
Sheep & Goat
18 Reek 5-6-2008 Goat 17 Overasselt 19-5-2008 21 25 Vinkel 22-5-2008 24 St. Oedenrode 22-5-2008
Sheep & Goat 14 70 83 91 65 0 0 14 14 100 46
Table 4. Animal and environmental samples obtained from 30 locations within the province of Brabant in 2008. Indicated is the number of positive and negative samples, the total number of samples, and percentage of positive samples per farm.
Farm Location Sampling date Source Matrix Positive Negative Total % Positive samples
Sheep Vaginal swab 11 2 13
Environment Surface area swab 4 4
2 Aarle Rixel 13-5-2009 Sheep Vaginal swab 8 26 34 24
Environment Surface area swab 1 1
Goat Vaginal swab 14 14
4 Alem location 2 10-8-2009 Goat Vaginal swab 3 3 0
Goat Vaginal swab 2 12 14
Environment Surface area swab 4 4
6 Bakel 13-5-2009 Goat Vaginal swab 20 20 100
7 Belfeld 8-7-2009 Goat Vaginal swab 20 20 100
8 Boven-Leeuwen 10-8-2009 Goat Vaginal swab 22 22 0
Goat Vaginal swab 19 19
Environment Surface area swab 4 4
10 Den Bosch 9-7-2009 Goat Vaginal swab 6 14 20 30
11 Deventer 30-9-2009 Sheep & goat Vaginal swab 20 20 0
Goat Vaginal swab 7 7 14
Environment Surface area swab 1 1
13 Drunen 16-7-2009 Geit Vaginal swab 10 10 20 50
14 Echt 13-7-2009 Sheep & goat Vaginal swab 4 15 19 21
15 Haghorst 25-6-2009 Goat Vaginal swab 20 20 100
16 Haren (NB) 11-8-2009 Goat Vaginal swab 2 12 14 14
Goat Vaginal swab 14 5 19
Environment Surface area swab 12 12
18 Heerlen 2-7-2009 Sheep Vaginal swab 9 11 20 45
19 Helvoirt location 1 16-7-2009 Geit Vaginal swab 14 14 0
20 Helvoirt location 2 16-7-2009 Geit Vaginal swab 10 9 19 53
21 Hilvarenbeek location 1 25-6-2009 Goat Vaginal swab 16 3 19 84
22 Hilvarenbeek location 2 25-6-2009 Goat Vaginal swab 19 1 20 95
23 Horssen 20-5-2009 Goat Vaginal swab 19 1 20 95
24 Houten location 1 4-6-2009 Sheep & goat Vaginal swab 1 13 14 7
25 Houten location 2 15-7-2009 Sheep Vaginal swab 10 10 0
Goat Vaginal swab 2 11 13
Environment Surface area swab 1 3 4
Goat Vaginal swab 13 7 20
Environment Surface area swab 2 2
28 Leffen location 1 28-7-2009 Sheep Vaginal swab 10 9 19 53
29 Leffen location 2 30-7-2009 Sheep Vaginal swab 16 6 22 73
Goat Vaginal swab 20 20
Environment Surface area swab 9 9
31 Maren Kessel 11-8-2009 Goat Vaginal swab 4 15 19 21
32 Megen 11-8-2009 Goat Vaginal swab 14 6 20 70
Birds Manure 8 8
Environment Surface area swab 4 4
34 Nistelrode 9-9-2009 Sheep Vaginal swab 20 20 0
35 Nuenen 15-5-2009 Sheep Vaginal swab 18 1 19 95
Milk 3 3
Vaginal swab 4 4
37 Oerle-Veldhoven 25-6-2009 Goat Vaginal swab 17 3 20 85
38 Oldenzaal 3-7-2009 Goat Vaginal swab 13 7 20 65
39 Ommeren 21-8-2009 Sheep Vaginal swab 20 20 0
40 Oss location 1 28-7-2009 Sheep Vaginal swab 12 8 20 60
Goat Vaginal swab 13 7 20
Environment Surface area swab 2 2
Goat Vaginal swab 4 1 5
Environment Surface area swab 1 1
Goat Vaginal swab 5 5
Environment Surface area swab 1 1
44 Schaijck lokation 1 8-7-2009 Goat Vaginal swab 17 3 20 85
45 Schaijck lokation 2 8-7-2009 Goat Vaginal swab 20 20 100
Cattle Milk 5 5
Environment Filter 4 4
Sheep Vaginal swab 3 2 5
Environment Surface area swab 1 1
48 St-Michielsgestel 16-7-2009 Goat Vaginal swab 1 19 20 5
Goat Vaginal swab 7 3 10
Environment Surface area swab 2 2
50 Veghel 23-4-2009 Sheep Vaginal swab 5 5 0
51 Venray 24-6-2009 Birds Surface area swab 3 9 12 25
52 Voorschoten 18-9-2009 Sheep & goat Vaginal swab 23 23 0
53 Vorstenbosch 9-9-2009 Sheep & goat Vaginal swab 7 7 0
Goat Vaginal swab 21 21
Environment Surface area swab 4 4 8
Goat Vaginal swab 20 20
Environment Surface area swab 7 2 9
Vaginal swab 20 20
Milk 1 1
Environment Surface area swab 1 1
Red Deer Manure 1 1
Environment Milk filter 2 2
Envrionment Surface area swab 2 2 4
488 520 1008
48 52
Total number of positive and negative samples Percentage of positive and negative samples
Horse 55 Weerselo 19-6-2009 57 Zeeland location 2 8-7-2009 56 Zeeland location 1 20-7-2009 49 Tilburg 27-7-2009 54 Vlijmen 17-6-2009 46 Schaijck location 3 3-9-2009 47 Scherpenisse 17-7-2009 41 Oss location 2 28-7-2009 43 Rhenen 7-8-2009 42 Oss location 3 28-7-2009 36 Nuland 17-6-2009 Horse 30 Lutten 26-8-2009 33 Milsbeek 24-6-2009 26 Houten location 3 15-7-2009 27 Houten location 4 15-7-2009 12 Dreumel 7-8-2009 17 Heerhugowaard 9-7-2009 5 Appeltern 18-5-2009 9 Bunnik 15-7-2009 1 Aalst 17-7-2009 3 Alem location 1 10-8-2009 88 7 11 100 53 84 18 68 0 0 0 68 67 0 0 67 57 58 86 93 0
Table 5. Animal and environmental samples obtained from 57 locations Within the province of Brabant in 2009. Indicated is the number of positive and negative samples, the total number of samples, and percentage of positive samples per farm.
4
Discussion
4.1 Temporal studies
In temporal study I, Coxiella burnetii was found in veterinary and environmental samples obtained from a single farm during two successive years of Q fever outbreaks (2007 & 2008). Abortions among goats were observed on a large scale only in 2007. In 2008 no abortions were observed on this particular farm. This indicates that C. burnetii can persist and be detected in large quantities on farms for prolonged periods of time, without causing abortions or stillbirths among goats or without being produced by these, as reported previously (8,9) In temporal study II, C. burnetii DNA was found in all environmental samples examined and the Animal Health Service found C. burnetii in veterinary matrices. This particular farm differs from the farm in temporal study I in the fact that almost no human Q fever cases were observed in the near vicinity of this farm in 2009.
Temporal study III showed that within the Q fever outbreak of 2009, the C.
burnetii DNA content in both veterinary and environmental samples declined
after the initial wave of abortions among goats. It seems plausible, yet
unproven, that the decline of the number of human Q fever cases can be related to the declining C. burnetii DNA concentrations found on farms and their direct surroundings in the months after the lambing season.
The level of C. burnetii DNA content in veterinary and environmental samples on farms in temporal study II & III is comparable. Both farms showed abortions among goats on a large scale in the lambing season of 2009. However, the farm in temporal study II can not be linked to a significant number of human Q fever cases in the near vicinity of the farm, while the farm in temporal study III is implicated to be involved in a human Q fever cluster in the same region. Both farms are located far outside the Q fever-affected area in the Netherlands, Noord-Brabant. The discrepancy between the farms in temporal studies I, II, and III in the involvement in human Q fever outbreaks is not entirely clear. Probably, differences in farming procedures, farm construction, or local climate differences (drought, rainfall, wind directions at the time of the abortion wave), and local population densities played a role in these differences.
4.2 Source investigations
The highest level of C. burnetii DNA content was found in placenta materials, obtained from aborting goats, during an abortion wave on dairy goat farms in 2007. These positive materials were provided by the Animal Health Service (GD) and were screened to investigate the level of C. burnetii DNA content, in
comparison to other more easily obtainable animal and environmental matrices. Placenta materials are not easily obtained, because the moment of birth or abortion is unpredictable, and these materials are consumed by the goats or become untraceable due to dispersion in the stables.
Both temporal and source investigation studies showed that, after placenta materials, vaginal swabs obtained from goats contained the highest level of C.
burnetii DNA in the veterinary matrix category. Milk samples, obtained from
individual goats, also contained C. burnetii DNA, however, to a lesser extent than vaginal swabs obtained from the same animals. Manure droppings, obtained from within the stables, contained more C. burnetii DNA than milk samples, but less than in vaginal swabs. We have to take into account however that sample matrix and DNA extraction efficiency differs for these different
sample categories and hence the measured C. burnetii DNA content cannot be extrapolated to a number of C. burnetii bacteria present in the original sample material. Comparisons within one sample category are therefore justified. Comparisons between the different categories should be regarded as qualitative. They merely represent the overall efficiency for detecting C. burnetii DNA in relation to each other.
In the environmental category, surface area swabs contained the highest level of
C. burnetii DNA and this level was comparable to the vaginal swabs of goats.
However, surface area swabs can inhibit the PCR assay quite considerably, which underestimates the level of C. burnetii DNA content in this matrix. In most farms, positive results for vaginal swabs in goats and/or sheep were
accompanied by positive results for the surface area swabs taken on the same farm, and vice versa, if animal matrices scored negative in the assay, surface area swabs on the same farm also scored negative. These results indicate that both animal matrices like vaginal swabs and environmental matrices like surface area swab are good indicators for the presence of C. burnetii.
Aerosols provide valuable information on potential transmission routes from the environment to animals and humans. The highest level of C. burnetii DNA content was found in aerosols sampled in the stables. The C. burnetii DNA content in aerosols sampled in the courtyard was lower than obtained from within the stables. The lowest C. burnetii DNA content was found in aerosols obtained from 1 km distance (in all four wind directions) of a Q fever affected farm. Although currently available data are limited, this seems a plausible outcome.
The relation between the C. burnetii DNA content in the matrices screened at one particular time point is quite consistent when followed over an extended period of time.
These findings are of importance, since shedding of C. burnetii directly into the environment via the vagina during lambing or regular excretion, and subsequent dispersion via contaminated aerosols is thought to be the primary route for human C. burnetii infection. Therefore, it is important to obtain at least (i) vaginal swabs from individual animals (goats or sheep), (ii) surface area swab from within the stables and (ii) aerosol samples from the stables and near surroundings (courtyard to 1-2 km distance) during sampling procedures in source finding investigations.
5
Conclusions
Coxiella burnetii was found in veterinary and environmental samples obtained
from a single Q fever affected farm during two successive years of Q fever outbreaks (2007 & 2008). Therefore, the public health risk for farmers and individuals living in the vicinity of such a farm encompasses more than one lambing season.
C. burnetii DNA can be detected in aerosols on Q fever-affected goat farms, and
their direct surroundings.
Within the Q fever outbreak of 2009, C. burnetii DNA could be detected for at least 16 weeks, although the C. burnetii DNA content in both veterinary and environmental samples declined over time after the initial wave of abortions among goats. Although the public health risk seems to decrease over time, consistent with the observed decrease in cases over the year, transmission from the environment to humans can take place up to several months following the lambing season.
Screening results for vaginal swabs obtained from goats and/or sheep are consistent with results for surface area swabs taken on the same farm.
During outbreak investigations it is important to obtain at least (i) vaginal swabs from individual animals (goats or sheep), (ii) surface area swabs from within the stables and (iii) aerosol samples from the stables and near surroundings
Published by:
National Institute for Public Health and the Environment
P.O. Box 1 | 3720 BA Bilthoven The Netherlands
6
Literature
1. Karagiannis, I., Schimmer, B., van Lier, A., Timen, A., Schneeberger, P., van Rotterdam, B., de Bruin, A., Wijkmans, C., Rietveld, A. and van Duynhoven, Y. 2009 Investigation of a Q fever outbreak in a rural area of The Netherlands. Epidemiol. Infect.: 1-12.
2. Madariaga, M.G., Rezai, K., Trenholme, G.M. and Weinstein, R.A. 2003 Q fever: a biological weapon in your backyard. Lancet Infect Dis 3:709-21. 3. Parker, N.R., Barralet, J.H. and Bell., A.M. 2006 Q fever. Lancet
367:679-88.
4. Guatteo, R., Beaudeau, F., Joly, A. and Seegers, H. 2007 Coxiella
burnetii shedding by dairy cows. Vet Res 38:849-60.
5. Rodolakis, A., Berri, M., Hechard, C., Caudron, C., Souriau, A., Bodier, C.C., Blanchard, B., Camuset, P., Devillechaise, P., Natorp, J.C., Vadet, P., and Arricau-Bouvery, N. 2007 Comparison of Coxiella burnetii shedding in milk of dairy bovine, caprine, and ovine herds. J Dairy Sci 90:5352-60.
6. Schimmer, B., ter Schegget, R., Wegdam, M., Züchner, L., de Bruin, A., Schneeberger, P.M., Veenstra, T., Vellema, P. and van der Hoek, . The use of a geographic information system to identify a dairy goat farm as the most likely source of an urban Q fever outbreak. (submitted). 7. Koene, R.P.M., Schimmer, B., Rensen, H., Biesheuvel, M., de Bruin, A.,
Lohuis, A., Horrevorts, A., Verduyn Lunel, F. and Hautvast, J. Q fever outbreak in a psychiatric care institution, the Netherlands, May 2008. (submitted)
8. Astobiza, I., Barandikaa, J.F., Hurtadoa, A., Justea, R.A. and García-Pérez, A.L. 2009 Kinetics of Coxiella burnetii excretion in a commercial dairy sheep flock after treatment with oxytetracycline. The Veterinary Journal (epub ahead of print).
9. Berri, M., Rousset, E., Champion, J.L., Russo, P. and Rodolakis, A. 2007 Goats may experience reproductive failures and shed Coxiella burnetii at two successive parturitions after a Q fever infection. Research in