RIVM Letter report 270006003/2014
R. van Herwijnen | E.M.J. Verbruggen
Water quality standards for uranium
Proposal for new standards according to the Water
Framework Directive
RIVM Letter report 270006003/2014
R. van Herwijnen │ E.M.J. Verbruggen
Colofon
© RIVM 2014
Parts of this publication may be reproduced, provided acknowledgement is given
to the 'National Institute for Public Health and the Environment', along with the
title and year of publication.
This is a publication of:
National Institute for Public Health
and the Environment
P.O. Box 1│3720 BA Bilthoven
The Netherlands
www.rivm.nl/en
R. van Herwijnen
E.M.J. Verbruggen
Contact:
R. van Herwijnen
Centre for Safety of Substances and Products
rene.van.herwijnen@rivm.nl
This investigation has been performed by order and for the account of the
ministry of Infrastructure and the Environment, within the framework of the
project "Chemical aspects of WFD and RPS".
Abstract
New environmental quality standards for uranium in water
Uranium is listed as a specific pollutant in the Dutch decree on monitoring for
the Water Framework Directive (Regeling monitoring Kaderrichtlijn water). The
compound is frequently detected in Dutch surface waters at concentrations
above the current standards. New standards are necessary because the current
ones do not comply with the most recent guidelines. On request of the Dutch
ministry of Infrastructure and Environment (I&M), the RIVM presents a proposal
for these new standards. The ministry has accepted the proposals in this report,
and will set the new quality standards when updating the decree on monitoring
in 2015.
Emission sources
Uranium is a natural compound present in rocks and soils. Its main entry in the
environment is through mining, combustion of coal and the use of artificial
fertiliser. Because of these sources the environmental concentration of uranium
may increase above its natural background concentration. Uranium is commonly
known for its radioactivity and use of enriched uranium in nuclear power plants
and nuclear weapons. These sources, however, hardly contribute to the
anthropogenic emission of uranium to the environment. Furthermore, the
chemical toxicity of natural uranium is much more harmful than the potential
environmental impact through its radioactivity. Therefore, this proposal is based
on the (eco)toxicity of uranium and does not cover radioactivity
Two quality standards for water
Under the Water Framework Directive two types of quality standards are
handled: the Annual Average Environmental Quality Standard (AA-EQS) and the
Maximum Acceptable Concentration EQS (MAC-EQS). The AA-EQS is the
concentration which should protect the ecosystem against adverse effects
resulting from long-term exposure. The proposed AA-EQS is 0.5 microgram per
litre. The MAC-EQS protects aquatic ecosystems from effects due to short-term
exposure or concentration peaks. The latter standard did not exist for uranium
and is proposed at 8.9 microgram per litre. Both standards are expressed as
dissolved uranium, including background levels. The prosed AA-EQS is lower
than the current value. Monitoring data indicate that the proposed value is
currently exceeded in some of the Dutch surface waters.
Keywords:
Publiekssamenvatting
Nieuwe waterkwaliteitsnormen voor uranium
In de Regeling Monitoring Kaderrichtlijn Water (KRW) staat aan welke eisen het
oppervlaktewater in Nederland moet voldoen, onder andere voor uranium.
Uranium wordt op veel locaties aangetroffen in concentraties boven de huidige
norm. Deze norm is echter niet afgeleid volgens de meest recente methodiek. In
opdracht van het ministerie van Infrastructuur en Milieu (IenM) heeft het RIVM
nieuwe waterkwaliteitsnormen voorgesteld, die het ministerie vervolgens heeft
overgenomen – de nieuwe waarden zullen eind 2015 worden opgenomen in de
nieuwe Regeling monitoring KRW.
Bronnen van uranium
Uranium is een stof die van nature in rotsen en in de bodem zit. Uranium komt
hoofdzakelijk in het milieu terecht via mijnbouw, de verbranding van steenkool
en het gebruik van kunstmest. Dit kan ertoe leiden dat de concentratie van
uranium in het milieu hoger wordt dan de van nature aanwezige
achtergrondconcentratie. Uranium is vooral bekend vanwege de radioactiviteit
en het gebruik van de sterk radioactieve vorm in kerncentrales en
atoomwapens. Deze bronnen leveren echter maar een kleine bijdrage aan de
hoeveelheid uranium in het milieu. De chemische eigenschappen van natuurlijk
uranium zijn daarentegen veel schadelijker dan de radioactieve eigenschappen
ervan. De normvoorstellen zijn daarom alleen gebaseerd op de
(eco)toxicologische eigenschappen van uranium en hebben geen betrekking op
de radioactiviteit.
Twee waterkwaliteitsnormen
De Kaderrichtlijn Water hanteert twee typen waterkwaliteitsnormen: de
Jaargemiddelde Milieukwaliteitsnorm (JG-MKN) en de Maximaal Aanvaardbare
Concentratie (MAC-MKN). De JG-MKN is de concentratie in water waarbij geen
schadelijke effecten te verwachten zijn na langdurige blootstelling (0,5
microgram per liter). De MAC-MKN beschermt het ecosysteem tegen
kortdurende concentratiepieken (8,9 microgram per liter). Beide normen gelden
voor de concentratie uranium die in water is opgelost en de
achtergrondconcentratie is in de norm verrekend. De voorgestelde JG-MKN is
iets aangescherpt in vergelijking met de huidige norm en zal naar verwachting
op een aantal locaties worden overschreden.
Trefwoorden:
Contents
Summary — 9
1
Introduction — 11
1.1
Background and aim — 11
1.2
Standards considered — 11
1.3
Current standards — 13
1.4
Use and sources of uranium — 13
1.5
Uranium, radioactivity and speciation — 13
2
Methods — 15
2.1
General — 15
2.2
Added risk approach — 15
2.3
Data collection and evaluation — 16
3
Substance identification, physico-chemical properties, fate and human
toxicology — 17
3.1
Identity — 17
3.2
Physico-chemical properties — 18
3.3
Detection limit — 20
3.4
Bioaccumulation, bioconcentration and biomagnification — 20
3.5
Human toxicological threshold limits and carcinogenicity — 26
4
Aquatic toxicity data — 27
4.1
Laboratory toxicity data — 27
4.2
Treatment of fresh- and salt-water toxicity data — 31
5
Derivation of water quality standards — 33
5.1
Derivation of AA-EQS
fwand AA-EQS
sw— 33
5.1.1
QS
fw, ecoand QS
sw, eco— 33
5.1.2
QS
fw, secpoisand QS
sw, secpois— 35
5.1.3
QS
water, hh food— 41
5.1.4
Selection of the AA-EQS
fwand AA-EQS
sw— 42
5.2
Derivation of QS
dw, hh— 43
5.3
Derivation of MAC-EQS
eco— 43
5.3.1
Assessment factor approach — 43
5.3.2
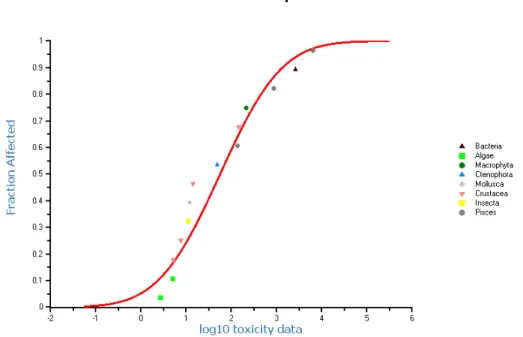
SSD approach — 43
5.3.3
Choice of the MAC-EQS
fw, eco— 44
5.4
Derivation of NC — 44
5.5
Derivation of SRC
water, eco— 44
6
Comparison of derived EQSs with monitoring data — 45
7
Conclusions — 47
References — 49
Summary
Uranium is listed as a specific pollutant in the Dutch decree on WFD-monitoring
(Regeling monitoring Kaderrichtlijn water).In this report a proposal is made for
environmental quality standards (EQSs) for uranium in surface water. The
quality standards are derived using ecotoxicological, physico-chemical, and
human toxicological data originating from an evaluation of the available recent
literature. They represent environmental concentrations of the substance
offering different levels of protection to man and ecosystems. It should be noted
that the proposed EQSs are scientifically derived values. They serve as advisory
values for the Dutch Ministry of Infrastructure and the Environment. The
ministry has accepted the proposals in this report, and will set the new quality
standards when updating the decree on WFD-monitoring in 2015.
Under the WFD, two types of EQSs are derived to cover both long term and
short term effects resulting from exposure: an annual average concentration
(AA-EQS) to protect against the occurrence of prolonged exposure, and a
maximum acceptable concentration (MAC-EQS) to protect against possible
effects from short term concentration peaks. For the derivation of the AA-EQS
and MAC-EQS for water, the methodology used is in accordance with the WFD.
The AA-EQS considers direct ecotoxicity, secondary poisoning of predatory birds
and mammals, and exposure of humans via consumption of fish and shellfish.
The MAC-EQS is based on direct ecotoxicity only. Since the ‘chemical toxicity’ of
natural uranium is much higher than its ‘radiotoxicity’, only the first is
considered in this report. Recent data on background concentrations in Dutch
surface water are taken into account.
Next to the AA-EQS and MAC-EQS, the WFD also considers a standard for
surface water used for drinking water abstraction. In addition to these
WFD-standards, this report also contains additional risk limits that can be used for the
purpose of national water quality policy, e.g. discharge permits or specific policy
measures. These are the Negligible Concentration (NC), and the Serious Risk
Concentration for ecosystems (SRC
eco). For the NC and the SRC
eco, existing
national guidance was used.
Direct ecotoxicity appeared to be the most critical route for derivation of the
AA-EQS. There are strong indications that for birds, exposure to contaminated water
plants is a major exposure route. This is not included in the current
WFD-methodology, and it is advised to further evaluate the importance of this route.
For the saltwater compartiment, reliable data on bioaccumulation and ecotoxicity
were absent and it is not possible to propose new standards. An overview of the
derived environmental risk limits is given in Table 1. The proposed AA-EQS
fwis
lower than the current quality standard. Monitoring data indicate that the
proposed value will most likely be exceeded in some of the Dutch surface
waters.
Table 1. Summary of proposed water quality standards for uranium. Values in
bold are required standards according to the WFD. Values are expressed as
dissolved uranium, including background concentrations
Value
[µg
U/L]
Freshwater
AA-EQS 0.5
MAC-EQS 8.9
NC 0.33
SRC
eco56
Surface water for drinking water production
1
Introduction
1.1
Background and aim
In this report, a proposal is made for environmental quality standards (EQSs) for
uranium in surface water. Uranium is listed in the Dutch decree on monitoring
within the context of the Water Framework Directive (WFD), also referred to as
Regeling monitoring KRW. The current water quality standards for uranium do
not comply with the most recent methodology for EQS derivation. The list of
so-called ‘specific pollutants’ included in the Regeling monitoring KRW has been
evaluated in view of the second round of river basin management plans for
2015–2021 [1]. For those substances remaining on the list, including uranium,
updated water quality standards according to the methodology of the WFD have
to be derived.
Under the WFD, two types of EQSs are derived to cover both long- and
short-term effects resulting from exposure:
an annual average concentration (AA-EQS) to protect against the
occurrence of prolonged exposure, and
a maximum acceptable concentration (MAC-EQS) to protect against
possible effects from short term concentration peaks.
In Dutch, these two WFD-standards are indicated as ‘JG-MKN’ and ‘MAC-MKN’,
respectively
1.
Quality standards for soil, sediment, groundwater and suspended matter in
surface water will not be derived in this report, because they are not relevant for
compliance check under the Regeling Monitoring KRW.
Since the ‘chemical toxicity’ of natural uranium is much higher than its ‘radio
toxicity’, only the first is considered for the EQSs in this report.
1.2
Standards considered
As indicated above, this report primarily focuses on the WFD-water quality
standards. Next to the AA-EQS and MAC-EQS, the WFD also considers a
standard for surface water used for drinking water abstraction. Below, a short
explanation on the respective standards is provided and the terminology is
summarised in Table 2. Note that all standards refer to dissolved concentrations
in water.
-
Annual Average EQS (AA-EQS) – a long-term standard, expressed as an
annual average concentration (AA-EQS) and normally based on chronic
toxicity data which should protect the ecosystem against adverse effects
resulting from long-term exposure.
The AA-EQS should not result in risks due to secondary poisoning and/or
risks for human health aspects. These aspects are therefore also
addressed in the AA-EQS, when triggered by the characteristics of the
compound (i.e. human toxicology and/or potential to bioaccumulate).
Separate AA-EQSs are derived for the freshwater and saltwater
environment.
-
Maximum Acceptable Concentration EQS (MAC-EQS) for aquatic
ecosystems – the concentration protecting aquatic ecosystems from
effects due to short-term exposure or concentration peaks. The MAC-EQS
is derived for freshwater and saltwater ecosystems, and is based on direct
ecotoxicity only.
-
Quality standard for surface water that is used for drinking water
abstraction (QS
dw, hh). This is the concentration in surface water that
meets the requirements for use of surface water for drinking water
production. The QS
dw, hhspecifically refers to locations that are used for
drinking water abstraction.
The quality standards in the context of the WFD refer to the absence of any
impact on community structure of aquatic ecosystems. Hence, not the potential
to recover after transient exposure, but long-term undisturbed function is the
protection objective under the WFD. Recovery in a test situation, after a limited
exposure time, is therefore not included in the derivation of the AA- and
MAC-EQS.
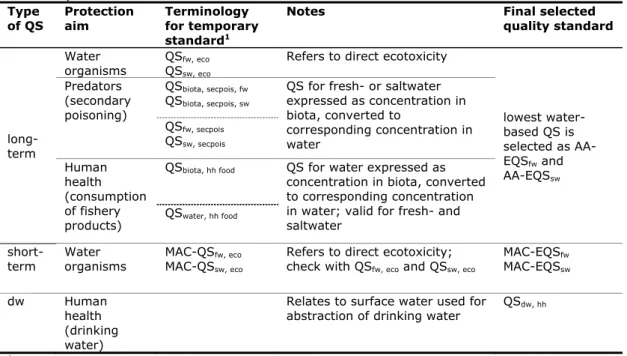
Table 2. Overview of the different types of WFD-quality standards for freshwater
(fw), saltwater (sw) and surface water used for drinking water (dw) considered
in this report.
Type
of QS
Protection
aim
Terminology
for temporary
standard
1Notes Final
selected
quality standard
long-term
Water
organisms
QS
QS
fw, eco sw, ecoRefers to direct ecotoxicity
lowest water-
based QS is
selected as
AA-EQS
fwand
AA-EQS
swPredators
(secondary
poisoning)
QS
biota, secpois, fwQS
biota, secpois, swQS for fresh- or saltwater
expressed as concentration in
biota, converted to
corresponding concentration in
water
QS
fw, secpoisQS
sw, secpoisHuman
health
(consumption
of fishery
products)
QS
biota, hh foodQS for water expressed as
concentration in biota, converted
to corresponding concentration
in water; valid for fresh- and
saltwater
QS
water, hh foodshort-term
Water
organisms
MAC-QS
MAC-QS
fw, eco sw, ecoRefers to direct ecotoxicity;
check with QS
fw, ecoand QS
sw, ecoMAC-EQS
fwMAC-EQS
swdw Human
health
(drinking
water)
Relates to surface water used for
abstraction of drinking water
QS
dw, hh1
Note that the subscript “fw” refers to the freshwater, “sw” to saltwater; subscript “water”
is used for all waters, including marine.
For the purpose of national water quality policy, e.g. discharge permits or
specific policy measures, two additional risk limits are derived:
derived by dividing the AA-EQS by a factor of 100, in line with the Dutch
policy [2,3].
-
Serious Risk Concentration for ecosystems (SRC
eco) – the concentration in
water at which possibly serious ecotoxicological effects are to be
expected. The SRC
ecois valid for the freshwater and saltwater
compartment.
According to the WFD-methodology, the fact that uranium is a naturally
occurring element may be taken into account by using the ‘added risk approach’.
In short, this means that the standards are expressed as concentrations that
may be added to the natural background concentration. In this report, the
expression of values as an added concentration is indicated by using the
subscript ‘added’, e.g. QS
added, fw, eco.Note that the added risk approach is only
applicable to direct ecotoxiciy, see section 2.2 for more information.
1.3
Current standards
Since natural background concentrations for uranium in the Netherlands have
only recently been officially established, the current standards for uranium are
only available as added concentrations, excluding background values. The
current Maximum Permissible Additions (MPAs, comparable to the QS
added, fw, eco)
for uranium in fresh- and salt surface water and in groundwater are 1 µg/L. The
derivation of these values is reported by Van de Plassche et al. [4].
1.4
Use and sources of uranium
Uranium is a natural element which is mainly known for its use in nuclear power
plants and in nuclear weapons. Other (civilian) uses are as counter weight in
airplanes and in ammunition. These uses are in general not the main sources of
anthropogenic uranium in the environment. Because of its natural presence in
rocks and soil, anthropogenic activities like mining, ore processing, agriculture
(phosphate fertilizers) and coal combustion contribute to an increased presence
of uranium above is natural background concentration [5]. These sources can all
be considered relevant for the anthropogenic uranium in the Dutch rivers.
1.5
Uranium, radioactivity and speciation
Uranium is a radioactive substance that is naturally present in the environment
in three different isotopes:
234U,
235U and
238U. The latter isotope is most present
in the environment (99.3%), has the longest half-life and is therefore the least
radioactive. See Table 3 for more details. Only studies performed with uranium
in its natural isotope ratio are considered relevant for the EQS derivation. In
natural oxygenated systems, the most common oxidation state is the hexavalent
uranyl ion (UO
2+)[6]. The uranyl ion will be available in the toxicity tests when
compounds like uranyl nitrate, uranyl acetate, uranyl chloride are dissolved.
UO
2+itself is not soluble but after release it complexes readily with carbonate,
Table 3. Isotopes of uranium [8]
Isotope
natural presence (%)
half-life (years)
233
U not
natural
1.592×10
3234
U 0.0055
2.455×10
5235
U 0.72
7.038×10
8236
U not
natural
2.342×10
72
Methods
2.1
General
The methodology is in accordance with the European guidance document for
derivation of environmental quality standards under the WFD [9]. This document
is further referred to as the WFD-guidance. Additional guidance for derivation of
EQSs that are specific for the Netherlands, such as the NC and SRC, can be
found in Van Vlaardingen and Verbruggen [10]. This guidance document was
prepared for derivation of EQSs in the context of the project “International and
national environmental quality standards for substances in the Netherlands
(INS)”, and is further referred to as the INS-guidance. Similar to the
WFD-guidance, the INS-guidance is based on the Technical Guidance Document
(TGD), issued by the European Commission and developed in support of the risk
assessment of new notified chemical substances, existing substances and
biocides [11] and on the Manual for the derivation of Environmental Quality
Standards in accordance with the Water Framework Directive [12]. The
WFD-guidance also takes into account the most recent WFD-guidance developed under
REACH [13].
It should be noted that the recent WFD-guidance deviates from the
INS-guidance for some of aspects. This specifically applies to the treatment of data
for freshwater and marine species (see section 4.2) and the derivation of the
MAC (see section 5.3), and also holds for the QS for surface waters intended for
the abstraction of drinking water (QS
dw, hh, see section 5.2). Where applicable,
the WFD-guidance is followed and the INS-guidance is used for situations which
are not covered by the former.
2.2
Added risk approach
For derivation of EQSs for metals, the WFD Guidance [9] proposes to follow the
added risk approach and to include background concentrations in the final EQS
for metals.
The added risk approach is used to take natural background concentrations into
account when calculating EQSs for naturally occurring substances. The approach
starts by calculating a maximum addition for chronic exposure and short-term
concentration peaks equivalent to the QS
ecoand MAC-QS
eco. These additions,
denoted as QS
added, ecoand MAC-QS
added, eco, are derived on the basis of available
data from laboratory toxicity tests (with added amounts of toxicants). The
QS
added, ecoand MAC-QS
added, ecoare considered to be the maximum
concentrations to be added to the background concentration (C
b), without
causing deleterious effects. Hence, the QS
ecois the sum of C
band QS
added, eco,
and the MAC-QS
ecois the sum of C
band MAC-QS
added, eco:
QS
eco= C
b+ QS
added, ecoMAC-QS
eco= C
b+ MAC-QS
added, ecoThe background concentration and the QS
added, eco/MAC-QS
added, ecoare
The aquatic EQSs derived in this report are for dissolved uranium. Monitoring
data [14] showed that the uranium in filtered samples is comparable to the
concentration in the unfiltered samples. Therefore all measured concentrations
in the test solutions are considered as dissolved concentrations. The dissolved
concentration of uranium is also considered to be fully bioavailable. In contrast,
the background concentration is assumed to be completely unavailable, since at
present there is insufficient information to determine the bioavailability of the
background concentrations for metals. For uranium, a background concentration
of 0.33 µg/L for the Netherlands has been set [15]. In the database that might
be used according to the WFD Guidance (EC, 2011):
http://www.gsf.fi/publ/foregsatlas/
; (accessed on 1 November 2012)
background concentrations for uranium in the Netherlands are reported ranging
from 0.087 to 0.97 µg/L. The new background concentration falls within this
range.
The WFD Guidance also notes that the recent developments in the area of biotic
ligand modelling (BLM) may be used in the future for the assessment of
bioavailability and the calculation of local quality standards after comprehensive
data have become available for validation. In the case of uranium no BLMs are
present.
2.3
Data collection and evaluation
An online literature search was performed on SCOPUS, the search profile is
given in Appendix 1. This profile was run at 27-1-2012. At 28-8-2012 this profile
was repeated for the year 2012. The total search resulted in approximately 1700
references, of which more than 90 references were considered relevant. In
addition to this, references given in Danish and Canadian reports on derivation
of environmental risk limits for uranium [6,16] have been checked for additional
references. A REACH dossier on uranium is currently not available.
Studies were evaluated according to the Klimisch criteria [17], where, in the
case of uranium, only studies where the endpoints were based on measured
values were considered to be valid. Valid L(E)C50-or NOEC/EC10-values were
used to construct aggregated data tables for acute and chronic toxicity,
respectively, with one effect value per species. Details for construction of these
aggregated data tables are given in section 4.1.
3
Substance identification, physico-chemical properties, fate
and human toxicology
3.1
Identity
The identities of uranium and uranium salts used in the toxicity tests discussed
in chapter 4 are given in the tables below.
Table 4. Identification of uranium
Parameter Name
or
number
Chemical name
uranium
CAS number
7440-61-1
EC number
231-170-6
Molecular formula
U
Molecular structure
-
Table 5. Identification of uranyl acetate dihydrate
Parameter Name
or
number
Chemical name
uranyl acetate; bis(acetato-O)dioxouranium
CAS number
541-09-3
EC number
208-767-5
Molecular formula
UO
2(CH
3OO)
2x 2H
2O
Molecular structure
U
O
O
O
O
Ac
Ac
Table 6. Identification of uranyl dinitrate hexahydrate
Parameter Name
or
number
Chemical name
bis(nitrato-O)dioxouranium
CAS number
13520-83-7
EC number
233-266-3
Molecular formula
UO
2(NO
3)
2x 6H
2O
Molecular structure
U
O
O
O
O
NO
2
O
2
N
Table 7. Identification of uranyl sulphate trihydrate
Parameter Name
or
number
Chemical name
dioxouraniumsulfate
CAS number
20910-28-5
EC number
215-240-3
Molecular formula
UO
2SO
4x 3H
2O
Molecular structure
U O
O
O
Table 8. Identification of uranyl phosphate tetrahydrate
Parameter Name
or
number
Chemical name
dioxouranium hydrogen phosphate
CAS number
18433-48-2
EC number
242-306-9
Molecular formula
HO
6PU
Molecular structure
Table 9. Identification of uranyl dichloride
Parameter Name
or
number
Chemical name
dichlorodioxouranium
CAS number
7791-26-6
EC number
232-246-1
Molecular formula
O
2Cl
2U
Molecular structure
3.2
Physico-chemical properties
Table 10. Physico-chemical properties of uranium
Parameter Unit
Value
Remark
Ref.
Molecular weight
[g/mol]
238
[18]
Water solubility
[mg/L]
log K
OW[-]
n.a.
K
d[L/kg]
see Table 16
Vapour pressure
[Pa]
131.6
at 2450°C
[19]
2.5 x 10
-81at
25°C [18]
Melting point
[°C]
1135
[18]
Boiling point
[°C]
4131
[18]
Henry’s law constant
[Pa.m
3/mol] -
n.a. = not applicable.
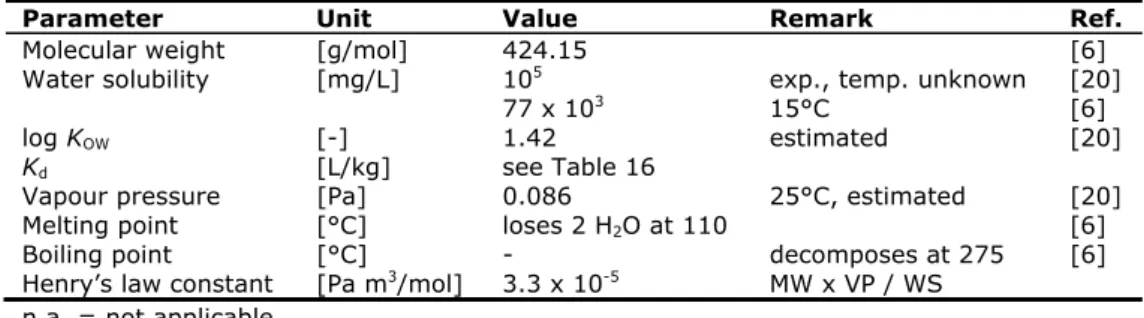
Table 11. Physico-chemical properties of uranyl acetate dihydrate
Parameter Unit
Value
Remark
Ref.
Molecular weight
[g/mol]
424.15
[6]
Water solubility
[mg/L]
10
5exp., temp. unknown
[20]
77 x 10
315°C
[6]
log K
OW[-]
1.42 estimated
[20]
K
d[L/kg]
see Table 16
Vapour pressure
[Pa]
0.086
25°C, estimated
[20]
Melting point
[°C]
loses 2 H
2O at 110
[6]
Boiling point
[°C]
-
decomposes at 275
[6]
Henry’s law constant
[Pa m
3/mol]
3.3 x 10
-5MW x VP / WS
n.a. = not applicable.
- = not available
U O
O
O
O
P
OH
O
U
O
Cl
Cl
O
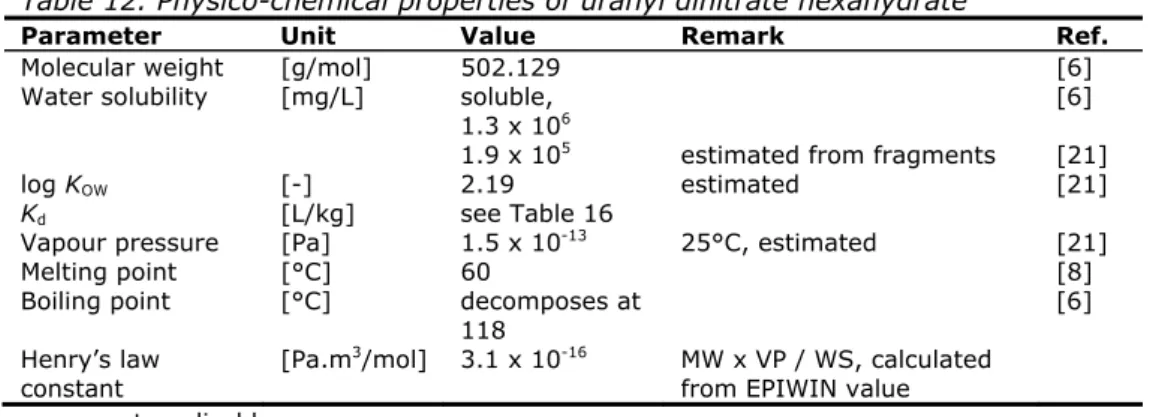
Table 12. Physico-chemical properties of uranyl dinitrate hexahydrate
Parameter Unit Value Remark
Ref.
Molecular weight
[g/mol]
502.129
[6]
Water solubility
[mg/L]
soluble,
1.3 x 10
6[6]
1.9 x 10
5estimated from fragments
[21]
log K
OW[-]
2.19 estimated
[21]
K
d[L/kg]
see Table 16
Vapour pressure
[Pa]
1.5 x 10
-1325°C,
estimated
[21]
Melting point
[°C]
60
[8]
Boiling point
[°C]
decomposes at
118
[6]
Henry’s law
constant
[Pa.m
3


![Table 22. Toxicity data for birds and mammals Duration NOEC diet [mg U/kg fd ] AF QS biota, mammalQSbiota, bird[mg U/kgfd ] Reference mammals Dog 30 days 500 3 x 10 x 10 1.7 [49]](https://thumb-eu.123doks.com/thumbv2/5doknet/3035232.7894/38.892.167.732.268.424/table-toxicity-birds-mammals-duration-mammalqsbiota-reference-mammals.webp)
