RIVM report 388802 022
Risk Assessment of Deoxynivalenol in Food
An assessment of exposure and effects in the Netherlands
M.N. Pieters, J. Freijer, A.J. Baars, W. Slob March 2001
This investigation has been performed by order and for the account of Ministry of Health, Welfare and Sport, within the framework of project 388802, Natural toxins.
Abstract
This report describes a risk assessment of deoxynivalenol (DON) in food in the Netherlands. Based on monitoring data of DON in wheat and wheat containing food products (sampling period (September 1998 – January 2000) and data on the food consumption pattern in the Netherlands we carried out a probabilistic exposure assessment. Young children showed the highest relative intake. The probabilistic effect assessment indicated that considering the 95th percentile of DON intake of one-year-olds health effects might occur. At the then occurring exposure levels of DON in children, suppressive effects on body weights (growth retardation) and relative liver weight are estimated at 2.2 and 2.7%. However, large confidence intervals around these estimates exist indicating that the magnitudes of these effects are uncertain. Whether such estimated effect levels are considered (un)acceptable, is a matter of debate and forms part of the risk management process. The probabilistic effect assessment is based on extrapolation of observations in animal experiments to humans. At present, there is no evidence (yet) that the estimated effects will occur in the human population.
Preface
In 1998 and 1999, high contamination levels of the mycotoxin DON (up to 2000 µg/kg) were detected in wheat and in wheat containing food products in the Netherlands. This urged the Ministry of Public Health, Welfare and Sports (VWS) to request for the derivation of concentration limits for DON in wheat and wheat containing food products. To that end an evaluation of toxicity data and an estimation of the wheat intake in the Dutch population was needed. Based on the literature on DON toxicity, a provisional TDI of 1.1 µg per kg body weight was derived (Pieters et al., 1999). This provisional TDI was in line with Ehling et al. (1997), and Eriksen and Alexander (1998) and has also recently been adopted in the EU Scientific Committee of Food (2000).
The most critical effect was reduction of body weight (Iverson et al., 1995). Based on this critical effect as well as on wheat consumption data, it was concluded that young children form the population at risk. A concentration limit for wheat was calculated based on the provisional TDI and a wheat intake of 8.5 g/kg body weight, the latter being the 95th percentile of the wheat intake of 1-4 yr. olds. This resulted in a concentration limit of 129 µg/kg wheat (129 ppb). Since we used the high wheat consumption of children for the calculation of the concentration limit of DON, the derived concentration limit should prevent the major part of the general population from exceeding the provisional TDI.
The derived concentration limit appeared to be low compared to the levels in wheat and wheat containing food products in 1998 and 1999. Therefore, we carried out a more detailed probabilistic exposure and effect assessment. A publication on the derivation of a provisional TDI and associated concentration limits (Pieters et al., 1999), as well as on the results of the probabilistic exposure and effect assessment is presented in Appendix 1. The ‘extended summary’ in this report summarizes the main results and conclusions of the probabilistic exposure and effect assessment.
Contents
Samenvatting 5
Summary 6
Risk Assessment of Deoxynivalenol in Food in the Netherlands. An extended summary 7
References 12
Risk assessment of Deoxynivalenol in Food. Concentration Limits, Exposure and Effects 13
1. Introduction 14
2. Methodology 15
2.1 Derivation of Concentration Limits 15
2.2 Analysis of DON in Food Products 15
2.3 Probabilistic Exposure Assessment: Dietary Intake of DON 15
2.4 Probabilistic Effect Assessment 16
3. Results 17
3.1 Derication of a provisional TDI 17
3.2 Concentration Limits 18
3.3 Probabilistic Exposure Assessment: Dietary Intake of DON 19
3.4 Probabilistic Effect Assessment 23
4. Discussion 25
5. Conclusions 28
References 29
Samenvatting
In 1999 zijn toxiciteitsgegevens van het mycotoxine deoxynivalenol (DON) geëvalueerd. Hierbij werd een voorlopige TDI van 1.1 µg per kg lichaamsgewicht afgeleid. Op basis van deze voorlopige TDI en uitgaande van het 95e percentiel van de tarweconsumptie van 1-4 jarigen werden concentratielimieten voor DON in tarwe en tarwebevattende
voedingsmiddelen afgeleid (Pieters et al., 1999). Aangezien de concentratielimieten laag waren in vergelijking met de toenmalige concentraties DON in tarwe en voedingsmiddelen, is een gedetailleerde blootstellings- en effectschatting uitgevoerd. De probabilistische
blootstellingsschatting werd uitgevoerd aan de hand van de monitoringsgegevens van DON in tarwe en tarwebevattende voedingsmiddelen (monsternameperiode september 1998 – januari 2000) en de gegevens over het consumptiepatroon in Nederland. De inname van DON in Nederland (sept 1998 – jan 2000) overschreed de voorlopige TDI van van 1.1 µg per kg lichaamsgewicht, met name in kinderen. Tachtig procent van de éénjarigen had een DON-inname boven de TDI en 20% van de éénjarigen vertoonde een tweevoudige overschrijding van de TDI. De gemiddelde concentratie van DON in tarwe bedroeg 446 µg/kg (n = 219). Brood vormt de belangrijkste bron van DON. Bij éénjarigen vormt ook pap een belangrijke bron van DON inname. Andere graansoorten dan tarwe dragen verwaarloosbaar bij aan de DON-inname, aangezien de consumptie van deze graansoorten in Nederland relatief laag is. De probabilistische effectschatting werd uitgevoerd door toxiciteitsgegevens van relevante dierstudies te analyseren met behulp van dosis-respons modellering (de
‘benchmark’benadering). In de benchmarkbenadering worden verschillende dosis-respons modellen op de data gefit en het best fittende model geselecteerd. Door ‘assessment factoren’ toe te passen kunnen mogelijke gezondheidseffecten in de gevoelige mens worden geschat. De resultaten geven aan dat, uitgaande van de 95e percentiel DON inname van éénjarigen, te weten circa 3 µg/kg, gezondheidseffecten mogelijk zijn. Bij dit innameniveau worden suppressieve effecten op het lichaamsgewicht (groeivertraging) en het relatieve levergewicht geschat op respectievelijk 2.2 en 2.7%. De grote betrouwbaarheidsintervallen rond deze schattingen geven echter aan dat de grootte van deze effecten onzeker zijn. Of de geschatte effectniveaus (on)acceptabel zijn is voor discussie vatbaar en maakt onderdeel uit van het risico ‘management’ proces. De probabilistische effectschatting is gebaseerd op extrapolatie van observaties in proefdieronderzoek. Momenteel bestaat er (nog) geen evidentie dat dergelijke effecten zullen optreden in de humane populatie.
Summary
In 1999 toxicity data on the mycotoxin deoxynivalenol (DON) were evaluated and a provisional TDI of 1.1 µg per kg body weight was derived. Considering this provisional TDI and the 95th percentile of the wheat intake of 1-4 yr. olds, concentration limits of DON for wheat and wheat containing food products were derived (Pieters et al., 1999). Since the concentration limits were low compared to the then occurring concentrations of DON in wheat and food products, we carried out a detailed probabilistic exposure and effect assessment. Based on monitoring data of DON in wheat and wheat containing food products (sampling period September 1998 – January 2000) and data on the food consumption pattern in the Netherlands a probabilistic exposure assessment was carried out. The dietary intake of DON in the Netherlands exceeded the provisional TDI of 1.1 µg/kg bw, especially in children. Eighty percent of the one-year-olds had a DON intake above the provisional TDI and 20% of these childrened twice the provisional TDI. The monitoring data showed that the average DON concentration in wheat in that period was 446 µg/kg (n = 219). The major source of DON intake in the Netherlands is bread. For one-year-olds porridges also contribute significantly. The DON intake through other grains is negligible in the Netherlands since the consumption of these grains is low.
We carried out a probabilistic effect assessment by analyzing toxicity data from relevant animal studies by dose response modeling (the benchmark approach). In the benchmark approach several dose response models are fitted to the data and the best fitting model is selected. By applying assessment factors possible health effects in the sensitive human can be estimated. The results indicated that considering the 95th percentile of DON-intake of one-year-olds, i.e. approximately 3 µg/kg bw, health effects might occur. At this intake levels suppressive effects on body weights (growth retardation) and relative liver weight are estimated at 2.2 and 2.7%, respectively. However, large confidence intervals around these estimates exist indicating that the magnitudes of these effects are uncertain. Whether such estimated effect levels are considered (un)acceptable, is a matter of debate and forms part of the risk management process. The probabilistic effect assessment is based on extrapolation of observations in animal experiments to humans. At present, there is no evidence (yet) that the estimated effects will occur in the human population.
Risk Assessment of Deoxynivalenol in Food in the
Netherlands. An extended summary
To estimate whether a chemical poses a risk to humans depends on the level and route of exposure to this chemical and on the inherent capacity of the chemical to cause adverse health effects. A risk assessment thus includes estimation of exposure (exposure assessment) and potential effects (effect assessment). We here describe the risk assessment of
deoxynivalenol (DON) in food.
Human dietary intake of chemicals is usually estimated by combining data on concentrations of chemicals in different food products and the consumption rate of these products. The consumption pattern of the Dutch population was studied in the National Food Consumption Survey (VCP). The survey includes a description of the daily consumption over two consecutive days and a record of age, sex and body weight of 6250 individuals (Kistemaker et al., 1998). The Dutch Inspectorate for Health Protection monitored DON concentrations in wheat and various food products from 1998 onwards. In June 2000 data of 584 DON analyses in 14 different food categories were available (sampling period September 1998 until January 2000). The average concentration DON in wheat was 446 µg/kg (n = 219). Since only a limited number of all food products were monitored, we did not have concentration data on all consumed food products as described in detail in the VCP. We therefore classified the food products into different food categories and calculated for each food category an average concentration of DON/kg wheat. By multiplying the (estimated) wheat content of a consumed food with the average DON concentration of the food category, DON concentrations of the various food products were calculated. We thus assumed that the measured DON concentrations of food products in a particular food category (expressed per kg wheat) were representative for the DON concentrations of all food products belonging to this category. In this way, for each food category, we (implicitly) corrected for possible DON loss due to food processing.
By combining the measured or estimated DON concentrations of food products with the food consumption data of the VCP, the daily intakes of DON of all individuals included in the survey were calculated. Since we are interested in the long-term exposure we needed to estimate the mean dietary DON intake as a function of age by correcting for daily
fluctuations in consumption (Slob, 1993; Slob, 1996). Figure 1 shows that especially young children are exposed to levels exceeding the provisional TDI. Eighty percent of the one-year-old children are exposed to levels exceeding the provisional TDI and 20% of this age group is exposed to DON levels exceeding twice the provisional TDI. At the age of 4, these
percentages are 50 and 5, respectively.
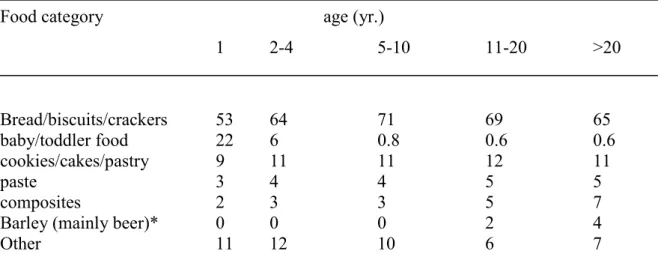
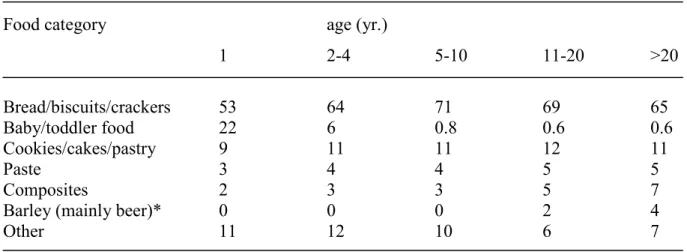
Table 1. shows the relative contribution of different food categories to the total DON intake. Bread forms the main source for DON exposure. For one-year-olds wheat containing porridges also contribute markedly since these children consume less bread. The DON intake through grains other than wheat (oat, maize, and rye) is negligible since the consumption of these grains is rather low in the Netherlands. Barley in the form of beer may form the only exception. When we assume a DON concentration in beer at the detection limit of
HPLC-analysis (100 µg/kg), the consumption of beer contributes to approximately 4% of the total DON intake in adults (>20 yr.). To gain insight in the real concentrations of DON in beer more sensitive, analytical measurements of DON will be carried out in the near future. First preliminary results of these analyses indicate that DON is not detectable in beer (detection limit: 25 µg/kg). Since for the Dutch population wheat (as bread) is a basic food product, the only way to reduce the DON intake in the Netherlands is to reduce the concentrations of DON in wheat. 0 20 40 60 80 100 0 10 20 30 40 Age (yr) P er cen ta g e o f ag e cl ass excee d in g T D I o r 2x T D I
Fig. 1. Percentage of age class exceeding the provisional TDI (circles) or twice the
provisional TDI (squares)
Table 1. Relative contribution of food categories to the total DON intake
Food category age (yr.)
1 2-4 5-10 11-20 >20 Bread/biscuits/crackers 53 64 71 69 65 baby/toddler food 22 6 0.8 0.6 0.6 cookies/cakes/pastry 9 11 11 12 11 paste 3 4 4 5 5 composites 2 3 3 5 7
Barley (mainly beer)* 0 0 0 2 4
Other 11 12 10 6 7
*) assumed concentration: 100 µg/kg (detection limit)
The aim of human limit values such as a provisional TDI is to protect the general population from health effects during life-long exposure. Human limit values are generally based on a No-observed-adverse-effect level (NOAEL) which is the highest dose level that does not provoke adverse effects. By applying assessment factors (uncertainty factors) for e.g. the
extrapolation of experimental animals to humans and to correct for interindividual human variation a human limit value is derived. If necessary other assessment factors may be applied. International consensus exists on this approach (EHC, 1994) as well as on the value of the assessment factors to be applied. However, if the data justify the adjustment of the value of assessment factors, this can be decided on a case-by-case basis. For the derivation of the provisional TDI of DON, an assessment factor of 100 has been applied (Pieters et al., 1999, EU-SCF, 1999).
Although the approach described above is suitable for the derivation of (safe) human limit values, it is not suitable for the assessment of possible health effects upon exposure. Exposure exceeding a provisional TDI may cause health effects, however, it is not possible to indicate which health effects will be likely to occur and to what extent.
To estimate possible health effects of the exposure to DON we therefore carried out a probabilistic effect assessment. To that end we analyzed toxicity data from relevant animal studies by dose response modeling (the benchmark approach). In the benchmark approach (Slob, 1999) several dose response models are fitted to the data and the best fitting model is selected. The selected model can be used for setting human limit values as well as for an actual risk assessment (Slob and Pieters, 1998). The human limit values estimated with this approach were 0.6 and 0.5 µg/kg bw for body weight reduction and decreased liver weight, respectively. These values were derived assuming critical effect sizes of 5%. However, at present, no international consensus exists yet on which magnitude of critical effect size is considered acceptable.
To estimate the effects occurring in humans at an actual exposure level, the estimated DON intake is used as input for the model. This results in an estimate of the effect size in the experimental animal under study. By computer simulation the data set of the animal
experiment can be sampled (Monte Carlo sampling, n = 1000) and new data sets generated. Fitting the dose response model to the simulated data sets will finally result in a distribution of the effect size and a confidence interval can be calculated. This distribution of effect size can be extrapolated to humans by combining with distributions of appropriate assessment factors in a probabilistic manner (Slob and Pieters, 1998; Vermeire, et al., 1999).
Toxicity data from several animal studies were judged by their suitability for dose response analysis. The data of the chronic mice study of Iverson et al. (1995) which had been used for the derivation of the provisional TDI (Pieters et al., 1999; EU-SCF, 2000) showed a clear dose response relationship and were reported adequately. Based on the dose response relationship in mice, we estimated the health effects in the ‘sensitive’ human population at current exposure levels of DON. For the latter, we considered the 95th percentile of the DON intake of a one-year-old (2.90 and 3.24 µg/kg bw for boys and girls, respectively). The 95th
percentile represents a relatively high (realistic worst case) DON intake. The results are presented in Table 2.
Table 2. Summary of the probabilistic effect assessment.
Effect parameter1 DON intake,
µg/kg bw
Effect Size (%) (90% confidence
interval) body weight reduction 3.2 (girl, 1 yr., 95th percentile) 2.2 (0.2 - 24.6) decreased relative liver weight 2.9 (boy, 1 yr., 95th percentile) 2.7 (0.2 - 26.8)
1 data from Iverson et al. (1995). Reduction of body weight was observed in males and
females, reduction of relative liver weight in males only.
Considering the 95th percentile of DON intake of one-year-olds, we show that at this intake level effects on body weight and liver weight are likely to occur. However, the magnitude of these effects is highly uncertain: the confidence interval ranges from less than 1% to approximately 25%. The best estimates of these effects are 2.2% and 2.7%, respectively. The large confidence intervals are caused by the rather broad distribution of the assessment factor used for the extrapolation of mice to humans. Data that would justify a narrowing down of this distribution are currently not available. If the traditional factor of 100 were used to extrapolate from mice to humans, the estimate of the effect size would have been 7.0% for body weight reduction and 8.4% for decrease of relative liver weight.
Whether an effect size of approximately 2.5% for reduction of body weight and increased relative liver weight may be (un)acceptable, is a matter of debate and forms part of the risk management process. It should be realized that, similar to the derivation of the provisional TDI, the estimation of the health effects mentioned above are based on extrapolation of animal data. At present, there is no evidence (yet) that these effects will occur in the human population. On the other hand, it should be noted that this effect assessment has been carried out for only one compound (DON). The effects of exposure to other compounds have thus not been taken into account.
CONCLUSIONS
• The dietary intake of DON in the Netherlands (September 1998 – January 2000) exceeded the provisional TDI of 1.1 µg/kg bw, especially in children. Eighty percent of the one-year-olds had a DON intake above the provisional TDI and 20% of these children exceeded twice the provisional TDI.
• Monitoring data show that the average DON concentration in wheat was 446 µg/kg (n = 219, sampling period September 1998-January 2000). The major source of DON intake is bread. For one-year-olds porridges also contribute significantly. The DON-intake through other grains is negligible in the Netherlands since the consumption of these grains is low. • At these exposure levels of DON health effects might occur in children. Considering the
95th percentile of DON intake of one-year-olds, the suppressive effects on body weights (growth retardation) and relative liver weight are estimated at 2.2 and 2.7%. However, the large confidence intervals around these estimates indicate that the magnitudes of these effects are uncertain. Whether the estimated effect levels are considered (un)acceptable, is a matter of debate and forms part of the risk management process. The probabilistic effect assessment is based on extrapolation of observations in animal experiments to humans. At present, there is no evidence (yet) that the estimated effects will occur in the human population.
Remark
A (temporarily) concentration limit of 500 µg DON/kg for cereal products as consumed and for retail products has been advised by DG SANCO (2000). For flour (raw material) a concentration limit of 750 µg DON/kg has been advised. The average DON concentrations of the period September 1998 – January 2000 in wheat and wheat containing food products were below these advised concentration limits. The performed exposure and effect assessment may therefore also be indicative for possible current and future exposures.
References
DG-SANCO, 2000, Commission Recommendation on the reduction of the presence of deoxynivalenol in cereals and cereal products. SANCO/1925/00-rev1.
EHC, 1994, Assessing human health risks of chemicals: Derivation of guidance values for health-based exposure limits. In Environmental Health Criteria, 170. IPCS, WHO, Geneva, Switzerland.
EU-SCF, 2000, Scientific Committee on Food. Opinion on fusarium toxins. Part 1: Deoxynivalenol (DON). SCF/CS/CNTM/MYC/19 Final 09/12/99. Annex VI to the meeting of the 119th Plenary meeting.
Iverson, F., Armstrong, C., Nea, E., Truelove, J., Fernie, S., Scott, P.M., Stapley, R.,
Hayward, S., and Gunner, S., 1995, Chronic feeding study of deoxynivalenol in B6C3F1 male and female mice, Teratogenesis Carcinogenesis Mutagenesis 15: 283-306.
Kistemaker, C., Bouman, M. and Hulshof, K.F.A.M. (1998), Consumption of separate products by Dutch population groups - Dutch National Food Consumption Survey 1997 – 1998 (in Dutch). Zeist, TNO-Nutrition and Food Research Institute, TNO-report V98.812.
Pieters, M.N., Fiolet, D.C.M. and Baars, A.J., 1999, Deoxynivalenol. Derivation of
concentration limits in wheat and wheat containing food products, National Institute of Public Health and the Environment, RIVM report 388802 018. Bilthoven, the
Netherlands.
Slob, W., 1993, Modeling long-term exposure of the whole population to chemicals in food. Risk Analysis 13: 525-530
Slob, W. and Pieters, M.N., 1998, A probabilistic approach for deriving acceptable human intake limits and human health risks from toxicological studies: general framework. Risk Analysis 18: 787-798.
Slob, W., 1999, Deriving safe exposure levels for chemicals from animal studies using statistical methods: recent developments. In: Statistics for the Environment 4: Pollution Assessment and Control, V. Barnett, A. Stein and K.F. Turkman (eds), John Wiley and Sons, Ltd, p 153 -175, Chichester.
Vermeire, T., Stevenson, H., Pieters, M.N., Rennen, M., Slob, W. and Hakkert, B.C., 1999, Assessment factors for human health risk assessment: a discussion paper. Critical reviews in Toxicology :29, 439-490
Risk assessment of Deoxynivalenol in Food
Concentration Limits, Exposure and Effects.
Moniek N. Pieters1, Jan Freijer1, Bert-Jan Baars1, Daniëlle C.M. Fiolet1, Jacob van Klaveren2 and Wout Slob1
1Center for Substances and Risk Assessment, National Institute of Public Health and the
Environment, RIVM, P.O. Box 1, 3720 BA Bilthoven, The Netherlands
2 State Institute for Quality Control of Agricultural Products (RIKILT), P.O. Box 230, 6700
AE Wageningen, the Netherlands
To be published in:
1. INTRODUCTION
The mycotoxin deoxynivalenol (DON) produced by fungi of the Fusarium genus may occur in various cereal crops (wheat, maize, barley, oat, and rye). Chemically it belongs to the trichothecenes: tetracyclic sesquiterpenes with a 12,13-epoxygroup (Eriksen and Alexander, 1998). DON is a very stable compound, during both storage/milling and the processing/cooking of food, and does not degrade at high temperatures (Rotter et al., 1996, Ehling et al., 1997).
In humans food poisoning with DON led to abdominal pain or a feeling of fullness in the abdomen, dizziness, headache, throat irritation, nausea, vomiting, diarrhea, and blood in the stool (Rotter et al., 1996; Eriksen and Alexander, 1998).
In 1998 and 1999, high contamination levels of DON were detected in wheat and in wheat containing food products in the Netherlands. This urged the Ministry of Public Health, Welfare and Sports (VWS) to request for the derivation of concentration limits for DON in wheat and wheat containing food products. To that end an evaluation of toxicity data and an estimation of the wheat intake in the Dutch population was needed. The first part of this paper deals with the derivation of a provisional TDI and concentration limit of DON in wheat using the standard approach. Since the derived concentration limit appeared to be low compared to the DON levels in food at the time, the second part of the paper discusses a more detailed exposure and effect assessment. Possible human health risks of exposure to DON at levels encountered in the period 1998-2000 are estimated based on a probabilistic risk assessment approach.
2. METHODOLOGY
2.1 Derivation of Concentration Limits
To derive concentration limits for DON in food products, we evaluated the toxicological literature on DON. Taking into account the quality of the studies evaluated and the relevance of the toxicological endpoints, we selected a NOAEL and applied uncertainty factors for interspecies and intraspecies variation to derive a provisional TDI (EHC, 1994).
Subsequently, the wheat intake of the Dutch population was estimated. Food consumption data were obtained from the Dutch National Food Consumption Survey (VCP). The survey includes a description of the daily consumption over two consecutive days and a recording of sex, age and body weight of 6250 individuals belonging to 2564 households. Data were collected from April 1997 until April 1998 and were evenly spread over the weeks of the year and the days of the week (Kistemaker et al., 1998). With the Conversion model Primary Agricultural Products (CPAP, Van Dooren et al., 1995) food consumption data were converted into the amount of primary agricultural product, in this case wheat, consumed.
By dividing the provisional TDI (µg DON/kg bw) by the estimated wheat consumption (g wheat/kg bw), the concentration limit of DON in wheat was calculated. It was implicitly assumed that the contribution of other grains (including beer) to the total DON intake was negligible.
2.2 Analysis of DON in Food Products
The Dutch Inspectorate for Health Protection monitored DON in various food products from September 1998 onwards. Up to January 2000 data comprised 584 DON analyses in 14 different food categories. The majority of the samples (n = 219) concerned wheat. Sampling was carried out more or less at random in wheat containing food products, resulting in a representative picture of the DON concentrations in Dutch consumer products. DON was analyzed by mixing and blending fifty gram of ground sample with 200 ml water and 10 g polyethyleenglycol. After filtration 15 ml of the solution was cleaned through an
immunoaffinity column. After evaporation and dissolution 50 µl was injected in a HPLC system consisting of a C18-column and acetronitrile-water eluent. DON was detected at 218 nm (Cahill et al., 1999).
2.3 Probabilistic Exposure Assessment: Dietary Intake of DON
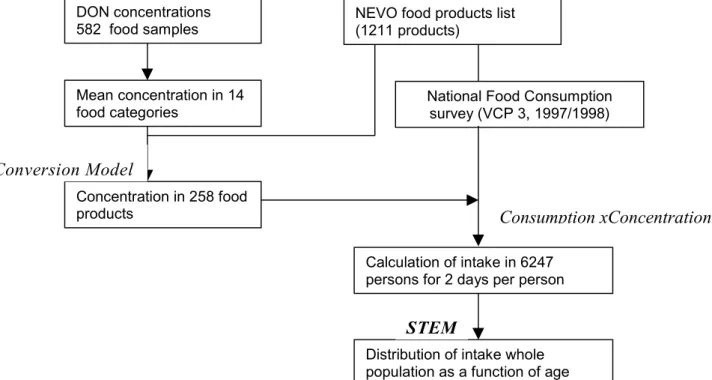
Human dietary intake of chemicals is usually estimated by combining data on concentrations of chemicals in different food products and the consumption rate of these products. Figure 1 displays the principal flow scheme, which has been employed to analyze human dietary intake of chemicals in the Netherlands (Liem and Theelen, 1997). The flow scheme shows the dependency of different submodels and databases.
Since only a limited number of all food products were monitored, we did not have concentration data on all consumed food products as described in detail in the VCP. We therefore calculated for each monitored food product the concentration of DON per kg wheat content, classified the food products into different food categories and calculated for each food category (for example bread/biscuits/crackers) an average concentration of DON/kg wheat. By multiplying the (estimated) wheat content of a consumed food with the average DON concentration of the food category, DON concentrations of the various food products were calculated. In this way, for each food category, we corrected for possible DON loss due to food processing. For those food categories for which data on DON concentrations were
scarce (e.g., composites), we estimated the DON intake via these food products by multiplying the (estimated) wheat content of a consumed food with the average DON concentration in wheat (n = 219, 446 µg/kg).
Data on wheat content were derived from the Conversion model Primary Agricultural Products (CPAP, Van Dooren et al., 1995), or were based on cooking recipes or on the wheat content of similar food products in the same food category.
In the Netherlands consumer food is coded and described (nutrients, energy content etc.) in the Dutch Nutrient Database (NEVO). The measured or estimated DON concentrations of NEVO food products were combined with the individual food consumption data recorded on two consecutive days, resulting in two daily intakes of all individuals included in the survey. To distinguish the variation between individuals from the daily fluctuations in consumption, we use the statistical exposure model STEM (Slob, 1993; Slob, 1996) which estimates the mean dietary intake as a function of age. It combines regression analysis on age by fitting an appropriate curve to the data with a nested analysis of variance.
2.4 Probabilistic Effect Assessment
Toxicity data from animal studies were analyzed by dose response modeling (the benchmark approach). In the benchmark approach (Slob, 1999) a dose response model is fitted to the data. The best fitting model was selected by applying likelihood ratio tests to the members of a nested family of models. Subsequently, the selected model can be used for setting human limit values as well as for an actual risk assessment (Slob and Pieters, 1998). For the setting of human limit values, a critical effect size (CES) is selected for each effect parameter and the associated critical effect dose (CED) is derived. With a bootstrapping technique (Monte Carlo sampling, n = 1000) a distribution of the CED is generated. Extrapolation to humans is carried out by combining the distribution of the CED with distributions of appropriate assessment factors in a probabilistic manner (Slob and Pieters, 1998; Vermeire, et al., 1999). To estimate the effects occurring in humans at an actual exposure level, the estimated DON intake is used as input for the model. This results in an estimate of the effect size in the experimental animal under study which is subsequently extrapolated to humans.
Figure 1. Overview of databases and submodels used in analyzing human exposure to DON.
DON concentrations 582 food samples Mean concentration in 14 food categories Concentration in 258 food products Conversion Model
National Food Consumption survey (VCP 3, 1997/1998)
Consumption xConcentration
Calculation of intake in 6247 persons for 2 days per person
Distribution of intake whole population as a function of age
STEM
NEVO food products list (1211 products)
3. RESULTS
3.1 Derivation of a provisional TDI
To derive a provisional TDI we evaluated relevant toxicity studies. At low concentrations in the diet DON reduces growth and feed consumption (anorexia) in experimental animals. At higher acute doses it induces vomiting (emesis). Both effects, which are also seen with other trichothecene toxins, are thought to be mediated by affecting the serotoninergic activity in the CNS. DON inhibits protein synthesis at the ribosomal level, and it has been demonstrated to inhibit DNA and RNA synthesis. DON affects the immune system and alters various blood parameters. In addition, it is a potent gastrointestinal irritant (Rotter et al., 1996; Eriksen and Alexander, 1998). There are no indications for carcinogenic and/or mutagenic properties. The provisional TDI can therefore be based on the no observed adverse effect levels (NOAELs) from toxicity studies by applying uncertainty factors. The NOAELs and LOAELs of various toxicity studies vary between 0.04 - 0.75 mg/kg bw/day and are summarized in Table 1.
Table 1. Summary of toxicity studies with DON.
Species Study Effect Parameter Dose *) Reference Mouse Acute Mortality LD50 oral 46-78 Eriksen and
Alexander, 1998
Hen Acute Mortality LD50 oral 140 IARC, 1993
Swine Acute Vomiting - 0.05-0.2 Eriksen and
Alexander, 1998 Swine Subacute Reduced food uptake - 0.03-0.07
(1-2 mg/kg feed)
Eriksen and Alexander, 1998 Mouse Subacute Reduced food uptake - 0.6-1.2
(4-8 mg/kg feed) Rotter et al., 1996 Rat Subacute Reduced food uptake - 0.75-1.0
(15-20 mg/kg feed)
Rotter et al., 1996
Mouse 5 weeks Decreased α1/α2 globulin ratio
NOAEL 0.25 Eriksen and Alexander, 1998 Rat 9 weeks reduced growth,
reduced food uptake LOAEL 0.25 Arnold et al., 1986 Rat 90 days reduced growth LOAEL 1.0 Morrissey et al., 1985 Mouse 2 years reduced growth,
reduced relative liver weights
NOAEL 0.11 Iverson et al., 1995
Mouse Immunotoxicity increased susceptibility for infections
NOAEL 0.25 Tryphonas et al., 1986
Mouse Immunotoxicity increased susceptibility for infections
LOAEL 0.22 Deijns et al., 1994
Mouse Teratogenicity fetal skeleton
abnormalities NOAEL 0.5 Khera et al., 1982 Mouse
Reproduction-toxicity mortality of pups NOAEL 0.375 Khera et al., 1984 Rat
Reproduction-toxicity maternal and/orembryotoxicity NOAEL 1.0 Khera et al., 1984 Rat
Reproduction-toxicity
reduced fertility LOAEL ≤ 2.0 Morrissey and Vesonder, 1985 Rabbit Teratogenicity reduced fetal weight NOAEL 0.6 Khera et al., 1986 Swine
Swine 28 days reduced food uptake, decreased thyroid weight and α-glob., increased T4, serum-albumin and A/G ratio
LOAEL 0.03
(0.75 mg/kg feed) Rotter et al., 1994
Swine 42 days reduced growth, reduced food uptake, stomach corrugation
LOAEL ≤ 0.15
(4 mg/kg feed)
Rotter et al., 1995
Swine 90 days reduced growth,
reduced food uptake NOAEL 0.04(1 mg/kg feed) Bergsjø et al., 1992 Swine 95 days reduced growth,
reduced food uptake, increased liver weight, decreased serum albumin
NOAEL 0.06
(1.7 mg/kg feed)
Bergsjø et al., 1993
*) All dosages in mg/kg bw/day, unless indicated otherwise.
Taking into account the quality of the studies evaluated and the relevance of the toxicological endpoints, only the NOAELs mentioned in Table 2 are considered for the derivation of a provisional TDI.
Table 2. NOAELs considered for the derivation of a provisional TDI.
Study NOAEL Reference
(mg/kg bw/day)
Mouse, chronic (2 years) 0.11 Iverson et al., 1995
Mouse, immunotoxicity 0.25 Tryphonas et al., 1986
Mouse, teratogenicity 0.5 Khera et al., 1982
Mouse, reproduction toxicity 0.375 Khera et al., 1984
Swine, subchronic (90-95 days) 0.04-0.06 Bergsjø et al., 1992, 1993 Extrapolation from experimental animals to humans implies the application of an uncertainty factor (UF). Commonly an UF of 10 is used for extrapolating from rodents to humans, and an additional UF of 10 to cover for (human) interindividual differences. In the case of the swine as the experimental species these UFs are 2 and 10, respectively. For the data above this would result in tolerable daily intakes which are all in the same order of magnitude (i.e., 1.1-5.0 µg/kg bw/day).
The chronic diet study with mice (Iverson et al., 1995) is of good quality and yields the lowest NOAEL. Swine might resemble humans more with regard to its physiology. However, since in these studies the DON preparation was contaminated with other mycotoxins we decided to use the NOAEL of the chronic diet study with mice (0.11 mg/kg bw/day) for the estimation of a provisional TDI. Applying an uncertainty factor of 100, a provisional TDI of 1.1 µg/kg bw/day is estimated (Pieters et al., 1999), in line with Ehling et al. (1997), and Eriksen and Alexander (1998). Recently, the EU adopted a temporary TDI of 1 µg/kg
bw/day, based on the study of Iverson et al., 1995 (European Commission, SCF dd 09/12/99).
3.2 Concentration Limits
We considered children (1-4 yr.) to be the group at risk since they not only have the highest relative wheat consumption, but are also considered to be vulnerable to the critical effect growth reduction. We based the safe concentration limit of (cleaned) wheat on a child with a
high wheat consumption, i.e. 8.5 g/kg bw, which is the 95th percentile. Based on a provisional TDI of 1.1 µg DON per kg body weight the concentration limit of DON in wheat was calculated according to:
Concentration limit of DON in (cleaned) wheat =
TDI (µg/kg bw) / wheat intake (g/kg bw) = 1.1 / 8.5 = 0.129 µg /g wheat = 129 µg /kg (129 ppb)
Depending on the wheat content of food products, concentration limits for DON can be derived for each food product (Pieters et al., 1999). Since we used the high wheat consumption of children for the calculation of the concentration limit of DON, the derived concentration limit of 129 µg /kg wheat should prevent the major part of the general population from exceeding the provisional TDI.
The derived concentration limit appeared to be low compared to actual levels in wheat and wheat containing food products. Therefore, we carried out a more detailed exposure and effect assessment. Possible human health risks at current exposures are estimated using a probabilistic risk assessment approach.
3.3 Probabilistic Exposure Assessment: Dietary Intake of DON
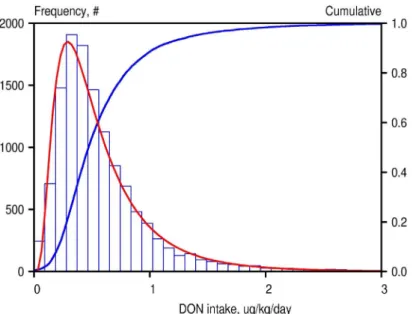
By combining the measured or estimated DON concentrations in NEVO products with the food consumption data, the personal intakes for all individuals included in the survey for two consecutive days were calculated. Figure 2 shows the frequency distribution of intake rates consisting of 12494 values of daily average intakes of DON, 2 consecutive days for 6247 individuals recorded in the Food Consumption Survey database.
Fig 2. Frequency distribution of two daily intakes in 6247 individuals of DON in the Netherlands.
This frequency distribution gives insight in the total variation in daily intakes. This variation has two components: a within-subject and between-subject variation. The high tailing value
of the distribution (around 7 µg/kg bw/day) should therefore be carefully interpreted, as it represents a one-day event of an individual. Therefore, this distribution is unsuitable for a comparison with the TDI, because the latter is intended for long-term exposure. A distribution of individual long-term exposures would be considerably narrower than the distribution of daily averaged intakes because the latter incorporates within-subject fluctuations.
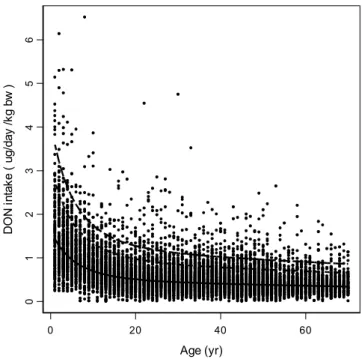
The long-term exposure distribution, representing interindividual differences, was estimated by using the Statistical Exposure Model STEM (Slob, 1993; Slob, 1996). Analyzing the data displayed in Figure 2 by STEM yields the results as presented in Figure 3, showing that the relative intake decreases with age. The percentiles depicted in the figure represent the variation between individuals after correcting for the within-subject variation between days. 0 20 40 60 Age (yr) 01 234 5 6 D O N in ta ke ( ug/ day /k g bw )
Fig. 3. Daily intake of DON as a function of age. Each dot denotes one daily intake of a single individual (6247 individuals, two daily intakes each). The bold curve represents the estimated geometric mean intake estimated by fitting a regression function. Dashed curves
denote the 95th and 99th percentiles, indicating the long-term variation between individuals.
For each age-class the intake distribution can be deduced from the median intake and the estimated between-subject geometric variance. Figure 4 shows a cross-section for ages 2 and 40. Figure 5 shows the percentage of the population associated with a (long-term average) daily DON intake exceeding 1 µg/kg bw/day or 2 µg/kg bw/day for several age classes. It clearly shows that young children are exposed to levels exceeding the provisional TDI. Eighty percent of the 1-year-old children are exposed to levels exceeding the provisional TDI and 20% of this age group is exposed to DON levels exceeding twice the provisional TDI. At the age of 4, these percentages are 50 and 5, respectively.
0 0.1 0.2 0.3 0.4 0.5 0.6 0.7 0.8 0.9 1 0.0 1.0 2.0 3.0 4.0 5.0
DON intake µg/kg bw/day
Pr obabi lit y densi ty 0 0.5 1 1.5 2 2.5 3 0.0 1.0 2.0 3.0 4.0 5.0
DON intake (µg/kg bw/day)
Pro babi lit y d en si ty
Fig. 4. Distribution of DON intake at age 2 (left panel) and age 40 (right panel)
0 20 40 60 80 100 0 10 20 30 40 Age (yr) P e rc ent age of ag e c las s ex ceed in g T D I or 2x TDI
Fig. 5. Percentage of age class with a DON intake exceeding the provisional TDI (circles) or twice the provisional TDI (squares)
Table 3. shows the relative contribution of different food categories to the total DON intake. Bread/biscuits/crackers are the main source for DON exposure. Porridge made of wheat and other grains is categorized in baby/toddler food and forms only a relevant source of DON for the very young. The DON intake through grains other than wheat (oat, maize, and rye) is negligible since the consumption of these grains is rather low in the Netherlands. Barley in the form of beer forms the only exception. When we assume a DON concentration in beer at the detection limit (100 µg/kg), the consumption of beer contributes to approximately 4% of the total DON intake in adults (>20 yr.).
Table 3. Relative contribution of food categories to the total DON intake
Food category age (yr.)
1 2-4 5-10 11-20 >20 Bread/biscuits/crackers 53 64 71 69 65 Baby/toddler food 22 6 0.8 0.6 0.6 Cookies/cakes/pastry 9 11 11 12 11 Paste 3 4 4 5 5 Composites 2 3 3 5 7
Barley (mainly beer)* 0 0 0 2 4
Other 11 12 10 6 7
3.4 Probabilistic Effect Assessment
The effects described in the studies mentioned in Table 2 were judged on their suitability for dose response modeling. The data allowed the dose response analysis of the following effect parameters: reduced body weight and reduced liver weight (males only) as reported in the chronic mice study of Iverson et al. (1995) and the frequency of resorptions, frequency of anomalies and frequency of affected sternebrae as reported in the reproduction study of Khera et al. (1982). Other effect parameters were not suitable for analysis due to the lack of a clear dose response relationship or to an inadequate report of the data.
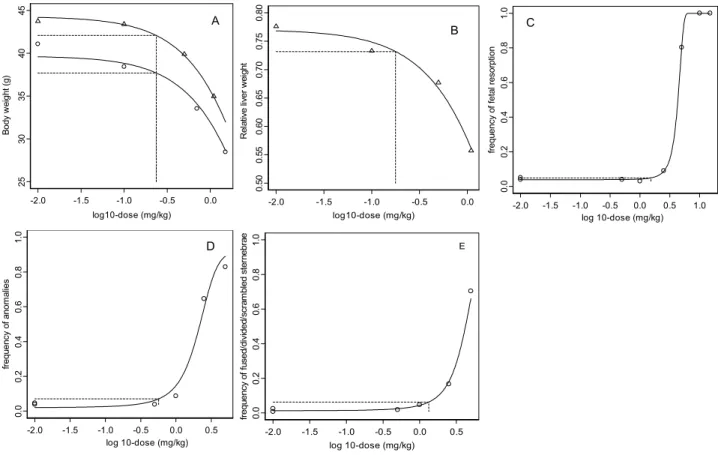
Males and females show a similar response to DON on body weight reduction (Figure 6A). The background response (parameter a) differs between the two sexes since females have a lower body weight than males. The relative liver weights were decreased in males only and are shown in Figure 6B. Figure 6C-6E shows the observations and fitted models on embryotoxicity. A 5% body weight reduction was chosen as the critical effect size, and similarly a 5% decrease in relative liver weight. For resorptions a 1% additional risk was taken as the benchmark response, while a 5% additional risk level was chosen for the frequency of anomalies and frequency of affected sternebrae.
Fig. 6. Dose-response data and fitted models for body weight (A), triangles: males, circles: females; relative liver weight (B), triangles: males; frequency of resorptions (C); frequency of anomalies (D); frequencies of fused, divided or scrambled sternebrae (E). Horizontal dashed lines indicate critical effect sizes, i.e., 5% (A, B, D, E) and 1% (C). Vertical dashed lines indicate associated doses.
-2.0 -1.5 -1.0 -0.5 0.0 log10-dose (mg/kg) 25 30 35 40 45 B ody w ei ght ( g) A -2.0 -1.5 -1.0 -0.5 0.0 log10-dose (mg/kg) 0. 50 0. 55 0. 60 0. 65 0. 70 0. 75 0. 80 Re la tiv e l iv er we ig ht B -2.0 -1.5 -1.0 -0.5 0.0 0.5 log 10-dose (mg/kg) 0. 0 0.2 0.4 0. 6 0.8 1. 0 frequ ency o f a nom al ie s D -2.0 -1.5 -1.0 -0.5 0.0 0.5 1.0 log 10-dose (mg/kg) 0.0 0.2 0.4 0.6 0.8 1.0 frequ ency o f feta l resorp tion C -2.0 -1.5 -1.0 -0.5 0.0 0.5 log 10-dose (mg/kg) 0. 0 0. 2 0. 4 0. 6 0. 8 1. 0 fr equ ency o f f used/ di vi ded /scr am bl ed st er nebr ae E
The distributions of the critical effect doses (CED) associated with the critical effect sizes were calculated. Each of the CEDsanimal was extrapolated to a CEDhuman. (Slob and
Pieters, 1998) using distributions of assessment factors as described in Vermeire et al. (1999). Table 4. summarizes the results.
Table 4. Summary of the probabilistic derivation of a human limit value
Effect parameter CES CEDhuman
(90% confidence interval3), µg/kg bw body weight reduction1 5% 8.6 (0.6 - 12.2)
decreased relative liver weight1 5% 6.0 (0.5 - 75.5) frequency of total resorptions2 1% 52 (4.2 - 677) frequency of anomalies2 5% 0.6 (0.5 - 0.6) Frequency of fused, divided, or
scrambled sternebrae2
5% 1.3 (1.2 - 1.5)
1 data from Iverson et al., 1995 2 data from Khera et al., 1982
3 human limit value is indicated in bold
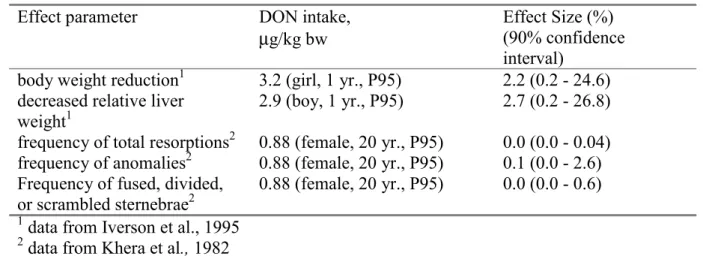
We also estimated the effect size in the sensitive human population due to the current exposure of DON. With regard to reduced body weight and reduced liver weights we considered the current intake of children. Children not only show the highest relative DON intake (caused by the high relative wheat intake of this group) but will also be most vulnerable to the effects. Children at the age of 1 yr. have the highest DON intake (95th percentile was 2.90 and 3.24 µg/kg bw for boys and girls, respectively). The dietary DON-intake of a 20-year-old female was 0.88 µg/kg bw (95th percentile), and this value was used
as the relevant exposure measure for the embryotoxic effects.
As Table 5 shows, effects on body weight and liver weight are likely to occur. However, the magnitude of these effects is highly uncertain: the confidence interval ranges from 0.2 to approximately 25%. Adults have a lower DON intake per kg bw than children. At the 95th percentile intake level of a 20-year-old female, embryotoxic effects appeared to be small.
Table 5. Summary of the probabilistic effect assessment
Effect parameter DON intake,
µg/kg bw
Effect Size (%) (90% confidence interval)
body weight reduction1 3.2 (girl, 1 yr., P95) 2.2 (0.2 - 24.6) decreased relative liver
weight1
2.9 (boy, 1 yr., P95) 2.7 (0.2 - 26.8) frequency of total resorptions2 0.88 (female, 20 yr., P95) 0.0 (0.0 - 0.04) frequency of anomalies2 0.88 (female, 20 yr., P95) 0.1 (0.0 - 2.6) Frequency of fused, divided,
or scrambled sternebrae2
0.88 (female, 20 yr., P95) 0.0 (0.0 - 0.6)
1 data from Iverson et al., 1995 2 data from Khera et al., 1982
4. DISCUSSION
In 1998 and 1999 DON contamination levels up to 2000 µg/kg and higher in wheat were detected in the Netherlands. In Europe a harmonized regulation of fusarium toxins is absent and guideline values of fusarium toxins in food, including DON, differ markedly between countries. Guideline values for DON in wheat range from 500-2000 µg/kg. On request of the Dutch Ministry of Public Health, Welfare and Sports (VWS), we therefore evaluated the toxicity data on DON. Taking into account the relevant studies and endpoints we derived a provisional TDI of 1.1 µg/kg bw/day. (Pieters et al., 1999). This provisional TDI is in line with Ehling et al. (1997), and Eriksen and Alexander (1998) and has also recently been adopted in the EU.
Based on the provisional TDI and the estimated wheat intake (child, 95th percentile) we calculated concentration limits for DON in (cleaned) wheat (129 µg/kg). We thus assumed that other grains are of minor importance for the DON intake in the Netherlands. We recognized (Pieters et al., 1999) that in view of the high contamination levels of DON in (cleaned) wheat, the suggested concentration limits may be difficult to enforce. Considering growth retardation as a reversible toxic effect, we considered two-fold higher concentration limits temporarily acceptable.
From 1998 onwards the Dutch Inspectorate for Health Protection has been monitoring the DON-concentrations of wheat and food products. The concentration of DON in wheat in the period September 1998 – January 2000 generally exceeded the suggested concentration limit of 129 µg/kg. The average concentration DON in wheat was 446 µg/kg (n = 219). At present, a (temporarily) concentration limit of 500 µg DON/kg wheat has been proposed in the EU. The current average DON concentrations in wheat is in line with the EU proposal for a concentration limit, and the performed effect assessment is therefore also representative for a possible future exposure.
The probabilistic effect assessment can be used for the derivation of human limit values (such as provisional TDI) as well as for the estimation of possible health effects due to actual exposures. For the derivation of human limit values a critical effect size has to be chosen for each effect parameter. We chose critical effect sizes of 5% for body weight, relative liver weight, frequency of anomalies and frequency of affected sternebrae and a critical effect size of 1% for frequency of fetal resorptions. By probabilistic combination of the distributions of the critical effect dose in the experimental animal with distributions of the appropriate assessment factors we yield distributions of human CEDs. The 5% lower confidence limits may be used as a human limit value and are 0.6 and 0.5 µg/kg bw for body weight and relative liver weight, respectively. For embryotoxic effects the 5% lower confidence limits were 4.2, 0.5 and 1.2 µg/kg bw for frequency of fetal resorptions, frequency of anomalies and frequency of fused, divided or scrambled sternebrae, respectively. These values are in the same order as the classically derived provisional TDI.
We show that, for people younger than 20 years, the dietary intake of DON in the period studied exceeded the provisional TDI. Young children have the highest relative exposure to DON. These children also form the group at risk since they are most vulnerable to growth retardation. Eighty percent of the one-year-old children is exposed to levels above the provisional TDI and 20% of the one-year-olds is exposed to levels twice the provisional TDI or higher. An other group that may be vulnerable to growth retardation are teenagers. However, the intake of DON rapidly declines with age and DON will thus have less effect on growth in teenagers than in babies and toddlers.
Bread forms the major source for DON in the Netherlands, and contributes for 60-70% to the total DON intake. For one-year-olds wheat containing porridges also contribute markedly since these children consume less bread. The intake of DON through the consumption of other grains is negligible for the whole population. Beer (barley) may form the only exception. If we assume the DON concentration in beer at the detection limit (i.e. 100 µg/kg), the contribution of beer to the total DON intake will be approximately 4% in adults. To gain insight in the real concentrations of DON in beer more sensitive, analytical measurements of DON will be carried out in the near future. Since for the Dutch population wheat (as bread) is a basic food product, the only way to reduce the DON intake is to reduce the concentrations of DON in wheat. Unfortunately, there are no data available on DON concentrations in wheat and wheat containing food products in the Netherlands in previous years, so we do not have insight in whether the period studied is representative for the exposure to DON in general. From our probabilistic risk assessment (Table 5) we conclude that the current intake of DON might cause health effects in children, with growth retardation and reduction of relative liver weight as the most relevant effects. For this assessment we used data of the chronic mice study of Iverson et al. (1995). In this study the suppressive effect of DON on body weight was not associated with reduced food intake. Though we modeled the reported terminal body weights (i.e. the body weights after two years of exposure), the figures reported by Iverson et al. (1995) indicate that the effects on body weight are caused in the first 20% of the total life span. We therefore consider the data appropriate to estimate the effects of DON in children. If DON would only affect body weights, an increased relative liver weight would be expected. Instead, the relative liver weights decreased in males (Iverson et al., 1995). Since this effect may also be explained by inhibition of protein synthesis (as in the case of by growth retardation), we also analyzed this effect parameter in our effect assessment.
Considering the 95th percentile of DON intake of one-year-olds, we show that at this intake level effects on body weight and liver weight are likely to occur. However, the magnitude of these effects is highly uncertain: the confidence interval ranges from less than 1% to approximately 25%. The best estimates of these effects are 2.2% and 2.7%, respectively. The large confidence intervals are caused by the rather broad distributions of the assessment factor used to correct for interspecies variation. We used scaling to caloric demand (BW0.75) for the toxicokinetic extrapolation from mouse to human. The remaining uncertainty of the assessment factor was assessed by combining all available experimental data into a distribution (Vermeire et al., 1999, Luttik and van Raaij, 2001). Since this distribution is based on NOAELs the distribution also contains the statistic noise surrounding the NOAELs (Slob and Pieters, 1998). The distribution used will therefore be too broad, however, it is not possible to indicate by how much.
If the classical factor of 100 were used to extrapolate from mice to humans, the estimate of the effect size would have been 7.0% for body weight reduction and 8.4% for decrease of relative liver weight.
Adults have a lower DON intake per kg bw than children. At the 95th percentile intake level of a 20-year-old female, embryotoxic effects appeared to be low.
Whether an effect size of approximately 2.5% for reduction of body weight and increased relative liver weight may be (un)acceptable, is a matter of debate and forms part of the risk management process. It should be realized that, similar to the derivation of the provisional TDI, the estimation of the health effects mentioned above are based on extrapolation of animal data. At present, there is no evidence (yet) that these effects will occur in the human population. On the other hand, it should be noted that this effect assessment has been carried
out for only one compound (DON). The effects of exposure to other compounds have thus not been taken into account.
5. CONCLUSIONS
• We derived a provisional TDI of 1.1 µg/kg bw. This provisional TDI is based on a chronic mice study (Iverson et al., 1995). The critical effects were reduction of body weight (both sexes) and relative liver weight (males only). Based on this TDI and a high wheat consumption of children, a concentration limit of 129 µg DON/kg wheat has been proposed (Pieters et al., 1999).
• Monitoring data (September 1998-January 2000) show that the average DON concentration in wheat was 446 µg/kg (n = 219). The major source of DON intake is bread. For one-year-olds porridges also contribute significantly. The DON-intake through other grains is negligible in the Netherlands since the consumption of these grains is low. • The dietary intake of DON in the Netherlands during the period September 1999-January
2000 exceeds the provisional TDI, especially in children. Eighty percent of the one-year-olds have a DON intake above the provisional TDI and 20% of these children exceed twice the provisional TDI.
• At these exposure levels of DON health effects might occur in children. The suppressive effects on body weights (growth retardation) and relative liver weight are estimated at 2.2 and 2.7%. However, the large confidence intervals around these estimates indicate that the magnitudes of these effects are uncertain. Whether such estimated effect levels are considered (un)acceptable, is a matter of debate and forms part of the risk management process. It should be noted that the probabilistic effect assessment is based on extrapolation of observations in animal experiments to humans. At present, there is no evidence (yet) that the estimated effects will occur in the human population.
REFERENCES
Arnold, D.L., Karpinski, K.F., McGuire, P.F., Nera, E.A., Zawidzka, Z.Z., Lok, E., Campbell, J.S., Tryphonas, L.and Scott, P.M., 1986, A short-term feeding study with deoxynivalenol (vomitoxin) using rats, Fundam Appl Toxicol 6: 691-696.
Bergsjø, B., Matre, T. and Nafstad, I., 1992, Effects of diets with graded levels of deoxynivalenol on performance in growing pigs, J Vet Med A39: 752-758.
Bergsjø, B., Langseth, W., Nafstad, I., Høgset Jansen, J. and Larsen, H.J.S., 1993, The effects of naturally deoxynivalenol-contaminated oats on the clinical condition, blood parameters, performance and carcass composition of growing pigs, Vet Res Commun 17: 283-294. Cahill, L.M., Kruger, S.C., McAlice, B.T., Ramsey, C.S., Prioli, R. and Kohn, B., 1999, Quantification of deoxynivalenol in wheat using an immunoaffinity column and liquid chromatography. J Chromatography A 859:23-28.
Deijns, A.J., Egmond, H.P. van, Speijers, G.J.A., Loveren, H. van, 1994, Immunotoxicity of natural toxins. A literature overview. (in Dutch), National Institute of Public Health and the Environment. RIVM-report 388802 007, p. 16-17, Bilthoven, the Netherlands.
EHC, 1994, Assessing human health risks of chemicals: Derivation of guidance values for health-based exposure limits. In Environmental Health Criteria, 170. IPCS, WHO, Geneva, Switzerland.
Ehling, G., Cockburn, A., Snowdon, P. and Buchhaus, H., 1997, The significance of the Fusarium toxin deoxynivalenol (DON) for human and animal health, Cereal Research Commun 25: 433-447.
Eriksen, G.S., Alexander, J. (eds.), 1998, Fusarium Toxins in Cereals – a Risk Assessment, Copenhagen, Nordic Council of Ministers, TemaNord, 502, pp 45-58, Copenhagen.
IARC, 1993, Monographs on the Evaluation of Carcinogenic Risks to Humans; Vol. 56: Some naturally occurring substances, food items and constituents, heterocyclic aromatic amines and mycotoxins, International Agency for Research on Cancer, World Health Organization, pp 397-444, Lyon.
Iverson, F., Armstrong, C., Nea, E., Truelove, J., Fernie, S., Scott, P.M., Stapley, R., Hayward, S., and Gunner, S., 1995, Chronic feeding study of deoxynivalenol in B6C3F1 male and female mice, Teratogenesis Carcinogenesis Mutagenesis 15: 283-306.
Khera, K.S., Whalen, C., Angers, G., Vesonder, R.F. and Kuiper-Goodman, T., 1982,
Embryotoxicity of 4-deoxynivalenol vomitoxin) in mice, Bull Environm Contam Toxicol 29: 487-491.
Khera, K.S., Arnold, D.L., Whalen, C., Angers, G. and Scott, P.M., 1984, Vomitoxin (4-deoxynivalenol): effects on reproduction of mice and rats, Toxicol Appl Pharmacol 74: 345-356.
Kistemaker, C., Bouman, M. and Hulshof, K.F.A.M., 1998, Consumption of separate products by Dutch population groups - Dutch National Food Consumption Survey 1997 – 1998 (in Dutch). Zeist, TNO-Nutrition and Food Research Institute, TNO-report V98.812. Liem, A.K.D. and Theelen, R.M.C., 1997, Dioxins. Chemical Analysis, Exposure and Risk Assessment. PhD Thesis. Research Institute of Toxicology (RITOX), University of Utrecht, The Netherlands.
Luttik,, R., van Raaij, M.T.M. (eds)., 2001, Factsheets for the (eco)toxicological risk
assessment strategy of the National Institute of Public Health and the Environment (RIVM), RIVM report 601516 007, Chapter 5 by T. Vermeire, M.N. Pieters, M. Rennen and P. Bos, RIVM, Bilthoven, The Netherlands
Morrissey, R.E., Norred, W.P. and Vesonder, R.F., 1985, Subchronic toxicity of vomitoxin in Sprague-Dawley rats. Food Chem Toxicol 23: 995-999.
Morrissey, R.E. and Vesonder, R.F., 1985, Effect of deoxynivalenol (vomitoxin) on fertility, pregnancy, and postnatal development of Sprague-Dawley rats, Appl Environm Microbiol 49: 1062-1066
Pieters, M.N., Fiolet, D.C.M. and Baars, A.J., 1999, Deoxynivalenol. Derivation of
concentration limits in wheat and wheat containing food products, National Institute of Public Health and the Environment, RIVM report 388802 018. Bilthoven, the Netherlands.
Rotter, B.A., Prelusky, D.B. and Pestka, J.J., 1996, Toxicology of desoxynivalenol (Vomitoxin). J Toxicol Environm Health 48: 1-34.
Rotter, B.A., Thompson B.K., Lessard M, 1995, Effects of desoxynivalenol-contaminated diet on performance and blood parameters in growing swine. Can J Anim Sci 75: 297-302. Rotter, B.A., Thompson B.K., Lessard M., Trenholm H.L., Tryphonas H., 1994, Influence of low-level exposure to Fusarium mycotoxins on selected immunological and hematological parameters in young swine. Fundam Appl Toxicol 23: 117-124
Slob, W., 1993, Modeling long-term exposure of the whole population to chemicals in food. Risk Analysis 13: 525-530
Slob, W. and Pieters, M.N., 1998, A probabilistic approach for deriving acceptable human intake limits and human health risks from toxicological studies: general framework. Risk Analysis 18: 787-798.
Slob, W., 1999, Deriving safe exposure levels for chemicals from animal studies using statistical methods: recent developments. In: Statistics for the Environment 4: Pollution Assessment and Control, V. Barnett, A. Stein and K.F. Turkman (eds), John Wiley and Sons, Ltd, p 153 -175, Chichester.
Tryphonas, H., Iverson, F., Ying So, E.A., McGuire, P.F., O'Grady, L., Clayson, D.B. and Scott, P.M., 1986, Effects of deoxynivalenol (vomitoxin) on the humoral and cellular immunity of mice, Toxicol Lett 30: 137-150.
VanDooren, M.M.H., Boeijen, I., Van Klaveren, J.D. and Van Donkersgoed, G. (1995), Conversion of consumer food to primairy agricultural products (in Dutch). Wageningen, State Institute for Quality Control of Agricultural Products (RIKILT), report 95.17.
Vermeire, T. , Stevenson, H., Pieters, M.N., Rennen, M., Slob, W. and Hakkert, B.C., 1999, Assessment factors for human health risk assessment: a discussion paper. Critical reviews in Toxicology :29, 439-490
Appendix 1 Mailing list
1 Prof. P. Peters (Inspectorate for Health Protection and Veterinary Public Health, The Netherlands)
2 Dr. H. J. Schneider, Director Public Health Department, The Netherlands
3 Dr. D.G. Groothuis (Inspectorate for Health Protection and Veterinary Public Health, The Netherlands)
4 Drs. H.J. Jeuring (Inspectorate for Health Protection and Veterinary Public Health, The Netherlands)
5 Prof.dr. J.J. Sixma (Chairman of the Dutch Health Council) 6 Dr.ir. L. T. J.. Pijls (Health Council of the Netherlands)
7 Dr. M. Spanjer (Inspectorate for Health Protection and Veterinary Public Health, The Netherlands)
8 Dr. F. Verstraete (EU-EC DG-SANCO)
9 Dr. J. de Stoppelaar (Ministry of Public Health, Welfare and Sport)
10 Mw. N. Scheidegger (Ministry of Agriculture, Nature Management and Fisheries) 11 Mr. M. Elema (Product Board Grains, Seeds and Pulses)
12 Dr. T. Kuiper-Goodman (Food Directorate, Health Canada, 2204 D1, Ottawa, Ontario K2AOL2, Canada)
13 Ir. J. van Klaveren (Rikilt)
14 Depot of Dutch Publications and Bibliografies 15 Mr. H. Pont, Director-General RIVM
16 Dr. G. Elzinga, Director of Public Health, RIVM
17 Dr. G. de Mik, Director of Division Risks, Environment and Health, RIVM 18 Dr. R.B. Beems (LPI/RIVM)
19 Prof.dr. J.G. Vos (Head LPI/RIVM) 20 Dr. J. van Benthem (LEO/RIVM)
21 Dr. A.B.T. Boink (LEO/RIVM)
22 Dr. J. Meulenbelt (Head NVIC/RIVM) 23 Prof.Dr. R.W. Stephany (Head ARO/RIVM) 24 Dr. W.H. Könemann (Head CSR/RIVM) 25 Dr. E. Lebret (Head LBM/RIVM) 26 Ir. H.P. van Egmond (ARO/RIVM) 27 Dr. R.C. Schothorst (ARO/RIVM) 28 Drs. A.G.A.C. Knaap (CSR/RIVM) 29 Dr. G.J.A. Speijers (CSR/RIVM) 30 Mw. M.E. van Apeldoorn (CSR/RIVM) 31 Mw. ir. M.E.J. Pronk (CSR/RIVM) 26-29 Authors
30 Head of Department Information and Public Relations (RIVM) 31 Library RIVM
32 Library CSR/RIVM 33 Library ARO/RIVM 34 Report Registration/RIVM 36-46 Sales department /RIVM 47-57 Stock CSR/RIVM 58-78 Stock ARO/RIVM