Disease burden of food-related pathogens
in the Netherlands, 2018
RIVM Letter report 2019-0086 R. Pijnacker et al.
Colophon
© RIVM 2019
Parts of this publication may be reproduced, provided acknowledgement is given to: National Institute for Public Health and the Environment, along with the title and year of publication.
DOI 10.21945/RIVM-2019-0086 R. Pijnacker (auteur), RIVM I. H. M. Friesema (auteur), RIVM L. Mughini Gras (auteur), RIVM G.R. Lagerweij (auteur), RIVM W. van Pelt (auteur), RIVM E. Franz (auteur), RIVM Contact:
Roan Pijnacker
Infectieziekten en Vaccinologie\Epidemiologie en Surveillance van Infectieziekten\Gastro-enteritis
roan.pijnacker@rivm.nl
This investigation has been performed by order and for the account of Ministerie van VWS, within the framework of Programma 5
This is a publication of:
National Institute for Public Health and the Environment
P.O. Box 1 | 3720 BA Bilthoven The Netherlands
Publiekssamenvatting
Ziektelast van via voedsel overdraagbare ziekteverwekkers in Nederland in 2018
Het RIVM onderzoekt elk jaar hoeveel mensen ziek worden en overlijden door maag-darminfecties die zij via voedsel oplopen. Virussen, bacteriën of parasieten kunnen hier de oorzaak van zijn. Deze ziektelast wordt uitgedrukt in DALY’s (Disability Adjusted Life Year). Dit is een
internationale maat voor het aantal gezonde levensjaren dat verloren gaat aan ziekte of vroegtijdig overlijden.
De onderzochte 14 ziekteverwekkers kunnen niet alleen via voedsel aan de mens worden overgedragen (in totaal ongeveer 40 procent). Dat kan namelijk ook via het milieu (bijvoorbeeld via oppervlaktewater), via dieren, en van mens op mens.
Het verschilt per ziekteverwekker via welke van deze routes de meeste mensen ziek worden. Sommige ziekteverwekkers verspreiden zich vooral via voeding, zoals Salmonella. Voor andere ziekteverwekkers zijn andere routes belangrijker. Het rotavirus bijvoorbeeld wordt vooral van mens op mens overgedragen. Het totaal aantal DALY’s als gevolg van deze 14 ziekteverwekker is in 2018 hetzelfde als in 2017 (11.000 DALY’s). De ziektelast via voedsel is in 2018 geschat op 4.300 DALY’s, en is daarmee bijna hetzelfde als in 2017 (4.200).
De totale kosten van deze ziektelast worden geschat op 426 miljoen euro, en zijn daarmee hoger dan in 2017 (397 miljoen). Deze cost of illness zijn de directe medische kosten, maar ook de kosten voor de patiënt en/of zijn familie, zoals reiskosten, en de kosten binnen andere sectoren, bijvoorbeeld door werkverzuim. De kosten als gevolg van besmet voedsel zijn ook iets hoger: 171 miljoen euro in 2018 ten opzichte van 163 miljoen euro in 2017. De verschillen in DALY’s en kosten zijn vooral een gevolg van schommelingen in het aantal infecties van de onderzochte ziekteverwekkers.
Het ministerie van VWS is de opdrachtgever van dit onderzoek. De resultaten geven handvatten om meer zicht te krijgen op de ziektelast en manieren waarop de Nederlandse bevolking aan voedselinfecties wordt blootgesteld. Ook worden de ontwikkelingen door de jaren heen duidelijk.
Synopsis
Disease burden of food-related pathogens in the Netherlands, 2018
The Ministry of VWS has requested RIVM to present an annual update on the number of illnesses, disease burden and cost-of-illness caused by 14 enteric pathogens. These pathogens can be transmitted by food, the environment, animals and humans. The disease burden is expressed in DALYs (Disability Adjusted Life Years), a metric integrating morbidity and mortality into one unit. Furthermore, the cost-of-illness (COI) related to the 14 food-related pathogens was estimated and expressed in euros. The COI estimate includes healthcare costs, the costs for the patient and / or his family, such as travel expenses, as well as costs in other sectors, for example due to productivity losses. The total disease burden caused by the 14 pathogens in 2018 was similar to 2017 (both 11,000 DALYs). The share of foodborne transmission in this estimated burden was comparable with earlier years, mounting to 4,300 DALYs in 2018 (2017: 4,200 DALYs). The total COI caused by the 14 pathogens increased slightly from 397 M€ in 2017 to 426 M€ in 2018. The food-related COI was 171 M€ in 2018, which is slightly higher than in 2017 (i.e. 163 M€). The differences in DALYs and COI between 2017 and 2018 are largely due to fluctuations in the number of infections that occur per pathogen, the burden of disease they cause and the varying costs per infection.
The research presented in this report results in more insight in the number of incident cases of foodborne diseases and the associated disease burden and costs-of-illness. It enables researchers and policy-makers to monitor trends in time for these 14 pathogens.
Keywords: food-related disease, disease burden, DALY, cost-of-illness, costs.
Contents
Introduction — 9 1 Methods — 11 1.1 Trend information — 11 1.2 Disease burden — 12 1.3 Cost of illness — 12 1.4 Attribution — 12 2 Results — 13 2.1 Trend information — 132.2 Number of incident cases — 16 2.3 Disease burden by pathogen — 18 2.4 Cost-of-illness by pathogen — 20 2.5 Attribution — 23
3 Discussion — 31
4 References — 33
Introduction
Since 2008, RIVM regularly publishes estimates of the number of incident cases, disease burden and costs-of-illnesses of food-related infectious disease on its web pages1 and since 2010 in publicly available
reports (e.g.[1-8])
The health impact of foodborne pathogens is expressed in Disability Adjusted Life Years (DALY) and cost-of-illness (COI). The methodology that is used to estimate the DALYs is described in detail in a peer-reviewed paper [9], and in the disease burden report of food-related pathogens over the year 2015 [6]. Since last year (reporting over 2017), estimates for Hepatitis-E virus and Cryptosporidum spp. were updated by using available RIVM laboratory surveillance data, no negative trend correction was applied for Giardia spp.. Moreover, newly available European disability weights by Haagsma et al. [10] were used as well as more recent life expectancy tables from the Global burden of disease (GBD) 2010 study [11]. The COI, expressed in euros for all 14 food-related pathogens, was calculated for the first time in 2011 [12] and equally updated in 2018 using more recent reference prices for health economic evaluations from the Dutch healthcare institute [13, 14]. The economic module was integrated to the existing disease burden model in 2011, and annual updates of both, disease burden and COI have followed [3-8].
In the current report, trend information from surveillance, demographic information and consumer price index (a measure for changes in price levels of consumer goods and services) were used to update the information to the year 2018.
1
Methods
1.1 Trend information
Data on the size and age distribution of the Dutch population, as well as mortality risks and the number of live births and stillbirths were
obtained from Statistics Netherlands2.
Table 1. Population in the Netherlands by age group, 2014-2018
Age group 2018 2017 2016 2015 2014 0 169,566 172,288 170,341 174,681 170,953 1-4 698,533 700,001 706,513 713,641 726,716 5-11 1,303,023 1,307,281 1,313,978 1,324,894 1,338,448 12-17 1,214,974 1,224,528 1,225,749 1,215,977 1,206,685 18-64 10,555,872 10,517,749 10,477,231 10,463,848 10,467,463 65+ 3,239,116 3,159,660 3,085,308 3,007,685 2,919,024 Total 17,181,084 17,081,507 16,979,120 16,900,726 16,829,289
Table 2. Live births by age of mothers in the Netherlands, 2014-2018
Age of mother 2018* 2017 2016 2015 2014 -19 983 1,023 1,076 1,109 1,276 20-24 11,073 11,722 12,580 13,125 14,213 25-29 46,632 47,197 48,557 48,724 50,307 30-34 68,438 67,575 67,760 66,373 68,120 35-39 35,562 34,905 35,205 34,070 33,797 40-44 7,073 6,941 6,922 6,733 7,046 45+ 520 473 420 376 422 Total 170,281 169,836 172,520 170,510 175,181 * Estimates based on observed trend from 2015-2017
Trend information on the incidence of gastro-enteritis (GE) by pathogen in the general population and consulting the general practitioner was obtained from the following sources:
• Thermophilic Campylobacter spp.: RIVM laboratory surveillance; • Non-typhoidal Salmonella spp.: RIVM laboratory surveillance; • Shiga-toxin producing Escherichia coli O157 (STEC O157):
mandatory notification and active laboratory surveillance; • Perinatal and acquired listeriosis: mandatory notification and
active laboratory surveillance;
• Norovirus: estimated norovirus-associated hospitalized cases derived from RIVM laboratory surveillance;
• Rotavirus: RIVM laboratory surveillance;
• Hepatitis-A virus: mandatory notification and active laboratory surveillance;
• Hepatitis-E virus: RIVM laboratory surveillance data; Note this was adapted in 2017 [7]and is therefore different with earlier publications [1-6, 9, 12] where a stable incidence based on Borgen et al. [15]was assumed.
• Cryptosporidium spp.: RIVM laboratory surveillance data since 2013. Note this was adapted in 2017 [7] and is therefore different
with earlier publications [1-6, 9, 12] where a stable incidence was assumed since 2003.
• Giardia spp.: a stable incidence was assumed since 2007 (i.e. the last year of RIVM laboratory surveillance data for Giardia spp.). Note this was adapted in 2017 [7] and is therefore different with earlier publications [1-6, 9, 12] where a continuing decrease with the rate of -1.03% per year observed between 2001 and 2007 was assumed.
• No trend information was available for the GE toxin-producing bacteria (Bacillus cereus, Clostridium perfringens and
Stapylococcus aureus), and toxoplasmosis. For the latter, trends in reported fatalities are included.
Trends in hospitalizations for gastro-enteritis as primary cause (ICD codes 20-93; 558.9) were obtained from the Dutch Hospital Data (DHD) for 2011-2014. Since 2015 the number of hospitalized patients is indirectly estimated from the observed time series of RIVM laboratory surveillance data on rotavirus, norovirus, campylobacteriosis and salmonellosis. Excess mortality risks from campylobacteriosis and salmonellosis were assumed constant across the years. Fatalities due to listeriosis and STEC O157 were obtained from active surveillance based on mandatory
notification to RIVM. Age-specific case fatality ratios for norovirus and rotavirus, originally obtained from German surveillance data, and for protozoan pathogens, originally obtained from the international literature, were assumed constant throughout the years (changes in years of life lost therefore reflect changes in incidence on which mortality is based).
1.2 Disease burden
The method for DALY calculations was not changed since last year (i.e. reporting over 2017) [7].
1.3 Cost of illness
The method for COI estimates was not changed since the 2018-updates (i.e. reporting over 2017) [7], only the cost prices used for the different resources had to be updated to 2018 euros using consumer price indexes as provided by Statistics Netherlands3. In order to allow comparison with
earlier results we also updated the earlier cost-of-illness estimates (i.e., 2013-2017) to 2018 euros; hence all differences in the results for the year 2018 compared to earlier years will reflect the impact of trends in the underlying information on demographics and pathogen incidence.
1.4 Attribution
The fraction of human cases of enterically transmitted illness by five major pathways
(food, environment, direct animal contact, human–human transmission, and travel) and by 11 groups within the food pathway was estimated using structured expert elicitation and is described in detail in Havelaar et al. [16]. The method and estimates for attribution was not changed since then.
2
Results
2.1 Trend information
Trend information for specific pathogens is presented in Table 3. A summary of trends (in comparison with 2017) is discussed below:
• The incidence of campylobacteriosis (laboratory confirmed cases) increased from 33 cases per 100,000 inhabitants in 2017 to 35 cases per 100,000 inhabitants in 2018. However, the incidence in 2018 is lower compared with 2010-2016.
• The incidence of salmonellosis (laboratory confirmed cases) is with 9 cases per 100,000 inhabitants similar to 2013-2017 (range: 9 to 11 per 100,000 inhabitants).
• The incidence of cryptosporidiosis (laboratory confirmed cases) increased from 8 per 100,000 in 2017 to 10 per 100,000 in 2018, but is within the range of the incidence in 2013-2016.
• The incidence of gastroenteritis by rotavirus (laboratory confirmed cases) in 2018 (17 per 100,000 inhabitants) was similar to 2017 (16 per 100,000 inhabitants in 2017). The observed biannual trend of a low epidemic year followed by a high epidemic year that was observed in 2014-2017 did not continue in 2018.
• The incidence of gastroenteritis by norovirus (laboratory confirmed cases) was with 27 cases per 100,000 inhabitants higher than in 2017 (23 per 100,000 inhabitants) but similar to 2012-2016 (range: 25-33 per 100,000 inhabitants).
• The incidence of acquired listeriosis (laboratory confirmed cases, active surveillance) decreased from 112 cases in 2017 to 71 cases in 2018. It was also slightly lower than most years in 2013-2016. The recorded fatalities was with 4 also lower than previous years (e.g. 10 in 2017 and 8 in 2016).
• In 2018 the incidence of perinatal listeriosis (laboratory confirmed cases, active surveillance) was 7 cases with 2 fatalities. This was higher than in 2017, with 3 cases and 2 fatalities, but similar to earlier years (i.e. 2015-2016). • The incidence of diseases caused by STEC O157 (laboratory
confirmed cases, active surveillance) in 2018 was 59 laboratory confirmed cases of which 23 were hospitalized, which is similar to 2017 (58 cases) but lower compared to 2014 and 2015. The number of patients with HUS was with 5 cases in 2018 slightly higher than in 2014-2017 with 2 or 3 cases annually.
• The incidence of hepatitis-A virus (active surveillance) was 188 reported cases and 57 hospitalized cases far higher than in earlier years (~ 80 cases in 2016 and 2015), but lower than in 2017 (374 cases). The high number of cases in 2017 and 2018 was due to an international outbreak in men-having sex with men, which peaked in 2017 and decreased throughout 2018. • With 2 cases per 100,000 inhabitants the incidence of hepatitis-E
virus (laboratory confirmed cases) was lower than in 2016 and in 2015 (i.e. 3 cases per 100,000) but similar to 2017 (2 cases per 100,000 inhabitants).
• The number of patients that were admitted to the hospital due to GE was estimated to be 21,800 in 2018 and was similar to 2017 (21,400) and slightly higher than in 2016 (20,800). The lower number of hospitalizations in 2016 was mainly due to a lower number of rotavirus infections.
Table 3. Trends in incidence per 100,000 inhabitants and reported cases, respectively, of food-related pathogens, 1999-2018
Year Caa Saa Crypa RVa NVa aLmb aLm
fata b pLm b pLm fatal b O157 b O157 hosp b HAV b HAV hosp b HEV a 1999 39 21 19 14 32 2000 42 20 16 13 43 2001 44 20 18 11 41 2002 41 15 17 12 49 2003 33 21 18 13 57 2004 40 16 15 13 37 2005 44 13 21 16 85 15 6 53 2006 40 16 26 17 59 17 5 1 40 258 39 2007 41 12 20 15 60 12 6 1 83 168 27 2008 39 16 27 18 51 6 1 1 45 183 35 2009 44 12 31 18 76 4 3 1 57 21 176 29 2010 50 14 35 23 73 13 4 1 51 21 262 52 0.8 2011 51 12 24 21 79 4 9 1 65 18 d 125 25 0.9 2012 49 21 20 26 c 71 8 6 0 85 31 e 121 28 1 2013 48 9 6 23 26 c 76 7 3 0 90 36 f 109 30 0.9 2014 48 9 6 9 25 c 92 9 4 2 79 31 g 105 23 2 2015 43 9 10 20 27 c 69 15 3 1 76 27 h 80 23 3 2016 38 11 12 10 33 c 89 8 7 4 64 21 i 81 22 3 2017 33 9 8 16 23 c 112 10 3 2 58 23 374k 90m 2 2018 35 9 10 17 27 c 71 4 7 2 59 23 j 188l 57n 2
Used abbreviations: Ca: Campylobacter spp. ; Sa: Salmonella spp.; Cryp: Cryptosporidium spp.; RV: rotavirus; NV: norovirus; aLm: acquired
listeriosis; pLm: perinatal listeriosis: O157: STEC o157; HAV: hepatitis-A-virus; hosp: hospitalized; HEV: hepatitis-E-virus.
Notes: a).per 100,000 inhabitants whereby presented numbers are rounded: ≥10 to two significant numbers (e.g. 12.5 = 12) and <10 to 1 significant number (e.g. 0.89=0.9); b) reported cases; c) estimated norovirus-associated hospitalized cases derived from RIVM laboratory surveillance data and therefore not directly comparable to numbers from before 2012; d) known for 57/65 cases; e) known for 77/85 cases; f) known for 84/90 cases; g) known for 71/79 cases; h) known for 68/76 cases; i) known for 60/64 cases; j) known for 58 out of 59 cases; k) ~ 275 cases are (in)directly linked to an international outbreak in men-having sex with men (MSM); l) 65 cases are (in)directly linked to an international outbreak of MSM m) known for
2.2 Number of incident cases
Ten of the selected pathogens (i.e. Campylobacter spp.; STEC O157; Salmonella spp.; all three toxin-producing bacteria; norovirus; rotavirus; Cryptosporidium spp.; Giardia spp.) cause acute
gastroenteritis. The other four pathogens (i.e. Listeria monocytogenes; Toxoplasma gondii; hepatitis-A virus; hepatitis-E virus) cause other diseases (e.g. meningitis, sepsis, hepatitis). The estimated number of incident cases of (acute) gastroenteritis by pathogen in 2018 is presented in Table 4. The estimated number of incident cases of
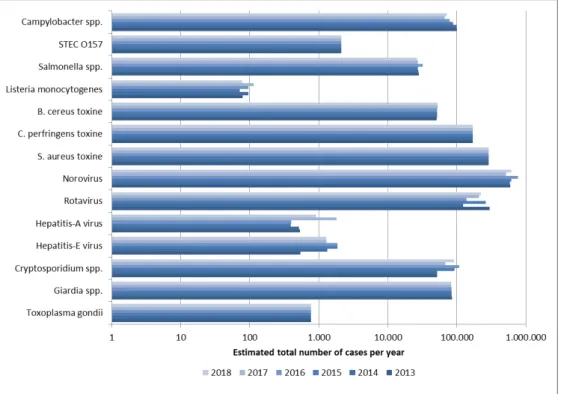
diseases by non-gastrointestinal pathogens in 2018 is presented in Table 5. The number of incident cases by the 14 pathogens for the years 2013-2018 is presented in Figure 1 and in Table A.1 in Annex I.
There was an increase of the estimated total number of cases due to the 14 food-related pathogens from 1,490,000 in 2017 to 1,630,000 in 2018, a result mostly due to the higher number of incident cases of norovirus, and to a lesser extend due to cryptosporidiosis and rotavirus in 2018 compared with 2017. The estimated incidence of the remaining pathogens did not change, mostly because no trend information based on surveillance data was available.
Table 4. Mean estimated number of incident cases and 95% uncertainty interval (between brackets) of gastroenteritis by pathogen in the Netherlands, 2018
Pathogen Number of incident cases# Fatal
cases# General population
(x 1,000) (x 1,000) GP visit Hospitalised (x 1,000)
All causes 4,840 225 22 NA#
(4,010-5,760) (71-529) - Bacteria – infectious Campylobacter spp. 71 17 1.1 47 (9.3-198) (8.6-32) (0.4-2.2) (31-65) STEC O157 2.1 0.3 0.02 4.0 (0.2-8.6) (0.01-0.9) (0.02-0.02) (2-7) Salmonella spp. 27 4.0 1.1 25 (2.2-81) (2.1-6.8) (0.5-2.1) (22-29) Bacteria – toxin producing
Bacillus cereus 53 7,4 0,2 0 (19-126) (1.7-21) (0.1-0.5) - Clostridium perfringens 171 32 0.3 5 (63-355) (7.5-82) (0.1-0.6) (0-20) Staphylococcus aureus 288 40 1.5 7 (130-525) (11-95) (0.6-2.9) (0-29) Viruses Norovirus 615 14 1.9 69 (421-881) (8.2-23) (1-3.2) (28-131) Rotavirus 224 13 5.5 38 (115-393) (8.5-20) (4.1-7.4) (12-85) Protozoa Cryptosporidium spp. 91 6 0.6 6 (32-219) (2.7-10) (0.2-1.2) (0-25) Giardia spp. 82 8 0.4 2 (46-156) (3.9-13) (0.04-1.4) (0-9)
#Presented numbers are rounded: ≥ 100,000 to three significant numbers (e.g. 123,256 =
and <10 to 1 significant number (e.g. 0.0023=0.002). The presented numbers are estimates that rely on annual surveillance data being corrected for: i) coverage (where applicable); ii) underdiagnosis and underreporting; and iii) under-ascertainment (i.e. being sick without requiring medical help).
Table 5. Mean estimated number of incident cases and 95% uncertainty interval (between brackets) of non-gastrointestinal pathogen in the Netherlands, 2018
Pathogen Number of incident cases
mean (95% CI) mean (95% CI) Fatal cases Listeria monocytogenes Perinatal 7 * 2 * Acquired 71 * 4 * Hepatitis-A virus# 900 (600-1,500) 3 (2-5) Hepatitis-E virus# 1,300 (770-2,000) 15 (5-32) Toxoplasma gondii# Congenital 343 (178-605) 12 (8-19) Acquired** 427 (199-724) 0
*No uncertainty because Listeria cases were acquired through surveillance; **
chorioretinitis only. #The presented numbers are rounded: ≥10 to two significant numbers
(e.g. 1,325 = 1,300) and <10 to 1 significant number (e.g. 0.0023=0.002). The presented numbers are estimates that rely on annual surveillance data being corrected for: i) coverage (where applicable); ii) underdiagnosis and underreporting; and iii) under-ascertainment (i.e. being sick without requiring medical help).
Figure 1. Comparison of mean estimated number of incident cases of food-related pathogens, 2013- 2018
* Since the 2017-update new incidence estimates for hepatitis-E virus, Cryptosporidium spp. and Giardia spp. are used, therefore estimates presented here for 2013-2015 are different from the one presented in earlier publications (i.e. [3-6]).
The total number of estimated deaths due to foodborne disease in 2018 was similar to 2017, with 238 and 240 deaths, respectively (see Table A.2 in Annex).
2.3 Disease burden by pathogen
Table 6 presents the estimated burden of disease by pathogen for the year 2018 for the total Dutch population, as DALY per 100,000
inhabitants and as DALY per 1,000 cases, both undiscounted and discounted.
The total burden of disease of the 14 pathogens in 2018 was similar to 2017, with 11,000 DALYs, but lower than 2010-2016 (Table A.3 in Annex). The largest difference in burden of disease between 2017 and 2018 was found for norovirus (+330 DALYs). The largest burden at population level was caused by Campylobacter spp. (3,200 DALY), Toxoplama gondii (1,900 DALYs) and norovirus (1,900 DALYs).
Interestingly, although the disease burden for Campylobacter spp. has continually decreased since 2010, the disease burden slightly increased in 2018. Perinatal listeriosis was the disease outcome with the highest individual burden among all pathogens (31 DALY per case), followed by congenital toxoplasmosis (5 DALY per case).
Table 6 Mean total DALY per year, DALY per 100,000 inhabitants and DALY per 1000 cases of illness in the Netherlands, 2018#
Pathogen DALY/year DALY per
100,000/year DALY per case
Discount rate 0% 1.5% 0% 1.5% 0% 1.5% Bacteria – infectious Campylobacter spp. 3,200 2,800 19 16 0,04 0,04 STEC O157 150 120 0,9 0,7 0,07 0,06 Salmonella spp. 1,100 1,000 6,6 5,8 0,04 0,04 L. monocytogenes (perinatal) 220 120 1,3 0,7 31 18 L. monocytogenes (acquired) 42 39 0,2 0,2 0,6 0,6 L. monocytogenes (total) 260 160 1,5 1,0 3,3 2,1
Bacteria – toxin producing
Bacillus cereus 32 32 0,2 0,2 0,001 0,001 Clostridium perfringens 200 190 1,1 1,1 0,001 0,001 Staphylococcus aureus 220 210 1,3 1,2 0,001 0,001 Viruses Norovirus 1,900 1,700 11,3 10,1 0,003 0,003 Rotavirus 1,200 1,040 6,9 6,1 0,005 0,005 Hepatitis-A virus 100 80 0,6 0,5 0,11 0,09 Hepatitis-E virus 510 410 3,0 2,4 0,4 0,3 Protozoa Cryptosporidium spp. 160 150 0,9 0,9 0,002 0,002 Giardia spp. 220 220 1,3 1,3 0,003 0,003
Toxoplasma gondii (congenital) 1,600 920 9,4 5,4 5 3
Toxoplasma gondii (acquired) 280 210 1,6 1,2 0,7 0,5
Toxoplasma gondii (total) 1,900 1,100 11 6,6 2,5 1
TOTAL 11,000 9,000 64 52
# Presented numbers are rounded: ≥ 100,000 to three significant numbers (e.g. 123,256
= 123,000); between <100,000 and ≥10 to two significant numbers (e.g. 1,325 = 1,300) and <10 to 1 significant number (e.g. 0.0023=0.002). The presented numbers are estimates that rely on annual surveillance data being corrected for: i) coverage (where applicable); ii) underdiagnosis and underreporting; and iii) under-ascertainment (i.e. being sick without requiring medical help).
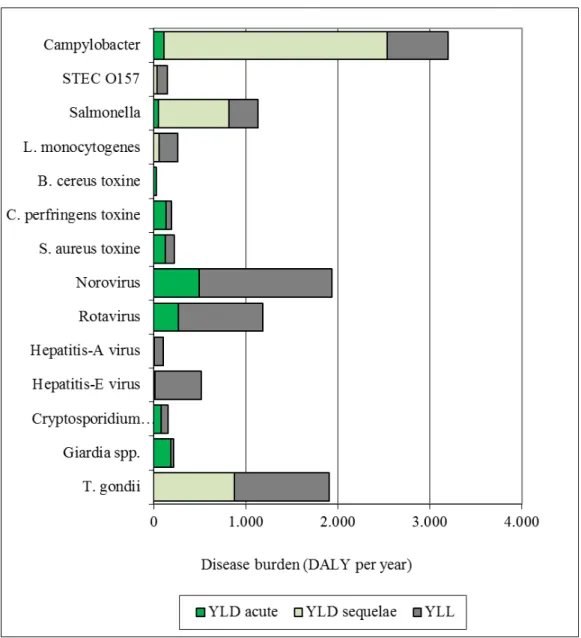
In Figure 2 we show per pathogen the contribution of years lived with disability (YLD) associated with acute infections, YLD associated with
sequelae and years of life lost (YLL) due to premature mortality to total DALY. YLD associated with acute infections contributed 14% to the total disease burden; YLD associated with sequelae/residuals contributed 37% and YLL 49% of the total disease burden. The distribution between the different categories varied between pathogens, see Figure 2 for details.
Figure 2. Mean DALY per year of food-related pathogens in 2018, split up into YLD associated with acute infections; YLD associated with sequelae and YLL.
The mean disease burden by the 14 pathogens for the years 2013-2018 is presented in Figure 3 and in Table A.3 in Annex.
Figure 3. Comparison of disease burden (undiscounted DALYs) of food-related pathogens in 2013-2018
* Since the 2017-update new incidence estimates for hepatitis-E virus, Cryptosporidium spp. and Giardia spp. and new disability weights are used, therefore estimates presented here for 2013-2015 are different from the one presented in earlier publications (i.e. [3-6]).
2.4 Cost-of-illness by pathogen
The total COI in 2018 (425 M€; discounted at 4%) was higher than in 2017 (397 M€) but comparable with 2013-2016 (Table 7, Figures 4-5, and Annex Table A.4). The three pathogens causing the largest COI are norovirus (109 M€), rotavirus (66 M€), Staphylococcus aureus toxin (61 M€), and Campylobacter (60 M€). The lowest contribution to the COI was by hepatitis-A virus (1.5 M€). The most predominated change compared to 2017 was for norovirus (+17 M€). The average cost per case was largest for perinatal Listeria monocytogenes infections (€212,000/case).
Table 7 Estimated mean total costs of illness (COI), mean COI per 100,000 inhabitants and mean COI per case of illness in the Netherlands, 2018
Pathogen COI/year
(M€)* COI per 100,000 (k€)* COI per case (€)*
Discount rate 0% 4% 0% 4% 0% 4% Bacteria – infectious Campylobacter spp. 64 60 375 346 900 840 STEC O157 11 5,6 64 33 5,200 2.700 Salmonella spp. 21 19 120 112 780 730 L. monocytogenes (perinatal) 4.2 1.5 24.5 8.7 601,000 212,000 L. monocytogenes (acquired) 1.9 1.8 11 10 27,000 25,000 L. monocytogenes (total) 6.1 3.3 36 19 78,000 42,000
Bacteria – toxin producing
Bacillus cereus 11 11 65 65 210 210 Clostridium perfringens 29 29 171 171 170 170 Staphylococcus aureus 61 61 356 356 210 210 Viruses Norovirus 109 109 635 635 180 180 Rotavirus 66 66 383 383 290 290 Hepatitis-A virus 1.5 1.5 9 9 1,600 1,600 Hepatitis-E virus 6.0 6.0 35 35 4,600 4,600 Protozoa Cryptosporidium spp. 22 22 129 129 240 240 Giardia spp. 16 16 95 95 200 200 Toxoplasma gondii (congenital) 45 14 260 83 130,000 42,000 Toxoplasma gondii (acquired) 1.2 1.2 6.9 6.8 2,800 2,800 Toxoplasma gondii (total) 46 15 267 90 60,000 20,000 TOTAL 471 426 2,740 2,480
Used abbreviations: million € (M€); *1000 € (k€).
* Total COI per year are presented in million € (M€) and if less than 1 million rounded to 1 significant number (e.g. 0.0023 million =0.002). COI per 100,000 and COI per case are rounded: ≥ 100,000 to three significant numbers (e.g. 123,256 = 123,000 or 123 k€); between <100,000 and ≥10 to two significant numbers (e.g. 1,325 = 1,300 or 1.3 k€). The presented numbers are estimates that rely on annual surveillance data being corrected for: i) coverage (where applicable); ii) underdiagnosis and underreporting; and iii) under-ascertainment (i.e. being sick without requiring medical help).
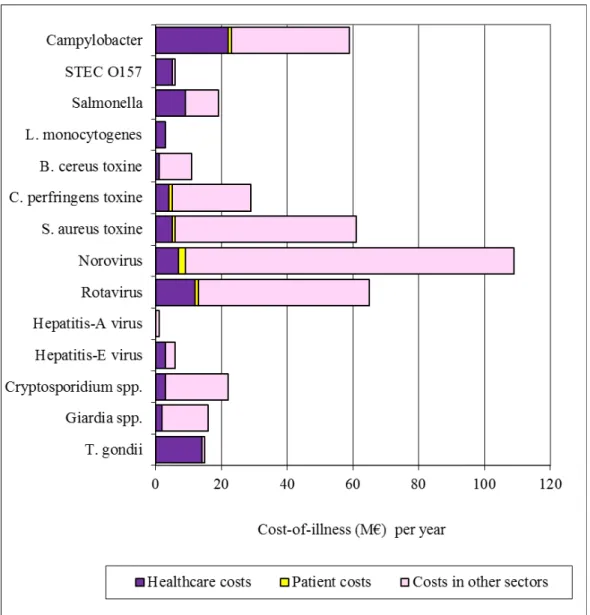
In Figure 4 the mean COI per year was split up in healthcare costs, patient/family costs and costs in other sectors. The latest were mostly productivity losses of patients and caregivers being absent from work. Healthcare costs accounted for 21% of the total costs for the 14 pathogens, patient/family costs for 2% and costs in other sectors accounted for 77%. The distribution between the different cost categories varied between pathogens.
Figure 4. Mean cost-of-illness (discounted) per year of food-related pathogens in 2018, split up into healthcare costs, patient costs and costs in other sectors.
The mean COI estimates per pathogen for the years 2013-2018 is presented in Figure 5 and in Table A.4 in Annex.
Figure 5. Comparison of cost-of-illness (M€, discounted at 4% and expressed in 2017 euros) of food-related pathogens in 2013-2018*
* Since the 2017-update new incidence estimates for hepatitis-E virus, Cryptosporidium spp. and Giardia spp. and new reference prices as well as a shorter friction period are used, therefore estimates presented here for 2013-2015 are different from the one presented in earlier publications (i.e. [3-6]).
2.5 Attribution
The attribution results (expert elicitation) for DALYs and COI of foodborne diseases in 2018 are presented in Table 8 for the main pathways and in Table 9 for the different food groups. More details can be found in the Tables A.5–A.12 in Annex. Foodborne disease burden accounted for 39% of the total burden (i.e. 4,300 DALYs per year), and 40% of the total COI (i.e. 171 M€). About 53% of the foodborne burden
was associated with meat (i.e. poultry, pork, beef & lamb). These foods caused 31% of all food-related cases, indicating that the pathogens associated with these foods are considered to cause more severe infections than pathogens associated with other foods.
The attribution results for incidence, number of fatal cases, DALYs and COI estimates of foodborne diseases for the years 2013-2018 are presented in Tables 10-13. There was an overall increase in foodborne infections from 2017 to 2018. The foodborne disease burden slightly increased by 100 DALYs from 4,200 DALYs in 2017 to 4,300 DALYs in 2018 and the COI increased by 8 M€ from 163 M€ in 2017 to 171 M€ in 2018.
Table 8 Attribution of the mean estimated number of incident cases, fatalities, disease burden and cost-of-illness of foodborne diseasea
to the major transmission pathways in the Netherlands, 2018
Main pathway Food Environment Human Animal Travel Total
Number of incident cases ( per year) b 652,000 204,000 546,000 86,000 140,000 1,630,000
Number of fatal cases (per year) b 76 41 71 20 30 240
Disease burden (DALY, undiscounted)) b 4,300 2,300 2,300 1,100 1,300 11,000 Disease burden (DALY, discounted (1.5%)) b 3,400 1,800 2,100 910 1,100 9,300
Cost of illness (M€, undiscounted) c 195 76 122 33 45 471
Cost of illness (M€, discounted (4%)) c 171 63 121 30 41 426
a) Due to the 14 pathogens included in this study
b) Presented numbers are rounded: ≥ 100,000 to three significant numbers (e.g. 123,256 = 123,000); between <100,000 and ≥10 to two significant numbers (e.g. 1,325 = 1,300) and <10 to 1 significant number (e.g. 0.0023=0.002). The presented numbers are estimates that rely on annual surveillance data being corrected for: i) coverage (where applicable); ii) underdiagnosis and underreporting; and iii) under-ascertainment (i.e. being sick without requiring medical help).
Table 9 Attribution of the mean incidence, fatalities, disease burden and cost-of-illness of foodlborne diseasea to food group in the
Netherlands, 2018
Food groups Beef &
Lamb Pork Poultry Eggs Dairy shellfish Fish& Produce Beverages Grains Other foods Humans & animals
Total Number of incident
cases ( per year) b 108,000 44,000 53,000 21,000 54,000 54,000 39,000 15,000 40,000 120,000 104,000 652,000 Number of fatal cases
(per year) b 8 10 14 4 6 7 6 2 3 5 12 76
Disease burden (DALY,
undiscounted)) b 550 810 920 210 310 310 290 78 120 230 450 4,300
Disease burden (DALY,
discounted (1.5%)) b 410 560 790 180 250 260 230 68 110 200 380 3,400
Cost of illness (M€,
undiscounted)c 30 25 25 7 16 15 12 4 9 27 25 195
Cost of illness (M€,
discounted (4%)) c 25 16 23 7 14 13 11 4 9 26 23 171
a) Due to the 14 pathogens included in this study
b) Presented numbers are rounded: ≥100,000 to three significant numbers (e.g. 123,256 = 123,000); between <100,000 and ≥10 to two significant numbers (e.g. 1,325 = 1,300) and <10 to 1 significant number (e.g. 0.0023=0.002). The presented numbers are estimates that rely on annual surveillance data being corrected for: i) coverage (where applicable); ii) underdiagnosis and underreporting; and iii) under-ascertainment (i.e. being sick without requiring medical help).
Pathogen Incidence/yeara 2013b 2014b 2015b 2016 2017 2018 Campylobacter spp. 42,000 41,000 37,000 33,000 28,000 30,000 STEC O157 860 860 860 860 860 860 Salmonella spp. 15,000 15,000 15,000 18,000 15,000 14,000 Listeria monocytogenes 55 66 50 66 80 54 B. cereus toxine 46,000 46,000 46,000 47,000 47,000 47,000 C. perfringens toxine 153,000 154,000 154,000 154,000 155,000 155,000 S. aureus toxine 253,000 252,000 251,000 250,000 251,000 251,000 Norovirus 99,000 98,000 103,000 128,000 86,000 103,000 Rotavirus 39,000 16,000 34,000 18,000 27,000 29,000 Hepatitis-A virus 61 59 45 45 55 69 Hepatitis-E virus 74 180 260 260 180 180 Cryptosporidium spp. 6,200 6,200 11,000 13,000 8,200 10,900 Giardia spp. 11,000 11,000 11,000 11,000 11,000 11,000 Toxoplasma gondii 430 430 430 430 430 430 Total 665,000 640,000 663,000 673,000 629,000 652,000
a) Presented numbers are rounded: ≥ 100,000 to three significant numbers (e.g. 123,256 = 123,000); between <100,000 and ≥10 to two significant numbers (e.g. 1,325 = 1,300) and <10 to 1 significant number (e.g. 0.0023=0.002). The presented numbers are estimates that rely on annual surveillance data being corrected for: i) coverage (where applicable); ii) underdiagnosis and underreporting; and iii) under-ascertainment (i.e. being sick without requiring medical help).
b) Since the 2017-update new incidence estimates for hepatitis-E virus, Cryptosporidium spp. and Giardia spp. are used, therefore estimates presented here for 2013-2015 are different from the one presented in earlier publications (i.e. [3-6]).
Pathogen Number of fatal cases /year 2013a 2014a 2015a 2016 2017 2018 Campylobacter spp. 32 30 27 24 21 20 STEC O157 2 2 2 2 2 2 Salmonella spp. 16 15 15 18 19 14 Listeria monocytogenes 5 8 11 8 8 4 B. cereus toxine 0 0 0 0 0 0 C. perfringens toxine 4 4 4 4 4 4 S. aureus toxine 6 6 6 6 6 6 Norovirus 10 10 11 14 9 11 Rotavirus 6 3 6 3 5 5 Hepatitis-A virus 0 0 0 0 0 0 Hepatitis-E virus 1 2 3 3 2 2 Cryptosporidium spp. 0 0 1 1 1 1 Giardia spp. 0 0 0 0 0 0 Toxoplasma gondii 7 7 7 7 7 7 Total 90 88 93 90 83 76
a) Since the 2017-update new incidence estimates for hepatitis-E virus, Cryptosporidium spp. and Giardia spp. are used, therefore estimates presented here for 2013-2015 are different from the one presented in earlier publications (i.e. [3-6]).
by pathogen Pathogen DALY(undiscounted)/yeara 2013b 2014b 2015b 2016 2017 2018 Campylobacter spp. 1,900 1,900 1,700 1,500 1,300 1,300 STEC O157 61 61 61 61 61 61 Salmonella spp. 670 650 640 760 680 620 Listeria monocytogenes 68 190 170 310 190 180 B. cereus toxine 28 28 28 28 29 29 C. perfringens toxine 180 180 180 180 180 180 S. aureus toxine 190 190 190 190 190 190 Norovirus 290 280 300 380 270 320 Rotavirus 190 78 170 88 140 150 Hepatitis-A virus 7 6 5 5 6 8 Hepatitis-E virus 30 73 100 100 70 71 Cryptosporidium spp. 11 11 19 22 14 19 Giardia spp. 29 29 29 29 29 28 Toxoplasma gondii 1,100 1,100 1,100 1,100 1,100 1,100 Total 4,700 4,700 4,600 4,700 4,200 4,300
a) Presented numbers are rounded: ≥ 100,000 to three significant numbers (e.g. 123,256 = 123,000); between <100,000 and ≥10 to two significant numbers (e.g. 1,325 = 1,300) and <10 to 1 significant number (e.g. 0.0023=0.002). The presented numbers are estimates that rely on annual surveillance data being corrected for: i) coverage (where applicable); ii) underdiagnosis and underreporting; and iii) under-ascertainment (i.e. being sick without requiring medical help).
b) Since the 2017-update new incidence estimates for hepatitis-E virus, Cryptosporidium spp. and Giardia spp. are used, therefore estimates presented here for 2013-2015 are different from the one presented in earlier publications (i.e. [3-6]).
2018, total and by pathogen
Pathogen COI per year (4%)/yeara
(Million €, expressed in 2018 euros)
2013b 2014b 2015b 2016 2017 2018 Campylobacter spp. 33 33 30 27 23 25 STEC O157 2 2 2 2 2 2 Salmonella spp. 11 10 11 12 11 11 Listeria monocytogenes 2 2 2 2 2 2 B. cereus toxine 9 10 10 10 10 10 C. perfringens toxine 26 26 26 26 26 27 S. aureus toxine 53 53 52 52 52 53 Norovirus 17 17 18 22 15 18 Rotavirus 11 5 9 6 8 9 Hepatitis-A virus 0.1 0.09 0.07 0.07 0.3 0,11 Hepatitis-E virus 0.3 0.8 1 1 0.8 0,8 Cryptosporidium spp. 2 2 3 3 2 3 Giardia spp. 2 2 2 2 2 2 Toxoplasma gondii 9 9 8 8 8 9 Total 177 171 174 173 163 171
a) Total COI per year are presented in million € (M€) and if less than 1 million rounded to 1 significant number (e.g. 0.0023 million =0.002). The presented numbers are estimates that rely on annual surveillance data being corrected for: i) coverage (where applicable); ii) underdiagnosis and underreporting; and iii) under-ascertainment (i.e. being sick without requiring medical help).
b) Since the 2017-update new incidence estimates for hepatitis-E virus, Cryptosporidium spp. and Giardia spp. and new reference prices as well as a shorter friction period are used, therefore estimates presented here for 2013-2015 are different from the one presented in earlier publications (i.e. [3-6]).
3
Discussion
We observed an overall increase in the number of incident cases of the 14 enteric food-related pathogens, especially for norovirus,
Cryptosporidium spp. and rotavirus. However, the overall disease
burden in 2018 was similar to 2017 (11,000 DALYs). This is because the aforementioned pathogens had a relatively low disease burden per case compared with other pathogens that have decreased. The disease burden is still lower than in 2012-2016 (range: 12,000 to 14,000 DALYs). Overall, the proportion of foodborne transmission was about 40%, and at 4,300 DALYs the attributable burden remained similar to 2017 (4,200 DALYs). Both the overall COI and the foodborne-related COI slightly increased in 2018 compared to 2017, but was within the range of 2013-2016. The slight increase of DALYs and COI falls within the range of natural fluctuations observed in disease incidence. A
limitation is that for some of the pathogens, a stable incidence has been assumed due to lack of surveillance data, which may not accurately reflect the current incidence. Therefore, we aim to update the trend information for some of these pathogens in the coming year. Moreover, based on our surveillance data, we estimated the number of incident cases in the general population and visiting the GP using multiplication factors mostly from studies conducted in the late 90s. However, as these might not reflect the current situation they require an update. Lastly, some of the disease models will be updated using novel insights from literature, such as source attribution models on the fraction of human Campylobacter and Salmonella cases that is attributed to the five different major pathways (i.e. food, environment, etc.).
4
References
1. Havelaar, A.H., I.H.M. Friesema, and W. Van Pelt, Disease burden of food-related pathogens in the Netherlands, 2010. 2012, National Institute for Public Health and the Environment: Bilthoven, the Netherlands. p. 3.
2. Bouwknegt, M., et al., Disease burden of food-related pathogens in the Netherlands, 2011. 2013, National Institute for Public Health and the Environment: Bilthoven, the Netherlands. p. 34.
3. Bouwknegt, M., et al., Disease burden of food-related pathogens in the Netherlands, 2012. 2014, National Institute for Public Health and the Environment: Bilthoven, the Netherlands. p. 48.
4. Bouwknegt, M., et al., Disease burden of food-related pathogens in the Netherlands, 2013. 2017, National Institute for Public Health and the Environment: Bilthoven, the Netherlands. p. 40.
5. Bouwknegt, M., et al., Disease burden of food-related pathogens in the Netherlands, 2014. 2017, National Institute for Public Health and the Environment: Bilthoven, the Netherlands. p. 40.
6. Mangen, M.J.J., Disease burden of food-related pathogens in the Netherlands, 2015, in RIVM Letter report 2017-0060. 2017, National Institute for Public Health and the Environment: Bilthoven. p. 42. 7. Mangen, M.J.J., Disease burden of food-related pathogens in the
Netherlands, 2016, in RIVM Letter report 2017-0097 2017, National Institute for Public Health and the Environment: Bilthoven. p. 58. 8. Mangen, M.J.J., Disease burden of food-related pathogens in the
Netherlands, 2017, in RIVM Letter report 2018-0037. 2018, National Institute for Public Health and the Environment: Bilthoven. p. 52. 9. Havelaar, A.H., et al., Disease burden of foodborne pathogens in the
Netherlands, 2009. Int J Food Microbiol, 2012. 156(3): p. 231-8. 10. Haagsma, J.A., et al., Assessing disability weights based on the
responses of 30,660 people from four European countries. Popul Health Metr, 2015. 13: p. 10.
11. WHO methods and data sources for global burden of disease estimates 2000-2011. 2013, World Health Organization (WHO) - Department of Health Statistics and Information Systems: Geneva. 12. Mangen, M.J., et al., Cost-of-illness and disease burden of
food-related pathogens in the Netherlands, 2011. Int J Food Microbiol, 2015. 196: p. 84-93.
13. ZIN, Kostenhandleiding: Methodologie van kostenonderzoek en referentieprijzen voor economische evaluaties in de
gezondheidszorg. 2015, Zorginstituut Nederland (ZIN).
14. ZIN, Richtlijn voor het uitvoeren van economische evaluaties in de gezondheidszorg. 2015, Zorginstituut Nederland (ZIN).
15. Borgen, K., et al., Non-travel related Hepatitis E virus genotype 3 infections in the Netherlands; a case series 2004 - 2006. BMC Infect Dis, 2008. 8: p. 61.
16. Havelaar, A.H., et al., Attribution of foodborne pathogens using structured expert elicitation. Foodborne Pathog Dis, 2008. 5(5): p. 649-59.
5
Annex: Detailed results
Table A.1 – Mean number of incident cases by pathogen in the Netherlands, 2013-2018
Pathogen Estimated mean number of incident cases/yeara
2013 b 2014 b 2015 b 2016 2017 2018 Campylobacter spp. 100,000 98,000 89,000 79,000 67,000 71,000 STEC O157 2,100 2,100 2,100 2,100 2,100 2,100 Salmonella spp. 28,000 28,000 27,00 32,000 27,000 27,000 Listeria monocytogenes 79 96 72 96 115 78 B. cereus toxine 51,000 52,000 52,000 52,000 53,000 53,000 C. perfringens toxine 170,000 170,000 170,000 171,000 171,000 171,000 S. aureus toxine 290,000 288,000 288,000 287,000 287,000 288,000 Norovirus 592,000 585,000 615,000 765,000 515,000 615,000 Rotavirus 297,000 124,000 261,000 138,000 209,000 224,000 Hepatitis-A virus 530 510 390 400 1,800 900 Hepatitis-E virus 540 1,300 1,900 1,900 1,300 1,300 Cryptosporidium spp. 52,000 52,000 92,000 109,000 69,000 91,000 Giardia spp. 85,000 84,000 84,000 83,000 83,000 82,000 Toxoplasma gondii 770 780 770 770 770 770 Total 1,670,000 1,490,000 1,680,000 1,720,000 1,490,000 1,630,000
a) Presented numbers are rounded: ≥ 100,000 to three significant numbers (e.g. 123,256 = 123,000); between <100,000 and ≥10 to two significant numbers (e.g. 1,325 = 1,300) and <10 to 1 significant number (e.g. 0.0023=0.002). The presented numbers are estimates that rely on annual surveillance data being corrected for: i) coverage (where applicable); ii) underdiagnosis and underreporting; and iii) under-ascertainment (i.e. being sick without requiring medical help). There is one exception, Listeria monocytogenes which are acquired through surveillance.
b) Since the 2017-update new incidence estimates for hepatitis-E virus, Cryptosporidium spp. and Giardia spp. are used, therefore estimates presented here for 2013-2015 are different from the one presented in earlier publications (i.e. [3-6]).
Table A.2 – Mean number of fatal cases by pathogen in the Netherlands, 2013-2018
Pathogen Estimated mean number of fatal cases/yeara
2013b 2014b 2015b 2016 2017 2018 Campylobacter spp. 77 72 65 57 49 47 STEC O157 4 4 4 4 4 4 Salmonella spp. 30 28 28 32 34 25 Listeria monocytogenes 7 11 16 12 12 6 B. cereus toxine 0 0 0 0 0 0 C. perfringens toxine 5 5 5 5 5 5 S. aureus toxine 7 7 7 7 7 7 Norovirus 59 60 65 82 56 69 Rotavirus 47 20 43 23 35 38 Hepatitis-A virus 2 2 1 1 6 3 Hepatitis-E virus 6 15 22 21 15 15 Cryptosporidium spp. 3 3 6 7 4 6 Giardia spp. 2 2 2 2 2 2 Toxoplasma gondii 12 12 12 12 12 12 Total 260 240 280 270 240 238
a) Presented numbers are rounded: ≥10 to two significant numbers (e.g. 1,325 = 1,300) and <10 to 1 significant number (e.g. 0.0023=0.002). The presented numbers are estimates that rely on annual surveillance data being corrected for: i) coverage (where applicable); ii) underdiagnosis and underreporting; and iii) under-ascertainment (i.e. being sick without requiring medical help). There is one exception, Listeria monocytogenes which are acquired through surveillance.
b) Since the 2017-update new incidence estimates for hepatitis-E virus, Cryptosporidium spp. and Giardia spp. are used, therefore estimates presented here for 2013-2015 are different from the one presented in earlier publications (i.e. [3-6]).
Table A.3 – Mean estimated disease burden (undiscounted DALY/year) in the Netherlands for the years 2013- 2018, total and by pathogen Pathogen DALY(undiscounted)/yeara 2013b 2014b 2015b 2016 2017 2018 Campylobacter spp. 4,600 4,500 4,000 3,600 3,100 3,200 STEC O157 150 150 150 150 150 150 Salmonella spp. 1,200 1,200 1,200 1,400 1,200 1,100 Listeria monocytogenes 98 280 240 450 280 260 B. cereus toxine 31 31 32 32 32 32 C. perfringens toxine 200 200 200 200 200 200 S. aureus toxine 220 220 220 220 220 220 Norovirus 1,700 1,700 1,800 2,200 1,600 1,900 Rotavirus 1,400 600 1,300 670 1,100 1,200 Hepatitis-A virus 59 57 43 44 200 100 Hepatitis-E virus 210 530 740 740 510 510 Cryptosporidium spp. 92 91 160 190 120 160 Giardia spp. 230 220 220 220 220 220 Toxoplasma gondii 1,900 2,000 1,900 1,900 1,900 1,900 Total 12,000 12,000 12,000 12,000 11,000 11,000
a) Presented numbers are rounded to two significant numbers (e.g. 1,325 = 1,300). The presented numbers are estimates that rely on annual surveillance data being corrected for: i) coverage (where applicable); ii) underdiagnosis and underreporting; and iii) under-ascertainment (i.e. being sick without requiring medical help).
b) Since the 2017-update new incidence estimates for hepatitis-E virus, Cryptosporidium spp. and Giardia spp. and new disability weights are used, therefore estimates presented here for 2013-2015 are different from the one presented in earlier publications (i.e. [3-6]).
Table A.4– Mean discounted COI (4%) in million euros in the Netherlands for 2013-2018, total and by pathogen
Pathogen COI per year (4%)/yeara
(Million €, expressed in 2017 euros)
2013b 2014b 2015b 2016 2017 2018 Campylobacter spp. 80 79 72 65 56 60 STEC O157 6 6 6 6 6 6 Salmonella spp. 20 19 20 22 20 19 Listeria monocytogenes 3 3 3 3 3 3 B. cereus toxine 11 11 11 11 11 11 C. perfringens toxine 29 29 29 29 29 29 S. aureus toxine 62 61 61 61 61 61 Norovirus 105 103 109 134 92 109 Rotavirus 83 41 74 45 62 66 Hepatitis-A virus 0.9 0.8 0.6 0.6 3 1 Hepatitis-E virus 3 6 9 9 6 6 Cryptosporidium spp. 14 14 23 26 17 22 Giardia spp. 17 17 16 16 16 16 Toxoplasma gondii 16 16 15 15 15 15 Total 447 405 447 443 397 426
a) COI per year are presented in million € (M€) and if less than 1 million rounded to 1 significant number (e.g. 0.0023 million =0.002). The presented numbers are estimates that rely on annual surveillance data being corrected for: i) coverage (where applicable); ii) underdiagnosis and
underreporting; and iii) under-ascertainment (i.e. being sick without requiring medical help).
b) Since the 2017-update new incidence estimates for hepatitis-E virus, Cryptosporidium spp. and Giardia spp. and new reference prices as well as a shorter friction period are used, therefore estimates presented here for 2013-2015 are different from the one presented in earlier publications (i.e. [3-6]).
Table A.5 – Attribution of mean estimated number of incident cases by pathogen to main pathways in the Netherlands, 2018 a
Main pathway Food Environment Human Animal Travel Total
Campylobacter spp. 30,000 15,000 4,500 14,000 8,500 71,000 STEC O157 860 360 220 430 250 2,120 Salmonella spp. 14,000 3,400 2,500 2,400 3,700 27,000 Listeria monocytogenes 54 5 4 4 10 80 B. cereus toxine 47,000 580 640 580 3,900 53,000 C. perfringens toxine 155,000 3,800 3,600 3,600 5,500 171,000 S. aureus toxine 251,000 10,000 9,000 6,300 11,000 288,000 Norovirus 103,000 87,000 341,000 31,000 53,000 615,000 Rotavirus 29,000 38,000 130,000 6,700 20,000 224,000 Hepatitis-A virus 69 67 400 0 360 900 Hepatitis-E virus 180 320 98 140 550 1,300 Cryptosporidium spp. 10,900 25,000 25,000 12,200 18,000 91,000 Giardia spp. 11,000 20,000 29,000 8,800 15,000 82,000 Toxoplasma gondii 430 280 7 19 35 770 Total 652,000 204,000 546,000 86,000 140,000 1,630,000
a) Presented numbers are rounded: ≥ 100,000 to three significant numbers (e.g. 123,256 = 123,000); between <100,000 and ≥10 to two significant numbers (e.g. 1,325 = 1,300) and <10 to 1 significant number (e.g. 0.0023=0.002). The presented numbers are estimates that rely on annual surveillance data being corrected for: i) coverage (where applicable); ii) underdiagnosis and underreporting; and iii) under-ascertainment (i.e. being sick without requiring medical help).
Table A.6 – Attribution of mean estimated number of fatal cases to main pathways in the Netherlands, 2018 a
Main pathway Food Environment Human Animal Travel Total
Campylobacter spp. 20 10 3 9 6 47 STEC O157 2 0.7 0.4 0.8 0.5 4 Salmonella spp. 14 3 2 2 4 25 Listeria monocytogenes 4 0.4 0.3 0.3 1 6 B. cereus toxine 0 0 0 0 0 0 C. perfringens toxine 4 0.1 0.1 0.1 0.1 5 S. aureus toxine 6 0.3 0.2 0.2 0.3 7 Norovirus 12 10 38 3 6 69 Rotavirus 5 7 22 1 3 38 Hepatitis-A virus 0.2 0.2 1 0 1.1 3 Hepatitis-E virus 2 4 1 2 6 15 Cryptosporidium spp. 0.7 2 2 0.7 1.1 6 Giardia spp. 0.3 0.5 0.8 0.2 0.4 2 Toxoplasma gondii 7 4 0.1 0.3 0.6 12 Total 76 41 71 20 30 240
a) Presented numbers are rounded: ≥10 to two significant numbers (e.g. 1,325 = 1,300) and <10 to 1 significant number (e.g. 0.0023=0.002). The presented numbers are estimates that rely on annual surveillance data being corrected for: i) coverage (where applicable); ii)
Table A.7 – Attribution of mean disease burden (DALY per year, undiscounted) to main pathways in the Netherlands, 2018a
Main pathway Food Environment Human Animal Travel Total
Campylobacter spp. 1.300 660 200 610 380 3.200 STEC O157 61 26 15 31 18 150 Salmonella spp. 620 150 110 100 160 1.100 Listeria monocytogenes 180 18 14 14 35 260 B. cereus toxine 29 0 0 0 2 32 C. perfringens toxine 180 4 4 4 6 200 S. aureus toxine 190 8 7 5 8 220 Norovirus 320 280 1.070 97 170 1.900 Rotavirus 150 200 690 35 105 1.200 Hepatitis-A virus 8 7 50 0 39 100 Hepatitis-E virus 71 130 39 56 220 510 Cryptosporidium spp. 19 43 43 21 31 160 Giardia spp. 28 52 76 23 39 220 Toxoplasma gondii 1.100 690 17 48 88 1.900 Total 4.300 2.300 2.300 1.100 1.300 11.000
a) Presented numbers are rounded: ≥10 to two significant numbers (e.g. 1,325 = 1,300) and <10 to 1 significant number (e.g. 0.0023=0.002). The presented numbers are estimates that rely on annual surveillance data being corrected for: i) coverage (where applicable); ii)
Table A.8 – Attribution of mean cost-of-illness (M€ per year, discounted at 4% and in 2018 euros) to main pathways in the Netherlands, 2018
Main pathway Food Environment Human Animal Travel Total
Campylobacter spp. 25 12 4 11 7 60 STEC O157 2 1 0.6 1 0.7 6 Salmonella spp. 11 3 2 2 3 19 Listeria monocytogenes 2 0.2 0.2 0.2 0.4 3 B. cereus toxine 10 0.1 0.1 0.1 0.8 11 C. perfringens toxine 27 0.6 0.6 0.6 0.9 29 S. aureus toxine 53 2 2 1 2 61 Norovirus 18 16 60 6 10 109 Rotavirus 9 11 38 2 6 66 Hepatitis-A virus 0.1 0.1 1 0.0 0.6 2 Hepatitis-E virus 0.8 2 0.5 0.6 3 6 Cryptosporidium spp. 3 6 6 3 4 22 Giardia spp. 2 4 6 2 3 16 Toxoplasma gondii 9 6 0.1 0.4 0.7 15 Total 171 63 121 30 42 426
a) COI per year are presented in million € (M€) and if less than 1 million rounded to 1 significant number (e.g. 0.0023 million =0.002). The presented numbers are estimates that rely on annual surveillance data being corrected for: i) coverage (where applicable); ii) underdiagnosis and underreporting; and iii) under-ascertainment (i.e. being sick without requiring medical help).
Table A.9 – Attribution of mean incidence by pathogen to food groups in the Netherlands, 2018a
Food groups Beef &
Lamb Pork Poultry Eggs Dairy shellfish Fish& Produce Beverages Grains Other foods Humans & animals Total Campylobacter spp. 1,200 1,500 16,000 930 2,700 2,100 1,600 510 690 990 1,600 30,000 STEC O157 380 55 27 18 63 25 61 31 25 30 140 860 Salmonella spp. 1,800 2,100 2,100 3,200 950 590 910 450 620 870 820 14,000 Listeria monocytogenes 6 5 4 2 13 10 4 1 3 3 3 54 B. cereus toxine 3,400 1,700 760 1,700 2,700 950 950 800 8,000 25,000 1,100 47,000 C. perfringens toxine 74,000 13,000 11,000 4,300 6,300 10,000 11,000 3,900 4,000 12,000 5,600 155,000 S. aureus toxine 19,000 20,000 20,000 8,300 37,000 15,000 5,000 4,500 19,000 74,000 30,000 251,000 Norovirus 3,300 3,200 3,000 2,000 2,100 16,000 7,500 3,200 5,300 5,100 52,000 103,000 Rotavirus 0 820 0 0 500 5,700 6,900 1,300 2,200 1,300 10,500 29,000 Hepatitis-A virus 0 0 0 0 0 9 9 3 3 2 43 69 Hepatitis-E virus 0 130 0 0 0 9 13 6 0 0 18 180 Cryptosporidium spp. 2,800 480 320 290 1,000 2,400 2,300 330 0 330 660 10,900 Giardia spp. 2,100 510 330 0 830 1,400 3,500 340 0 350 1,300 11,000 Toxoplasma gondii 98 220 21 0 20 16 25 0 0 10 25 430 Total 108,000 44,000 53,000 21,000 54,000 54,000 39,000 15,000 40,000 120,000 104,000 652,000
a) Presented numbers are rounded: ≥ 100,000 to three significant numbers (e.g. 123,256 = 123,000); between <100,000 and ≥10 to two significant numbers (e.g. 1,325 = 1,300) and <10 to 1 significant number (e.g. 0.0023=0.002). The presented numbers are estimates that rely on annual surveillance data being corrected for: i) coverage (where applicable); ii) underdiagnosis and underreporting; and iii) under-ascertainment (i.e. being sick without requiring medical help).
Table A.10 – Attribution of mean number of fatal cases by pathogen to food groups in the Netherlands, 2018a
Food groups Beef
& lamb
Pork Poultry Eggs Dairy Fish
& shellfish
Produce Beverages Grains Other
foods Humans & animals Total Campylobacter spp. 0.8 1 11 0.6 2 1 1 0.3 0.5 0.6 1 20 STEC O157 0.7 0.1 0.1 0.0 0.1 0.0 0.1 0.1 0.0 0.1 0.3 2 Salmonella spp. 2 2 2 3 1 0.6 1 0.4 0.6 1 1 14 Listeria monocytogenes 0.5 0.4 0.3 0.2 1 1 0.3 0.1 0.2 0.2 0.2 4 B. cereus toxine 0.0 0.0 0.0 0.0 0.0 0.0 0.0 0.0 0.0 0.0 0.0 0.0 C. perfringens toxine 2 0.4 0.3 0.1 0.2 0.3 0.3 0.1 0.1 0.3 0.2 4 S. aureus toxine 0.5 0.5 0.5 0.2 0.9 0.4 0.1 0.1 0.5 2 0.7 6 Norovirus 0.4 0.4 0.3 0.2 0.2 2 0.8 0.4 0.6 0.6 6 11 Rotavirus 0.0 0.1 0.0 0.0 0.1 1.0 1 0.2 0.4 0.2 2 5 Hepatitis-A virus 0.0 0.0 0.0 0.0 0.0 0.0 0.0 0.0 0.0 0.0 0.1 0.2 Hepatitis-E virus 0.0 2 0.0 0.0 0.0 0.1 0.2 0.1 0.0 0.0 0.2 2 Cryptosporidium spp. 0.2 0.0 0.0 0.0 0.1 0.1 0.1 0.0 0.0 0.0 0.0 1 Giardia spp. 0.1 0.0 0.0 0.0 0.0 0.0 0.1 0.0 0.0 0.0 0.0 0.3 Toxoplasma gondii 2 3 0.3 0.0 0.3 0.2 0.4 0.0 0.0 0.2 0.4 7 Total 8 10 14 4 6 7 6 2 3 5 12 76
a) Presented numbers are rounded: ≥10 to two significant numbers (e.g. 1,325 = 1,300) and <10 to 1 significant number (e.g. 0.0023=0.002). The presented numbers are estimates that rely on annual surveillance data being corrected for: i) coverage (where applicable); ii)
Table A.11 – Attribution of mean disease burden (DALY per year, undiscounted) by pathogen to food groups in the Netherlands, 2018 a
Food groups Beef &
Lamb Pork Poultry Eggs Dairy shellfish Fish& Produce Beverages Grains Other foods Humans & animals Total Campylobacter spp. 55 69 720 42 120 94 71 23 31 44 71 1,300 STEC O157 27 4 2 1 5 2 4 2 2 2 10 61 Salmonella spp. 78 88 90 140 41 25 39 19 27 37 35 620 Listeria monocytogenes 20 17 12 7 45 32 14 5 11 10 9 180 B. cereus toxine 2 1 0.5 1 2 0.6 0.6 0.5 5 15 0.7 29 C. perfringens toxine 85 15 13 5 7 12 12 4 5 14 6 180 S. aureus toxine 14 16 15 6 28 11 4 3 14 57 23 190 Norovirus 10 10 9 6 6 50 24 10 17 16 160 320 Rotavirus 0 4 0 0 3 30 37 7 12 7 55 150 Hepatitis-A virus 0 0 0 0 0 1.0 1.0 0.3 0.3 0.2 5 8 Hepatitis-E virus 0 52 0 0 0 3 5 2 0 0 7 71 Cryptosporidium spp. 5 0.8 0.5 0.5 2 4 4 0.6 0 0.6 1 19 Giardia spp. 6 1 0.9 0 2 4 9 0.9 0 0.9 3 28 Toxoplasma gondii 240 530 51 0 49 39 62 0 0 24 61 1,100 Total 550 810 920 210 310 310 290 78 120 230 450 4,300
a) Presented numbers are rounded: ≥10 to two significant numbers (e.g. 1,325 = 1,300) and <10 to 1 significant number (e.g. 0.0023=0.002). The presented numbers are estimates that rely on annual surveillance data being corrected for: i) coverage (where applicable); ii)
Table A.12 – Attribution of mean cost-of-illness (M€ per year, discounted at 4% and expressed in 2018 euros) by pathogen to food groups in the Netherlands, 2018a
Food groups Beef &
Lamb Pork Poultry Eggs Dairy shellfish Fish& Produce Beverages Grains Other foods Humans & animals Total Campylobacter spp. 1.0 1 14 0.8 2 2 1 0.4 0.6 0.8 1 25 STEC O157 1.0 0.2 0.07 0.05 0.2 0.07 0.2 0.08 0.07 0.08 0.4 2 Salmonella spp. 1 2 2 2 0.7 0.4 0.7 0.3 0.5 0.6 0.6 11 Listeria monocytogenes 0.3 0.2 0.2 0.09 0.6 0.4 0.2 0.06 0.1 0.1 0.1 2 B. cereus toxine 0.7 0.3 0.2 0.4 0.6 0.2 0.2 0.2 2 5 0.2 10 C. perfringens toxine 13 2 2 0.7 1 2 2 0.7 0.7 2 1.0 27 S. aureus toxine 4 4 4 2 8 3 1 1.0 4 16 6 53 Norovirus 0.6 0.6 0.5 0.3 0.4 3 1 0.6 0.9 0.9 9 18 Rotavirus 0 0.2 0 0 0 2 2 0.4 0.6 0.4 3 9 Hepatitis-A virus 0 0 0 0 0 0.01 0.01 0.005 0.005 0.003 0.07 0.11 Hepatitis-E virus 0 0.6 0 0 0 0.04 0.06 0.03 0 0 0.08 0.8 Cryptosporidium spp. 0.7 0.1 0.1 0.1 0.2 0.6 0.5 0.1 0 0.1 0.16 3 Giardia spp. 0.4 0.1 0.1 0 0.2 0.3 0.7 0.1 0 0.1 0.3 2 Toxoplasma gondii 2 4.3 0.4 0.0 0.4 0.3 0.5 0.0 0 0.2 0.5 9 Total 25 16 23 7 15 13 11 4 9 26 23 171
COI per year are presented in million € (M€) and if less than 1 million rounded to 1 significant number (e.g. 0.0023 million =0.002). The presented numbers are estimates that rely on annual surveillance data being corrected for: i) coverage (where applicable); ii) underdiagnosis and underreporting; and iii) under-ascertainment (i.e. being sick without requiring medical help)