Report 601782030/20010 R. van Herwijnen | C.E. Smit
RIVM Letter report 601782030/2010
Environmental risk limits for boron
R. van Herwijnen C.E. Smit
Contact:
R. van Herwijnen
Expertise Centre for Substances rene.van.herwijnen@rivm.nl
This investigation has been performed by order and for the account of Directorate-General for Environmental Protection, Directorate Environmental Safety and Risk Management, within the framework of the project ‘International and National Environmental Quality Standards for Substances in the Netherlands (INS)’.
© RIVM 2010
Parts of this publication may be reproduced, provided acknowledgement is given to the 'National Institute for Public Health and the Environment', along with the title and year of publication.
Acknowledgements
The results of the present report have been discussed in the scientific advisory group INS (WK-INS). The members of this group are acknowledged for their contribution.
Rapport in het kort
Milieurisicogrenzen voor borium
Dit rapport geeft milieurisicogrenzen voor borium in (grond)water en bodem. Milieurisicogrenzen zijn de technisch-wetenschappelijke advieswaarden voor de uiteindelijke milieukwaliteitsnormen in Nederland. De milieurisicogrenzen voor borium zijn gebaseerd op de uitkomsten van de EU
risicobeoordeling voor borium (Biociden Richtlijn 98/8). De afleiding van de milieurisicogrenzen sluit tevens aan bij de richtlijnen uit de Kaderrichtlijn Water. De nieuwe milieurisicogrenzen voor
oppervlaktewater worden waarschijnlijk niet overschreden in Nederland.
Trefwoorden: milieukwaliteitsnormen; milieurisicogrenzen; borium; maximaal toelaatbaar risiconiveau; verwaarloosbaar risiconiveau
Contents
Summary 9
1 Introduction 11
1.1 Project framework 11
1.2 Production and use of boron 11
1.3 Current standards for boron 12
1.4 European risk assessments for boron 12
2 Methods 13
2.1 Data collection 13
2.2 Methodology for derivation of environmental risk limits 13
3 Derivation of environmental risk limits for boron 15
3.1 Substance identification, physico-chemical properties, fate and human toxicology 15
3.2 Trigger values 17
3.3 Background concentrations 17
3.4 Toxicity data and derivation of ERLs for water 22
3.5 Toxicity data and derivation of ERLs for sediment 23
3.6 Toxicity data and derivation of ERLs for soil 23
3.7 Derivation of ERLs for groundwater 25
3.8 Derivation of ERLs for air 25
3.9 Comparison of derived ERLs with monitoring data 26
4 Conclusions 27
Summary
Environmental risk limits are derived using ecotoxicological, physico-chemical, and human
toxicological data. They represent environmental concentrations of a substance offering different levels of protection to man and ecosystems. It should be noted that the ERLs are scientifically derived values. They serve as advisory values for the Dutch Steering Committee for Substances, which is appointed to set the Environmental Quality Standards (EQSs) from these ERLs. ERLs should thus be considered as preliminary values that do not have any official status.
This report contains ERLs for boron in water, groundwater and soil. The following ERLs are derived for surface water and groundwater: Negligible Concentration (NC), Maximum Permissible
Concentration (MPC), Maximum Acceptable Concentration for ecosystems (MACeco), and Serious
Risk Concentration for ecosystems (SRCeco). A natural background concentration could not be obtained
for soil. For this compartment, ERLs could therefore only be expressed in terms of added
concentrations. No risk limits were derived for the sediment compartment, because of the relatively low sediment-water partition coefficient. For boron, also no risk limits for the air compartment were derived because release of boron to air will be minimal.
Boric acid and related boron compounds are included in Annex I of Directive 98/8/EC, and are authorised for use as an active ingredient in wood preservatives. The risk limits were solely based on data presented in the Competent Authority Report (CAR) that was prepared within the context of the authorisation procedure under 98/8/EC.
For the derivation of the MPC and MACeco for water, the methodology used is in accordance with the
Water Framework Directive. This methodology is based on the Technical Guidance Document on risk assessment for new and existing substances and biocides (European Commission (Joint Research Centre), 2003). For the NC and the SRCeco, the guidance developed for the project ‘International and
National Environmental Quality Standards for Substances in the Netherlands’ was used (Van Vlaardingen and Verbruggen, 2007). An overview of the derived environmental risk limits is given below in Table 1 expressed as additions, and in Table 2 as concentrations including background levels. Monitoring data indicate that the newly derived ERLs for fresh surface water are most likely not exceeded.
Table 1. Derived MPA, NA, MAAeco, and SRAeco values for added boron in water and soil.
Compartment Unit Environmental Risk Limit
MPA NA MAAeco SRAeco
water mg B.L-1 0.18 1.8 x 10⁻³ 0.45 6.8
drinking water mg B.L-1 n.a. n.a. n.a. n.a.
groundwater mg B.L-1 0.18 1.4 x 10⁻² n.a. 6.8
soil mg B.kgdwt-1 0.40 4.0 x 10⁻³ n.a. 10.9
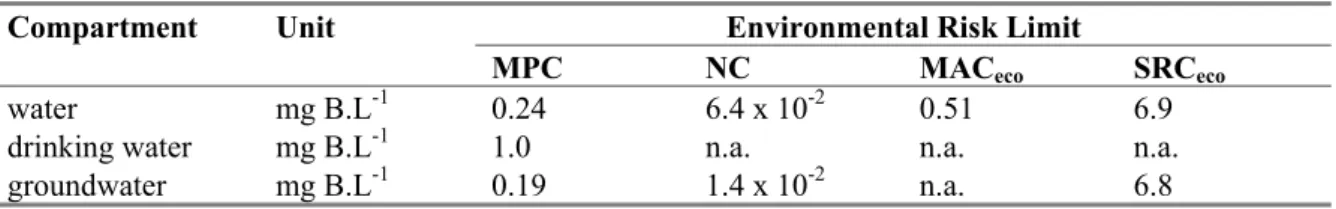
Table 2. Derived MPC, NC, MACeco, and SRCeco values for boron in water, including background levels.
Compartment Unit Environmental Risk Limit
MPC NC MACeco SRCeco
water mg B.L-1 0.24 6.4 x 10⁻² 0.51 6.9
drinking water mg B.L-1 1.0 n.a. n.a. n.a.
1
Introduction
1.1
Project framework
In this report environmental risk limits (ERLs) for surface water (freshwater and marine), soil and groundwater are derived for boron. The risk limits are based on the European risk assessment for the use of several borates as wood preservative under the Biocides Directive 98/8/EC (European Commission, 2008; see 1.4.1). The following ERLs are considered (VROM, 2004):
- Negligible Concentration (NC) – concentration at which effects to ecosystems are expected to be negligible and functional properties of ecosystems must be safeguarded fully. It defines a safety margin which should exclude combination toxicity. The NC is derived by dividing the MPC (see next bullet) by a factor of 100.
- Maximum Permissible Concentration (MPC) – concentration in an environmental
compartment at which:
1 no effect to be rated as negative is to be expected for ecosystems;
2a no effect to be rated as negative is to be expected for humans (for non-carcinogenic substances);
2b for humans no more than a probability of 10-6 over the whole life (one additional cancer incident in 106 persons taking up the substance concerned for 70 years) can be calculated (for carcinogenic substances) (Lepper, 2005).
- Maximum Acceptable Concentration (MACeco) – concentration protecting aquatic ecosystems
for effects due to short-term exposure or concentration peaks.
- Serious Risk Concentration (SRCeco) – concentration at which serious negative effects in an
ecosystem may occur.
It should be noted that ERLs are scientifically derived values, based on (eco)toxicological, fate and physico-chemical data. They serve as advisory values for the Dutch Steering Committee for Substances, which is appointed to set the Environmental Quality Standards (EQSs) from these ERLs. ERLs should thus be considered as preliminary values that do not have any official status.
1.2
Production and use of boron
Borates are intended to be used as a preventive and curative wood preservative for wood and construction timbers. Other uses are for human and veterinary hygiene, in disinfectants, in preservatives and in insecticides. No information is available on production volume and potential quantity of use.
1.3
Current standards for boron
The current freshwater standard for boron is 0.65 mg/L, originating from Van de Plassche et al. (1999). This value refers to a concentration that may be added to the natural background concentration (see 2.2.1). There are no officially established values for background concentrations of boron in the Netherlands.
1.4
European risk assessments for boron
1.4.1
Biocides risk assessment
The European risk assessment for the use of several borates as wood preservative under the Biocides Directive 98/8/EC was finalised in 2008 (European Commission, 2008). The Netherlands acted as Rapporteur Member State. Competent Authority Reports (CAR) were prepared for boric acid, diboron trioxide, disodium tetraborate and disodium octaborate tetraborate. The toxicity data on boron involve a range of different boron compounds such as boric acid (H3BO3), anhydrous sodium tetraborate
(Na2B4O7), and hydrated sodium tetraborates (Na2B4O7.xH2O). Since all naturally occurring forms of
boron are oxidised and are present as the boric acid species at the typically found (usual) environmental concentrations and acidity, boric acid was used as a model substance for risk assessment. Considering the fact that boron is the element that is relevant from an (eco)toxicological point of view, all endpoints were converted to concentrations of elemental boron (B).
1.4.2
Future developments
At the SETAC Conference in Götenborg, May 2009, an effects assessment for boron was presented by the Austrian Federal Environment Agency (Schoderboeck et al., 2009). This work was based on the data gathered under the former Existing Substances Regulation (793/93/EEC). A first draft risk assessment report (RAR) dating from October 20071 includes the draft biocides CAR of 2006, but the
process was discontinued waiting for further developments under REACH (Registration, Evaluation, Authorisation and Restriction of Chemicals; European Commission, 2006). A representative of the notifier of the boron biocides dossier, present at the conference, provided information that boron is pre-registered under REACH and that a full dossier will be submitted within the near future. This dossier will probably be evaluated by Austria, as a follow-up of the RAR. Based on the (new) information submitted under REACH, member states may supplement and/or update the data for boric acid as prepared within the context of the Biocides Directive 98/8/EC, in order to derive a PNEC for biocide authorisation. An update of the ERLs as derived in the present report may then also be considered.
1
2
Methods
2.1
Data collection
The final Competent Authority Report (CAR) of boric acid (European Commission, 2008) produced to enable a decision to be made on the inclusion of boric acid in Annex I of Directive 98/8/EC was used as only source of physico-chemical and (eco)toxicity data. Information given in the CARs is checked thoroughly by European Union member states and afterwards approved by the Technical Meeting. Therefore, no additional evaluation of data is performed for the ERL derivation. Only valid data combined in an aggregated data table are presented in the current report. Occasionally, key studies are discussed when relevant for the derivation of a certain ERL.
In the aggregated data table only one effect value per species is presented. When for a species several effect data are available, the geometric mean of multiple values for the same endpoint is calculated where possible. Subsequently, when several endpoints are available for one species, the lowest of these endpoints (per species) is reported in the aggregated data table.
2.2
Methodology for derivation of environmental risk limits
The methodology for data selection and ERL derivation is described in Van Vlaardingen and Verbruggen (2007) which is in accordance with Lepper (2005). Some specific issues are discussed below.
2.2.1
Dealing with background concentrations
Since boron is a natural element, and so is boric acid, the added risk approach is applied in the CAR. In this approach, the specific ERLs as described below are the sum of the calculated addition and the background concentration Cb. The following formulas apply:
NC = Cb + NA; MPC = Cb + MPA; MACeco = Cb + MAAeco; SRCeco = Cb + SRAeco
where Cb = background concentration and NA, MPA, MAAeco and SRAeco are the equivalents of NC,
MPC, MACeco and SRCeco (see 1.1) in terms of added concentrations. The background value and MPA
(and NA, SRA) are independently derived values. With respect to ecotoxicity, it is assumed that any background concentration, either in laboratory tests or in the environment, does not have a negative impact on ecosystem health. The MPA and related risk limits are calculated using a similar approach as for substances having no natural background concentration, except for drinking water. The MPCdw is
always based on total concentrations in water and the background is always part of the MPCdw. Further
information on background concentrations of boron is presented in section 3.3.
2.2.2
Boron essentiality
Boron is a naturally occurring element that is essential to a variety of organisms. In plants, it is necessary for a variety of metabolic processes (e.g. nitrogen metabolism, nucleic acid metabolism and membrane integrity and stability). A beneficial effect to fish at low concentrations was shown for some fish species (Raymond and Butterwick, 1992). Evidence exists that it is essential for nitrogen fixation in some species of algae, fungi and bacteria, although that was questioned by others (Maier and Knight, 1991). The concentration-response curve for boron may be U-shaped, with adverse effects at very low
and very high concentrations, while no adverse effects are observed at the intermediate concentrations (Loewengart, 2001). Required levels may vary, especially among plants, such that essential levels for one species may be toxic to another (Eisler, 1990).
While evaluating the ecotoxicity data for the CAR, special attention was paid to this phenomenon and endpoints were only used when it was clear the observed effects were due to toxicity rather than to deficiency.
2.2.3
Drinking water abstraction
The INS-Guidance includes the MPC for surface waters intended for the abstraction of drinking water
(MPCdw, water) as one of the MPCs from which the lowest value should be selected as the general
MPCwater (see INS-Guidance, section 3.1.6 and 3.1.7). According to the proposal for the daughter
directive Priority Substances, however, the derivation of the AA-EQS (= MPC) should be based on direct exposure, secondary poisoning, and human exposure due to the consumption of fish. Drinking water was not included in the proposal and is thus not guiding for the general MPCwater value. The
MPCdw, water is therefore presented as a separate value in this report.
The MPCdw, water is also used to derive the MPCgw. For the derivation of the MPCdw, water, a substance
specific removal efficiency related to simple water treatment may be needed. Because there is no agreement as yet on how the removal fraction should be calculated, water treatment is not taken into account.
3
Derivation of environmental risk limits for boron
3.1
Substance identification, physico-chemical properties, fate and human
toxicology
3.1.1
Identity
Boric acid is one of the natural forms of boron. The boron ion itself does not exist in the environment and all naturally occurring forms of boron are present as boric acid species. Boric acid is used as model substance for risk assessment in the CAR and therefore only the physico chemical properties for boric acid are given unless stated otherwise.
Table 3. Identification of boric acid.
Parameter Name or number
Chemical name orthoboric acid
Common/trivial/other name boric acid
CAS number 10043-35-3 (natural boric acida : 11113-50-1)
EC number 233-139-2 (natural boric acida: 234-343-4)
Structural formula B OH O H O H Molecular formula: H3BO3
Smiles code OB(O)O
a: natural boric acid is not assessed in the CAR.
3.1.2
Physico-chemical properties
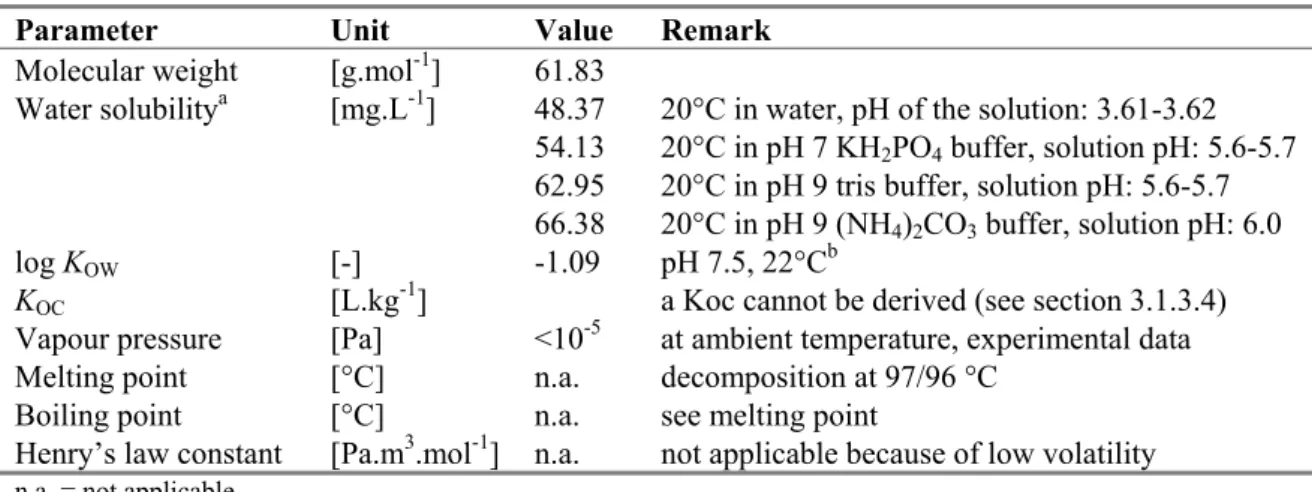
Table 4. Physico-chemical properties of boric acid.
Parameter Unit Value Remark
Molecular weight [g.mol-1] 61.83
Water solubilitya [mg.L-1] 48.37 20°C in water, pH of the solution: 3.61-3.62
54.13 20°C in pH 7 KH2PO4 buffer, solution pH: 5.6-5.7
62.95 20°C in pH 9 tris buffer, solution pH: 5.6-5.7 66.38 20°C in pH 9 (NH4)2CO3 buffer, solution pH: 6.0
log KOW [-] -1.09 pH 7.5, 22°Cb
KOC [L.kg-1] a Koc cannot be derived (see section 3.1.3.4)
Vapour pressure [Pa] <10-5 at ambient temperature, experimental data
Melting point [°C] n.a. decomposition at 97/96 °C
Boiling point [°C] n.a. see melting point
Henry’s law constant [Pa.m3.mol-1] n.a. not applicable because of low volatility
n.a. = not applicable.
a: Water solubility studies at higher pH are not possible, because of the strong buffering capacity of boric acid solutions and ion-pair formation in the presence of alkali-metal ions like sodium and potassium.
b: in a B(OH)3-NaB(OH)4 or B(OH)3-KB(OH)4 system, undissociated boric acid is the only compound extracted into octanol. More values are reported in the CAR but these are for unknown pHs. The difference between log Kow values obtained at different temperatures, different salinity, different concentration and different analysis, is only 0.5 log Kow unit.
3.1.3
Behaviour in the environment
3.1.3.1 Biodegradation
Boron is an inorganic compound and therefore biodegradation is not a relevant pathway.
3.1.3.2 Hydrolysis
Boric acid does not have any chemical bonds prone to hydrolysis. Hydrolysis is therefore not a relevant degradation pathway under environmentally relevant conditions.
3.1.3.3 Photolysis in water
Boric acid is an inorganic compound without any light absorption characteristics in dilute solutions. It is therefore unlikely that the concentration of boric acid in water is influenced by light. Boric acid is therefore considered to be resistant to photochemical degradation.
3.1.3.4 Sorption
In the CAR a Kpsoil/solution for boron of 2.6 L/kg is used in the calculations. This Kp is derived from
Freundlich sorption coefficients (= KF from the equation Csoil = KF x (Csolution^ (1/n)); Kp = KF when
the soil:solution ratio >0.3 and 0.7 < 1/n < 1.1). The Kp is not transformed into a Koc because sorption
of boron is highly variable. This is explained by the fact that KF significantly correlates with not only
organic carbon content but also with the clay content, cation exchange capacity, specific surface area and conductivity of the equilibrium solution. It is presumed that the Kp of 2.6 L/kg is also valid for suspended matter.
3.1.4
Bioconcentration and biomagnification
An overview of the bioaccumulation data for boron, is given in Table 5.
Table 5. Overview of bioaccumulation data for boron.
Parameter Unit Value Remark
BCF (fish) [L.kg-1] 0.3 see below
BCF (pacific oyster) [L.kg-1] 1-1.5 see below
BMF [kg.kg-1] 1 Default value since the BCF is < 2000 L.kg-1.
The value of 0.3 L.kg-1 was determined by Suloway et al. (1983), who exposed fathead minnow (Pimephales promelas) and green sunfish (Lepomis cyanella) to components of coal fly ash extract containing boron at concentrations ranging from 1.23 to 91.7 mg.L-1. The BCF of 1-1.5 L.kg-1 for the pacific oyster (Crassostrea gigas) was determined in a flow-through experiment at boron
concentrations of 1 µg.L-1 and 10 µg.L-1 on top of the background. Field data from the Lower San Joaquin River (California, United States) and its tributaries as reported in the CAR indicate that the BAF is < 10 L/kg for fish and < 30 L/kg for plankton and invertebrates.
3.1.5
Human toxicological threshold limits and carcinogenicity
In the CAR the proposed classification according to the 25th ATP of Directive 67/548/EEC is:
T, R60, R61 and reproduction category 2. In the CAR a TDI of 0.096 mg B.kgbw-1.d-1 is derived from a
3.2
Trigger values
This section reports on the trigger values for ERLwater derivation (as demanded in WFD framework). Table 6. Boron/boric acid: collected properties for comparison to MPC triggers.
Parameter Value Unit Method/Source
Log Kp,susp-water 0.4 [-] Kp, susp-water = Kpsuspa
BAF 10 [L.kg-1] worst case value
BMF 1 [kg.kg-1]
Log KOW -1.09 [-] for boric acid
R-phrases 60, 61 [-]
A1 value 1.0 [mg B.L-1]
DW standardb 1.0 [mg B.L-1]
a Since the sorption of boron is controlled by more than the organic carbon content, conversion to standard suspended matter on the basis of organic carbon is not realistic and Kp, susp-water can be set equal to Kpsusp.
b Expressed in elemental boron.
o Boron has a log Kp, susp-water < 3; derivation of MPCsediment is not triggered.
o Boron has a log Kp, susp-water < 3; expression of the MPCwater as MPCsusp, water is not required.
o Boron has a BCF < 100 L.kg-1; assessment of secondary poisoning is not triggered.
o Boron has been proposed an R60/61 classification. Therefore, an MPCwater for human health via
food (fish) consumption (MPChh food, water) should be derived.
3.3
Background concentrations
The information on background concentrations from the CAR is presented here, together with additional data from more recent sources.
3.3.1
Freshwater
According to Butterwick et al. (1989) boron concentrations in freshwater systems rarely exceed 1.0 mg B.L-1 and are usually < 0.1 mg B.L-1. For the United States, Parks and Edwards (2005) report a
nationwide average boron concentration in freshwater of 0.076 mg B.L-1. In a review of European
monitoring data, Wyness et al. (2003) report ranges of < 0.001 to 7.5 mg B.L-1, the mean 95-percentile concentration over 15 European countries ranges from 0.017 mg B.L-1 in the United Kingdom to 0.632 mg B.L-1 in Germany. In seven countries, the European drinking water standard of 1.0 mg B.L-1 is exceeded in 0.004 to 11.6% of the cases. The data are presented in detail in Table 7.
The data for the Netherlands refer to nine monitoring points in the river Rhine and Meuse catchments. Generally, the concentration of boron in the river Rhine has varied between 0.05 and 0.15 mg B.L-1, and between 0.04 and 0.2 mg B.L-1 in the river Meuse (Wyness et al., 2003). It can be assumed that
these values should not be considered as natural background, since influence of industrial and/or agricultural sources can be expected for these rivers.
Table 7
. Boron conce
ntra
tions in the European
Union, copied fr om Wyness et al . (20 03 ) RIVM Letter r ep ort 601782030
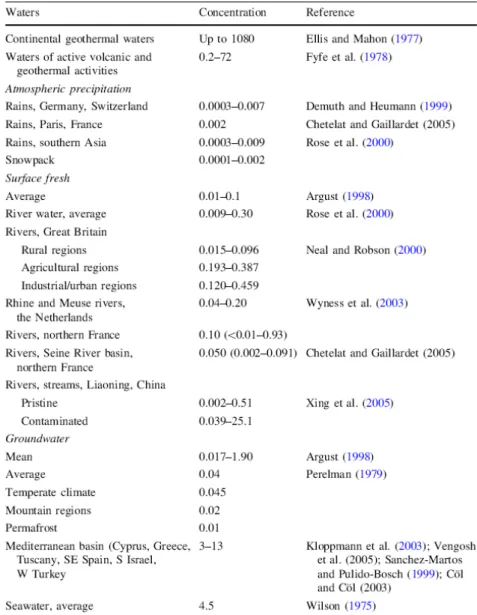
Kot (2009) also gives an overview of boron concentrations in water (see Table 8). It appears that the mean 95th percentile of 0.218 mg B.L-1 as reported by Wyness et al. (2003) for the Rhine and Meuse rivers (see Table 7) is similar to the lower range found in agricultural regions in the United Kingdom (0.193 mg.L-1) and only two times higher than the upper levels found in rural regions in the UK (0.096 mg.L-1). The upper range given for pristine waters in China of 0.51 mg.L-1 is even about 2.5 times higher than the 95th percentile for the rivers Rhine and Meuse. This might be interpreted as an
indication that the Rhine and Meuse rivers are not so much influenced by human activities, but it is much more likely that there are large differences between countries and/or regions as to what can be considered as natural background levels.
Table 8. Boron concentrations in natural and contaminated waters, copy from Table 4 in Kot (2009)
To gain more insight in the levels of boron that may be considered as background for the Netherlands, the database with monitoring information from Dutch Ministry of Transport, Public Works and Water Management (www.waterbase.nl) was consulted (date of search 17 July 2009). Data for boron in filtered and unfiltered samples are present as from 1978, but it appears that boron concentrations
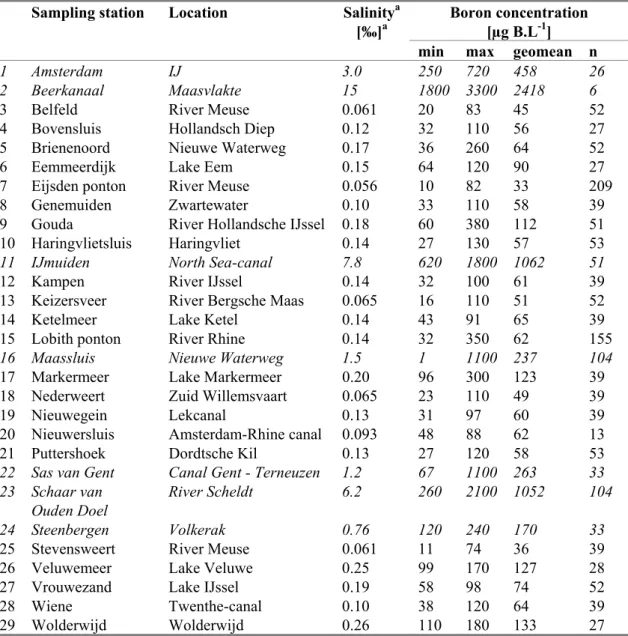
represents total concentrations (see INS-guidance, section 3.1.7.1, point 2), and therefore the data for unfiltered samples were used. For 2005-2008, data are present for 29 locations. An overview of minimum, maximum and geometric mean values per sampling station is given in Table 9 below. Most sampling locations are located large waterbodies or canals, either located in urbanised areas or in regions with a high agricultural activity, and are thus not the type of locations one would refer to as typical for determining the natural background. Since seawater contains much higher boron levels than freshwater, this may influence the measured boron concentrations. Therefore, salinity data are also reported. Locations with a salinity > 0.5 ‰ are considered as brackish or saline and indicated in italics.
Table 9. Total boron concentrations in unfiltered samples over 2005-2008, extracted from www.waterbase.nl. Locations with salinity > 0.5 ‰ are indicated in italics.
Sampling station Location Salinitya
[‰]a Boron concentration [µg B.L-1]
min max geomean n
1 Amsterdam IJ 3.0 250 720 458 26
2 Beerkanaal Maasvlakte 15 1800 3300 2418 6
3 Belfeld River Meuse 0.061 20 83 45 52
4 Bovensluis Hollandsch Diep 0.12 32 110 56 27
5 Brienenoord Nieuwe Waterweg 0.17 36 260 64 52
6 Eemmeerdijk Lake Eem 0.15 64 120 90 27
7 Eijsden ponton River Meuse 0.056 10 82 33 209
8 Genemuiden Zwartewater 0.10 33 110 58 39
9 Gouda River Hollandsche IJssel 0.18 60 380 112 51
10 Haringvlietsluis Haringvliet 0.14 27 130 57 53
11 IJmuiden North Sea-canal 7.8 620 1800 1062 51
12 Kampen River IJssel 0.14 32 100 61 39
13 Keizersveer River Bergsche Maas 0.065 16 110 51 52
14 Ketelmeer Lake Ketel 0.14 43 91 65 39
15 Lobith ponton River Rhine 0.14 32 350 62 155
16 Maassluis Nieuwe Waterweg 1.5 1 1100 237 104
17 Markermeer Lake Markermeer 0.20 96 300 123 39
18 Nederweert Zuid Willemsvaart 0.065 23 110 49 39
19 Nieuwegein Lekcanal 0.13 31 97 60 39
20 Nieuwersluis Amsterdam-Rhine canal 0.093 48 88 62 13
21 Puttershoek Dordtsche Kil 0.13 27 120 58 53
22 Sas van Gent Canal Gent - Terneuzen 1.2 67 1100 263 33
23 Schaar van
Ouden Doel
River Scheldt 6.2 260 2100 1052 104
24 Steenbergen Volkerak 0.76 120 240 170 33
25 Stevensweert River Meuse 0.061 11 74 36 39
26 Veluwemeer Lake Veluwe 0.25 99 170 127 28
27 Vrouwezand Lake IJssel 0.19 58 98 74 52
28 Wiene Twenthe-canal 0.10 38 120 64 39
29 Wolderwijd Wolderwijd 0.26 110 180 133 27
a: based on geometric mean Cl--values for 2008; converted to ‰ according to section 2.2.3.11 of the INS-guidance; Cl- data provided by Helpdesk Water on 24 and 30 July, 2009.
The high salinity of the IJ in Amsterdam is most likely due to seepage. At some freshwater locations, such as Lake Markermeer and Lake Veluwe, relatively high boron levels are measured. It is not known to what extent local inputs of boron from industrial activities or agriculture play a role. Therefore, it is considered most appropriate to use the median of the geometric mean values of the non-saline sampling
points (salinity ≤ 0.5 ‰), which is 62 µg.L-1 (0.062 mg B.L-1), as a background concentration for the purpose of standard setting. It is recognised that this may not represent a true “natural” background, but in the absence of other data it is considered to be an acceptable estimate.
3.3.2
Marine waters
Raymond and Butterwick (1992) state that oceans have a natural level of boron of about 5 mg B.L-1.
Kot (2009) cites a level of 4.5 mg B.L-1 (see Table 8). The data for the Maasvlakte, which is partly
influenced by freshwater input via the Nieuwe Waterweg (see Table 9), indicate that for the Dutch marine environment similar levels may be expected. However, data are scarce, and since no marine ERLs are derived (see below, section 3.4.1), deciding on a natural background level for marine waters is not necessary at this stage.
3.3.3
Soil
Boron concentrations in soil are highly variable, Eisler (1990) reports a range of 4 to 200 mg B.kg-1, mostly as unavailable earth mineral (tourmaline) and a usual level of 45-124 mg B.kgdwt-1. In the
Environmental Health Criteria on boron (WHO, 1998), a range of 10 – 300 mg B.kg-1 is reported with an average background concentration of about 30 mg B.kg-1. Since the data are rather outdated and no specific information is available for the Netherlands, it is not considered justified to set a single natural background level for Dutch soil at this stage.
3.3.4
Groundwater
Boron levels in European groundwaters are presented in the WHO report of 1998. For the Netherlands, concentrations range from 0.08 to 0.6 mg B.L-1. According to Weinthal et al. (2005), groundwater concentrations are most likely influenced by anthropogenic sources. They mention domestic sewage as one of the potential sources, probably because of the addition of boron to detergents. According to the WHO, the close similarity of boron concentrations in groundwater, fresh surface water, and drinking water indicates that boron is not removed in the treatment of groundwater and fresh surface water used for drinking water. The reported groundwater concentrations of 0.08 to 0.6 mg B.L-1 for the
Netherlands as reported by the WHO seem to be rather high in view of the more recent values for surface water as presented in section 3.3.1. This suggests that the WHO-data refer to contaminated groundwater rather than to natural background levels, and the values should thus not be used as such.. For natural springs (“sprengen”) sampled in 1996 at the Veluwe in the Netherlands, Meinardi et al. (2003) report an average boron concentration of 3.3 µg.L-1 for 12 sites with pH > 6. These springs relate to deep groundwater, that has entered the soil before 1945. From this, they calculate a so-called “basic value” for fresh groundwater of 7.0 µg.L-1, which according to their conclusions can be regarded as the natural background concentration for that particular area. Boron was only measured in the Veluwe springs, while for other elements also data from the national and provincial groundwater surveys were available. For those elements that can be compared, concentrations in the Veluwe springs are generally a factor of two lower than those obtained for groundwater, which has entered more recently. This can be explained by the difference in landscape characteristics of the Veluwe at the time the spring water entered the soil, and the current landscape in the rest of the Netherlands. This indicates that the value of 7.0 µg.L-1 is most likely not representative for groundwater in general.
The observation that the concentrations in the Veluwe springs are lower than average is confirmed by data from the groundwater monitoring network over 1997 (“Landelijk Meetnet Grondwater”; by courtesy of Herman Prins, RIVM). Data include saline, brackish, and fresh groundwater from several soil type uses (forest, agricultural land, residential areas etc.). Boron concentrations in forest
groundwater range from 3.2 to 112 µg B.L-1 (n=35; freshwater only), with a median value of 12 µg.L-1 and geometric mean of 14 µg.L-1.
3.4
Toxicity data and derivation of ERLs for water
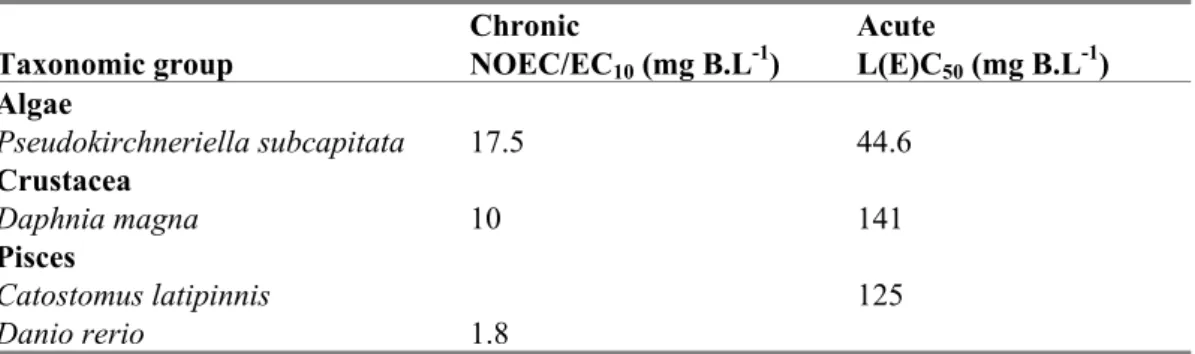
An overview of the selected freshwater toxicity data for boric acid species as reported in the CAR is given in Table 10. More studies are presented in the CAR. These additional studies were not submitted as part of the dossier, and have not been evaluated in the CAR. Because they would not result in a lower PNEC, they were eventually not used for derivation of the PNEC. Therefore, these studies are not reported in Table 10. Marine toxicity data are not reported in the CAR.
Table 10. Boron: selected freshwater toxicity data for ERL derivation expressed in elemental boron.
Chronic Acute
Taxonomic group NOEC/EC10 (mg B.L-1) L(E)C50 (mg B.L-1) Algae Pseudokirchneriella subcapitata 17.5 44.6 Crustacea Daphnia magna 10 141 Pisces Catostomus latipinnis 125 Danio rerio 1.8
3.4.1
Treatment of fresh- and saltwater toxicity data
No marine toxicity data are presented in the CAR, and a PNECmarine is not derived. Boron is a metalloid
and in the INS-guidance no specific instructions are given on metalloids. According to Kot (2009), boron has many similarities to carbon and silicon and it can be present in many forms. It is not known whether or not the environmental behaviour of boron should be considered as being comparable to metals. Background concentrations of boron in marine water are much higher than in freshwater (see section 3.3.2), and it is expected that this somehow influences the sensitivity. In view of the above, ERLs for the marine environment are not derived.
3.4.2
Mesocosm studies
No mesocosm studies are reported in the CAR.
3.4.3
Derivation of MPC
water3.4.3.1 MPAeco, water and MPCeco, water
In the CAR a PNECadd, water of 0.18 mg B.L-1 is derived for elemental boron using an assessment factor
of 10. The MPAeco, water is set equal to the PNECadd, water: 0.18 mg B.L-1. Addition of the background
value of 0.062 mg B.L-1 results in an MPCeco, water of 0.24 mg B.L-1. 3.4.3.2 MPCsp, water
Boron has a BCF < 100 L.kg-1, thus assessment of secondary poisoning is not triggered. 3.4.3.3 MPChh food, water
Derivation of MPChh food, water is performed according to the method described in Van Vlaardingen and
Verbruggen (2007). For this calculation the TDI of 0.096 mg B.kgbw-1.d-1 is used together with the
maximum BAF of 10 L.kg-1 for fish (see section 3.1.4). The latter replaces the BCF x BMF in equation
16 of the INS-guidance. Since the added-risk approach is not applied for the derivation of the human-toxicological threshold value and the BAF also includes background levels of boron, the calculations
refer to total concentrations, including the background. The MPChh, food = 0.1 * 0.096*70/0.115 = 5.8
mg B.kgfood-1. The resulting MPChh food, water is then 5.8 / (10) = 0.58 mg B.L-1.
3.4.4
Selection of the MPC
waterThe lowest value available is the MPCeco, water. The MPCwater is 0.24 mg B.L-1.
3.4.5
Derivation of MPC
dw, waterA1 and DW standards are available for boron both of 1.0 mg B.L-1. According the INS guidance this value should be used to calculate the MPCdw, water. As described in section 2.2 water treatment is
currently not taken into account. Also the added risk approach does not apply for the MPCdw, water.
Therefore the MPCdw, water is equal to the drinking water guideline value and becomes: 1.0 mg B.L-1.
3.4.6
Derivation of MAA
eco, waterand MAC
eco, waterThe MAAeco is based on the lowest L(E)C50. This is the algae Pseudokirchneriella subcapitata with an
L(E)C50 of 44.6 mg B.L-1 (see Table 7). An assessment factor of 100 is applied since boron has no potential to bioaccumulate. This sets the MAAeco, water to 0.45 mg B.L-1, addition of the background of
0.062 mg B.L-1, results in a MACeco, water of 0.51 mg B.L-1.
3.4.7
Derivation of NA
waterand NC
waterThe NAwater is set a factor of 100 lower than the MPAeco, water: 1.8 x 10⁻³ mg B.L-1. Addition of the
background concentration of 0.062 mg B.L-1 results in a NCwater of 6.4 x 10⁻² mg B.L-1.
3.4.8
Derivation of SRA
eco, waterand SRC
eco, waterFor derivation of the SRAeco, aquatic both chronic and acute data are available as presented in Table 10.
The geometric mean of the acute values divided by 10 (9.2 mg B.L-1) is higher than the geometric mean
of the chronic values (6.8 mg B.L-1). Therefore the SRAeco, aquatic is the geometric mean of all chronic
values with an assessment factor of 1: 6.8/1 = 6.8 mg B.L-1. Addition of the background concentration of 0.062 mg B.L-1 results in a SRCeco, aquatic of 6.9 mg B.L-1. In view of the uncertainty related to
behaviour, toxicity and background concentrations in marine waters, the SRCeco, aquatic is only valid for
the freshwater environment.
3.5
Toxicity data and derivation of ERLs for sediment
The log Kp, susp-water of boron is below the trigger value of 3, according to the INS guidance (Van
Vlaardingen en Verbruggen 2007), ERLs need not be derived for sediment. However in the CAR a
PNECadd, sed is derived of 0.24 mg B.kgwwt-1, based on equilibrium partitioning. Since derivation of
ERLs for sediment is not triggered, this ERL is not taken over in this report.
3.6
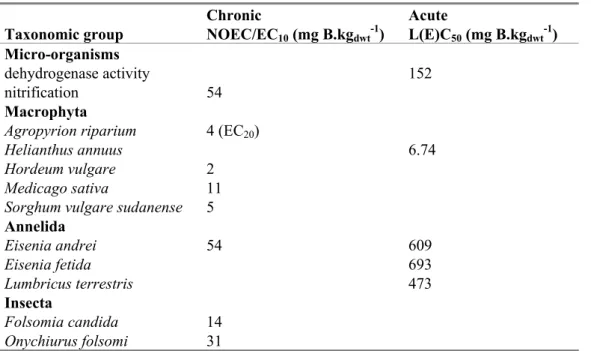
Toxicity data and derivation of ERLs for soil
Table 11. Boron: selected soil toxicity data for ERL derivation expressed in elemental boron.
Chronic Acute
Taxonomic group NOEC/EC10 (mg B.kgdwt-1) L(E)C50 (mg B.kgdwt-1) Micro-organisms
dehydrogenase activity 152
nitrification 54
Macrophyta
Agropyrion riparium 4 (EC20)
Helianthus annuus 6.74
Hordeum vulgare 2
Medicago sativa 11
Sorghum vulgare sudanense 5
Annelida Eisenia andrei 54 609 Eisenia fetida 693 Lumbricus terrestris 473 Insecta Folsomia candida 14 Onychiurus folsomi 31
3.6.1
Derivation of MPA
soilBecause a natural background concentration for soil cannot be established (see section 3.3.3), it is not possible to derive an MPCsoil, and only the MPAsoil can be derived.
3.6.1.1 MPAeco, soil
In the CAR a PNECadd, terrestrial of 0.4 mg B.kgdwt-1 is derived. This PNEC is based on de chronic NOEC
for Hordeum vulgare with an assessment factor of 5. The reasoning for lowering the assessment factor to 5 is discussed in detail in the CAR and is briefly summarised here. Most importantly, from the available data for plants as a group, it appears that the NOEC for H. vulgare is at the lower end of the range of toxicity data obtained for sensitive plant species, while there are also boron tolerant plants that show optimum growth at much higher levels (see also 2.2.2). Moreover, in other tests with H. vulgare, adverse effects appeared only at much higher concentrations. It was thus considered that the lowest NOEC of 2 mg.kg-1 is most likely protective for any other species. This was confirmed by the fact that the PNECadd, terrestrial obtained by equilibrium partitioning using the PNECadd, aquatic, is higher. The
MPAeco, soil is set equal to the PNECadd, terrestrial: 0.4 mg B.kgdwt-1. Conversion to Dutch standard soil is
not preferred since the sorption of boron to soil is determined by more parameters than organic carbon.
3.6.1.2 MPAsp, soil
Boron has a BCF < 100 L.kg-1and therefore secondary poisoning is not triggered. 3.6.1.3 MPAhuman, soil
The formulas to derive an MPAhuman, soil are all log Kow-driven. Since a log Kow is not relevant to boron,
the MPAhuman, soil cannot be derived. 3.6.1.4 Selection of the MPAsoil
The only MPAsoil is the MPAeco, soil. This sets the MPAsoil at 0.4 mg B.kgdwt-1.
Although no background concentration is available, it is clear from the data presented in section 3.3.3 that the MPAeco, soil is most likely very small as compared to natural background levels. In practice this
3.6.2
Derivation of NA
soilThe NAsoil is set a factor 100 lower than the MPAsoil: 4.0 x 10⁻³ mg B.kgdwt-1.
3.6.3
Derivation of SRA
eco, soilFor derivation of the SRAeco, soil both chronic and acute data are available as presented in Table 11. The
geometric mean of the acute values divided by 10 (18.3 mg B.kgdwt-1) is higher than the geometric
mean of the chronic values (10.9 mg B.kgdwt-1). Therefore the SRAeco, soil is the geometric mean of all
chronic values with an assessment factor of 1 = 10.9/1 = 10.9 mg B.kgdwt-1. Conversion to Dutch
standard soil is not preferred since the sorption of boron to soil is determined by more parameters than organic carbon.
3.7
Derivation of ERLs for groundwater
3.7.1
Derivation of MPC
gw3.7.1.1 MPAeco, gw and MPCeco, gw
Since groundwater-specific ecotoxicological data are absent, the surface water MPAeco, water of 0.18 mg
B.L-1 is taken as a substitute for the MPA
eco, gw. As explained in section 3.3.4, the background
concentration for groundwater is set to 0.012 mg.L-1. The resulting MPC
eco, gw is 0.19 mg B.L-1.
3.7.1.2 MPChuman, gw
The MPChuman, gw is set equal to the MPCdw, water: Therefore the MPChuman, gw = MPCdw, water =
1.0 mg B.L-1.
3.7.1.3 Selection of the MPCgw
The lowest MPCgw is the MPCeco, gw. This sets the MPCgw at 0.19 mg B.L-1..
3.7.2
Derivation of NC
gwThe NAgw is a factor of 100 lower than the MPAgw: 1.8 x 10⁻³ mg B.L-1. With the background
concentration of 0.012 mg B.L-1, the NC
gw is 1.4 x 10⁻² mg B.L-1.
3.7.3
Derivation of SRC
eco, gwThe SRAeco, gw is set equal to the SRAeco, aquatic: 6.8 mg B.L-1. With the background concentration of
0.012 mg B.L-1, the SRCeco, gw is 6.8 mg B.L-1.
3.8
Derivation of ERLs for air
In the CAR is considered that because of the low vapour pressure, release of boron to air will be minimal. Therefore no PECadd, air and no PNECadd, air are derived in the CAR. For the same reason no
3.9
Comparison of derived ERLs with monitoring data
The available monitoring data have been presented in Table 9 above. In the non-saline waters, the maximum concentrations do not exceed the MACeco, water of 0.51 mg B.L-1. Since Table 9 shows
geometric means over 2005-2008 instead of annual average concentrations, a direct comparison with the MPCwater is not possible. The data, however, indicate that MPCwater of 0.24 mg B.L-1 will not be
4
Conclusions
In this report, environmental the risk limits (ERLs) are derived for boron in water and groundwater. The following ERLs are considered: Negligible Concentration (NC), Maximum Permissible Concentration (MPC), Maximum Acceptable Concentration for ecosystems (MACeco), and Serious
Risk Concentration for ecosystems (SRCeco). For soil, only ERLs based on added concentrations could
be derived, since there is not enough information to establish a natural background concentration. No ERLs were derived for the air compartment because release of borates to air will be minimal, while the trigger to derive ERLs for sediment is not breached.
The environmental risk limits expressed as additions are summarised in Table 12. Risk limits including background concentrations for water, drinking water and groundwater are given in Table 13.
Table 12. Derived MPA, NA, MAAeco, and SRAeco values for additions of boron in water and soil.
Compartment Unit Environmental Risk Limit
MPA NA MAAeco SRAeco
water mg B.L-1 0.18 1.8 x 10⁻³ 0.45 6.8
drinking water mg B.L-1 n.a. n.a. n.a. n.a.
groundwater mg B.L-1 0.18 1.4 x 10⁻² n.a. 6.8
soil mg B.kgdwt-1 0.40 4.0 x 10⁻³ n.a. 10.9
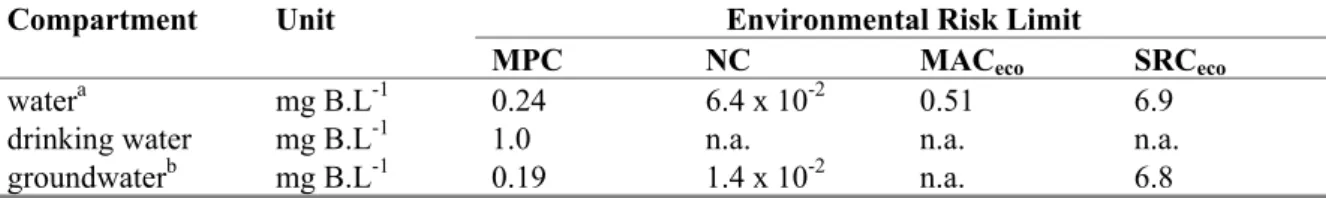
Table 13. Derived MPC, NC, MACeco, and SRCeco values for boron in water (including background).
Compartment Unit Environmental Risk Limit
MPC NC MACeco SRCeco
watera mg B.L-1 0.24 6.4 x 10⁻² 0.51 6.9
drinking water mg B.L-1 1.0 n.a. n.a. n.a.
groundwaterb mg B.L-1 0.19 1.4 x 10⁻² n.a. 6.8
a: based on a background concentration of 0.062 mg B.L-1. b: based on a background concentration of 0.012 mg B.L-1.
References
Butterwick L, De Oude N, Raymond K. 1989. Safety assessment of boron in aquatic and terrestrial environments. Ecotoxicol Environ Saf 17: 339-371.
Eisler R. 1990. Boron hazards to fish, wildlife, and invertebrates: A synoptic review. Biological Report 85(1.20)/Contaminant Hazard Reviews Report 20. Fish and Wildlife Service. US Department of the Interior.
European Commission. 2006. Corrigendum to Regulation (EC) No 1907/2006 of the European Parliament and of the Council of 18 December 2006 concerning the Registration, Evaluation, Authorisation and Restriction of Chemicals (REACH), establishing a European Chemicals Agency, amending Directive 1999/45/EC and repealing Council Regulation (EEC) No 793/93 and
Commission Regulation (EC) No 1488/94 as well as Council Directive 76/769/EEC and Commission Directives 91/155/EEC, 93/67/EEC, 93/105/EC and 2000/21/EC (OJ L 396,
30.12.2006); amended by Council Regulation (EC) No 1354/2007 of 15 November 2007 adapting Regulation (EC) No 1907/2006 of the European Parliament and of the Council on the Registration, Evaluation, Authorisation and Restriction of Chemicals (REACH) by reason of the accession of Bulgaria and Romania (OJ L 304, 22.11.2007, p. 1)
European Commission. 2008. Boric acid. Competent Authority Report, Doc I and II. Luxembourg: Office for Official Publications of the European Communities.
European Commission (Joint Research Centre). 2003. Technical Guidance Document in support of Commission Directive 93/67/EEC on Risk Assessment for new notified substances, Commission Regulation (EC) No 1488/94 on Risk Assessment for existing substances and Directive 98/9/EC of the European Parliament and of the Council concerning the placing of biocidal products on the market. Part II. Ispra, Italy: European Chemicals Bureau, Institute for Health and Consumer Protection. Report no. EUR 20418 EN/2.
Kot FS. 2009. Boron sources, speciation and its potential impact on health. Rev Environ Sci Biotechnol 8: 3-28.
Lepper P. 2005. Manual on the Methodological Framework to Derive Environmental Quality Standards for Priority Substances in accordance with Article 16 of the Water Framework Directive
(2000/60/EC). 15 September 2005 (unveröffentlicht) ed. Schmallenberg, Germany: Fraunhofer-Institute Molecular Biology and Applied Ecology.
Loewengart G. 2001. Toxicity of boron to rainbow trout: a weight-of-evidence assessment. Environ Toxicol Chem 20: 796–803.
Maier KJ, Knight AW. 1991. The toxicity of waterborne boron to Daphnia magna and Chironomus decorus and the effects of water hardness and sulfate on boron toxicity. Arch Environ Contam Toxicol 20: 282-287.
Meinardi CR, Groot MSM, Prins HF. 2003. Basiswaarden voor spoorelementen in het zoete grondwater van Nederland; gegevens uit de landelijke en provinciale meetnetten (LMG, PMG, LMB, sprengen Veluwe). Bilthoven, The Netherlands: National Institute for Public Health and the Environment (RIVM). Report no. 714801028.
Raymond K, Butterwick L. 1992. Perborate. In: The handbook of environmental chemistry: Volume 3, Part F, Anthropogenic compounds: Detergents. Editor-in-Chief: O Hutzinger. Volume Editor NT De Oude. Berlin/Heidelberg, Germany: Springer-Verlag.
Schoderboeck L, Mühlegger S, Losert A, Hornek R. 2009. Effects assessment in the aquatic
environment: Boric acid. Poster presented at the 19th Annual Meeting of SETAC-Europe, 31 May -
4 June, Göteborg, Sweden. Vienna, Austria: Federal Environment Agency.
Suloway JJ, Roy WR, Skelly TM, Dickerson DR, Schuller RM, Griffin RA. 1983. Chemical and toxicological properties of coal fly ash. Champaign, Illinois, Illinois State Geological Survey (Publication NTIS PB84-116110).
silver, titanium, tellurium, uranium and organosilicon compounds in the framework of EU Directive 76/464/EEC. Bilthoven, The Netherlands: National Institute for Public Health and the Environment (RIVM). Report no. 601501005.
Van Vlaardingen PLA, Verbruggen EMJ. 2007. Guidance for the derivation of environmental risk limits within the framework of the project 'International and National Environmental Quality Standards for Substances in the Netherlands' (INS). Bilthoven, The Netherlands: National Institute for Public Health and the Environment (RIVM). Report no. 601782001.
VROM. 2004. (Inter)nationale normen stoffen. Den Haag, Nederland: Ministerie van Volkshuisvesting, Ruimtelijke Ordening en Milieu en Milieubeheer.
http://www.vrom.nl/pagina.html?id=2706&sp=2&dn=w015
Weinthal E, Parag Y, Vengosh A, Muti A, Kloppmann W. 2005. The EU drinking water directive: the boron standard and scientific uncertainty. Eur Environ 15: 1-12.
WHO. 1998. Environmental health criteria for boron. Geneva, Switserland: World Health Organization. EHC 204. http://www.inchem.org/documents/ehc/ehc/ehc204.htm
Wyness AJ, Parkman RH, Neal C. 2003. A summary of boron surface water quality data throughout the European Union. Sci Total Environ 314-316: 255-269.
RIVM
National Institute for Public Health and the Environment P.O. Box 1