Environmental risk limits for silver : A proposal for water quality standards in accordance with the Water Framework Directive
100
0
0
Hele tekst
(2) Environmental risk limits for silver A proposal for water quality standards in accordance with the Water Framework Directive. RIVM Report 601714023/2012.
(3) RIVM Report 601714023. Colophon. © RIVM 2012 Parts of this publication may be reproduced, provided acknowledgement is given to the 'National Institute for Public Health and the Environment', along with the title and year of publication.. C.T.A. Moermond R. van Herwijnen Contact: Caroline Moermond Expertise Centre for Substances caroline.moermond@rivm.nl. This investigation has been performed by order and for the account of the ministry of Infrastructure and the Environment, within the framework of the project 'Chemical aspects of the WFD'.. Page 2 of 43.
(4) RIVM Report 601714023. Abstract. Environmental risk limits for silver A proposal for water quality standards in accordance with the Water Framework Directive RIVM has derived environmental risk limits (ERLs) for silver in water. New ERLs are needed because the current standards have not been derived according to the current valid methodology. The ERLs in this report are advisory values that serve as a scientific background for the Dutch Steering Committee for Substances, which is responsible for setting those standards. The ERLs proposed in this report are not specifically intended for nanosilver, but for all forms of dissolved silver (in ionic form). Better analytical techniques necessary for silver in water For silver, the most used ERL is the Maximum Permissible Addition (MPA). At this concentration harmful effects are not expected for water, based on an annual average concentration. At the moment, it cannot be determined if the MPA is exceeded in the field, since the MPA is lower than the current detection level for silver in the environment. Improving analytical techniques is recommended. Based on three routes The MPA is based on three routes: direct ecotoxicity to water organisms, effects on birds and mammals through feeding on prey, and effects on humans through consumption of fish. Direct ecotoxicity is the most critical of these three routes and determines the overall MPA. For freshwater this results in an MPA of 10 nanogram per liter. For salt water the MPA depends on the salinity; with a higher salinity less silver is taken up by animals. For North Sea water with a salinity of 34 per mill, the MPA is 81 nanogram per liter. Uses of silver Silver has many uses, for example in dentistry, photography and jewelry. With the development of digital photography, use of silver has decreased. The use of silver in the form of nanosilver has increased, however. Nanosilver has an antibacterial effect and is, for instance, being used in clothing. Keywords: environmental quality standard, silver, maximum permissible concentration, negligible concentration. Page 3 of 43.
(5) RIVM Report 601714023. Page 4 of 43.
(6) RIVM Report 601714023. Rapport in het kort. Milieurisicogrenzen voor zilver Een voorstel voor waterkwaliteitsnormen volgens de Kaderrichtlijn Water Het RIVM heeft, in opdacht van het ministerie van Infrastructuur en Milieu (I&M), milieurisicogrenzen voor zilver in water bepaald. Dit was nodig omdat de huidige norm voor zilver voor waterkwaliteit niet is afgeleid volgens de meest recente methodiek. Op basis van de nu voorgestelde milieurisicogrenzen stelt de Stuurgroep Stoffen nieuwe normen vast. De voorgestelde risicogrenzen gelden niet specifiek voor nanozilver, maar voor alle vormen van zilver die in water zijn opgelost (als ionen). Betere analysetechnieken voor zilver in water nodig De risicogrens voor langdurige blootstelling is de Maximaal Toelaatbare Toevoeging (MTT). Dit is de concentratie in water waarbij, gebaseerd op jaargemiddelde concentraties, geen schadelijke effecten te verwachten zijn. Momenteel kan niet worden bepaald of de MTT voor zilver wordt overschreden. Dat komt doordat deze waarde lager blijkt te zijn dan de limiet waarop zilver in water kan worden gemeten. Aanbevolen wordt de analysetechniek voor zilver te verbeteren om dit wel mogelijk te maken. Drie routes onderzocht Voor de MTT zijn drie routes onderzocht: directe effecten op waterorganismen, effecten op vogels en zoogdieren via het eten van prooidieren, en effecten op mensen via het eten van vis. De eerste van de drie levert de laagste waarde en bepaalt daarmee de MTT. Voor zoetwater resulteert dit in een MTT van 10 nanogram per liter. Voor zoutwater hangt de MTT af van het zoutgehalte van het zeewater; hoe hoger het zoutgehalte, hoe minder zilver door dieren wordt opgenomen. Voor Noordzeewater met een zoutgehalte van 34 promille is de MTT 83 nanogram per liter. Toepassingen van zilver Zilver kent veel toepassingen, zoals in de tandheelkunde, fotografie en in sieraden. Met de komst van digitale fotografie is het gebruik van regulier zilver afgenomen. Daar staat tegenover dat het gebruik van zilver in de vorm van nanodeeltjes is toegenomen. Nanozilver heeft een antibacteriële werking en wordt als zodanig onder andere in kleding verwerkt.. Trefwoorden: milieurisicogrenzen, zilver, maximaal toelaatbaar risiconiveau, verwaarloosbaar risiconiveau. Page 5 of 43.
(7) RIVM Report 601714023. Page 6 of 43.
(8) RIVM Report 601714023. Contents. Summary—9 1 1.1 1.2 1.3 1.4 1.5. Introduction—11 Background and aim—11 Project framework—11 Current standards—12 Use and sources of silver—12 Nanosilver—12. 2 2.1 2.2 2.3. Methods—15 General—15 Added risk approach and biotic ligand model—15 Data collection and evaluation—16. 3 3.1 3.2 3.3 3.4 3.5 3.6. Substance identification, physico-chemical properties, fate and human toxicology—19 Identity—19 Physico-chemical properties—19 Behaviour in the environment—20 Silver speciation—20 Bioconcentration and biomagnification—21 Human toxicological threshold limits and carcinogenicity—21. 4 4.1 4.2 4.3 4.4. Aquatic toxicity data—23 Fresh water—23 Salt water—24 Treatment of fresh- and salt-water toxicity data—25 Mesocosm studies—25. 5 5.1 5.2 5.3 5.4 5.4.1 5.4.2 5.5 5.6. Derivation of Environmental Risk Limits—27 Derivation of MPCfw, eco and MPCsw, eco—27 Secondary poisoning and human consumption of fishery products—28 MPCdw,hh—30 Derivation of MAAeco—30 Fresh water—30 Salt water—30 Derivation of NC—31 Derivation of SRAeco—31. 6 6.1 6.2 6.3. Conclusions and recommendations—33 Derived ERLs—33 Monitoring data—33 Options for further research—33 Acknowledgement—35 References—37 List of abbreviations—39 Appendix 1 SCOPUS search profile—41 Appendix 2. Detailed ecotoxicity data—43 Page 7 of 43.
(9) RIVM Report 601714023. Page 8 of 43.
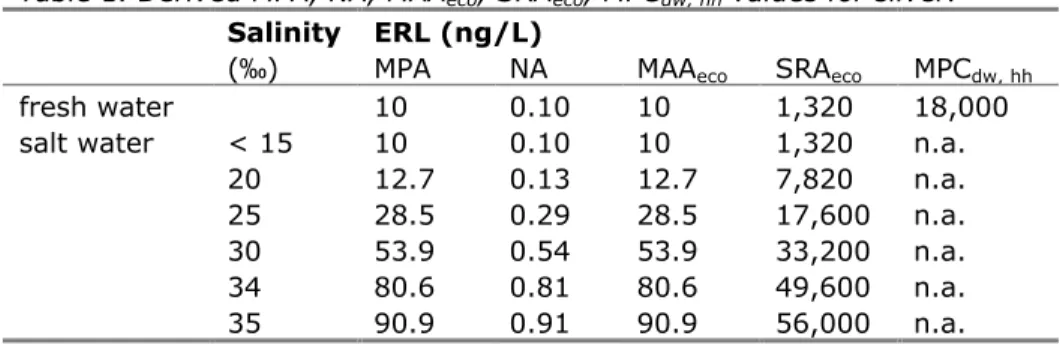
(10) RIVM Report 601714023. Summary Environmental risk limits (ERLs) for silver in water are derived using ecotoxicological, physico-chemical, and human toxicological data. They represent environmental concentrations of a substance offering different levels of protection to man and ecosystems. It should be noted that the ERLs are scientifically derived values. They serve as advisory values for the Dutch Steering Committee for Substances, which is appointed to set the Environmental Quality Standards (EQSs) from these ERLs. ERLs should thus be considered as preliminary values that do not have an official status. This report contains ERLs for silver in water. The following ERLs are derived: Negligible Addition (NA), Maximum Permissible Addition (MPA), Maximum Acceptable Addition for ecosystems (MAAeco), Serious Risk Addition for ecosystems (SRAeco), and the standard for waters intended for the abstraction of drinking water (MPAdw, hh). For the derivation of the MPA and MAAeco for water, the methodology used is in accordance with the Water Framework Directive. For the NA and the SRAeco, the guidance developed for the project ‘International and national environmental quality standards for substances in the Netherlands’ was used (Van Vlaardingen and Verbruggen, 2007). An overview of the derived environmental risk limits is given in Table 1. For salt water, the ERLs depend strongly on the salinity of the system for which the ERL is used. The calculated ERLs at salinities of 15‰ and lower are deemed to be not valid because of the speciation behaviour at these lower salinities. Below 15‰, the ERLs for fresh water should be used. Data on background concentrations in Dutch surface waters are not available. For compliance check, the effective background concentration is therefore assumed to be zero and the MPA is used as the MPC. For the other ERLs, the same arguments apply. The newly derived ERLs are lower than the current standards. Monitoring data show that the detection limit is higher than the MPA (100–1,000 ng/L). This means that, if silver is not detected, the MPA may still be exceeded. Table 1. Derived MPA, NA, MAAeco, SRAeco, MPCdw, hh values for silver. Salinity ERL (ng/L) (‰) MPA NA MAAeco SRAeco MPCdw, hh fresh water 10 0.10 10 1,320 18,000 salt water < 15 10 0.10 10 1,320 n.a. 20 12.7 0.13 12.7 7,820 n.a. 25 28.5 0.29 28.5 17,600 n.a. 30 53.9 0.54 53.9 33,200 n.a. 34 80.6 0.81 80.6 49,600 n.a. 35 90.9 0.91 90.9 56,000 n.a.. Page 9 of 43.
(11) RIVM Report 601714023. Page 10 of 43.
(12) RIVM Report 601714023. 1. Introduction. 1.1. Background and aim In this report, a proposal is made for water quality standards for silver. Silver is listed in the Dutch decree on monitoring within the context of the Water Framework Directive (WFD), also referred to as Regeling monitoring KRW. The current water quality standards for silver do not comply with the most recent methodology for EQS derivation. The list of so-called ‘specific pollutants’ included in the Regeling monitoring KRW is currently being evaluated in view of the second round of river basin management plans for 2015–2021 (Smit and Wuijts, 2012). For those substances remaining on the list, updated water quality standards according to the methodology of the WFD have to be available by the end of 2012. Quality standards for soil, sediment, groundwater and suspended matter in surface water will not be derived in this report, because they are not relevant for compliance check under the Regeling Monitoring KRW.. 1.2. Project framework The derivation of ERLs is performed in the context of the project ‘Chemical aspects of the Water Framework Directive’, which is closely related to the project INS (‘International and national environmental quality standards for substances in the Netherlands’). In addition to water quality standards required according to the WFD, some additional ERLs are considered in the context of INS, each representing a different protection aim. The following ERLs are derived in this report: -. Maximum Permissible Concentration (MPC) – defined in VROM (1999, 2004) as the standard based on scientific data which indicates the concentration in an environmental compartment for which: 1 no effect to be rated as negative is to be expected for ecosystems; 2a no effect to be rated as negative is to be expected for humans (for non-carcinogenic substances); 2b for humans no more than a probability of 10-6 per year of death can be calculated (for carcinogenic substances). Within the scope of the Water Framework Directive (WFD), a probability of 10-6 on a lifetime basis is used. The MPC for water should not result in risks due to secondary poisoning and/or risks to human health. These aspects are therefore also addressed in the MPC derivation. Separate MPC values are derived for the freshwater and salt-water environments.. -. Negligible Concentration (NC) – the concentration in fresh and salt water at which effects to ecosystems are expected to be negligible and functional properties of ecosystems are fully safeguarded. It defines a safety margin which should exclude combination toxicity. The NC is derived by dividing the MPC by a factor of 100.. -. Maximum Acceptable Concentration (MACeco) for aquatic ecosystems – the concentration protecting aquatic ecosystems from effects due to shortterm exposure or concentration peaks. The MACeco is derived for freshwater and salt-water ecosystems. Page 11 of 43.
(13) RIVM Report 601714023. -. Serious Risk Concentration for ecosystems (SRCeco) – the concentration in water at which possibly serious ecotoxicological effects are to be expected. The SRCeco is valid for the fresh-water and salt-water compartments.. -. Maximum Permissible Concentration for surface water used for drinking water abstraction (MPCdw, hh). This is the concentration in surface water that meets the requirements for use of surface water for drinking water production. The MPCdw, hh specifically refers to locations that are used for drinking water abstraction.. The quality standards in the context of the WFD refer to the absence of any impact on community structure of aquatic ecosystems. Hence, not the potential to recover after transient exposure, but long-term undisturbed functioning is the protection objective under the WFD. Recovery in a test situation, after a limited exposure time, is therefore not included in the derivation of the MPC and MAC. In the scope of this report, MPCs, MACs and SRCs are determined for the freshwater and salt-water compartments. 1.3. Current standards Since natural background concentrations for silver in the Netherlands are not officially established, the current standards for silver are only available as added concentrations, excluding background values. See section 2.2 for information on the use of the added risk approach for metals. The current Maximum Permissible Additions (MPAs) for silver in water are 0.082 µg/L for fresh water and groundwater, and 1.2 µg/L for marine water. The derivation of these values is reported by Van de Plassche et al. (1999). In the REACH dossier, the PNEC for silver is reported as 0.04 µg/L in fresh water and 0.86 µg/L in marine water. These values refer to direct ecotoxicity to water organisms. There is no reference as to how these values are derived.. 1.4. Use and sources of silver Up to a decade ago, the main uses of silver were in photographic materials, electroplating, electrical conductors, dental alloys, solder and brazing alloys, paints, jewellery, coins, mirror production, cloud seeding, antibacterial agents and water purification (Faust, 1992). Over the last decade the use of silver for photographic materials, one of the largest applications, has declined because of the introduction of digital photography. This can be seen in the figures from the Dutch emission register (www.emissieregistratie.nl) regarding emission to surface water and sewage. However, over the last few years, the use of silver in consumer products has rapidly increased, mostly because of applications in the form of nanosilver (Fabrega et al., 2011). This increased use is expected to lead to increased emissions of silver to the environment, but cannot be seen in the figures from the Dutch emission register (www.emissieregistratie.nl; accessed on March 13, 2012).. 1.5. Nanosilver As indicated above, silver is also released into the environment in the form of nanoparticles. In a review by Fabrega et al. (2011) an overview of the behaviour and effects of silver nanoparticles in the environment is provided. These authors conclude that concentrations and forms of nanomaterials in the environment are difficult to quantify and that methodological progress is needed with regard to Page 12 of 43.
(14) RIVM Report 601714023. development of analytical tools to quantify nanoparticles in the environment. Toxicity studies on nanosilver are not consistent in methodology, which makes understanding the risk of nanosilver difficult. Fabrega et al. (2011) state that on the basis of current data it is not possible to conclude that either form of silver is consistently more toxic than the other. Furthermore, it can be expected that nanosilver, once released into the environment, will sooner or later be present in ionic form. This is confirmed by a study on the toxicity of nanosilver to Caenorhabditis elegans (Yang et al., 2012), where a linear correlation between nanosilver toxicity and dissolved silver was observed. In their experiments, the toxicity of tested nanosilver materials was never greater than would be predicted by complete dissolution of the same mass of silver as silver ions. In another review, it is stated that it is still unclear if dissolved silver causes the toxicity of nanosilver, but that it is also unclear if the nanoparticles themselves cause silver toxicity (Scown et al., 2010). Because of the lack of coherent information on fate and effects of nanosilver in the environment, the current report focuses only on dissolved silver ions.. Page 13 of 43.
(15) RIVM Report 601714023. Page 14 of 43.
(16) RIVM Report 601714023. 2. Methods. 2.1. General The methodology for risk limit derivation is described in detail in the INSguidance document (Van Vlaardingen and Verbruggen, 2007), also referred to as the INS Guidance. The methodology is based on the Technical Guidance Document (TGD), issued by the European Commission and developed in support of the risk assessment of new notified chemical substances, existing substances and biocides (EC, 2003) and on the Manual for the derivation of Environmental Quality Standards in accordance with the Water Framework Directive (Lepper, 2005). The latter document has been revised and the updated European guidance for derivation of water quality standards in the context of the WFD was published in December 2011 (EC, 2011). The new guidance is followed where it deviates from the INS Guidance and the terminology is harmonised as much as possible. This specifically applies to the derivation of the MAC (see section 5.4), for which the assessment factors in the new WFD Guidance differ from the INS Guidance. This also applies to the MPC for surface waters intended for the abstraction of drinking water (MPCdw, hh, see section 5.3). In the INS Guidance, this is one of the MPCs from which the lowest value should be selected as the general MPCwater (see section 3.1.6 and 3.1.7 of the INS Guidance). According to the new guidance, the MPCdw, hh is not taken into account for the derivation of the general MPCwater, but specifically refers to locations that are used for drinking water abstraction. With respect to the derivation of risk limits for metals, the new WFD Guidance is basically in line with the procedures in the INS Guidance, but the options for refinement, e.g. by incorporation of knowledge on speciation and bioavailability, are further elaborated.. 2.2. Added risk approach and biotic ligand model For derivation of ERLs for metals, the WFD Guidance (EC, 2011) proposes to follow the added risk approach and to include background concentrations in the final ERL for metals. The added risk approach is used to take natural background concentrations into account when calculating ERLs for naturally occurring substances. The approach starts by calculating a maximum addition for chronic exposure and short-term concentration peaks equivalent to the MPC and MAC. These additions, denoted as MPA and MAA, are derived on the basis of available data from laboratory toxicity tests (with added amounts of toxicants). The MPA and MAA are considered to be the maximum concentrations to be added to the background concentration (Cb), without causing deleterious effects. Hence, the MPC is the sum of Cb and MPA, and the MAC is the sum of Cb and MAA: MPC = Cb + MPA MAC = Cb + MAA The background concentration and the MPA/MAA are independently derived values, where the MPA and MAA are derived using a similar approach as the MPC and MAC for substances having no natural background concentration.. Page 15 of 43.
(17) RIVM Report 601714023. The aquatic ERLs derived in this report are for dissolved silver (i.e., after filtration of water samples over a filter with a maximum pore size of 0.45 µm). Therefore, only studies that report endpoints based on measured concentrations of samples that were filtered, or that were determined in laboratory water without particulate matter, are used for the derivation of the aquatic ERLs. With regard to the bioavailable fraction of silver in laboratory tests, we assume that the dissolved fraction of silver in the test medium (< 0.45 µm) is fully bioavailable. In contrast, the background concentration is assumed to be completely unavailable, since at present there is insufficient information to determine the bioavailability of the background concentrations for metals. Moreover, for silver, no background concentrations have as yet been established, although work has been done on the methodology (Leonard Osté, personal communication). Also, in the database that might be used according to the WFD Guidance (EC, 2011): http://www.gsf.fi/publ/foregsatlas/maps_table.php; (accessed on March 13, 2012) no background concentrations for silver are reported. Thus, for compliance check the effective background concentration is assumed to be zero and the MPA is assumed to be equal to the MPC. For the MAC, the same arguments apply. The WFD Guidance also notes that the recent developments in the area of biotic ligand modelling (BLM) may be used in the future for the assessment of bioavailability and the calculation of local quality standards after comprehensive data have become available for validation. In the case of silver, some work has been done on acute BLMs but with variable results (Bielmyer et al., 2007) and these BLMs are not yet validated. Moreover, data for chronic toxicity are needed for MPC derivation. This makes this approach not (yet) suitable for ERL derivation. 2.3. Data collection and evaluation An online literature search was performed on SCOPUS for the period 1998– 2010. The search profile is given in Appendix 1. The search resulted in approximately 110 references, of which more than 60 references were considered relevant. In addition to this, all cited references in Van de Plassche et al. (1999), INERIS (2006), Ratte (1999) and Wood et al. (2002) were collected and (re)assessed for the purpose of the ERL derivation of silver. Also, all studies of which ecotoxicological endpoints were cited in the assessed papers were collected and assessed. Finally, all records on aquatic toxicity in the REACH dossier on silver were added. Studies were evaluated according to the Klimisch criteria (Klimisch et al., 1997), where, in the case of silver, only studies where the endpoints were based on measured values were considered to be valid. The aquatic ERLs derived in this report are for dissolved silver (i.e., after filtration of water samples over a filter with a maximum pore size of 0.45 µm). Therefore, only studies that report endpoints based on measured concentrations of samples that were filtered, or that were determined in laboratory water without particulate matter, were used for the derivation of the aquatic ERLs. Aggregated data tables for acute and chronic toxicity were constructed with only one effect value per species, using L(E)C50-values or NOEC/EC10-values, respectively. To construct this aggregated data table, studies were only used if they were (a) valid; (b) based on measured dissolved concentrations; and (c) Page 16 of 43.
(18) RIVM Report 601714023. performed in laboratory water or filtered natural water with DOC < 2 mg/L and a pH between 6 and 9. For experiments with algae, the presence of particulate organic matter (algae) can of course not be avoided. The influence of hardness on the toxicity data for silver is not clear; where hardness was varied within the same study, the results were variable. Therefore, no criteria were defined for the acceptable degree of hardness. When several effect data are available for one species, the geometric mean of multiple values for the same endpoint was calculated where possible. Subsequently, when several endpoints (like growth, mortality and/or reproduction) were available for one species, the lowest of these endpoints (per species) is reported in the aggregated data table. For salt water, two different aggregated data tables were constructed to account for speciation into AgCl complexes (see section 3.4): - based on measured concentrations, irrespective of the salinity used in the experiments - based on calculated free Ag-ion concentrations, using the CHEAQS model, version 2011.2 (Verweij, 2011). In this calculation, speciation to DOM was not taken into account, since the concentration of DOM is often not exactly known. Moreover, in sea water the complexation to DOM (up to 5 mg/L) comprised much less than 1 percent of the total dissolved silver (Cowan et al., 1985). The ERLs that can be derived from these three methods are discussed in the main text.. Page 17 of 43.
(19) RIVM Report 601714023. Page 18 of 43.
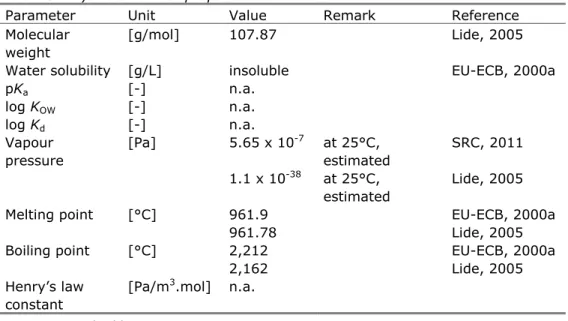
(20) RIVM Report 601714023. 3. Substance identification, physico-chemical properties, fate and human toxicology. 3.1. Identity Silver occurs in the environment in a large number of different ionic species. Since most species are not relevant from a toxicological point of view, only the identity and physico-chemical properties for elemental silver and silver nitrate are given. Table 2. Identification of silver. Parameter silver Chemical name silver CAS number 7440-22-4 EC number 231-131-3 SMILES code Ag. 3.2. silver nitrate silver nitrate 7761-88-8 231-853-9. Physico-chemical properties Physico-chemical characteristics of elemental silver and silver nitrate are presented in Tables 3 and 4. Although the ERL derivation concerns dissolved silver ions, both elemental silver and silver salts (AgNO3 and other salts) can be used in toxicity experiments. Table 3. Physico-chemical properties of elemental silver. Parameter Unit Value Remark Molecular [g/mol] 107.87 weight Water solubility [g/L] insoluble pKa [-] n.a. log KOW [-] n.a. log Kd [-] n.a. Vapour [Pa] 5.65 x 10⁻⁷ at 25°C, pressure estimated 1.1 x 10-38 at 25°C, estimated Melting point [°C] 961.9 961.78 Boiling point [°C] 2,212 2,162 Henry’s law [Pa/m3.mol] n.a. constant. Reference Lide, 2005 EU-ECB, 2000a. SRC, 2011 Lide, 2005 EU-ECB, 2000a Lide, 2005 EU-ECB, 2000a Lide, 2005. n.a. = not applicable.. Table 4. Physico-chemical properties of silver nitrate. Parameter Unit Value Remark Molecular [g/mol] 169.89 weight Water [g/L] 1,438 20°C solubility 2,160 20°C 2,340 25°C. Reference EU-ECB, 2000b EU-ECB, 2000b EU-ECB, 2000b Lide, 2005 Page 19 of 43.
(21) RIVM Report 601714023. Parameter pKa log KOW log Kd. Unit [-] [-] [-]. Value n.a. n.a. 1.26.1a 2.1. Vapour pressure Melting point Boiling point. [Pa]. n.a.. [°C] [°C]. 212 none. Henry’s law constant. [Pa/m3/mol]. n.a.. Remark. Reference. HSDB, 2011 Average from two experimental Kd values of 45 L/kg and 364 L/kg salt. thermal decomposition at 444°C. Kreule et al., 1995. EU-ECB, 2000b Lide, 2005. n.a. = not applicable. a. 3.3. These values were determined in field experiments; see also Section 3.3.. Behaviour in the environment Reported partition coefficients between water and sediment (Kd) for silver range from 16 to 1,300,000 (HSDB, 2011). These values were determined in the San Francisco Bay as well as in relatively pristine estuaries and they involve the different species in which silver is present in the environment (see section 3.4). Specific details on the silver speciation at the sampling sites for the different reported values are, however, not available. Besides the speciation of silver, sorption would also be influenced by other environmental conditions like redox state and composition of the suspended matter or sediment (HSDB, 2011). Considering the potentially high Kd values of silver, ERLs for sediment should also be derived. However, since these are not relevant for the purpose of this report, they are not derived here.. 3.4. Silver speciation Although the ERL derivation concerns dissolved silver ions, this is not the form at which silver is primarily present in the environment. Silver is present in the environment primarily as silver sulphide and silver chloride (AgCln1-n) complexes (Hogstrand and Wood, 1998). Under reducing conditions in fresh water, silver sulphide dominates, while under oxidising conditions and in salt water silver chloride complexes are the most significant. This speciation behaviour influences the amount and activity of the free silver ion (Ag+), which is supposed to be the most toxic species of silver (Hogstrand and Wood, 1998). In salt water, the amount of free silver ions is lower than in fresh water because of the strong chloride speciation. Water hardness and pH play very minor roles. In fresh water, test results suggest that DOC is probably an important variable for silver speciation in natural waters (Hogstrand and Wood, 1998). Compared to other metals, the complexation of silver to chloride is relatively strong. For that reason, in this report, for saltwater speciation, calculations are performed to relate the observed toxicity to the free silver ion and then recalculate the final MPA and MAA back into dissolved silver concentrations at different salinities. For fresh water this refinement is less relevant; the influence of chloride complexes in fresh water is not as strong as in sea water.. Page 20 of 43.
(22) RIVM Report 601714023. 3.5. Bioconcentration and biomagnification According to HSDB (2011), inorganic silver ions will not bioconcentrate in aquatic organisms. Data on bioconcentration of silver are available only to a limited extent. Ratte et al. (1999) cite Bioconcentration Factors (BCF) ranging from 1.8 to 335 L/kg for fish and 1,400 L/kg for the mollusc Ligumia sp. Ikemoto et al. (2008) report silver concentrations in an aquatic food chain in the Mekong Delta (Vietnam). From these data, a geometric mean Bioaccumulation Factor (BAF) of 347 L/kgww for fish can be calculated, and no biomagnification is observed. Campbell et al. (2005) and Watanabe et al. (2008) even report inverse biomagnification (biodilution) in a food web from zooplankton to bird and seals in the Arctic, and a macro-invertebrate stream food web, respectively. Asante et al. (2008) reported biomagnification in zooplankton in a marine food web in the East China Sea, but biodilution in the whole food web. These results indicate that some bioconcentration of inorganic silver into zooplankton may be expected, but no further biomagnification in the food web. Therefore, the relevance of secondary poisoning to silver ERL derivation may be limited. Thus, in section 5.2 a reversed approach is applied in order to assess if secondary poisoning of silver is relevant for the ERLs to be derived. Since in this section it is concluded that secondary poisoning of silver is not relevant for the derivation of the ERLs, no further details on bioaccumulation are reported.. 3.6. Human toxicological threshold limits and carcinogenicity Elemental silver has no risk phrases. Silver nitrate, being the most relevant species for toxicity testing in the aquatic environment, has the following risk phrases: R8, R43 and R50/53 (EU-JRC, 2011). The hazard statements are H271, H290, H314, H400, and H410 (www.echa.europa.eu; accessed March 13, 2012). Thus, derivation of the MPCwater, hh food for exposure of humans via fish consumption is not triggered. For drinking water, however, the derivation of the MPCdw,hh is relevant. From a human toxicity study, the EPA derived an oral RfD for elemental silver of 0.005 mg/kgbw per day (Faust, 1992). This value is taken as TDI for the calculation of the MPCdw, hh. The US EPA derived a national secondary drinking water standard for silver of 0.1 mg/L because silver is used as an antibacterial agent in many home water treatment devices, and so presents a potential problem, which deserves attention (Erdreich et al., 1985).. Page 21 of 43.
(23) RIVM Report 601714023. Page 22 of 43.
(24) RIVM Report 601714023. 4. Aquatic toxicity data. 4.1. Fresh water An overview of the aggregated fresh water toxicity data for silver is given in Table 5. Detailed toxicity data for silver are tabulated in separate Excel tables (See Appendix 2). As discussed in section 2.3, to construct this aggregated data table, studies were only used if they were were (a) valid; (b) based on measured dissolved concentrations; and (c) performed in laboratory water, well water or filtered natural water with DOC < 2 mg/L and a pH between 6 and 9. Table 5. Aggregated toxicity data for fresh water organisms. Chronica Acutea Taxonomic group NOEC/EC10 Taxonomic group (μg Ag/L) Algae Chlorella vulgaris Pseudokirchneriella subcapitata. 6.16i 1.57j. Algae Chlamydomonas reinhardtii Chlorella vulgaris Pseudokirchneriella subcapitata. Crustacea Ceriodaphnia dubia Daphnia magna. 1.04k 2.37l. Insecta Chironomus tentans Stenonema modestum. 13 1.0m. Pisces Oncorhynchus mykiss Pimephales promelas Salmo trutta. L(E)C50 (μg Ag/L) 18.7b 18.4c 7.8d. Crustacea Ceriodaphnia dubia Daphnia magna Hyalella azteca. 0.66e 1.32f 4.9. Pisces Oncorhynchus mykiss Pimephales promelas. 2.75g 6.65h. 0.1n 2.0 0.19. a. For detailed information see the Excel tables. Bold values are used for ERL derivation.. b. Geometric mean of 19.6 and 17.8 µg/L.. c. Geometric mean of 22.15, 21.7, and 13 µg/L.. d. Geometric mean of 6.47 and 9.47 µg/L.. e. Geometric mean of 0.31, 0.53, 6.1, 0.86, 0.7, 0.55, 3.8, 1.2, 0.34, 0.1, 0.41, and 0.3. µg/L. f. Geometric mean of 0.22, 0.28, 3.09, 3.21, 3.54, 0.23, 1.35, 1.41, 1.72, 1.56, 2.33, 2.84,. 2.08, and 1.41 µg/L. g. Geometric mean of 2.6, 12.6, 3.3, 1.02, 3.18, 2.57, 2.19, and 1.64 µg/L.. h. Geometric mean of 6.02, 3.6, 5.6, 5.2, 3.5, 13, 7.7, 5.27, 8.26, 13.4, 3.1, 5.7, 8.8, 4.5,. 7.8, 8.1, 5.0, 4.7, 9.7, 5.9, 10.4, and 16.0 µg/L for 96 h exposure. i. Geometric mean of 7.97, 6.3, and 4.66 µg/L.. j. Geometric mean of 0.94 and 2.61 µg/L.. k l. Most sensitive endpoint: mortality; geometric mean of 0.37 and 2.9 µg/L. Most sensitive endpoint: 21d NOEC for growth.. m n. Most sensitive endpoint: moulting. Most sensitive endpoint: growth.. Page 23 of 43.
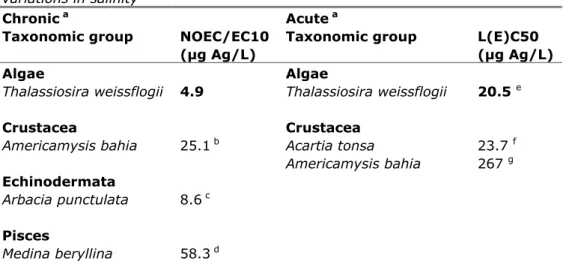
(25) RIVM Report 601714023. Please note that, for Ceriodaphnia dubia and Daphnia magna, it seems odd that the acute LC50s are lower than the values for the chronic NOEC. However, this is caused primarily by the fact that the acute and chronic experiments are not performed within the same study, and results can vary among research laboratories. Two valid chronic endpoints were available for these species. Since there was no obvious reason to exclude one or the other value, it was decided to use the geometric mean. For the acute values, there are more study results available than for the chronic values, and the one or two relatively high acute values do not have a strong influence on the resulting geometric mean. 4.2. Salt water An overview of the selected toxicity data for marine species is given in Table 6. Marine species are considered those species that are representative for marine and brackish water environments, and that were tested in water with salinity >5 ‰. As discussed in section 2.3, to construct this aggregated data table, only studies were used which were (a) valid; (b) were based on measured dissolved concentrations (c) performed in laboratory water or filtered natural water with DOC < 2 mg/L and a pH between 6 and 9. Table 6. Aggregated toxicity data for marine species, not taking into variations in salinity Chronic a Acute a Taxonomic group NOEC/EC10 Taxonomic group (μg Ag/L) Algae Algae Thalassiosira weissflogii 4.9 Thalassiosira weissflogii Crustacea Americamysis bahia. 25.1 b. Echinodermata Arbacia punctulata. 8.6 c. Pisces Medina beryllina. 58.3 d. Crustacea Acartia tonsa Americamysis bahia. account any. L(E)C50 (μg Ag/L) 20.5. e. 23.7 f 267 g. a. For detailed information see the Appendix 2. Bold values are used for ERL derivation.. b. Most sensitive endpoint: reproduction, geometric mean of 78.9, 3, 60, and 27.8 µg/L.. c. Most sensitive endpoint: loss of spines, spine tugor and inability to adhere to surfaces.. d. Most sensitive endpoint: mortality, geometric mean of 26, 25, 27.5, 49, 71, 144, 19,. 100, and 460 µg/L. e. Most sensitive endpoint: growth.. f. Geometric mean of 7.1 and 79.2 µg/L.. g. Geometric mean of 260, 280, and 260 µg/L.. In Table 6, no attention is paid to the considerable differences in toxicity values among studies with different salinities. To better compare the endpoints from the selected studies, toxicity values were recalculated into toxicity values for free silver ions in 34‰ sea water (as measured in the North Sea), containing 18,800 mg/L Cl-, 10,770 mg/L Na, 412 mg/L Ca, 1,290 mg/L Mg, 2,711 mg/L SO4, 380 mg/L K and 67 mg/L Br (Grasshof, 1976; Joop Bakker, Waterdienst, personal communication). Speciation to DOM was not taken into account, since the concentration of DOM is often not exactly known. Moreover, in sea water the complexation to DOM (up to 5 mg/L) comprised much less than 1 percent of the total dissolved silver (Cowan et al., 1985). Our calculations Page 24 of 43.
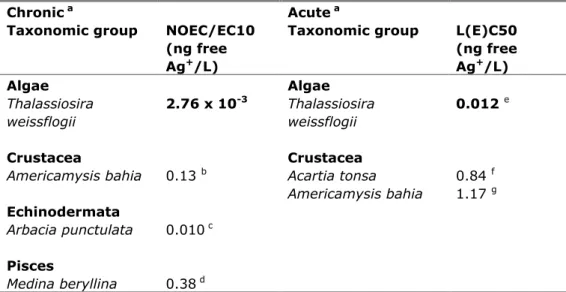
(26) RIVM Report 601714023. were performed using CHEAQS (version 2011.2) (Verweij, 2011). The resulting aggregated data based on free silver ion concentrations are tabulated in Table 7. Table 7. Aggregated toxicity data for marine species, recalculated to free Ag+ concentrations. Chronic a Acute a Taxonomic group NOEC/EC10 Taxonomic group L(E)C50 (ng free (ng free Ag+/L) Ag+/L) Algae Algae Thalassiosira 2.76 x 10⁻³ Thalassiosira 0.012 e weissflogii weissflogii Crustacea Americamysis bahia. 0.13. b. Echinodermata Arbacia punctulata. 0.010 c. Pisces Medina beryllina. 0.38 d. Crustacea Acartia tonsa Americamysis bahia. 0.84 1.17. f g. a. For detailed information see the Excel tables. Bold values are used for ERL derivation.. b. Most sensitive endpoint: growth, geometric mean of 0.29, 0.25, 0.077, 0.76, 0.081,. 0.075, 0.31, 0.017, and 0.067 ng free Ag+/L. c. Most sensitive endpoint: loss of spines, spine tugor and inability to adhere to surfaces.. d. Most sensitive endpoint: growth, geometric mean of 1.51, 0.063, 0.14, 1.11, 0.44, and. 0.48 ng free Ag+/L.. 4.3. e. Most sensitive endpoint: growth. f. Geometric mean of 2.13 and 0.33 ng free Ag+/L.. g. Geometric mean of 1.14, 1.23, and 1.14 ng free Ag+/L.. Treatment of fresh- and salt-water toxicity data Since the speciation of silver is different in the marine environment, fresh- and salt-water toxicity data cannot be combined.. 4.4. Mesocosm studies Mesocosm studies with silver are not available.. Page 25 of 43.
(27) RIVM Report 601714023. Page 26 of 43.
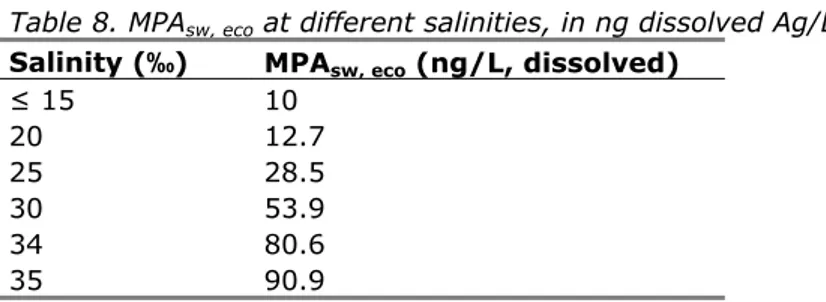
(28) RIVM Report 601714023. 5. Derivation of Environmental Risk Limits. 5.1. Derivation of MPCfw, eco and MPCsw, eco For fresh water, there is a complete base set with acute and chronic data, and additional chronic data for insects. The lowest chronic endpoint is the value of 0.1 µg Ag/L for Onchorhynchus mykiss. It would have been preferred if toxicity data for micro-organisms was also available, since silver is used as an antimicrobial agent. However, from the reliable data on total silver (see Appendix 2) it can be seen that the toxicity to bacteria is in the same order of magnitude as the toxicity to fish. Therefore, an assessment factor of 10 is applied. This results in an MPAfw, eco of 10 ng Ag/L for dissolved silver. For marine species, the acute base set is not complete, since data for fish are missing. However, if the valid data for fish that could not be used in the aggregated data table (for instance because no measured dissolved concentrations were reported) are taken into account, it is clear that marine fish are not the most sensitive species. Therefore, for the derivation of the MPAsw, eco, it can be assumed that the acute base set is complete. For chronic toxicity, data for algae, crustaceans and fish are available with additionally an echinoderm. This means that an assessment factor of 50 should be used on the lowest NOEC/EC10. When all toxicity data are used, regardless of the salinity at which the experiment was performed (Table 6), the lowest NOEC is 4.9 µg Ag/L, for Thalassiosira weissflogii. With an assessment factor of 50, this results in an MPAsw, eco of 98 ng Ag/L. However, because the salinity influences the toxicity of silver in marine waters, this approach is not preferable. When toxicity data are used which have been recalculated into concentrations of the free Ag+ ion, the lowest NOEC is 2.76 x 10⁻³ ng free Ag+/L. With an assessment factor of 50, this results in an MPAsw, eco of 5.52 x 10⁻⁵ ng free Ag+/L. This value can be recalculated using CHEAQS (version 2011.2) into values for dissolved silver in waters with different salinities (assuming that all ions mentioned in section 4.2 vary in the same ratios with salinity), and results can be found in Table 8. Table 8. MPAsw, eco Salinity (‰) ≤ 15 20 25 30 34 35. at different salinities, in ng dissolved Ag/L . MPAsw, eco (ng/L, dissolved) 10 12.7 28.5 53.9 80.6 90.9. At low salinities, the MPAsw, eco is lower than the MPAfw, eco. This may be an artefact of the calculation (with a strong focus on silver complexation, which is mainly the case at higher salinities). Thus, the calculated MPAsw, eco at salinities of 15‰ and lower are deemed to be not valid because of the speciation behaviour at these lower salinities and at these salinities the MPAfw, eco should be used. Which MPA to choose thus depends on the salinity of the aquatic system for which the MPA is derived. Page 27 of 43.
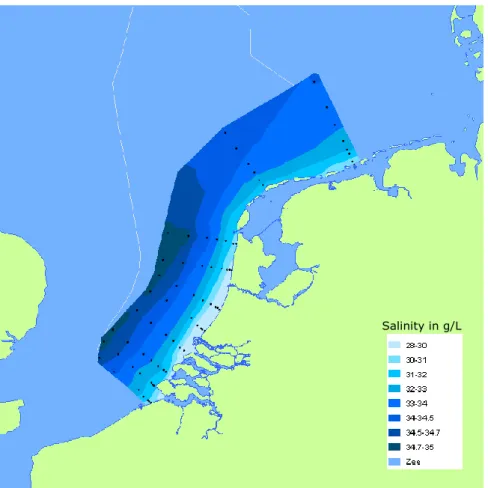
(29) RIVM Report 601714023. In water with a salinity of 34‰, which is representative for Dutch North Sea water (Joop Bakker, Waterdienst, personal communication; see details at section 4.2), the resulting MPAsw, eco is 81 ng dissolved Ag/L.. Salinity in g/L. Figure 1. Salt concentrations in Dutch coastal waters (http://www.noordzeeatlas.nl/nl/nzaNl.html; accessed February 28, 2012). As indicated in section 2.2, a background concentration for silver in Dutch surface waters has not yet been established. This means that, for compliance check, the effective background concentration is assumed to be zero and the MPA is used as the MPC. The MPCfw thus equals the MPAfw and is determined by the MPAfw, eco of 10 ng Ag/L. The MPCsw equals the MPAsw and depends on the salinity of the system for which the MPAsw is derived, according to the values reported in Table 8. For North Sea water with a salinity of 34‰, the resulting MPAsw is 81 ng dissolved Ag/L. These values are based on dissolved concentrations. If total concentrations or concentrations in suspended solids are needed, the above MPCs can be recalculated using the approach described in section 3.8.1 of the WFD Guidance (EC, 2011). 5.2. Secondary poisoning and human consumption of fishery products Derivation of MPCwater, hh food for silver is not triggered (section 3.6). With respect to secondary poisoning, data on the bioconcentration and biomagnification of silver are available to a limited extent and indicate that there is some bioconcentration of inorganic silver into zooplankton, but no further biomagnification in the food web. Thus the relevance of secondary poisoning to silver ERL derivation may be limited (section 3.5). For secondary poisoning,. Page 28 of 43.
(30) RIVM Report 601714023. background concentrations are not relevant, and as a result not MPAs but MPCs are derived for this route. In order to conclude whether secondary poisoning may be relevant to the derivation of ERLs for silver, a reversed approach is used. On the basis of the toxicity data for mammals and birds given in Table 9, it is calculated what the value of the BAF should be in order to let the MPCfw, secpois and MPCsw, secpois be more critical than the respective MPCs for direct ecotoxicity. As indicated above, the MPA is used as the MPC in the absence of background concentrations. Therefore, the MPCfw,secpois and MPCsw, secpois are compared with the MPAfw, eco and MPAsw, eco, respectively. The MPCbiota,secpois per species is calculated applying the appropriate assessment factor (see Table 9). The lowest value is used for comparison of the derived MPAs according to Eq. 13 of the INS Guidance (Van Vlaardingen and Verbruggen, 2007) and section 4.4 in the WFD Guidance (EC, 2011). Table 9 Toxicity data for mammals. Data for birds are not available. Duration NOAEC diet AF MPCbiota,secpois Reference [mg/kgfd] [mg/kgfd] Dog 90 d 455 90 5.1 Ctgb 2004 Rat 2 gen 130 30 4.3 Ctgb 2004 Because for mammals and birds more than one study is available, the most appropriate MPCbiota, secpois for these organisms should be selected first. According to the WFD Guidance (EC, 2011), it is recommended in this case ‘to use the most sensitive endpoint divided by the appropriate assessment factor (i.e. the factor implied by the study with the longest test duration)’. Taking the lowest from the MPCbiota, secpois values for rat and dog, the MPCbiota, secpois, fw is set to a 4.3 mg/kg diet. The MPCfw, secpois is calculated by: MPCfw, secpois = MPCbiota, secpois, fw / (BCF x BMF1) = 4.3 / (BCF x BMF1) In these formulas, the factor BCF x BMF1 may be replaced by a field-derived BAF. To be more critical than the MPCfw, eco (10 x 10-6 mg/L), the BAF should be higher than 4.3 / 0.000010 = 430,000 L/kg. This value is a factor of 307 higher than the highest BCF of 1,400 L/kg for molluscs and a factor of almost 1,300 higher than the reported BAFs and BCFs for fish (see section 3.5). In other words, using the highest available BCF for molluscs, a BMF of over 300 kg/kg is needed to arrive at an MPCfw, secpois that is lower than the MPCfw, eco. Since biomagnification is not observed for silver, this is highly unlikely. For the marine environment, the MPCsw, secpois is calculated according to: MPCbiota, secpois, sw = MPCbiota, secpois, fw / BMF2 MPCsw, secpois = MPCbiota, secpois, sw / (BCF x BMF1) = 4.3 / (BCF x BMF1). In this case, to be more critical than the MPCsw, eco, the BCF x BMF1 x BMF2 has to be higher than 4.3 / 0.000081 = 53,100 L/kg. This value is more than a factor of 150 higher than the available BCFs and BAFs for fish (see section 3.5). This would mean the BMF1 x BMF2 would have to be higher than 150 (individual. Page 29 of 43.
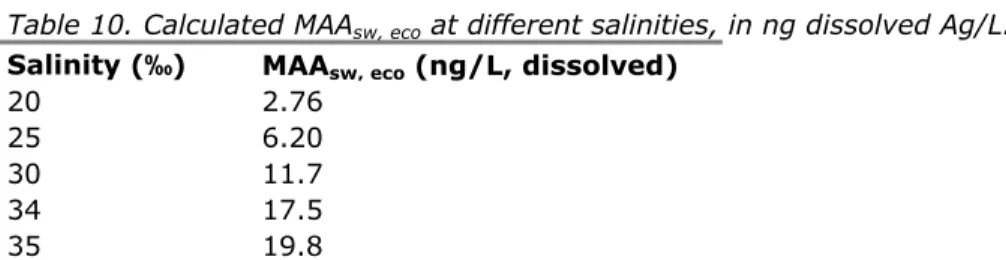
(31) RIVM Report 601714023. BMF > 12 kg/kg) to arrive at an MPCsw, secpois which is lower than the MPCsw, eco. Since biomagnification is not observed for silver, this is highly unlikely. In view of the above, the chances are that a full literature search and assessment of the available BCF and BAF values would result in values for MPCfw, secpois or MPCsw, secpois that are more critical than the respective values for direct ecotoxicity. It can be concluded that the environmental risk of exposure to silver through secondary poisoning is lower than through direct toxicity and that deriving an MPC for secondary poisoning is deemed to be unnecessary. Therefore, further assessment of BCF studies with silver has not been performed. 5.3. MPCdw,hh No A1 value and DW standard are available for silver. With the TDI of 0.005 mg Ag/kgbw.day a provisional MPCdw, hh can be calculated with the following formula: MPCdw, hh = 0.1 x TLhh x BW / uptakedw where the TLhh is the TDI, BW is a body weight of 70 kg, and uptakedw is a daily uptake of 2 L. The provisional MPCdw, hh thus becomes: 0.1 x 0.005 x 70 / 2 = 0.018 mg Ag/L = 18 µg Ag/L. Since this value is higher than the other MPCs, no factor for removal efficiency during drinking water treatment has to be taken into account and no definitive MPCdw,hh needs to be derived (EC, 2011).. 5.4. Derivation of MAAeco. 5.4.1. Fresh water For fresh water, there is a complete acute base set and the MAAfw, eco is based on the lowest L(E)C50 value available. This is the value of 0.66 µg Ag/L for Ceriodaphnia dubia. Since the standard deviation of the log-transformed EC50 values is 0.52, an assessment factor of 100 should be used (WFD Guidance; EC, 2011), which results in a MAAfw, eco of 6.6 ng/L. This value is lower than the MPAfw, eco and it is deemed unrealistic for the MAAfw, eco to be lower than the MPAfw, eco. Therefore, the MAAfw, eco is set equal to the MPAfw, eco at 10 ng Ag/L. Since background concentrations in fresh water are not available, this value is also valid as the MACfw, eco.. 5.4.2. Salt water Fish are absent from the acute dataset for marine species and thus the base set is not complete. However, because the valid data based on total concentrations show that fish are not the most sensitive species, an MAAsw, eco can still be derived. When all toxicity data are used, regardless of the salinity at which the experiment was performed (Table 6), the lowest EC50 is 20.5 µg Ag/L for Thalassiosira weissflogii. The standard deviation of the log-transformed EC50 values is 0.63, and thus an assessment factor of 1,000 should be used, which results in an MAAsw, eco of 20.5 ng Ag/L. However, because the salinity influences the toxicity of silver in marine waters, this approach is not preferable. When toxicity data are used which have been recalculated into concentrations of the free Ag+ ion, the lowest EC50 is 0.012 ng free Ag+/L for Thalassiosira weissflogii, and the standard deviation of the log-transformed EC50 values is 1.1. With an assessment factor of 1,000, this results in an MAAsw, eco of 1.2 x 10⁻⁵ ng free Ag+/L. This value can be recalculated using CHEAQS (version 2011.2) into values for dissolved silver in waters with different salinities Page 30 of 43.
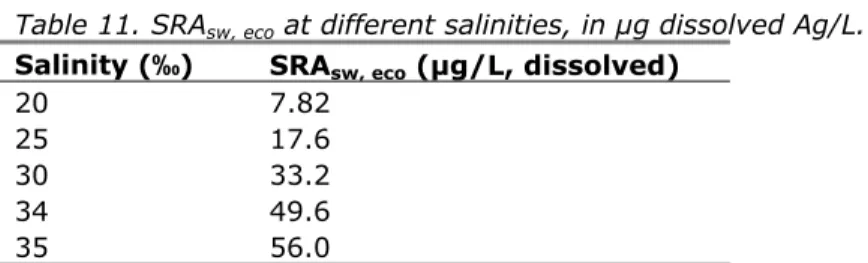
(32) RIVM Report 601714023. (assuming that all ions mentioned in section 4.2 vary in the same ratios with salinity): Table 10. Calculated MAAsw, eco at different salinities, in ng dissolved Ag/L. Salinity (‰) MAAsw, eco (ng/L, dissolved) 20 2.76 25 6.20 30 11.7 34 17.5 35 19.8 However, all these values are lower than the respective MPAfw, eco values at the same salinities. It is deemed unrealistic for the MAAsw, eco to be lower than the MPAsw, eco. Therefore the MAAsw, eco is set equal to the MPAsw, eco, which is 81 ng dissolved Ag/L at a salinity of 34‰. Since background concentrations in salt water are not available, this value is also valid as the MACsw, eco. 5.5. Derivation of NC Secondary poisoning is less critical than direct ecotoxicity and human consumption of fishery products is not relevant for silver. Derivation of the Negligible Concentration is therefore based on direct ecotoxicity. The NAfw, eco is set a factor of 100 lower than the MPAfw, eco at 0.10 ng Ag/L. The NAsw, eco is set a factor of 100 lower than the MPAsw, eco and depends on the salinity of the system for which the MPAsw and NAsw are derived, according to the values reported in Table 8. For Dutch North Sea water with a salinity of 34‰, the resulting NAsw is 0.81 ng dissolved Ag/L. In the absence of information on background concentrations, the NC is set equal to the NA. How the height of this value relates to the natural background concentration is not known. Thus, the value of the NC might be lower than the natural background concentration. When background concentrations are known, this value might be reconsidered.. 5.6. Derivation of SRAeco The SRAfw, eco is determined by the geometric mean of all available chronic endpoints for freshwater: 1.32 µg Ag/L. Because background concentrations are not available, this value is used as SRCfw, eco. Determination of the SRAfw, eco using acute data is not considered because of the complete chronic base set. For the marine environment, the SRAsw, eco derived using the geometric mean of all NOEC/EC10 values (Table 6) is 15.8 µg/L. However, because the salinity influences the toxicity of silver in marine waters, this approach is not preferable. When toxicity data are used which have been recalculated into concentrations of the free Ag+ ion, the SRC based on the free Ag+ ion would be 0.034 ng free Ag+/L. This value can be recalculated using CHEAQS (version 2011.2) into values for dissolved silver in waters with different salinities, as for the MPA and MAA:. Page 31 of 43.
(33) RIVM Report 601714023. Table 11. SRAsw, eco at different salinities, in µg dissolved Ag/L. Salinity (‰) SRAsw, eco (µg/L, dissolved) 20 7.82 25 17.6 30 33.2 34 49.6 35 56.0 In water with a salinity of 34‰, which is representative for Dutch North Sea water (Joop Bakker, Waterdienst, personal communication), the resulting SRAsw, eco is 49.6 µg dissolved Ag/L. Because information on background concentrations is not available, this value is also used as SRCsw, eco.. Page 32 of 43.
(34) RIVM Report 601714023. 6. Conclusions and recommendations. 6.1. Derived ERLs In this report, the risk limits Negligible Addition (NA), Maximum Permissible Addition (MPA), Maximum Acceptable Addition for ecosystems (MAAeco), and Serious Risk Addition for ecosystems (SRAeco) are derived for silver in fresh water and salt water. For silver, natural background concentrations are not available. The newly derived ERLs are lower than the current standards. For salt water, the ERLs depend strongly on the salinity of the system for which the ERL is used. The calculated ERLs at salinities of 15‰ and lower are deemed to be invalid because of the speciation behaviour at these lower salinities. At salinities <15‰, the ERLs for fresh water should be used. Because no data on background concentrations are available, for compliance check the effective background concentration is assumed to be zero and the MPA is used as the MPC. For the other ERLs, the same arguments apply. The MPCdw, hh already includes the background concentration. Table 12. Derived MPA, NA, MAAeco, SRAeco, silver. Salinity ERL (ng/L) (‰) MPA NA fresh water 10 0.10 salt water < 15 10 0.10 20 12.7 0.13 25 28.5 0.29 30 53.9 0.54 34 80.6 0.81 35 90.9 0.91. and MPCdw, hh values for dissolved. MAAeco 10 10 12.7 28.5 53.9 80.6 90.9. SRAeco 1,320 1,320 7,820 17,600 33,200 49,600 56,000. MPCdw, hh 18,000 n.a. n.a. n.a. n.a. n.a. n.a.. n.a. = not applicable.. 6.2. Monitoring data Monitoring data from 2006 and onwards show that, for dissolved silver, none of the samples contained concentrations above the reporting limit of 0.1 to 1 µg/L (Van Duijnhoven, 2011). The newly derived ERLs in this report are all below this reporting limit. It cannot be concluded that the ERLs will be met.. 6.3. Options for further research To enable a better compliance check, analytical techniques should be improved (reporting limits lowered) so that monitoring data can be compared to the risk limits. The current ERLs are derived based on dissolved silver; for salt water the derivation is based on free ion concentrations that are recalculated to a dissolved silver concentration at 34‰, which is considered most relevant for Dutch marine waters. It is assumed that ecotoxicological risks of nanosilver may partly be based on free ion concentrations of silver (see section 1.5). If these insights change, separate ERLs may have to be derived for nanosilver.. Page 33 of 43.
(35) RIVM Report 601714023. At present, no suitable and validated biotic ligand models for silver are available (see section 2.2). Once these models become available, the currently derived ERLs may have to be revised. For the marine environment, speciation calculations were used to calculate the ERLs for silver. At higher salinities, the reliability of these calculations is high, since mainly chloride complexes play a role. At lower salinities, however, the speciation behaviour becomes more complex and calculations are therefore less reliable. When more insight is gained into the speciation behaviour and uptake mechanisms of silver, the calculations may need to be redone, and may also become appropriate for systems with lesser amounts of chloride. The background concentration of silver is unknown (section 2.2), and according to the WFD methodology the derived standards are assumed to include the background concentrations in water (e.g., the MPA is assumed to be equal to the MPC). Once more knowledge on background concentrations is available, the background concentration should be added to the MPA and other ERLs to derive the final MPC.. Page 34 of 43.
(36) RIVM Report 601714023. Acknowledgement. We would like to thank Wilco Verweij for help with the CHEAQS model and Anja Verschoor, Willie Peijnenburg, Els Smit and Peter van Vlaardingen for their valuable suggestions during the various phases of writing this report.. Page 35 of 43.
(37) RIVM Report 601714023. Page 36 of 43.
(38) RIVM Report 601714023. References. Asante K, Agusa T, Mochizuki H, Ramu K, Inoue S, Kubodera T, Takahashi S, Subramanian A, Tanabe S. 2008. Trace elements and stable isotopes ( 13C and 15N) in shallow and deep-water organisms from the East China Sea. Environmental Pollution. 156: 862-873. Bielmyer GK, Grosell M, Paquin PR, Mathews R, Wu KB, Santore RC, Brix KV. 2007. Validation study of the acute biotic ligand model for silver. Environmental Toxicology and Chemistry. 26: 2241-2246. Campbell L, Norstrom R, Hobson K, Muir D, Backus S, Fisk A. 2005. Mercury and other trace elements in a pelagic Arctic marine food web (Northwater Polynya, Baffin Bay). Science of the Total Environment. 351-352: 247263. Cowan CE, Jenne EA, Crecelius EA. 1985. Silver speciation in seawater: The importance of sulfide and organic complexation. Marine and Estuarine Geochemistry. Chelsea, Michigan, USA, Lewis Publishers, Inc. Ctgb. 2004. Toelating zilverthiofosfaat. Ctgb, Wageningen, the Netherlands. EC. 2003. Technical Guidance Document on risk assessment in support of Commission Directive 93/67/EEC on risk assessment for new notified substances, Commission Regulation (EC) No 1488/94 on risk assessment for existing substances and Directive 98/8/EC of the European Parliament and of the Council concerning the placing of biocidal products on the market. Ispra, Italy: European Commission Joint Research Centre. EC. 2011. Technical guidance for deriving environmental quality standards. Common Implementation Strategy for the Water Framework Directive (2000/60/EC). Guidance Document No. 27. Brussels: European Communities. Erdreich L, Bruins R, Withey J. 1985. Drinking Water Criteria Document for Silver (Final Draft). . Washington D.C., USA: U.S. Environmental Protection Agency. Report no. EPA/600/X-85/040 (NTIS PB86118288). EU-ECB. 2000a. IUCLID dataset on silver. Brussels: European Commission European Chemicals Bureau. EU-ECB. 2000b. IUCLID dataset on silver nitrate. Brussels: European Commission - European Chemicals Bureau. EU-JRC. 2011. European chemical Substances Information System (ESIS). Fabrega J, Luoma SN, Tyler CR, Galloway TS, Lead JR. 2011. Silver nanoparticles: behaviour and effects in the aquatic environment. Environment International. 37: 517-531. Faust RA. 1992. Toxicity summary for silver. Oak Ridge, USA: Oak Ridge National Laboratory. Grasshof K. 1976. Methods of Sea Water Analysis, Weinheim, New York, USA, Verley Cheme. Hogstrand C, Wood CM. 1998. Toward a better understanding of the bioavailability, physiology, and toxicity of silver in fish: Implications for water quality criteria. Environmental Toxicology and Chemistry. 17: 547561. HSDB. 2011. Hazardous Substances Data Bank (HSDB). National Library of Medicine's Ikemoto T, Tu N, Okuda N, Iwata A, Omori K, Tanabe S, Tuyen B, I T. 2008. Biomagnification of the trace elements in the aquatic food web in the Mekong Delta, South Vietnam using stable carbon and nitrogen isotope Page 37 of 43.
(39) RIVM Report 601714023. analysis. Archives of Environmental Contamination and Toxicology. 54: 504-515. INERIS. 2006. Argent. Verneuil en Halatte: Institut National de l'EnviRonnement industriel et des rISques (INERIS). Report no. draft. Klimisch HJ, Andreae M, Tillman U. 1997. A systematic approach for evaluating the quality of experimental toxicological and ecotoxicological data. Regulatory Toxicology and Pharmacology. 25: 1-5. Kreule P, Van den Berg R, Waitz MFW, Swartjes FA. 1995. Calculation of humantoxicological serious soil contamination concentrations and proposals for interventiion values for clean-up of soil and groundwater: Thirds series of compounds. Bilthoven: National Institute for Public Health and the Environment (RIVM). Report no. 715810010. Lepper P. 2005. Manual on the Methodological Framework to Derive Environmental Quality Standards for Priority Substances in accordance with Article 16 of the Water Framework Directive (2000/60/EC). Schmallenberg, Germany: Fraunhofer-Institute Molecular Biology and Applied Ecology. Lide DR (Ed.) 2005. CRC Handbook of Chemistry and Physics, Boca Raton, USA, CRC Press. Ratte HT. 1999. Bioaccumulation and toxicity of silver compounds: A review. Environmental Toxicology and Chemistry. 18: 89-108. Scown T, R VA, Tyler CR. 2010. Review: do engineered nanoparticles pose a significant threat to the aquatic environment? Critical Reviews in Toxicology. 40: 653-670. Smit C, Wuijts S. 2012. Specifieke verontreinigende en drinkwater relevante stoffen onder de KRW. RIVM report number 601714022/2012. Bilthoven, the Netherlands: RIVM. SRC. 2011. Interactive PhysProp Database Demo. SRC. Van de Plassche EJ, Van den Hoop MAGT, Posthumus R, Crommentuijn T. 1999. Risk limits for boron, silver, titanium, tellurium, uranium and organosilicon compounds in the framework of EU Directive 76/464/EEC. Bilthoven, The Netherlands: National Institute of Public Health and the Environment (RIVM). Report no. 601501005. Van Duijnhoven N. 2011. Inzicht in landelijke kwaliteitsdata 2006-2009. Achtergronddocument t.b.v. update stoffenlijst MR monitoring. Utrecht, the Netherlands: Deltares. Van Vlaardingen PLA, Verbruggen EMJ. 2007. Guidance for the derivation of environmental risk limits within the framework of 'International and national environmental quality standards for substances in the Netherlands' (INS). Bilthoven, The Netherlands: National Institute of Public Health and the Environment (RIVM). Report no. 601782001. Verweij W. 2011. CHEAQS pro: http://home.tiscali.nl/cheaqs/index.html. Watanabe K, Monaghan M, Takemon Y, Omura T. 2008. Biodilution of heavy metals in a stream macroinvertebrate food web: Evidence from stable isotope analysis. Science of the Total Environment. 394: 57-67. Wood CM, La Point TW, Armstrong DE, Birge WJ, Brauner CJ, Brix KV, Call DJ, Crecelius EA, Davies PH, Gorsuch JW, Hogstrand C, Mahony JD, McGeer JC, O'Connor TP. 2002. Biological Effects of Silver. IN Andren AW, Bober TW (Eds.) Silver in the Environment: Transport, Fate and Effects. Pensacola, Florida, USA, SETAC. Yang X, Gondikas A, Marinakos S, Auffan M, Liu J, Hsu-Kim H, Meyer J. 2012. Mechanism of silver nanoparticle toxicity is dependent on dissolved silver and surface coating in Caenorhabditis elegans. Environmental Science & Technology. 46: 1119-1127. Page 38 of 43.
(40) RIVM Report 601714023. List of abbreviations. BAF BCF BMF DOC ECx ERL INS LC50 MACeco MACfw, ecor MACsw, eco Marine species. MPA MPC MPAbiota, secpois MPAbiota, secpois, fw MPAbiota, secpois, sw MPAfw MPCfw MPAsw MPCsw MPAfw, eco MPAsw, eco MPAfw, secpois MPAsw, secpois MPAwater, hh food MPAdw, hh NA NC NAfw NAsw NOEC NOAEC NOAEL SRAeco SRCeco. Bioaccumulation Factor Bioconcentration Factor Biomagnification Factor Dissolved Organic Carbon Concentration at which x-percent effect is observed Environmental Risk Limit International and National Environmental Quality Standards for Substances in the Netherlands Concentration at which 50 percent mortality is observed Maximum Acceptable Concentration for ecosystems Maximum Acceptable Concentration for ecosystems in fresh water Maximum Acceptable Concentration for ecosystems in the salt-water compartment Species that are representative for marine and brackish water environments and that are tested in water with salinity > 0.5‰. Maximum Permissible Addition Maximum Permissible Concentration Maximum Permissible Concentration in biota based on secondary poisoning Maximum Permissible Concentration in biota in fresh water based on secondary poisoning Maximum Permissible Concentration in biota in the salt-water compartment based on secondary poisoning Maximum Permissible Addition in fresh water Maximum Permissible Concentration in fresh water Maximum Permissible Addition in the salt-water compartment Maximum Permissible Concentration in the salt-water compartment Maximum Permissible Addition in fresh water based on ecotoxicological data Maximum Permissible Addition in the salt-water compartment based on ecotoxicological data Maximum Permissible Addition in fresh water based on secondary poisoning Maximum Permissible Addition in the salt-water compartment based on secondary poisoning Maximum Permissible Addition in fresh water and salt water based on consumption of fish and shellfish by humans Maximum Permissible Concentration in water used for abstraction of drinking water Negligible Addition Negligible Concentration Negligible Concentration in fresh water Negligible Concentration in the salt-water compartment No Observed Effect Concentration No Observed Adverse Effect Concentration No Observed Adverse Effect Level Serious Risk Addition for ecosystems Serious Risk Concentration for ecosystems Page 39 of 43.
(41) RIVM Report 601714023. SRAfw, eco SRAsw, eco TDI TGD WFD. Page 40 of 43. Serious risk Addition for fresh-water ecosystems Serious risk Addition for salt-water ecosystems Tolerable Daily Intake Technical Guidance Document Water Framework Directive (2000/60/EC).
(42) RIVM Report 601714023. Appendix 1 SCOPUS search profile. (((TITLE-ABS-KEY(bioassay* OR toxic* OR ecotoxic* OR mortalit* OR phytotox* OR reproduct* OR lethal* OR growth OR teratogen*) OR TITLE-ABS-KEY(ec50* OR ec20* OR ec10* OR lc50* OR lc20* OR lc10* OR noec* OR loec* OR matc OR tlm OR chv OR ecx OR bioassay*)) AND (TITLE-ABS-KEY(silver* OR nanosilver*) OR CASREGNUMBER(7440-22-4))) OR ((TITLE-ABSKEY(bioconcentrat* OR bioaccumulat* OR uptake OR depuration OR food-web OR trophic OR biomagnificat* OR bcf* OR baf* OR fwmf* OR tmf* OR bmf* OR bsaf*)) AND (TITLE-ABS-KEY(silver* OR nanosilver*) OR CASREGNUMBER(7440-22-4))) OR ((TITLE-ABSKEY(sorpt* OR adsorpt* OR freundlich OR koc* OR kd* OR kp* OR kf* OR partition-coefficient*)) AND (TITLE-ABS-KEY(silver* OR nanosilver*) OR CASREGNUMBER(7440-22-4)))) AND NOT ((TITLEABS-KEY({silver eel} OR {silver eels} OR {silver catfish} OR {silver perch} OR {silver carp} OR {silver birch}))) AND (LIMITTO(SUBJAREA, 'ENVI') OR LIMIT-TO(SUBJAREA, 'MULT')) AND (LIMITTO(PUBYEAR, 2010) OR LIMIT-TO(PUBYEAR, 2009) OR LIMITTO(PUBYEAR, 2008) OR LIMIT-TO(PUBYEAR, 2007) OR LIMITTO(PUBYEAR, 2006) OR LIMIT-TO(PUBYEAR, 2005) OR LIMITTO(PUBYEAR, 2004) OR LIMIT-TO(PUBYEAR, 2003) OR LIMITTO(PUBYEAR, 2002) OR LIMIT-TO(PUBYEAR, 2001) OR LIMITTO(PUBYEAR, 2000) OR LIMIT-TO(PUBYEAR, 1999) OR LIMITTO(PUBYEAR, 1998)) Last search performed on 11 January 2011.. Page 41 of 43.
(43) RIVM Report 601714023. Page 42 of 43.
(44) RIVM Report 601714023. Appendix 2. Detailed ecotoxicity data. The data are included with hard copies of the report as a CD. With digital versions, the data are included as a separate pdf file.. Page 43 of 43.
(45) Environmental risk limits for silver in water RIVM report 601714023/2012 C.T.A. Moermond | R. van Herwijnen. National Institute for Public Health and the Environment P.O. Box 1 | 3720 BA Bilthoven www.rivm.com.
(46) Acute toxicity of silver (Ag+) to freshwater organisms - Validity according to Klimisch (1997); only records with a validity of 1 or 2 (green) can be used for ERL derivation. - Bold records are selected for ERL derivation. These records are (1) valid; (2) based on measured dissolved concentrations of Ag+; (3) performed in water with DOC < 2 mg/L or labwater or filtered natural water or well water; (4) with a pH of 6-9; (5) EC50s/LC50s for acute and NOECs/EC10s for chronic studies. - When for a certain species, data for different endpoints are available (e.g., growth, reproduction) the data for the most sensitive endpoint are selected. If there are more data for the same enpdoint, the geometric mean is used. Species. Species properties. Analy- Test zed compound. Purity. Test type. Test water. Filtered. pH. y/n. TempeHardness rature [°C] [mg CaCO3/L]. DOC. Exp time. Criterion Test endpoint. mg/L. Value total [µg Ag+/L]. Value dissolved [µg Ag+/L]. Value unkn. Validity Notes / nominal [µg Ag+/L]. Reference. Bacteria Escherichia coli Escherichia coli Escherichia coli. mid log phase strain K12 strain K12. N N N. AgNO3 AgNO3 AgNO3. S S S. am dtw dtw. 37 rt rt. 30 min LC50 15 min LC50 15 min LC50. survival survival survival. 591000 310 260. 3 3 3. 1, 2 21 22. Matsumura et al. 2003 Bronk et al. 2001 Bronk et al. 2001. N. AgNO3. S. am. 37. 20 h. EC50. growth. 10668. 3. 23. Gupta et al. 1998. N. AgNO3. rw. 25. 0,029. 8h. EC100. inactivation. 10. 4. 1,24. Hwang et al., 2006. 6,8 6,8. Pseudomonas aeruginosa. strain J 53; log phase cells ATCC 10145; log-phase. Vibrio fischeri. Microtox assay. Y. AgNO3. Vibrio fischeri. Microtox assay. Y. AgNO3. S AAS standar d S AAS standar d S. Nitrifying bacteria. WWTP sludge. N. AgNO3. Nitrifying bacteria. WWTP sludge. N. AgNO3. Nitrifying bacteria. WWTP sludge. Y. S. 7. Nitrifying bacteria. WWTP sludge. Y. S. 7. Escherichia coli. Algae. Chlamydomonas reinhardtii. Chlamydomonas reinhardtii. exponential growth; 2x10^5 cells/mL exponential growth; 2x10^5 cells/mL. dw. 6,0. 15. 0. 0. 15 min NOEC. luminescence. 110. 2. 4,25,205,206. Fulladosa et al., 2005. dw. 7,0. 15. 0. 0. 15 min NOEC. luminescence. 110. 2. 4,25,205,206. Fulladosa et al., 2005. S. am. 7,5. EC50. nitrification. 810. 3. 1,2,26. Choi and Hu 2008. S. am. 7,5. EC50. nitrification. > 1000. 4. 27. Choi and Hu 2009. 21 h. IC50. O2 consumption. 20,8. 330. 4. 27,28. Cecen et al. 2010. 21 h. IC50. CO2 release. 26,5. 420. 4. 27,28. Cecen et al. 2010. Y. AgNO3. S. am. 7,45. 25. 65. 0. 1h. EC50. photosynthethic yield. 19,6. 2. 2,29,206. Navarro et al., 2008. Y. AgNO3. S. am. 7,45. 25. 65. 0. 2h. EC50. photosynthethic yield. 17,8. 2. 2,29,206. Navarro et al., 2008. am am am am am. 7. 15 40. 7,2. 40. 0 0 0. 6h 96 h 96 h 96 h. EC50 EC50 EC50 EC50 EC50. growth rate growth rate Cell density Cell density Cell density. 22,15 21,7 13. 3 3 2 2 2. 235. 7,2. 20 20 rt rt rt. 3,4,33,34,35,206 3,4,30,31,34,206 3,4,30,32,34,206. Hiriart-Baer et al., 2006 Lee et al., 2005 Kolts et al., 2009 Kolts et al., 2009 Kolts et al., 2009. 110m Ag. UTCC11 UTCC11 Y Y Y. AgNO3 AgNO3 AgNO3. F S S S S. Y. AgNO3. S. am. 7,2. rt. 40. 0. 96 h. EC50. Cell density. 6,47. 2. 3,4,30,33,34,206. Kolts et al., 2009. Y. AgNO3. S. am. 7,2. rt. 40. 0. 96 h. EC50. Cell density. 9,47. 2. 3,4,32,34,35,206. Pseudokirchneriella subcapitata. N. AgNO3. S. 10 d. EC50. growth. 70. 3. 2,36. Pseudokirchneriella subcapitata. N. Ag2SO4 AgNO3, AgSO4. S. 10 d. EC50. growth. 90. 3. 2,36. > 125. 4. Kolts et al., 2009 Schmittschmitt et al. 1996 Schmittschmitt et al. 1996 Schmittschmitt et al. 1996 in Ratte 1999. Chlamydomonas reinhardtii Chlamydomonas reinhardtii Chlorella vulgaris Chlorella vulgaris Chlorella vulgaris Pseudokirchneriella subcapitata Pseudokirchneriella subcapitata. ag. Pseudokirchneriella subcapitata. Pseudokirchneriella subcapitata Pseudokirchneriella subcapitata Pseudokirchneriella subcapitata. Y. AgS2O3. 1,60 1,29. EC50 formulation. 110m Ag ag. S. am. 7.8-8.2. 23. F. am. 7. 20. S. am. 20. 0. 72 h. 15 6h. EC50. growth rate. EC50. growth rate. EC50. growth rate. 2. 5,6,18,37,206,233. Oldersma et al 2003 in DAR silver thiosulphate. 2,30. 3. 235. Hiriart-Baer et al., 2006. 2,80. 3. 3,4. Lee et al., 2005.
(47) Macrophyta 100. 3. 1. 7500 1000. 3 3. 1 236. plant health frond number frond number growth rate growth rate. 270 <5 <5 7,5 8,5. 3 3 3 3 3. 1 1 1 1 1. EC50. frond number. 0,19. 3. 1, 2. Brown and Rattigan 1979 Brown and Rattigan 1979 Fjällborg et al., 2006 Brown and Rattigan 1979 Gubbins et al 2011 Gubbins et al 2011 Gubbins et al 2011 Gubbins et al 2011 Hutchinson and Czyrska 1975. N. AgNO3. S. am. 6,7. 24. 10. 24 h. EC50. photosynthesis. N N. AgNO3 AgNO3. S S. am dw. 6,7. 24 22. 10. 28 d 96 h. EC50 EC50. plant health root length. Lemna minor Lemna minor Lemna minor Lemna minor Lemna minor. N N N N N. AgNO3 AgNO3 AgNO3 AgNO3 AgNO3. S S S S S. am am am am am. 6,7 5,5 5,5 5,5 5,5. 24 24 24 24 24. 10. 28 d 7d 14 d 7d 14 d. EC50 EC50 EC50 EC50 EC50. Lemna minor. N. AgNO3. S. am. 6,8. 24. 3w. Elodea canadensis Elodea canadensis Lactuca sativa. seeds. Lemna minor. clone 7868. N. AgNO3. S. am. 5,5. 25. 166. 7h. EC50. frond abscission. 51. 3. 1. Topp et al. 2011. Lemna minor. clone 7766. N. AgNO3. S. am. 5,5. 25. 166. 7h. EC50. frond abscission. 65. 3. 1. Topp et al. 2011. Lemna minor. clone 9441. N. AgNO3. S. am. 5,5. 25. 166. 7h. EC50. frond abscission. 78. 3. 1. Topp et al. 2011. Lemna minor. clone 8389. N. AgNO3. S. am. 5,5. 25. 166. 7h. EC50. frond abscission. 94. 3. 1. Topp et al. 2011. Lemna minor. clone 7123. N. AgNO3. S. am. 5,5. 25. 166. 7h. EC50. frond abscission. 113. 3. 1. Topp et al. 2011. Lemna minor. clone 8292. N. AgNO3. S. am. 5,5. 25. 166. 7h. EC50. frond abscission. 168. 3. 1. Topp et al. 2011. Lemna minor. clone 8623. N. AgNO3. S. am. 5,5. 25. 166. 7h. EC50. frond abscission. 330. 3. 1. Topp et al. 2011. Lemna minor. clone 7194. N. AgNO3. S. am. 5,5. 25. 166. 7h. EC50. frond abscission. 525. 3. 1. Topp et al. 2011. Lemna minor. clone 7022. N. AgNO3. S. am. 5,5. 25. 166. 7h. EC50. frond abscission. 1294. 3. 1. Lemna minor. fronds. Y. AgNO3. S. 7d. EC50. growth rate. 30. 4. 17. Lemna minor. Y. AgNO3. S. 7d. EC50. growth rate. 81. 4. 17. N. AgNO3. S. am. 5,5. 25. 166. 7d. EC50. frond number. 81. 3. 238. Naumann et al., 2007. N. AgNO3. S. am. 5,5. 25. 166. 7d. EC50. weight. 30. 3. 238. Naumann et al., 2007. Lemna minor. fronds clone St; fronds clone St; fronds clone St; fronds. Topp et al. 2011 Naumann et al 2007 in REACH dossier Naumann et al 2007 in REACH dossier. N. AgNO3. S. am. 5,5. 25. 166. 7d. EC50. chlorophyll. 37. 3. 238. Naumann et al., 2007. Lemna paucicostata. strain 6746. N. AgNO3. S. am. 4,1. 25. 700. 7d. EC50. frond number. 970. 3. 1,2. Lemna paucicostata. strain 6746. N. AgNO3. S. am. 5,1. 25. 700. 7d. EC50. frond number. 1100. 3. 1,2. Lemna paucicostata. strain 6746. N. AgNO3. S. am. 6,1. 25. 120. 7d. EC50. frond number. 400. 3. 1,2. Lemna paucicostata. strain 6746. N. AgNO3. S. am. 7,1. 25. 120. 7d. EC50. frond number. 200. 3. 1,2. N. AgNO3. S. am. 6,8. 24. 3w. EC50. frond number. 0,92 3. N N. AgNO3 AgNO3. S S. am am. 30 30. 96 h 48 h. EC90 EC90. growth growth. 270 539. 3 3. LC50. mortality. 26. 4. Lemna minor Lemna minor. Salvinia natans Fungi Saccharomyces cerevisiae Saccharomyces cerevisiae. strain S288C strain S288C. 1,2. Nasu and Kugimoto 1981 Nasu and Kugimoto 1981 Nasu and Kugimoto 1981 Nasu and Kugimoto 1981 Hutchinson and Czyrska 1975. 38 38. Yang and Pon 2003 Yang and Pon 2003. Cnidaria Hydra sp.. Brooke et al., 1986 in Wood et al., 2002. Platyhelmintes Dugesia dorotocephala. Ag2S. 96 h. LC100. mortality. > 1000000. 4. 7. Dugesia dorotocephala. AgNO3. 96 h. LC50. mortality. 30. 4. 7. Dugesia dorotocephala. NaAgS2O3. 96 h. LC100. immobility. > 1300. 4. 7. Ewell et al. 1993 in Ratte 1999 Ewell et al. 1993 in Ratte 1999 Ewell et al. 1993 in Ratte 1999.
Afbeelding
+7


GERELATEERDE DOCUMENTEN
• Teken een horizontale lijn ten opzichte waarvan je de ligging van het zwaartepunt wilt bepalen.. • Geef deze lijn aan op
doorbuiging mag daarbij niet lager zijn dan 0,002*L voor wandbelaste constructies, 0,003*L voor vloeren en 0,004*L voor daken.. De veiligheidsfactor bedraagt hierbij
Bereken de gunstigste afmetingen waarbij het materiaalgebruik
Onderdeel “Knooppunt methode” en “Snede methode van Ritter”.. Toetsvragen
Mensen met een uitkering betalen vaak minder belasting en sociale premies dan werkenden. Voor werklozen
Wanneer producten worden geëxporteerd is er sprake van oneerlijke concurrentie in
g Zou de totale opbrengst van de heffing voor de overheid hoger of lager zijn als de vraag naar dit goed prijselastischer is.. Verklaar
