National Institute for Public Health and the Environment
P.O. Box 1 | 3720 BA Bilthoven www.rivm.com
PM
2.5Average Exposure Index
2009-2011 in the Netherlands
Colophon
© RIVM 2013
Parts of this publication may be reproduced, provided acknowledgement is given to: National Institute for Public Health and the Environment, along with the title and year of publication.
D. Mooibroek
J. Vonk
G.J.M. Velders T.L. Hafkenscheid
R. Hoogerbrugge Contact: D. Mooibroek
Centre for Environmental Quality dennis.mooibroek@rivm.nl
This investigation has been performed by order and for the account of the Directorate-General Environmental Protection, within the framework of project 680704 Reporting Air Quality
Rapport in het kort
Gemiddelde blootstellingsindex PM2.5 2009-2011 in Nederland
De luchtkwaliteit in Europa is de afgelopen dertig jaar substantieel verbeterd. Toch blijft luchtverontreiniging, en dan vooral fijn stof, een belangrijke
bedreiging voor de volksgezondheid. De laatste jaren is er meer aandacht voor de schadelijke effecten van kleinere deeltjes van fijn stof, bijvoorbeeld PM2.5
(deeltjes met een diameter tot 2,5 micrometer). Aangenomen wordt dat deze kleine deeltjes, zeker op de lange termijn, zeer schadelijk zijn voor de
gezondheid. In de Europese Richtlijn uit 2008 over de luchtkwaliteit en schonere lucht voor Europa zijn daarom specifiek grenzen gesteld aan de
concentratieniveaus van PM2.5. Zo moeten lidstaten onder andere de gemiddelde
blootstelling aan PM2.5 over een periode van drie jaar bepalen, de zogeheten
Average Exposure Index (AEI). Afhankelijk van de uitkomst zijn lidstaten vervolgens verplicht in 2018-2020 de gemiddelde blootstelling aan PM2.5 te
verlagen. Het RIVM heeft de AEI van 2009 tot en met 2011 berekend op basis van PM2.5-metingen op twaalf stedelijke achtergrondlocaties.
De gemiddelde blootstellingsindex (AEI) in de periode 2009-2011 is voor Nederland vastgesteld op 17,0 microgram per kubieke meter. Hieraan is een reductiedoelstelling gekoppeld van 15 procent. Om deze doelstelling te halen moet de gemiddelde blootstellingindex (AEI) in de stedelijke achtergrond in Nederland tussen 2018 en 2020 met circa 2,6 microgram per kubieke meter dalen.
Op basis van modelberekeningen met verschillende economische groeiscenario’s wordt een reductie berekend van 15 tot 17 procent voor 2018-2020. Daarmee zou Nederland voldoen aan de reductiedoelstelling. Door de marge in deze uitkomst en andere veel grotere onzekerheden in de modelberekening kan de te verwachten reductie zowel hoger als lager uitvallen. Het is belangrijk om de komende jaren te blijven volgen in welke mate de emissie en concentratie van PM2,5 afnemen. Indien nodig kunnen er dan extra maatregelingen worden
overwogen. Trefwoorden:
luchtkwaliteit, fijn stof, PM2.5, gemiddelde blootstellingsindex,
Abstract
PM2.5 Average Exposure Index 2009-2011 in the Netherlands
Over the last thirty years the air quality in Europe has improved substantially. Nevertheless, air pollution, and especially particulate matter, still remains a major threat to public health. In recent years, increasing attention has focused on the adverse effects of the “fine particles” of particulate matter, such as PM2.5
(particles with a diameter of <2.5 µm). These small particles are considered to be very harmful to human health, in particular over the long term. The European Directive on ambient air quality and cleaner air for Europe, which entered into force in 2008, establishes specific limits on the concentration levels of PM2.5.
Among other things the Directive requires that each Member State determine the average exposure to PM2.5 over a three-year period, the so-called Average
Exposure Index (AEI). Depending on the outcome, Member States are then obliged to decrease the average exposure to PM2.5 in 2018–2020. The National
Institute for Public Health and the Environment (RIVM) has therefore measured PM2.5 levels at twelve urban background locations in the period 2009–2011 and
calculated the AEI based on these measurements.
For the Netherlands, the AEI in the period 2009–2011 has been set at 17.0 micrograms per cubic meter. A reduction target of 15% has been linked to this value. To achieve this target, the AEI in the urban background in the
Netherlands between 2018 and 2020 has to decrease by approximately 2.6 micrograms per cubic meter.
Model calculations using different economic growth scenarios predict a reduction ranging from 15 to 17% for the period 2018–2020, indicating the Netherlands should meet the reduction target. However, due to the margin in the model calculations as well as other, much larger uncertainties in these calculations, the expected reduction can ultimately be either higher or lower. It is therefore important that the extent to which annual emissions and concentrations of PM2.5
decrease are monitored on an annual basis. If necessary, additional measures to lower PM2.5 concentration can then be considered.
Keywords:
air quality, particulate matter, PM2.5, average exposure indicator, reduction
Contents
Introduction—6
1
PM2.5 measurements in the Netherlands: 2009-2011—7
1.1
PM2.5 measuring methods—7
1.2
PM2.5 sampling points—8
1.3
Development of the annual averaged PM2.5 concentrations—10
1.4
Large scale PM2.5 concentration map (2009-2011)—11
2
PM2.5 Average Exposure Indicator—14
2.1
Calculation of the Average Exposure Indicator—16
2.1.1
Calculation of the official Dutch AEI—17
2.1.2
Alternative method 1: Air Quality Directive—20
2.1.3
Alternative method 2: AQUILA—20
2.2
National exposure reduction target—22
2.3
Comparison of results from the different calculation methods—22
2.4
Three-year running mean (AEI) for 2010-2012—24
2.5
Uncertainty of the AEI2009-2011 in the Netherlands—24
3
Conclusions—26
4
Recommendations—27
References—28
Appendix A: Minimum number of urban background sites—30
Appendix B: Overview of extended annual PM2.5 averaged concentrations for 2008-2012 per station—31
Appendix C: Equivalence of measurement results after moving sample locations— 33
Appendix D: Equivalence of measurement results of PM2.5 for the MetOne BAM 1020—38
Introduction
While air quality in Europe has improved substantially over the past decades, air pollution still poses a significant threat to human health (EEA, 2007). Health effects of air pollution are dominated by particulate matter (PM), both PM2.5 and
PM10. Short-term exposure to PM has frequently been associated with
inflammatory reactions in the lung, respiratory symptoms, adverse effects on the cardiovascular system and increases in hospital admissions and mortality (e.g. Lippmann and Chen, 2009; Brunekreef and Holgate, 2002). However, as the long-term exposure to PM is posed to cause a substantial reduction in life expectancy, it is thought to have a larger significance to public health than the short-term effects (Brunekreef and Holgate, 2002).
In the current EU Directive (2008/50/EC) on ambient air quality and cleaner air for Europe (EU, 2008) an annual mean PM2.5 concentration of 25 µg/m3 has
been set as target value to be met in 2010 and as limit value to be met in 2015. The new directive further introduces additional PM2.5 objectives like the Average
Exposure Index (AEI) and the National Exposure Reduction Target (NERT). The AEI is based upon PM2.5 measurements in urban background locations in the
Member State. The EU Directive states that the AEI should be assessed as a three-calendar year running annual mean averaged over all suitable urban background locations. The EU Directive provides no calculation rules for the AEI, each Member State is free to use its own proposed methods. Using the AEI, the NERT, aiming at a reduction of the AEI for 2020, is established.
In 2007, based upon draft versions of the 2008/50/EC Directive, a study was started to inventory the available knowledge of PM2.5 in the Netherlands and the
consequences of the proposed EU Directive (Matthijssen and Ten Brink, 2007). The authors estimated an exposure reduction of 11-16% between 2010 and 2020 based upon the applied legislation and the known additional measures in 2007.
Also in 2007, a joint collaboration by the National Air Quality Monitoring Network (NAQMN) and two local monitoring networks, operated by GGD Amsterdam and DCMR Environmental Protection Agency (DCMR), was started to establish a PM2.5
network. Since then, extensive work has been done on the selection of
automatic instruments (Van Arkel et al., 2008). Initially, all PM2.5 measurements
were started using the reference measurement method, which has been used up to 2012 in the NAQMN.
This report describes the results of the PM2.5 measurements in the Netherlands
for the period 2008-2012. It also compares three different calculation methods for the AEI and establishes the effect of these different methods on the NERT.
1
PM
2.5measurements in the Netherlands: 2009-2011
Measurement requirements for particulate matter, specifically PM10, have been
mandatory since the first EU Air Quality “Daughter” Directive (1999/30/EC). PM10 is used to denote particulate matter with an aerodynamic diameter smaller
than 10 µm.
In 2008, all existing air quality directives, with the exception of Directive 2004/107/EC, were merged and revised into the new EU Directive 2008/50/EC. Additionally, new measurement requirements and limit values were added for the part of particulate matter with an aerodynamic diameter smaller than 2.5 µm, PM2.5.
There are two main reasons to monitor PM2.5 as well as PM10. In the first place,
PM2.5 is assumed to be more directly linked to health effects because these
smaller particles penetrate deeper into the respiratory system. Secondly, the contribution of natural sources, like sea salt and crustal materials, to PM2.5 is
much smaller compared to the contribution to PM10. This means that by
controlling the emissions caused by human activities (anthropogenic emissions) the PM2.5 levels can be more effectively influenced.
The addition of PM2.5 as a component of interest to the EU Directive has led to
the development of a PM2.5 monitoring network, as has been recently described
by Van der Swaluw and Hoogerbrugge (2012).
1.1 PM2.5 measuring methods
PM measurement in general can be divided into two different approaches: the reference method and the use of automated measuring instruments. The reference method consists of the collection of PM by drawing air through a filter and weighing the amount of PM collected. The reference method for measuring PM is a European Standard and is valid in the Netherlands as a NEN standard (NEN-14907, 2005).
The majority of the European air quality networks use automated measuring instruments once equivalence with the reference method is established. Furthermore, the requirement to assess a reduction target of 15 or 20% between 2010 and 2020 is an important parameter in the selection of
measurement methods. This requirement implies that candidate measurement methods must be stable within 10-20 % over a decade. Previous experience with PM10 monitoring shows that such accuracy is not easy to obtain.
In 2007, prior to the start of the PM2.5 measurements in the Netherlands, a joint
collaboration by the RIVM, GGD Amsterdam and DCMR Environmental Protection Agency (DCMR) reviewed the performance of the available automatic
measurements instruments (Van Arkel et al., 2007; Van Arkel et al., 2008). In the beginning of the review process it already became clear that at the time such accuracy could not be guaranteed by available automatic monitors. Initially all PM2.5 measurements were therefore carried out using the reference method.
After careful reviewing, a harmonized selection for the MetOne BAM automatic monitor was made by all monitoring networks involved (Van Arkel et al., 2008). In the Netherlands, both local monitoring networks operated by the GGD Amsterdam and DCMR currently perform automated PM2.5 measurements using
the MetOne BAM. In both cases, equivalence with the reference method has been established. More information can be found in Appendix D. The National Air
Quality Monitoring Network (NAQMN) still measures PM2.5 concentrations using
the reference method and has under review the equivalence for the MetOne BAM with the reference method.
In general, the reference method has a lower uncertainty of the measurement results compared to the uncertainty of automatic measurement methods. However, using the reference method also has its disadvantages, for example a higher risk of sample loss. More information on this subject is given in section 2.1.1.
Automated methods are not perfect either; the drying of air by heating used by these methods could potentially lead to the evaporation of semi-volatile
components in PM. This might ultimately lead to lower reported measurement results. Over the last few years a lot of research has been conducted to solve this evaporation problem.
1.2 PM2.5 sampling points
Based upon the first Daughter Directive (1999/30/EC) the Netherlands was divided into three geographical zones (north, middle and south) and six agglomerations (Van Breugel en Buijsman, 2001).
For the annual average of PM2.5 upper and lower assessment thresholds are set
in the EU Directive. These thresholds are needed to establish the number of sampling points. After establishing if the (multi-year) annual PM2.5 average is
either above the upper threshold, between the upper and lower threshold or below the lower threshold, the number of required monitoring stations for PM2.5
in each agglomeration/zone can be calculated using the number of inhabitants within the agglomeration/zone. At the time of the assessment (2008), not enough PM2.5 measurements were available to perform the assessment directly
for PM2.5.
However, the EU Directive contains combined measurement requirements for both PM10 and PM2.5. Based upon the PM10 measurements for 2005-2009 and the
number of inhabitants (CBS, 2005) in each of the zones and agglomerations, a minimum of 60 particulate matter (PM10 and PM2.5) monitoring sites is required.
(Van der Swaluw and Hoogerbrugge, 2012).
Additionally, the EU Directive states in Annex V A.1. that “the total number of
PM2,5 and PM10 sampling points in a Member State required [...] shall not differ by more than a factor of 2”. This means that from those 60 combined locations
at least 20 should be PM2.5 measurements locations (Van der Swaluw and
Hoogerbrugge, 2012). These 20 measurement locations are not directly related to the minimum urban background locations needed to establish the Average Exposure Indicator (AEI), although the measurement locations may coincide (EU Directive, Annex V B).
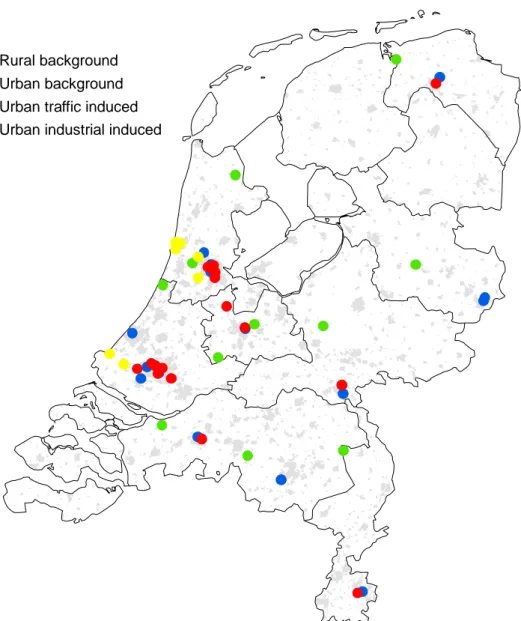
Figure 1 An overview of active PM2.5 sampling locations in the Netherlands for the period 2009-2010 operated by the NAQMN, GGD Amsterdam and DCMR. The urban background locations used for the calculation of the AEI are given in blue. Due to the resolution of the map some locations may actually overlap other locations (e.g. Amsterdam and Rotterdam)
In order to establish the minimum number of urban background locations needed for the determination of the AEI it is required to look at the sum of the inhabitants in agglomerations and additional urban areas in excess of 100,000 inhabitants. One urban background location should be added for every million inhabitants found in this total sum.
In order to establish the additional urban areas needed for the AEI calculation we looked at the number of inhabitants for 2005 (CBS, 2005) in each
municipality and selected those with a number of inhabitants larger than 100,000 (Appendix A: Table 11). In 2005 the total sum of inhabitants in the agglomerations and the defined additional urban municipalities is slightly above 7 million. This means at least 8 sampling points on suitable urban background locations are required to calculate the AEI (Van der Swaluw and Hoogerbrugge,
Rural background
Urban background
Urban traffic induced
Urban industrial induced
2012). The number of inhabitants in the Netherlands has increased with approximately 300,000 over the period 2000–2010, so there is no need to change the minimum number of urban background sampling points. The year 2008 marks the start of a PM2.5 monitoring network using at least 8 monitoring
locations.
However, using more urban background sampling points has several advantages, like giving a better estimation of the AEI due to the increased measurement data, and allowing for easier distribution across the Netherlands. Using more sampling points will also make the calculation of the AEI more robust. To establish the development of PM2.5 concentrations until 2020 requires
measurements for nearly a decade.
Figure 1 shows an overview of all active PM2.5 sampling locations in the
Netherlands for the period 2009-2010 operated by the NAQMN, GGD Amsterdam and DCMR.
It is not unlikely sampling points will be either closed or moved for a variety of reasons during this decade. Even in a shorter time frame, 2009-2011, two urban monitoring stations had to be moved to nearby new locations in the vicinity:
In 2009 station NL00242 has been replaced by station NL00247 (both in Veldhoven).
In 2010 station NL00820 has been replaced by station NL00821 (both in Enschede).
For the calculation of the AEI over 2009-2011 we have combined the data of the pairs of stations in Veldhoven and Enschede which left us with 12 sampling points in total. The number of used sampling points is above the minimum required urban background sampling points. Detailed information about the used urban background sampling points can be found in chapter 2.
1.3 Development of the annual averaged PM2.5 concentrations
Since 2004 up until 2009 PM2.5 measurements were carried out on four locations
in the National Air Quality Monitoring Network (NAQMN) using TEOM-monitors. These four locations consisted of the rural background locations Vredepeel, De Zilk and Kollumerwaard and the urban traffic induced station Vlaardingen. These measurements were calibrated using the reference method, but failed to meet the required uncertainty standards.
Since 2008, measurements of PM2.5 concentrations in the NAQMN are carried out
using the reference method using the Derenda PNS 16T6.1 monitor (Ingenieurbüro Norbert Derenda, Stahnsdorf, Germany) at 24 stations
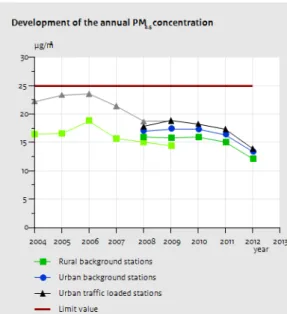
(Mooibroek et al., 2012). Figure 2 shows the development of annual averaged PM2.5 concentrations, the measurements in the period 2004-2009 are shown in a
Figure 2 The development of the annual PM2.5 concentrations as measured by the NAQMN. Measurements from 2004-2009 have been performed by using TEOM and are therefore denoted in a lighter colour. From 2008 onwards the reference method was used to measure the PM2.5 concentration.
Note: the results for PM2.5 annual averages for 2008 using the reference method
should be seen as indicative. PM2.5 measurements started during the course of
2008, leading to a reduced sample size and therefor a higher uncertainty.
1.4 Large scale PM2.5 concentration map (2009-2011)
Within the framework of nature and environmental policies the National Institute of Public Health and the Environment (RIVM) annually publishes maps with large scale concentrations of several air pollutants in the Netherlands (also known as GCN). Since 2008 PM2.5 has been added to the calculation of these large scale
concentration maps. The maps are based on a combination of measurements and model calculations. They are intended to give a comprehensive picture of air quality and deposition in the Netherlands for both years in the past and in the future using scenarios for economic growth and the Dutch and European environmental policies (Velders et al., 2012).
Velders et al. (2012) used the averaged modelled PM2.5 concentration for 2009,
2010 and 2011 at the six urban agglomerations as an indicator for the Average Exposure Indicator (AEI2009-2011). The average PM2.5 concentration over these
three years in the agglomerations is 16.9 µg/m3, which corresponds with a
National Exposure Reduction Target of 15%. Figure 3 shows the averaged modelled PM2.5 concentrations in 2009-2011.
Figure 3 Three-year average PM2.5 concentration based upon the yearly calculations for 2009, 2010 and 2011.
Based upon the 2012 scenario with current and proposed legislation, the average concentration in the agglomerations was expected to decrease with 19% between AEI2009-2011 and AEI2018-2020 (Velders et al., 2012). In the
calculations however, indicative emission ceilings for 2020 were used, and in May 2012 new emission ceilings were set within the framework of the Gothenburg Protocol. These ceilings for NOx, SO2, NH3 and PM2.5 are higher
compared to the indicative ceilings, leading to a reduced reduction of PM2.5
concentrations between AEI2009-2011 and AEI2018-2020 of approximately 15%
(Velders et al., 2013).
The 15% reduction rate between AEI2009-2011 and AEI2018-2020 is calculated based
on a scenario with an economic growth in the Netherlands of about 2.5% per year until 2020, including current and proposed legislation. If a lower estimation of economic growth (about 0.9% per year until 2020) is used, the reduction rate
Averaged modelled PM
2.5concentration in 2009-2011
Concentration (µg/m3) 5.0 5.0 - 7.5 7.5 - 10.0 10.0 - 12.5 12.5 - 15.0 15.0 - 17.5 17.5 - 20.0 20.0 - 22.5 22.5 - 25.0 > 25.0
increases by 2 percentage points, from 15% to 17% between the AEI2009-2011
and AEI2018-2020. The effects of proposed national policies on the reduction rate
are small (0.5 percentage point) (Velders et al., 2013).
Earlier work by Matthijssen and Ten Brink (2007) estimated a reduction of 11-16% between 2010 and 2020 for the applied legislation and additional measures in 2007.
While this reduction still indicates the Netherlands can meet the (expected) National Exposure Reduction Target of 15% in 2020 it is recommended to continue monitoring the trends in PM2.5 concentrations between 2010-2020.
2
PM
2.5Average Exposure Indicator
The EU Directive (2008/50/EC) on ambient air quality and cleaner air for Europe (EU, 2008) contains several PM2.5 objectives for each Member State. The EU
Directive has set a target value for the annual mean PM2.5 concentration of
25 µg/m3 for 2010. This target value is also set as a limit value to be met in
2015. Additionally, other PM2.5 objectives have been introduced to aim at a
reduction of the Average Exposure Indicator (AEI). The AEI is defined in article 2.20 of the EU Directive as “‘average exposure indicator’ shall mean an average
level determined on the basis of measurements at urban background locations throughout the territory of a Member State and which reflects population exposure. It is used to calculate the national exposure reduction target and the exposure concentration obligation;”
As can be seen in the definition of AEI the indicator is based upon PM2.5
measurements in urban background locations in the Member State. The EU Directive states that the AEI should be assessed as a three-calendar year running mean averaged over all suitable urban background locations. In compliance with the EU Directive, the Netherlands has used the annual mean concentrations of the years 2009, 2010 and 2011 to calculate the AEI. Table 1 gives an overview of the selected urban background locations available in this timeframe.
Table 1 Overview of the available urban background locations during 2009-2011. Besides the EU-code and name the table also specifies the network
operating the location and the measurement method.
Code Name Network Method
NL00137 Heerlen-Deken Nicolayestraat NAQMN Reference
NL00241 Breda-Bastenakenstraat NAQMN Reference
NL00242 Veldhoven-Rapportstraat NAQMN Reference
NL00247 Veldhoven-Europalaan NAQMN Reference
NL00404 Den Haag-Const. Rebecquestraat NAQMN Reference
NL00418 Rotterdam-Schiedamsevest NAQMN Reference
NL00643 Utrecht-Griftpark NAQMN Reference
NL00742 Nijmegen-De Ruyterstraat NAQMN Reference
NL00820 Enschede-Espoortstraat NAQMN Reference
NL00821 Enschede-Winkelhorst NAQMN Reference
NL00938 Groningen-Nijensteinheerd NAQMN Reference
NL00014 Amsterdam-Vondelpark GGD Amsterdam Both 1
NL00701 Zaandam-Wagenschotpad GGD Amsterdam Both 1
NL00494 Schiedam-Alphons Arienstraat DCMR Reference
1 In 2009 measurements using the reference method, 2010 (uncorrected) and 2011
(corrected, 0.96 factor, See Appendix D) using automatic measurements (MetOne BAM). As mentioned in section 1.2 two monitoring stations (Veldhoven and Enschede) had to be moved to a different location within the period 2009–2011. In order to examine the potential effects of these replacements several comparisons have been performed. In Appendix C we have established the effects on both the full dataset, including estimated values and the simultaneous available
measurements (approximately one month). For both comparisons we conclude that the measured PM2.5 concentration after the movement of two stations on
Therefore, the daily PM2.5 measurements on both sampling sites in Veldhoven for
2009 and Enschede in 2010 have been combined for this analysis. In case there was an overlap between the two sampling locations, the average daily PM2.5
concentration was calculated. Based on the available data, the combined data capture on Veldhoven in 2009 and Enschede in 2010 was determined. In both cases the data capture was below the recommended data capture of ≥ 90%. Whereas the measurements in the NAQMN are all performed using the reference method during the 2009-2011 period, the GGD Amsterdam has switched to the automatic measurement method using the MetOne BAM. Equivalence tests for the results from both the GGD Amsterdam and the DCMR show the
measurements conducted with the MetOne BAM 1020 are equivalent to those collected using the reference method when the MetOne BAM 1020 results are multiplied by a factor 0.96. Both MetOne BAM and reference results were available for the urban background location at Schiedam as operated by DCMR. In this study we have used the results of the reference method (see Table 1). However, since equivalence of both methods was not available for the 2010 results, the GGD Amsterdam has used a factor 1.00 (uncorrected) to report the PM2.5 measurement results for 2010. Since these values have been reported
prior to this report, we have used these uncorrected values. For the measurements conducted in 2011, the 0.96 factor was used to correct the MetOne BAM results.
With the combined sampling locations in both Veldhoven and Enschede and the additional urban background stations from GGD Amsterdam and DCMR the total number of stations used in the period 2009-2011 amounts to 12 (see Figure 4).
Figure 4 Available urban background PM2.5 locations used in the calculation of the AEI during 2009-2011.
2.1 Calculation of the Average Exposure Indicator
The EU Directive gives no further specification of the calculation method for the calculation of the AEI. This means each Member State can derive their own calculation method. In this report, we describe the method used by the Netherlands to calculate the AEI for the years 2009-2011. This value has been previously reported in the 2012 edition of the annual report (questionnaire) on air quality assessment and management. Additionally, two alternative
approaches for calculating the AEI are discussed, one based upon the
information available in the EU Directive and the other based upon a guidance document provided in 2012 by the Air Quality Reference Laboratories (AQUILA).
Urban Background
2.1.1 Calculation of the official Dutch AEI
The concentrations of PM2.5 in ambient air used for the calculation of the AEI in
the Netherlands are primarily determined using the reference method (filter sampling + weighing). A major advantage of using the reference method is the lower uncertainty of the measurement results compared to the uncertainty of automatic measurement methods. However, using the reference method also has its disadvantages. In the National Air Quality Network data collection of the samples using the reference method is performed every 2 weeks. This poses the risk that in case of failure up to 2 weeks of samples may be lost.
The loss of data could ultimately result in problems meeting the data capture criterion of ≥ 90%. Additionally, failing to meet the data capture of ≥ 90% leads to difficulties in establishing a valid annual averaged concentration due to possible imbalance in the measurements. Because of the necessity to determine an accurate exposure indicator for PM2.5 in the Netherlands, failing to meet the
data capture criteria was deemed to be unacceptable.
Other EU Member States and AQUILA (see 2.1.3) have proposed to use
weighting of the results of sites with a low data capture. However, this may lead to problems when the weights used are not evenly distributed over the whole range of average concentrations observed.
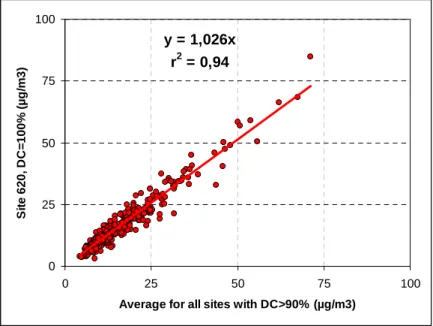
Therefore, the Netherlands have developed an alternative approach based upon the strong correlation between PM2.5 concentrations over the Netherlands, as
exemplified by Figure 5. This feature, in combination with the relatively low measurement uncertainty, allows the use of an innovative mathematical solution to estimate missing data. This approach may be used by other
networks/regions/member states for which a good correlation between concentration levels of PM2.5 exists.
Figure 5 Correlation between average PM2.5 concentrations in 2009 for all sites with data capture ≥ 90% and the concentrations measured at one site with 100% data capture.
In order to construct complete data sets for the calculation of the annual average concentration for a site, a logical extension of the available data is
y = 1,026x r2 = 0,94 0 25 50 75 100 0 25 50 75 100
Average for all sites with DC>90% (µg/m3)
S it e 620, D C = 100% ( µ g /m 3 )
applied. This extension is based on the assumption that the concentration on day i for site j is proportional to the average of all measured concentrations on that particular day. Since the measured concentrations, xi, for site j may be
different from the average of all sites the contribution will be scaled by this proportion. Mathematically the extension (expectation value) can be calculated using the expression:
̅
̅
̿
where ̅ ∑ , ̅ ∑ 365 and ̿ ∑ ∑ 365 ∙In these equations k is the number of sites and 365 the number of days in each of the years 2009-2011. In the calculation of the averages the expectation values are used to substitute the missing values. In order to solve the above equation, a problem exists in that the averages used to calculate the expectation values are dependent on the expectation values themselves. Such a recursive relation can be solved by an initial calculation with some realistic starting values. Using this, better expectation values will be obtained which will be used for the second iteration and so on. After convergence a consistent and complete data set is obtained. For this the “iteration on” setting in the software package Microsoft Excel is used.
The application of this approach will introduce an additional uncertainty
contribution. The additional uncertainty is calculated by applying the approach to calculate values of for all days for which measurement results are available:
∑
with = number of reference measurement data on location j
= uncertainty of model results on location j
With this model uncertainty, an upper limit for the uncertainty in the annual average can be estimated by summation on the uncertainty in the available reference measurements and the necessary model values:
̅ 1
365
with = uncertainty of the reference method on location j
= number of necessary model results on location j
Note that this estimate is really an upper limit for the uncertainty because non-random uncertainties, which can level off in the averaging, are assumed in the propagation of the model uncertainty. The found uncertainty estimate can be multiplied by a factor 2 to calculate the expanded uncertainty of the annual average. The expanded uncertainty should be ≤ 25% on the level of the limit value (25 µg/m3 for PM
2.5).
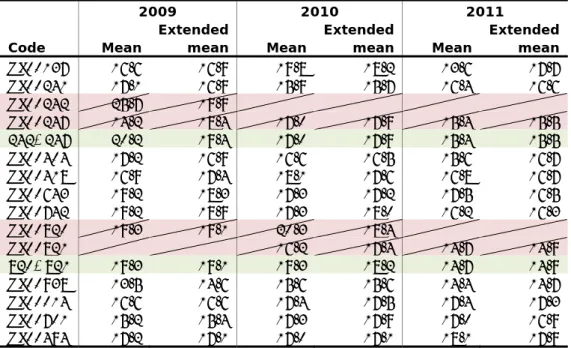
Table 2 gives an overview of the selected urban background locations with the
upon both measurements and estimates of missing measurements. The table also displays the combined annual means and combined extended annual means for the combined sites in Veldhoven and Enschede (light green). The individual stations in Veldhoven and Enschede are displayed in light red and the annual means have been crossed out. Data from these individual stations has not been used in the calculations.
An overview of extended annual PM2.5 averaged concentrations for the
2008-2012 time period for all available stations are given in Appendix B: Table 12.
Table 2 Overview of selected urban background locations containing the mean (based upon measurements) and the extended mean (based on measurements and estimation of measurements for missing data) for 2009, 2010 and 2011. The data available in the red rows has not been used
for the calculation of the AEI. The green rows contains the combined values for the sampling locations at Veldhoven and Enschede.
Code
2009 2010 2011
Extended Extended Extended
Mean mean Mean mean Mean mean
NL00137 16.6 16.9 19.8 18.2 13.6 17.7 NL00241 17.1 16.9 15.9 15.7 16.4 16.6 NL00242 25.7 19.9 NL00247 14.2 18.4 17.0 17.9 15.4 15.5 242+247 20.2 19.4 17.0 17.9 15.4 15.5 NL00404 17.2 16.9 16.6 16.5 15.6 16.7 NL00418 16.9 17.4 18.1 17.6 16.8 16.7 NL00643 19.2 18.3 17.3 17.2 17.5 16.5 NL00742 19.2 18.9 17.3 18.0 16.2 16.3 NL00820 19.3 19.1 20.3 18.4 NL00821 16.2 17.4 14.7 14.9 820+821 19.3 19.1 19.3 18.2 14.7 14.9 NL00938 13.5 14.6 15.6 15.6 14.4 14.7 NL00014 16.6 16.6 17.4 17.5 17.4 17.3 NL00701 15.2 15.4 17.3 17.9 17.0 16.9 NL00494 17.2 17.1 17.0 17.1 18.1 17.9
Based upon the extended annual PM2.5 concentration the AEI as displayed in
Table 3 can be calculated.
Table 3 The yearly AEI and the three-year average official Dutch AEI for the years 2009-2011.
2009 2010 2011
Yearly AEI 17.3 17.3 16.5
AEI based on the average of 2009-2011 17.0
The AEI2009-2011 calculated here has been reported in the 2012 version of the
annual report (questionnaire) on air quality assessment and management as required by Directive 2004/461/EC.
2.1.2 Alternative method 1: Air Quality Directive
For this method we assume the general data quality objectives for PM apply for the calculation of the AEI. This means annual means, calculated from validated daily results, at urban background locations are only used in the AEI if the minimum data capture is ≥90% and the uncertainty of the measurements is ≤ ± 25%. PM2.5 measurements at urban background locations not fulfilling these
requirements will not be considered in the calculation of the AEI.
Table 4 gives an overview of the selected urban background locations with the annual averages and data capture for each of the years 2009, 2010 and 2011. The table also displays the annual averages and data capture for the combined sites in Veldhoven and Enschede (light green). Calculated annual means with a data capture < 90% have been removed from the calculations and are crossed out in the table.
Table 4 Overview of selected urban background locations containing the means (based upon measurements) and data capture for 2009, 2010 and 2011. Annual means at sample locations with a data capture < 90% are
displayed crossed out and were omitted from the calculation. The green rows contain the combined values for the sampling locations at Veldhoven and Enschede.
Code
2009 2010 2011
Mean Capture Mean Capture Mean Capture
NL00137 16.6 92% 19.8 74% 13.6 61% NL00241 17.1 95% 15.9 97% 16.4 94% 242+247 20.2 84% 17.0 91% 15.4 95% NL00404 17.2 95% 16.6 94% 15.6 90% NL00418 16.9 89% 18.1 85% 16.8 87% NL00643 19.2 71% 17.3 98% 17.5 87% NL00742 19.2 95% 17.3 90% 16.2 99% 820+821 19.3 92% 19.3 85% 14.7 95% NL00938 13.5 84% 15.6 95% 14.4 92% NL00014 16.6 93% 17.4 98% 17.4 95% NL00701 15.2 96% 17.3 91% 17.0 99% NL00494 17.2 98% 17.0 97% 18.1 92%
The AEI is calculated by averaging the annual averages of all stations with a data capture ≥ 90% for each year and is shown in Table 5.
Table 5 The yearly AEI and the three-year average AEI calculated using the method based upon the Air Quality Directive.
2009 2010 2011
Yearly AEI 17.3 17.1 16.1
AEI based on the average of 2009-2011 16.8
2.1.3 Alternative method 2: AQUILA
During the course of 2012, the Air Quality Reference Laboratories (AQUILA) developed a guidance document for the calculation of the AEI. Initially this guidance document uses the same assumptions for data quality objectives based upon the EU Directive. However, the authors propose a less stringent setting for the data capture to allow for a large number of stations to be included in the AEI calculation. This should provide greater representativeness of the selected
locations across the Member State (AQUILA, 2012). The guidance document recommends selected stations being used to measure PM2.5 concentrations
should have a data capture ≥ 90% and a measurement uncertainty of ≤ ± 25%. In case the data capture is ≥ 75% and the measurement uncertainty is still ≤ ± 25% it is recommended to use this data.
Additionally, the guidance document also provides recommendations for data with a data capture below 50% and between 50 and 75%. This information is not applicable for the situation in the Netherlands during 2009, 2010 and 2011. Table 6 gives an overview of the selected urban background locations with the annual averages and data capture for each of the years 2009, 2010 and 2011. The table also displays the annual averages and data capture for the combined sites in Veldhoven and Enschede (light green).
Table 6 Overview of selected urban background locations containing the mean (based upon measurements) and data capture for 2009, 2010 and 2011. Annual means at sample locations with a data capture < 75% are crossed
out and were omitted from the calculation. The green rows contains the combined values for the sampling locations at Veldhoven and Enschede.
Code
2009 2010 2011
Mean Capture Mean Capture Mean Capture
NL00137 16.6 92% 19.8 74% 13.6 61% NL00241 17.1 95% 15.9 97% 16.4 94% 242+247 20.2 84% 17.0 91% 15.4 95% NL00404 17.2 95% 16.6 94% 15.6 90% NL00418 16.9 89% 18.1 85% 16.8 87% NL00643 19.2 71% 17.3 98% 17.5 87% NL00742 19.2 95% 17.3 90% 16.2 99% 820+821 19.3 92% 19.3 85% 14.7 95% NL00938 13.5 84% 15.6 95% 14.4 92% NL00014 16.6 93% 17.4 98% 17.4 95% NL00701 15.2 96% 17.3 91% 17.0 99% NL00494 17.2 98% 17.0 97% 18.1 92%
Yearly mean concentrations, based upon validated daily results, for each urban background station are multiplied with the associated data capture. The sum of these values divided by the sum of the data capture gives the weighted yearly mean concentration.
∑
∑
Where: ̅ is the annual mean concentration in the year p at the ith station,
is the data capture at the ith station, for all stations where ≥ 75%.
This calculation is repeated for each of the years 2009, 2010 and 2011 after which the results are averaged to obtain the AEI for the Member State shown in Table 7.
Table 7 The yearly AEI and the three-year average AEI for the calculation using the method based upon the proposal by AQUILA.
2009 2010 2011
Yearly AEI 17.2 16.9 16.3
AEI based on the average of 2009 – 2011 16.8
2.2 National exposure reduction target
The value of the AEI is used to establish the National Exposure Reduction Target (NERT) for each Member State which should be met in 2020. The NERT is described in article 2.22 of the EU Directive as “[..] a percentage reduction of
the average exposure of the population of a Member State set for the reference year with the aim of reducing harmful effects on human health, to be attained where possible over a given period;”. Table 8 gives an overview of the different
reduction targets in percentages.
Table 8 Overview of the different National Exposure Reduction Targets (NERT) in percentages relative to the AEI (source: Air Quality Directive)
AEI in 2010 (or 2011, in µg/m3)
National Exposure Reduction Target relative to the AEI
< 8.5 - ≤ 8.5 0 %
> 8.5 - < 13 10 %
≥ 13 - < 18 15 %
≥ 18 - < 22 20 %
≥ 22 All appropriate measures to achieve
18 µg/m3
2.3 Comparison of results from the different calculation methods
In this report we have discussed several different calculation methods for the AEI. Table 9 shows the results for all discussed calculation methods and additionally also adds the indicative results of the modelling of the large scale concentration maps for 2009-2011.
Table 9 Overview of the AEI2009-2011 and the associated NERT for each of the used calculation methods, alternative methods are given in italics.
Method AEI NERT
Calculation of the official Dutch AEI2009-2011 17.0 15% Alternative method 1: Air Quality Directive 16.8 15% Alternative method 2: AQUILA 16.8 15% Modelled large scale concentration maps (indicative) 16.9 15%
As can be seen all methods, including the indicative method, are in good agreement and will lead to a National Exposure Reduction Target of 15% (2.6 µg/m3) for 2020.
Since all methods are in good agreement for the data collected by the
Netherlands, there might be no need to establish a preferred method. However, each method has specific drawbacks which we will discuss in detail.
The Air Quality Directive method is based on the data quality objectives set in the EU Directive. Among these objectives is the data capture, which has to be ≥ 90%. Most measurements of PM2.5 concentrations at urban background
earlier in this report, the reference method is subject to data loss and could ultimately lead to a data capture below 90%. If this happens, the annual PM2.5
concentrations at the stations concerned are excluded from the AEI calculation. Because of the necessity to determine an accurate exposure indicator for PM2.5
in the Netherlands, failing to meet the data capture criterion was deemed to be unacceptable.
This problem has been partly addressed in the recommendations given by AQUILA, where a cut off value of ≥ 75% for the data capture has been
proposed. However, in using this method another problem arises: the problem of unevenly distributed weights over the whole range of average concentrations observed.
The method used to calculate the official Dutch AEI2009-2011 solves the data
capture problem and therefore the weighing problem by using the strong
correlation between PM2.5 concentrations over the Netherlands and the relatively
low measurement uncertainty to model estimates of missing data. While this approach gives a data capture of 100% and the estimates of missing data follow the specific trends in daily PM2.5 concentrations in the Netherlands, it also has a
drawback. This approach is only applicable by other networks/regions/member states if a strong correlation between concentration levels of PM2.5 exists.
2.4 Three-year running mean (AEI) for 2010-2012
With the available results for 2012 a three-year running mean (AEI) can be calculated, this time for the 2010-2012 period. Applying the calculation method earlier used for the AEI2009-2011 (see section 2.1.1) gives an AEI for 2010-2012 of
15.7 µg/m3, a reduction of nearly 1.3 µg/m3 in one year. Part of the reduction
found in the AEI for this period is caused by low PM2.5 measurements in the fall
of 2012, leading to a lower annual average. Normally both PM2.5 and PM10 (as
reference) concentrations show an increase in concentrations during the fall. In 2012, such an increase in PM concentration during this period was not observed, leading to a lower annual average.
The AEI2010-2012 calculated here has been reported in the 2013 version of the
annual report (questionnaire) on air quality assessment and management as required by Directive 2004/461/EC.
2.5 Uncertainty of the AEI2009-2011 in the Netherlands
The measurement uncertainty of the AEI for PM2.5 for results obtained using the
reference method may be assessed on the basis of a combination of the Guide to the Expression of Uncertainty in Measurement (GUM)-approach and guidelines provided by ISO 11222 (2002). The GUM-approach is taken from the latest draft of prEN 12341 (2013). The averaging process is as follows:
1. averaging results for a single site for the period of one year
2. averaging the results for all sites in the AEI network for the same year 3. averaging the yearly mean results for the three consecutive yearly
periods
The approach assumes that for each site the data capture will fulfil the 90% requirement, i.e., the number of daily samples in a year is ≥ 0.9 * 365. For the number of sites used to calculate the AEI (12) and the three yearly average concentrations established for these sites, the following relative uncertainties results are found (see Table 10).
Table 10 Overview of the average PM2.5 concentration and the relative uncertainty for each of the years 2009-2011.
Year Average concentration of PM2.5 (µg/m3) Relative uncertainty of the yearly average (%) 2009 17.3 4.5 2010 17.3 4.5 2011 16.5 4.6
By combining the uncertainties for the three years, the relative uncertainty of the AEI for the years 2009 to 2011 is calculated to be 4.5% (0.77 µg/m3). When
using a coverage factor of 2, approximately representative of a 95% confidence interval, the relative expanded uncertainty is calculated to be 9.0% (1.5 µg/m3).
When applying the same assessment for the target AEI for the years 2018 to 2020, the relative uncertainty at the maximum required level of 14.4 µg/m3
By using a one-sided test at the 95% level, combining both uncertainties would lead to an uncertainty (95% confidence) in the measurable reduction of
1.77 µg/m3, which is lower than the required reduction of 2.6 µg/m3 indicating
that the required reduction would be measurable with 95% confidence.
This is only one part of the uncertainty that needs to be considered to establish the reduction “potential”. Also, “natural” causes (e.g., meteorology) may result in fluctuations of levels of PM2.5.
Mathijssen et al. (2009) estimate the relative standard deviation of yearly average PM2.5 levels in the Netherlands to be about 9%. This estimate is purely
based on the yearly variations encountered in measured levels. Obviously, this “intrinsic” uncertainty adds to the uncertainty from the measurements of PM2.5.
The contribution to the three-year average AEI may be estimated to be 9/√3%. When adding this contribution to the uncertainties of the AEI2009-2011 and the
target AEI2018-2020, the uncertainty in the reduction increases to 2.6 µg/m3 which
is equal to the required reduction of 2.6 µg/m3 for 2018-2020. This indicates the
required reduction is on the edge of detection with a confidence level of 95%. There are no guidelines on how to include uncertainties when comparing results of air quality measurements with targets or limits.
3
Conclusions
The majority of the PM2.5 measurements in the Netherlands are performed using
the reference method. However, due to the manual collection of filters every two weeks, this method is prone to data loss. Depending on the calculation method loss of data could have a potentially large influence on the Average Exposure Index (AEI). This means data availability is an important parameter for the calculation of the AEI.
In this report we have explained how the AEI2009-2011, previously reported in the
annual report (questionnaire) on air quality assessment and management, has been calculated. This calculation uses the good correlation between the PM2.5
measurements in the Netherlands to mathematically generate estimates for missing data. This approach solves the problem of possible imbalance in the data set due to missing periods.For 2009-2011 and the selected urban background stations this leads to an AEI of 17.0 µg/m3
.
In turn the AEI2009-2011 value leads to a National Exposure Reduction Target of
15% (2.6 µg/m3) for 2018-2020.
Additionally, we have explored two alternative methods for calculating the AEI for the years 2009-2011. The first alternative method consisted of using the general data quality objectives for PM from the EU directive to establish valid annual PM2.5 averages for the calculation of the AEI. One of these data quality
objectives deals with the data capture at each location, which should not be below 90%.
The second alternative method, proposed by the Air Quality Reference Laboratories (AQUILA) in 2012, uses less stringent data capture objectives (75%). With this method, additional locations are added to the calculation of the AEI compared to the Air Quality method.
All methods described in this report are in good agreement for the AEI in 2009-2011, providing similar results.
Using modelling based upon different economic growth scenarios and current and expected legislation, a decrease of 15-17% is expected in urban background PM2.5 concentrations. The effects of proposed national policies on the expected
decrease of PM2.5 concentrations are small. When the PM2.5 emission ceilings, as
set in May 2012 within the framework of the Gothenburg Protocol, are not met in time by other Member States the reduction of the PM2.5 concentrations in the
Netherlands might even be smaller.
However, based upon the modelled decrease in PM2.5 concentrations for
2010-2020, and with PM2.5 emissions ceilings not being exceeded, the
4
Recommendations
The use of modelling using different economic growth scenarios and current and expected legislation show that the National Reduction Target (NERT) for 2020 could still be met. However, it also shows that effects of the proposed National policies on the expected NERT are small, making it important for PM2.5 emission
ceilings set for 2020 not to be exceeded by the Member States. Yearly monitoring of the three-year running means (AEI) is advisable to detect the trend in the reduction rate.
Control of the systematic uncertainty of the PM2.5 measurements is crucial for an
accurate determination of the reduction of the AEI. This implies that a solid control on the systematic properties of the reference method is necessary. If PM2.5 will be measured by an automatic method (i.e. the MetOne BAM) the
calibration of this method, with respect to the reference method, will be of utmost importance.
References
Arkel, F.Th. van, Kummu, P.J., Loon van, J.P.L., Meulen, A. van der, Severijnen, M., Visser, J.H. (2007). Overzicht van onderzoek naar automatische meetmethoden voor het vaststellen van fijn stof. Stand der techniek PM2.5-meetmethoden. RIVM rapport 680708004. Rijksinstituut voor
Volksgezondheid en Milieu, Bilthoven [Dutch]
Arkel, F.Th. van, Hafkenscheid, Th.L., Ingen Housz, F.C., Jonge, D. de, Kummu, P.J., Meulen, A. van der (2008). PM2.5 Performancetest. Vergelijk
automatische PM2.5-meetapparatuur. RIVM rapport 680709001.
Rijksinstituut voor Volksgezondheid en Milieu, Bilthoven [Dutch]. AQUILA (2012), Procedures for Determining a National Average Exposure
Indicator, for Assessment of a National Exposure Reduction Target, Requirements for Quality Assurance/Quality Control, and Requirements for the Estimation of their Measurement Uncertainties
Breugel, P.B. van en Buijsman, E. (2001). Preliminary assessment of air quality for sulphur dioxide, nitrogen dioxide, nitrogen oxides, particulate matter, and lead in the Netherlands under European legislation. RIVM rapport 725601005. Rijksinstituut voor Volksgezondheid en Milieu, Bilthoven. Brunekreef, B., Holgate, S.T. (2002). Air pollution and health. Lancet 360 (no.
9341), 1233 - 1242.
CBS (2005). Bevolking; kerncijfers. CBS, Den Haag/Heerlen.
EEA (2007). Europe’s Environment. The Fourth Assessment. EEA, Copenhagen EN 14907:2005. Ambient Air Quality – Reference gravimetric measurement
method for the determination of the PM2.5 mass fraction of suspended
particulate matter in ambient air.
EU (2008). Directive 2008/50/EC of the European Parliament and of the Council of 21 May 2008 on ambient air quality and cleaner air for Europe. ISO 11222:2002. Air quality – Determination of the uncertainty of the time
average of air quality measurements.
Lippmann, M., Chen, L.-C. (2009). Health effects of concentrated ambient air particulate matter (CAPs) and its components. Crit. Rev. Toxicol. 39 (no. 10), 865 - 913.
Matthijsen, J. en Ten Brink, H.M. (2007). PM2,5 in the Netherlands.
Consequences of the new European air quality standards. MNP Rapport 500099001. Milieu- en Natuurplanbureau, Bilthoven.
Matthijsen J., Jimmink B.A., Leeuw F.A.A.M. de, Smeets W.L.M. (2009)
Attainability of PM2.5 air quality standards, situation for the Netherlands
in a European context. PBL rapport 500099015. Planbureau voor de Leefomgeving, Bilthoven.
Mooibroek, D., Berkhout, J.P.J., Hoogerbrugge. R. (2012) Jaaroverzicht
Luchtkwaliteit 2011. RIVM rapport 680704020/2012. Rijksinstituut voor Volksgezondheid en Milieu, Bilthoven. [Dutch]
Swaluw, E. van der and Hoogerbrugge, R. (2012) PM2.5 monitoring strategy.
RIVM rapport 680704018/2012. Rijksinstituut voor Volksgezondheid en Milieu, Bilthoven.
Velders, G.J.M., Aben, J.M.M., Jimmink, B.A., Geilenkirchen, G.P., Swaluw, E. van der, Vries W.J. de, Wesseling, J., Zanten, M.C. van (2012).
Grootschalige concentratie- en depositiekaarten Nederland : Rapportage 2012. RIVM rapport 680362002, Rijksinstituut voor Volksgezondheid en Milieu, Bilthoven. [Dutch]
Velders, G.J.M., Aben, J.M.M., Jimmink, B.A., Geilenkirchen, G.P., Hollander, H.A. den, Swaluw, E. van der, Vries W.J. de, Wesseling, J., Zanten, M.C. van (2013). Grootschalige concentratie- en depositiekaarten Nederland: Rapportage 2013. RIVM rapport 680362003, Rijksinstituut voor
Appendix A: Minimum number of urban background sites
Table 11 Calculation of the minimum number of urban background (UB) sites
Inhabitants Number of UB sites per
Municipality (CBS, 2005) 1-1-2009
Agglomeration Amsterdam/Haarlem 1538435 2
Agglomeration Rotterdam/Dordrecht 1279364 2
Agglomeration Den Haag/Leiden 1061200 1
Agglomeration Utrecht 453619 1 Agglomeration Eindhoven 427000 1 Agglomeration Heerlen/Kerkrade 240326 1 Tilburg 200819 Groningen 181171 1 Almere 179695 Breda 170029 1 Nijmegen 160215 1 Apeldoorn 155807 Enschede 154427 1 Arnhem 142382 Amersfoort 138026 's-Hertogenbosch 135183 Maastricht 119607 Zoetermeer 117502 Zwolle 113857 Emmen 108711 Ede 107274 Total 7184649 12
Appendix B: Overview of extended annual PM
2.5averaged
concentrations for 2008-2012 per station
Table 12 Overview of extended annual PM2.5 concentrations for each available sampling point during 2008-2011.
Code Location 20081 2009 2010 2011 2012
Rural background locations
NL00131 Vredepeel - Vredeweg 18 19 19 16 13 NL00230 Biest-Houtakker - Biestsestraat 17 19 15 NL00246 Fijnaart - Zwingelspaansedijk 17 16 15 NL00444 De Zilk - Vogelaarsdreef 13 14 13 13 9 NL00538 Wieringerwerf - Medemblikkerweg 13 15 14 12 10 NL00644 Cabauw - Wielsekade 16 16 17 15 NL00738 Wekerom - Riemterdijk 16 18 19 17 14 NL00807 Hellendoorn - Luttenbergerweg 15
NL00934 Kollumerwaard - Hooge Zuidwal 13 13 14 13 10
NL00703 GGD A'dam - Spaarnwoude 15 14
Urban background locations
NL00137 Heerlen - Deken Nicolayestraat 16 17 18 18 14
NL00241 Breda - Bastenakenstraat 18 17 16 17 13
NL00242 Veldhoven - Rapportstraat 20
NL00247 Veldhoven - Europalaan 18 18 16 13
NL00404 Den Haag - Const. Rebecquestraat 17 17 16 17 13
NL00418 Rotterdam - Schiedamsevest 18 17 18 17 14 NL00643 Utrecht - Griftpark 18 17 16 12 NL00742 Nijmegen - De Ruyterstraat 18 19 18 16 13 NL00820 Enschede - Espoortstraat 19 18 NL00821 Enschede - Winkelhorst 17 15 13 NL00938 Groningen - Nijensteinheerd 19 15 16 15 12 NL00485 DCMR - Hoogvliet 18 14 NL00488 DCMR - Zwartewaalstraat 17 14 NL00494 DCMR - Schiedam 17 17 17 18 14 NL00014 GGD A'dam - Overtoom 15 17 17 17 15 NL00016 GGD A'dam - Westerpark 18 18 14 NL00701 GGD A’dam - Zaandam 15 15 18 17 15
Urban Traffic Induced locations
NL00136 Heerlen - Looierstraat 19 19 20 17 15
NL00240 Breda - Tilburgseweg 17 19 17 18 13
NL00433 Vlaardingen - Floreslaan 18 18 17 16 13
NL00448 Rotterdam - Bentinckplein 18 18 17 17 13
NL00636 Utrecht - Kardinaal De Jongweg 19 18 18 14
NL00641 Breukelen - Snelweg 16 19 18 18 14 NL00741 Nijmegen - Graafseweg 21 20 18 14 NL00937 Groningen - Europaweg 21 20 18 14 NL00487 DCMR - Pleinweg 20 17 NL00489 DCMR - A16 Ridderkerk 18 15 NL00490 DCMR - Maasboulevard 17 NL00491 DCMR - Overschie 16 15 NL00007 GGD A'dam - Einsteinweg 21 15
Code Location 20081 2009 2010 2011 2012
NL00012 GGD A’dam - Van Diemenstraat 20 17
NL00017 GGD A'dam - Stadhouderskade 20 17
NL00018 GGD A'dam - Ring A10 Zuid 16 18 18
Urban Industrial Induced locations
NL00496 DCMR - Berghaven 16 13
NL00495 DCMR - Maassluis 15 14
NL00704 GGD A'dam - Hoogtij 18 14
NL00551 NH - IJmuiden, Kanaaldijk 18 15
NL00553 NH - Wijk aan Zee 19 16
NL00561 NH - Badhoevedorp 16 14
NL00570 NH - Beverwijk-West 18 13
1 Due to the high number of missing data, primarily because measurements where started
sometime during 2008 , the values seen in this table should be considered as indicative averages.
Note: in case the sampling location is not operated by the NAQMN we have added a prefix to identify the operator: GGD A’Dam (GGD Amsterdam), DCMR (DCMR Environmental Protection Agency) and NH (Province of North Holland, operated by GGD Amsterdam).
The annual averages in this table were calculated using an alternative approach based upon the strong correlation between PM2.5 concentrations over the
Appendix C: Equivalence of measurement results after
moving sample locations
Introduction
Within the period 2009 – 2011 two monitoring stations where data for the calculation of the AEI are collected have been moved to nearby new sites:
Station NL00242 has been replaced in 2009 by station NL00247 (both in Veldhoven).
Station NL00820 has been replaced in 2010 by station NL00821 (both in Enschede).
In order to examine the potential effects of these replacements comparisons have been performed at the sites using reference samplers of the same type for a period of approximately a month.
For each of the two locations we used a balanced one-way analysis of variance (ANOVA) to compare the means of both the direct measurements as well as the means of the extended measurements at the two stations. The extended measurements are the results of the procedure described in section 2.1.1 which uses the good correlation between the PM2.5 measurements in the Netherlands
to mathematically generate estimates for missing data.
Using the one-way ANOVA we test if the samples from the direct measurements and extended measurements are drawn from a population with the same mean value, the so-called null hypothesis. If this null hypothesis holds it means there is no significant difference between the means. The results of the evaluations are presented below.
Station NL00242 vs. station NL00247
The comparison has been performed in the period June to August 2009. In this period 48 valid data pairs of direct measurements were obtained. The mean results for both stations for the direct measurements and the extended measurements are given in Table 13.
Table 13 Mean results for stations NL00242 and NL00247 for both the direct measurements (June to August 2009) and the extended measurements.
Code
Direct
(µg/m3) Extended (µg/m3)
NL00242 14.8 19.9
NL00247 15.6 18.4
Using the one-way ANOVA we will test if there is a significant difference at the 95% confidence interval between the means presented in Table 12. Figure 6 shows a boxplot where the notches provide a visual test of group medians different from the F test for means in the ANOVA table. As can be seen there seems to be no difference between the group medians.
Figure 6 Boxplot showing the results for both the direct (D) measurements as well as the extended measurements (E) at both NL00242 and NL00247
Figure 7 shows the results from the one-way ANOVA and it can be seen the 95% confidence intervals for the four groups overlap. This means there is no
significant difference between the means of the four groups, meaning the null hypothesis holds.
Figure 7 Estimates of the group means with 95% comparison intervals around them.
What can be observed is that, while the means between the direct
measurements and extended measurements do not differ in this case, the annual mean for the direct measurements is clearly lower than the annual mean for the extended measurements. In this case the direct measurements were performed during the summer period in which, in general, the PM2.5
concentrations are lower compared to the winter and fall period (Mooibroek et al., 2012).
The test results show that the mean concentration of PM2.5 measured at station
NL00247 does not differ within the 95% confidence interval from the mean at station NL00242 for both the direct and extended measurements.
NL00242 D NL00247 D NL00242 E NL00247 E 0 20 40 60 80 100 120 c onc ent rat io n P M2. 5 (µ g /m 3) 10 12 14 16 18 20 22 NL00247 E NL00242 E NL00247 D NL00242 D
The replacement of station NL00242 by station NL00247 is therefore believed to result in similar contributions to the AEI, indicating that this move does not lead to significant changes in the AEI.
Station NL00820 vs. station NL00821
The comparison has been performed in the period June to August 2010. In this period 34 valid data pairs of direct measurements were obtained. The mean results for both stations for the direct measurements and the extended measurements are given in Table 14.
Table 14 Mean results for stations NL00820 and NL00821 for both the direct measurements (June to August 2010) and the extended measurements.
Code
Direct
(µg/m3) Extended (µg/m3)
NL00820 12.3 18.4
NL00821 13.4 17.4
Using the one-way ANOVA we will test if there is a significant difference at the 95% confidence interval between the means presented in Table 13. Figure 8 shows a boxplot where the notches provide a visual test of group medians different from the F test for means in the ANOVA table. As can be seen there seems to be no difference between the group medians.
Figure 8 Boxplot showing the results for both the direct (D) measurements as well as the extended measurements (E) at both NL00820 and NL00821
NL00820 D NL00821 D NL00820 E NL00821 E 0 20 40 60 80 100 c onc ent rat io n P M2. 5 (µ g /m 3)
Figure 9 Estimates of the group means with 95% comparison intervals around them.
Figure 9 shows the results from the one-way ANOVA. From the overlap in the 95% confidence intervals the means for the NL00820 and NL00821 direct
measurements do not differ. The same conclusion can be drawn for the NL00820 and NL00821 extended measurements.
However, there seems to be a statistically significant difference between the direct and extended measurements at station NL00820. The mean from the direct measurements seem to be statistically lower, which can be explained by the sampling period. The direct measurements were performed during the summer period in which, in general, the PM2.5 concentrations are lower
compared to the winter and fall period (Mooibroek et al., 2012).
Figure 10 Averaged monthly PM2.5 concentration levels in 2010 using all Urban Background (UB) stations used for calculation of the AEI.
8 10 12 14 16 18 20
NL00821 E NL00820 E NL00821 D NL00820 D
The means of groups NL00820 D and NL00820 E are significantly different
0 5 10 15 20 25 30 35 40
jan feb mar apr may jun jul aug sept oct nov dec
PM 2. 5 co n ce n tr at io n (µ g/ m 3)
Monthly PM
2.5
concentration in 2010
Monthly average UB Annual average UBFigure 10 shows the average monthly PM2.5 concentration at all urban
background stations used in the calculation of the AEI. It can be clearly seen that PM2.5 levels were high during the winter period of 2010 and low during the
summer period. This explains the significant difference between the direct measurements and the extended measurement averages.
Based upon the test results the mean concentration of PM2.5 measured at station
NL00821 does not differ within the 95% confidence interval from the mean at station NL00820 for both the direct and extended measurements.
The replacement of station NL00820 by station NL00821 is therefore believed to result in similar contributions to the AEI, indicating that this move does not lead to significant changes in the AEI.
Appendix D: Equivalence of measurement results of PM
2.5for the MetOne BAM 1020
Introduction
The BAM 1020 has been used by regional networks in the Netherlands for the measurement of PM2.5 since 2009. From mid-2009 onwards parallel
measurements have been performed by these networks at a number of stations using the reference method described in EN 14907:2005, taking into account the Netherlands Technical Agreement 8019:2008. In August 2012 all measurement data have been collected and submitted to an evaluation of equivalence based on the Guidance to the Demonstration of Equivalence of Ambient Air Monitoring Methods, version 2010.
Approach
All data pairs have been screened for potential aberrant values. After removal of 41 data pairs the remaining 3,093 data pairs have been subjected to the
equivalence test by orthogonal regression. The results of the regression are summarized below. REGRESSION OUTPUT slope b 1.025 uncertainty of b 0.004 sign intercept a 0.520 uncertainty of a 0.081 sign number of data pairs 3093
r^2 0.96
EQUIVALENCE TEST RESULTS
random term 2.63 µg/m³
bias at LV 1.16 µg/m³
combined uncertainty 2.87 µg/m³ relative uncertainty 11.5% pass
ref uncertainty 1.0 µg/m³
limit value 25 µg/m³
Because of the significant differences of slope and intercept from 1 and 0, respectively, it has been decided to apply a calibration to the data obtained by the BAM 1020.
Since the intercept value is relatively small it has been decided to use a single calibration factor for reasons of simplicity rather than a calibration function. This calibration factor is calculated to be *0.96, i.e., measurement results obtained by the BAM 1020 need to be multiplied by 0.96 to be equivalent to reference results.