Noise monitor 2011 : Geluidmonitor 2011
34
0
0
Hele tekst
(2) Noise Monitor 2011. RIVM Letter report 630650003/2012 D.E. Lolkema | C. Potma | J. Jabben.
(3) RIVM Letter report 630650003. Colofon. © RIVM 2012 Parts of this publication may be reproduced, provided acknowledgement is given to the 'National Institute for Public Health and the Environment', along with the title and year of publication.. D.E. Lolkema C. Potma J. Jabben Contact: Jan Jabben CMK jan.jabben@rivm.nl. This investigation has been performed by order and for the account of the Ministry of Infrastructure and Environment, within the framework of project M/630650/11/FF. Page 2 of 32.
(4) RIVM Letter report 630650003. Abstract. Noise Monitor 2011 At the A2 motorway near Breukelen the average noise level has decreased by approximately 6 dB(A) after the reconstruction of the road. This is due to new porous pavement and the current 100 km/h speed reduction. At the ‘A10-West’ noise station in Amsterdam, since 2008 noise level have decreased. The decrease over 2011, compared with 2010, is 2 dB(A). At the A12 motorway near Voorburg, a slight increase in noise levels is observed since 2009. For the A16 motorway near Breda and the A20 motorway near Rotterdam no trends are available yet as 2011 was the first year of operation. The measured noise levels from traffic noise were compared with calculated levels using an updated calculation method that is used in the new Dutch noise legislation (SWUNG) for motorways. Along motorways the calculated levels are in good agreement with the measurements. Differences remain within 1 dB. Furthermore, this report addresses options for future validation of calculated noise levels, as envisaged in the new noise legislation for Dutch motorways and railways. To meet the demand for validation, the current RIVM noise monitoring network does not suffice, both for motorways and railways, and will have to be extended in the next years.. Trefwoorden: Noise, measurements, validation, SWUNG. Page 3 of 32.
(5) RIVM Letter report 630650003. Rapport in het kort. Geluidmonitor 2011 Langs de A2 bij Breukelen is het gemiddelde geluidsniveau met ongeveer 6 dB afgenomen na de reconstructie van de weg in 2010. Dit komt door het nieuwe poreuze wegdek en de huidige snelheidsbeperking (100 km/u). Op de meetpost langs de A10-West in Amsterdam is sinds 2008 het geluidsniveau afgenomen. De afname in 2011, is 2 dB ten opzichte van 2010. Op de A12 bij Voorburg, wordt een lichte stijging van het geluidsniveau waargenomen sinds 2009. Voor locaties langs de A16 bij Breda en de A20 bij Rotterdam zijn nog geen trendreeksen beschikbaar omdat deze meetposten in 2011 voor het eerst in bedrijf waren. De gemeten geluidsniveaus van verkeerslawaai zijn vergeleken met berekende waarden conform de nieuwe Nederlandse berekeningsmethode. Deze wordt toegepast nieuwe Nederlandse wetgeving (SWUNG) voor snelwegen. Op de meeste meetlocaties zijn berekende geluidniveaus in goede overeenstemming met metingen en blijven verschillen binnen 1 dB. Verder gaat dit rapport in op opties voor validatie van berekende geluidbelasting in het kader van SWUNG als onderdeel van de nieuwe wetgeving. Voor de beoogde validatie voldoet het huidige RIVM geluidmeetnet niet. Zowel voor rijkswegen als spoorwegen is een uitbreiding van het meetnet nodig in de komende jaren. Trefwoorden: Geluid, metingen, validatie, SWUNG. Page 4 of 32.
(6) RIVM Letter report 630650003. Contents. Summary—6 1. Introduction—7. 2 2.1 2.2 2.3 2.4 2.5 2.6 2.7. Monitoring results 2011—8 A2 motorway near Breukelen—8 A10-West motorway in Amsterdam—11 A12 motorway near Voorburg—14 A16 motorway Breda (Zevenbergschen Hoek)—17 A20 motorway Rotterdam—18 N256 Collijnsplaat—19 Railway noise—21. 3 3.1 3.2 3.3. Outlook to the new Dutch noise regulation (SWUNG-1)—22 Introduction—22 Criteria for suitable measurement sites—23 Locations of existing sites in relation to SWUNG-1 reference points.—24. 4. Conclusions—28 Appendix 1 Locations of measurement stations—30 Appendix 2 Description of measurement equipment—31 Appendix 3 Regression noise levels N256—32. Page 5 of 32.
(7) RIVM Letter report 630650003. Summary This report ‘Noise Monitor 2011’ describes the results of the RIVM Noise Monitoring Program in 2011. The results are used to monitor trends in noise emission and to validate standard calculation methods. In addition, an outlook to the role of measurements in the new SWUNG-1 noise legislation is given. Measurement data from six monitoring stations have been analysed: i) the A2 motorway near Breukelen, ii) the A10-West motorway in Amsterdam, iii) the A12 motorway near Voorburg, iv) the A16 motorway near Breda, v) the A20 motorway near Rotterdam and vi) the N256 in the province of Zeeland. Trend developments After reconstruction in 2010 the A2 motorway near Breukelen the average noise emission of the road has been reduced by approximately 6 dB. This is due to the new pavement (5 dB) and the current 100 km/h speed limit (1 dB). At the ‘A10West’ noise station in Amsterdam, since 2008 noise level have decreased. The decrease over 2011, compared with 2010, is 2 dB(A). At the A12 motorway near Voorburg, a slight increase in noise levels is observed since 2009. For the A16 motorway near Breda and the A20 motorway near Rotterdam no trends are available yet. Model calculations Measured noise levels at the noise monitoring stations were compared with calculated levels using the updated Dutch calculation method (RMG2012). Measured and calculated noise levels (Lden) at most sites show good agreement and differences remain limited to approximately 1 dB. Only at the N256 in Zeeland, measured noise emission levels are considerably higher than according to RMG2012 for standard dense asphalt (DAC). Outlook Swung-1 noise legislation To meet the request of the Dutch parliament to validate calculated noise levels in the new noise legislation for motorways and railways, the current monitoring network will have to be extended in 2012 and 2013.. Page 6 of 32.
(8) RIVM Letter report 630650003. 1. Introduction. This report ‘Noise monitor 2011’ contains the result of RIVM noise monitoring results obtained in 2011. The noise monitoring program has been conducted from 1999 onwards and serves to evaluate trends in noise emissions from road vehicles, railway stock and airport noise. In addition, the measurements are used to validate model predictions for noise emission. Over 2011, measurements were carried out at the following noise monitoring stations:. Road traffic noise: Breukelen A2 motorway; this site has been in operation since 1999 and is located at 17 m west of the motorway Amsterdam A10 motorway; This site has been in operation from 2004 Rotterdam A20 motorway (2010); The Hague/Voorburg, A12 motorway (2006); Breda, A16 motorway (2010) N256 motorway Collijnsplaat (2003) For these sites, measurements were carried continuously over 2011. The measurements have been investigated regarding trends in development of average noise levels: Lday, Levening, Lnight and Lden. The results over 2011 have been compared with previous results from 2000 onwards. Furthermore, for the road traffic stations, the results have been used to validate the new Dutch standard calculation model for road traffic noise [RMG 2012]. This new standard applies within the new noise system, SWUNG1, for regulation of noise along Dutch motorways, which was set in July 2012. The new Dutch SWUNG1 system consists of setting limits at so called noise production ceilings (NPC’s) at equidistant points near motorways and railways. In the SWUNG1-system, the road- and railway manager will be obliged to maintain noise levels at the NPC’s within 1,5 dB margin from the levels in 2008. This report will not validate the SWUNG1-system, but does contain an outlook with respect envisaged calculation methods and the role of measurement in this new system. Railway noise In 2011, no measurements along railways are available as the track manager has abolished the maintenance of their railway noise sites.. Chapter 2 contains the results obtained at various sites for road traffic noise. Chapter 3 contains an outlook of the new SWUNG1-noise legislation.. Page 7 of 32.
(9) RIVM Letter report 630650003. 2. Monitoring results 2011. 2.1. A2 motorway near Breukelen Description The noise monitoring station at the A2 motorway near Breukelen has been operational since the year 2000. The motorway near the monitoring site has undergone a major reconstruction that was completed in 2010. The road has been widened from 3 lanes to 5 lanes in each direction, while the road surface, which used to be Dense Asphalt Concrete (DAC), has been replaced by Double Layer Porous Asphalt (DLPA, see Figure 1). In addition, the maximum speed has been reduced from 120 to 100 km/h. From December 2008 until July 2010, all traffic in both directions was directed over the new southbound road, which is further away from the monitoring site, see Figure 1. In the second half of 2010, the new northbound road opened and at the same time, the inner two southbound lanes closed for several months. In April 2011 its final state was reached. Anticipating the new situation, in 2009 the microphone has been replaced from a height of +1.5 meters to a height of +4 meters with respect to the road surface. 25 m. until 2006 DAC 120 km/h. until Dec 2008 75 m. until July 2010 DLPA 100 km/h. 30 m. until Apr 2011 DLPA 100 km/h. from Apr 2011. Figure 1 The A2 motorway near Breukelen. Double Layer Porous Asphalt (DLPA)(left) and top-view during different stages of the reconstruction works (right).. Page 8 of 32.
(10) RIVM Letter report 630650003. Trend 2005 – 2011 Figure 3 shows the yearly average 24-hour noise level distributions as measured at the site over 2007-2008 and over 2010-2011. The noise level distributions for previous years can be found in the Noise Monitor 2007 (Schreurs et al., 2008). After the widening of the road, the peculiar dip at 8:00, as seen in the average 24-distributions of 2007 and 2008, seems to be absent in 2011. Probably this is due to a smoother traffic flow in the new situation. 2007. Hourly averaged LAeq (dB(A)). 80. 2008. 75. 75. 70. 70. 65. 2010. 80. 2011. (DLPA) A2 Breukelen. 65. (DAC) A2 Breukelen. 60. 60 0. 12. 0 Hour. 12. 0. 12. 0 Hour. 12. Figure 2 Average 24-hour noise level distributions, measured at the A2 motorway near Breukelen over the years 2007-2008 and 2010-2011.. Table 1 shows the equivalent noise levels for the day, evening and night time periods, as well as the weighted 24-hour average Lden for the years 2005-2008 and the years 2010-2011. Levels for previous years can be found in the Noise Monitor 2007 (Schreurs et al., 2008). Over the years 2000-2008, noise levels at this site have remained practically constant, apart from minor variations in the order of 0.5 dB(A). This means that the average noise emissions over the years have not been reduced. After the reconstruction of the road, the average noise level at the receiver position has been reduced by approximately 9 dB(A). This is due to: the replacement of the old DAC asphalt by the new asphalt layer consisting of double porous asphalt layer (DLPA); the geometrical effect: the average distance between the lanes and the receiver has increased after the reconstruction; the influence of the speed reduction from 120 to 100 km/h. The geometrical effect is estimated at approximately -3 dB(A) and the speed effect in the order of -1 dB(A). This means that the replacement of the DAC by the DLPA has een effect of approximately –5 dB(A), which agrees with the reduction that standard models in general attribute to the initial reduction of this type of paving.. Page 9 of 32.
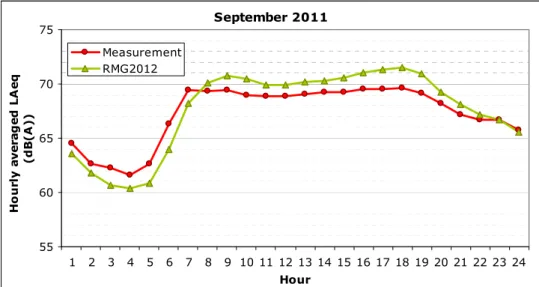
(11) RIVM Letter report 630650003. Table 1 Measured equivalent noise levels LAeq and Lden, A2 Breukelen, 2005-2008 and 2010-2011. 2011-2008 2005 2006 2007 2008 2010 2011 LAeq, 07-19h 78.0 77.9 77.6 78.0 69.1 69.2 -8.8 LAeq, 19-23h 76.5 76.4 76.3 76.7 67.4 67.2 -9.5 LAeq, 23-07h 73.7 73.7 73.5 73.8 65.2 65.1 -8.7 Lden 81.2 81.2 81.0 81.4 72.6 72.5 -8.9. After the reconstruction, a new trend development will be monitored at this site. It is expected that the noise level gradually will increase due to deterioration and silting of the porous asphalt. This a well known effect on porous pavings. Of interest will be the rate at which deterioration will influence acoustic absorption. Comparison with model calculations Measured noise levels have been compared with model calculations. Traffic data containing the counted intensities and measured speeds of different vehicle categories at counting point nr. 47733 was used. Hourly traffic data was only available for September 2011 from counting device nr. 47733. Figure 3 shows the comparison of the measured average 24-hour distribution of LAeq-levels with the calculated distribution. The calculation is based on the new emission factors from RMG 2012. The temporary subtraction factor (article 3.5 of RMG 2012) has not been applied to the calculations, as this factor anticipates future noise emissions. September 2011. Hourly averaged LAeq (dB(A)). 75 Measurement RMG2012 70. 65. 60. 55 1. 2. 3. 4. 5. 6. 7. 8. 9 10 11 12 13 14 15 16 17 18 19 20 21 22 23 24 Hour. Figure 3 Average 24-hour noise level distributions at the A2 motorway near Breukelen for the month September 2011. Measured values in red, calculated (RMG 2012) values in green.. In Table 2 the measured and calculated (RMG2012) equivalent noise levels for the day, evening and night time as well as the resulting Lden are compared. As can be observed, RMG2012 overestimates the levels during the day by 1.4 dB(A) and underestimates the average level for the night by 1.2 dB(A) at the A2 measurement position. The calculated Lden agrees with the measured level.. Page 10 of 32.
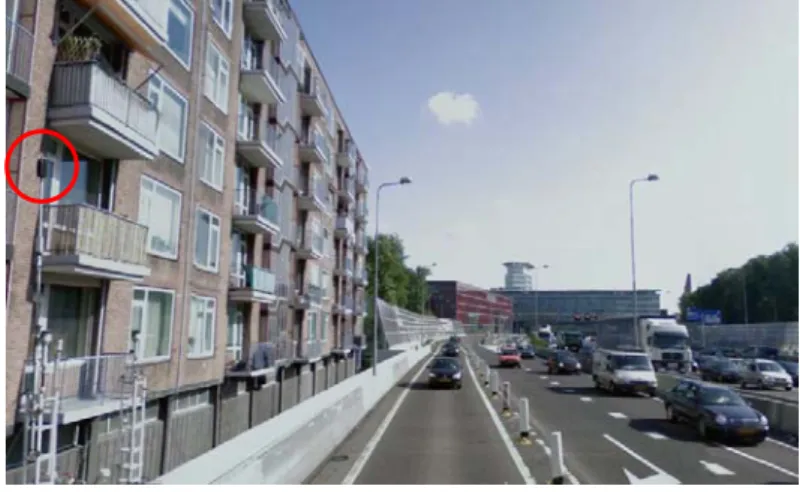
(12) RIVM Letter report 630650003. Average noise emissions for passenger cars (LAeq levels during the daytime) seem to be lower then according to RMG2012. Gradually over time, the absorption of the pavement will decrease so that after a few years the difference may vanish. The nighttime levels are slightly underestimated during 2.00-6.00h. Table 2 Equivalent noise levels LAeq and Lden, A2 Breukelen September 2011. calc-meas Calc. RMG 2012 Measured LAeq, 07-19h 69.2 70.6 1.4 LAeq, 19-23h 67.2 67.9 0.7 LAeq, 23-07h 65.2 64.0 -1.2 Lden 72.5 72.4 -0.1. 2.2. A10-West motorway in Amsterdam Description This RIVM noise monitor site is located at the east side of the A10-West in Amsterdam. Monitoring started in 2003. The noise monitor is located between the A10-West motorway and an apartment building (see Figure 4), so the monitor cannot be considered to be in the free field. A correction of 2 dB, subtracted from the measured levels, is applied to the measurements in order to compensate for the façade reflection. The maximum speed is 80 km/h, which is strictly enforced using the average speed check system Trajectcontrole since November 2005.. Figure 4 The monitor location at the A10-West, indicated by the red circle on the left. On the right, the traffic in the north direction. The three exit lanes are separated from the main road by a low barrier. Source: Google StreetView. The motorway is divided in twelve traffic lanes, of which three on each side are exits and weaving lanes. The road surface of the A10-West mostly consists of DLPA, but at some locations the road consists of a Porous Asphalt Concrete (PAC) layer or a Dense Asphalt Concrete (DAC) layer. The PAC layers are mainly situated at bridges and the DAC layers at exit lanes. At the location of the measurement site, the road surface consists of a PAC layer as well as a DAC layer at the exit lanes.. Page 11 of 32.
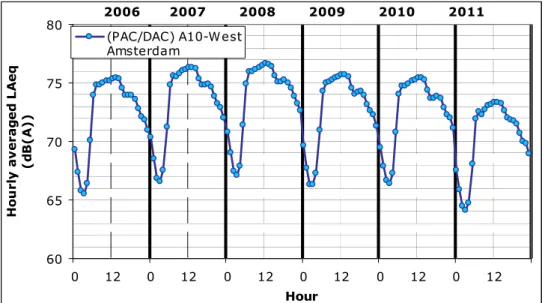
(13) RIVM Letter report 630650003. Trend 2006 – 2011 Figure 5 shows the yearly average 24-hour noise level distributions for the years 2006-2011. The noise level distributions for previous years can be found in the Noise Monitor 2010 [Lolkema et al., 2011]. 2006. Hourly averaged LAeq (dB(A)). 80. 2007. 2008. 2009. 2010. 2011. (PAC/DAC) A10-West Amsterdam. 75. 70. 65. 60 0. 12. 0. 12. 0. 12. 0. 12. 0. 12. 0. 12. Hour. Figure 5 Average 24-hour noise level distributions, measured at the A10-West motorway in Amsterdam over the years 2006-2011.. Table 3 shows the measured equivalent noise levels for the day, evening and night time periods, as well as the weighted 24-hour average Lden for the years 2006-2011. Levels for previous years can be found in the Noise Monitor 2010 [Lolkema et al., 2011]. Since 2008, a decrease in noise levels is observed. The decrease for the year 2011, compared with 2010, is 2 dB(A).. Table 3 Measured equivalent noise levels LAeq and Lden, A10-West Amsterdam 2006-2011. 2011-2010 2006 2007 2008 2009 2010 2011 LAeq, 07-19 h 74.8 75.7 76.0 75.1 74.8 72.7 -2.1 LAeq, 19-23 h 72.6 73.7 74.2 73.0 72.7 70.5 -2.2 LAeq, 23-07 h 69.6 70.6 71.0 70.1 70.0 67.8 -2.2 Lden 77.4 78.4 78.8 77.8 77.6 75.5 -2.1. Page 12 of 32.
(14) RIVM Letter report 630650003. Comparison with model calculations Measured noise levels have been compared with model calculations. Traffic data containing the counted intensities and measured speeds of different vehicle categories at counting point nr. 35765 were used. Traffic data were available for the period January – September 2011. Figure 6 shows the comparsion of the measured average 24-hour distribution of LAeq-levels with the calculated distribution. The calculation is based on the new emission factors from RMG2012. The temporary subtraction factor (article 3.5 of RMG 2012) has not been applied to the calculations, as this factor anticipates future noise emissions. A10-West Jan-Sep 2011. Hourly averaged LAeq (dB(A)). 75. 70. 65. Measurement RMG2012. 60. 55 0. 1. 2. 3. 4. 5 6. 7. 8. 9 10 11 12 13 14 15 16 17 18 19 20 21 22 23 Hour. Figure 6 Average 24-hour noise level distributions at the A10-West motorway in Amsterdam for the period January-September 2011. Measured values in red, calculated (RMG2012) values in green.. In Table 4 the measured and calculated (RMG2012) equivalent noise levels for the day, evening and night time as well as the resulting Lden are compared. As can be observed, RMG2012 underestimates the equivalent noise levels by 1 dB(A), and slightly more for the night period at the A10-West measurement position. Possibly, because RMG2012 underestimates the noise emissions for trucks at this site.. Table 4 Equivalent noise levels LAeq and Lden, A10-West Amsterdam, January September 2011. calc-meas Measured Calc. RMG 2012 LAeq, 07-19h 72.6 71.8 -0.8 LAeq, 19-23h 70.5 69.6 -0.9 LAeq, 23-07h 67.7 66.3 -1.4 Lden 75.4 74.3 -1.1. Page 13 of 32.
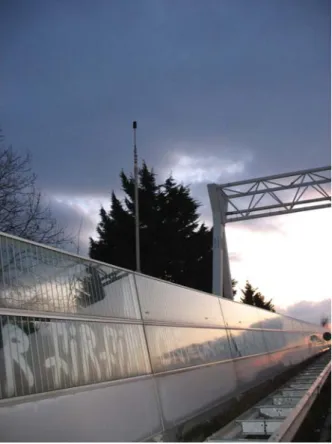
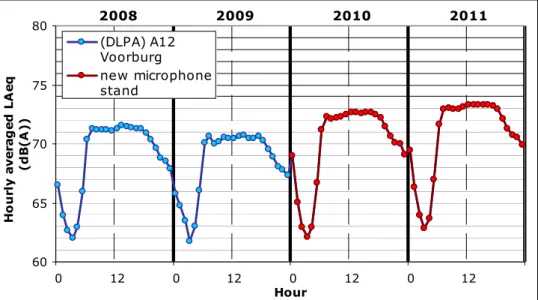
(15) RIVM Letter report 630650003. 2.3. A12 motorway near Voorburg Description Noise monitoring at the 6-lane A12 motorway near Voorburg started in July 2005. Since 2005, a number of changes, both in speed limitations as in paving, have taken place. Initially, the speed limit was 100 km/h, the northern lanes consisted of Double Layer Porous Asphalt (DLPA) paving and the southern lanes consisted of Porous Asphalt Concrete (PAC). In November 2005, the speed limit was reduced to 80 km/h, which was enforced by Trajectcontrole. In September 2007, the pavement in both directions was replaced with DLPA. In December 2009, dynamic speed control was introduced on the east bound lanes (Dynamax): at night (from 23:00 h to 05:00 h) and during traffic bulk in the evening, the speed limit of 80 km/h is increased to 100 km/h to improve traffic flow. An analysis of noise levels over the period December 2009 – September 2010 revealed no significant increase in noise levels [Verheijen et al., 2010]. Finally, on July 2, 2012, the Dutch Ministry of Infrastructure and Environment decided to set the maximum speed limit on all lanes at 100 km/h. The microphone was initially placed on a traffic portal but due to accessibility and maintenance problems, the microphone was removed in July 2009 and installed alongside the northern traffic lanes in December 2009, see Figure 7. The difference due to this new microphone stand is estimated by model calculations to be +0.6 dB compared to the old situation [Verheijen et al., 2010].. Figure 7 Monitoring site at the A12 motorway near Voorburg, installed 12-12-2009.. Page 14 of 32.
(16) RIVM Letter report 630650003. Trend 2007-2011 Figure 8 shows the yearly average 24-hour noise level distributions for the years 2008-2011. The noise level distributions for previous years can be found in the Noise Monitor 2010 [Lolkema et al., 2011]. The distribution for 2009 is a half year average over January-June, as the microphone was removed in July. The measurements in 2010 and 2011, with the slightly modified microphone stand and with Dynamax speed control, are indicated with a different color. 2008. Hourly averaged LAeq (dB(A)). 80. 2009. 2010. 2011. (DLPA) A12 Voorburg new microphone stand. 75. 70. 65. 60 0. 12. 0. 12. 0 Hour. 12. 0. 12. Figure 8 Yearly average 24-hour noise level distributions, measured at the A12 motorway near Voorburg over de years 2008-2011. The measurements with the modified microphone stand and with Dynamax speed control in operation are shown in red.. Table 5 shows the measured equivalent noise levels for the day, evening and night time period, as well as the weighted 24-hour average Lden for the years 2007-2011. Noise levels for the year 2009 are half-yearly averaged, due to replacement of the microphone stand. Levels for previous years can be found in the Noise Monitor 2010 [Lolkema et al., 2011]. Since 2009, a slight increase in noise levels is observed.. Table 5 Measured equivalent noise levels LAeq and Lden, A12 Voorburg 2007-2011. 2011-2010 2007 2008 2009 2010 2011 LAeq, 07-19 h 74.2 71.3 70.2 72.4 73.1 0.7 LAeq, 19-23 h 72.5 69.4 68.5 70.6 71.2 0.6 LAeq, 23-07 h 68.9 66.2 66.1 67.3 67.9 0.6 Lden 76.9 74.0 73.6 75.1 75.8 0.7. Page 15 of 32.
(17) RIVM Letter report 630650003. Comparison with model calculations Measured noise levels have been compared with model calculations. Traffic data containing only the counted intensities of different vehicle categories at counting point nr. 45205 were used. These traffic data were available for the period January – September 2011. No measured speeds were available, so the speed for all vehicle categories was set to 80 km/h. Figure 9 shows the comparsion of the measured average 24-hour distribution of LAeq-levels with the calculated distribution. The calculation is based on the new emission factors from RMG2012. The temporary subtraction factor (article 3.5 of RMG 2012) has not been applied to the calculations, as this factor anticipates future noise emissions. A12 Jan-Sep 2011. Hourly averaged LAeq (dB(A)). 75. 70. 65 Measurement RMG2012 60. 55 0. 1. 2. 3. 4. 5. 6. 7. 8. 9 10 11 12 13 14 15 16 17 18 19 20 21 22 23 Hour. Figure 9 Average 24-hour noise level distributions at the A12 motorway near Voorburg for the period January-September 2011. Measured values in red, calculated values in green.. In Table 6 the measured and calculated (RMG2012) equivalent noise levels for the day, evening and night time as well as the resulting Lden are compared. The RMG2012 seems to underestimate the average noise level during the night time. The difference regarding the Lden remains limited to approximately 1 dB(A).. Table 6 Equivalent noise levels LAeq and Lden, A12 near Voorburg, January September 2011. calc-meas Measured Calc. (RMG 2012) LAeq, 07-19h 73.1 73.0 -0.1 LAeq, 19-23h 71.0 70.6 -0.4 LAeq, 23-07h 67.9 66.3 -1.6 Lden 75.7 74.8 -0.9. Page 16 of 32.
(18) RIVM Letter report 630650003. A16 motorway Breda (Zevenbergschen Hoek). Description This monitoring site was set up on May 9th 2011 in order to monitor the effects of speed increment as part of a pilot on Dutch Highways [Verheijen et al, 2011]. The site is located on the west side of the A16 motorway at km 50.7, approximately 6 km north of Breda. The pavement consists of Single Layer Porous Asphalt (SLPA). Trend and comparison with model calculations As yet, no trend is available for this site. Figure 10 displays the measured 24hour distribution as measured and calculated over the second half of 2011. The traffic data for the calculation was made available by Rijkswaterstaat. The temporary subtraction factor (article 3.5 of RMG 2012) has not been applied to the calculations, as this factor anticipates future noise emissions. A16 Breda 80 Average LAeq 2011 in dB(A). 2.4. 75. 70 Measurement RMG2012 65. 60 0. 1. 2. 3. 4. 5. 6. 7. 8. 9 10 11 12 13 14 15 16 17 18 19 20 21 22 23 Hour. Figure 10 Average 24 hour levels measured and calculated at A16 Breda (Zevenbergschen Hoek) in 2011. Table 7 gives the measured equivalent noise levels measured in 2011 at this site. As can be observerd, RMG2012 underestimates the equivalent noise level by approximately 1 dB(A).. Table 7 Measured equivalent noise levels LAeq and Lden, A16 km 50.7 in 2011. calc-meas Calc. (RMG 2012) Measured LAeq, 07-19h 75.2 74.7 -0.5 LAeq, 19-23h 73.3 72.3 -1.0 LAeq, 23-07h 70.1 68.9 -1.2 Lden 77.9 76.9 -1.0. Page 17 of 32.
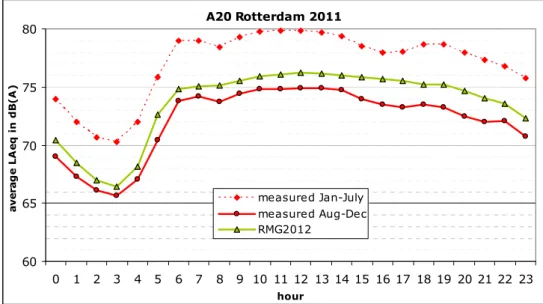
(19) RIVM Letter report 630650003. A20 motorway Rotterdam Description This monitoring site was set up on October 29th 2010 in order to monitor the effects of a pilot project on dynamic speed management (‘Dynamax’). The site is located on the south side of the A20 motorway at km 30.2. On 28 June 2011, Dynamax was introduced on the north lane with an a small effect in the order of +0.5 dB on noise levels in June [Verheijen et al, 2011]. Of more importance was the renewal of the pavement by the end of July 2011, which caused a reduction in the order of 5 dB(A). Trend and comparison with model calculations As yet, no trend is available for this site. Figure 11 shows the average 24-hour noise level distributions, measured over the months January-June and JulyDecember 2011, as well as the calculated average 24-hour noise level distribution. A20 Rotterdam 2011. 80. average LAeq in dB(A). 2.5. 75. 70. measured Jan-July measured Aug-Dec RMG2012. 65. 60 0. 1. 2. 3. 4. 5. 6. 7. 8. 9 10 11 12 13 14 15 16 17 18 19 20 21 22 23 hour. Figure 11 Average 24 hour levels measured and calculated at A20 Rotterdam 2011, before (January-July) and after (August-December) the renewal of the paving. Also shown is the calculated distribution based on RMG2012 for a single layer porous aspalt (SLPA). The temporary subtraction factor (article 3.5 of RMG 2012) has not been applied to the calculations, as this factor anticipates future noise emissions. The calculated levels exceed the measured levels by approximately 1.5 dB. After a couple of years this may be reversed as the asphalt is now in new condition. Contrary to what was found at all other motorways under investigation (A2, A10-West, A12 and A16), no underestimation of noise levels during the night time is observed here. Table 8 Measured equivalent noise levels LAeq and Lden, A20 km 30.2 in 2011. calc-meas Calc. (RMG 2012) Measured (Aug-Dec) LAeq, 07-19h 74.3 75.7 1.4 LAeq, 19-23h 72.5 74.4 1.9 LAeq, 23-07h 69.6 71.0 1.4 Lden 77.2 78.7 1.5 Page 18 of 32.
(20) RIVM Letter report 630650003. 2.6. N256 Collijnsplaat Description The site is located on the west side of the N256 in Noord-Beveland in the province of Zeeland. This site differs from the previous sites in the sense that a counting device registers the type of vehicle and speed of each vehicle passing by. This enables to link noise events to individual cars so that emissions can be discerned for different vehicle categories. At the previous monitoring sites this is not possible. To link noise events to individual cars, the cars need to have sufficient separation. Ror this reason, only noise events measured during the night from 2:00 - 4:00 are considered. Trend and comparison with model calculations Table 9 shows the average sound power levels LWA for the different vehicle categories for the years 2005-2011. The average sound power levels for previous years can be found in the Noise Monitor 2010 [Lolkema et al., 2011]. The sound power levels were derived from the measured Sound Exposure Levels (SEL), using a reference speed of 80 km/h for light vehicles and 70 km/h for middle and heavy weight vehicles, see Appendix 3. Also the sound power level according to the new Dutch standard calculation model RMG2012 is given1. Differences with the previous model, RMW2006, are the emission factors for lightweight vehicles.. Table 9 Sound power levels LWA as measured at the N256 Noord-Beveland between 02:00 en 04:00 a.m. for the years 2005-2011, as well as the calculation according to the RMG2012. 2007 2008 2009 2010 2011 RMG2012 Lightweight 105.3 105.7 105.9 106.0 105.8 103.0* Middleweight 108.5 108.9 108.4 108.4 109.0 106.2 Heavyweight 111.2 112.0 111.6 111.3 112.0 109.0 *Only this value differs from the old value in RMG2006: 102.4 dBA. calc-meas -2.8 -2.8 -3.0. No trend in measured Sound Exposure Levels can be observed. However, RMG2012 underestimates the LWA for all vehicle categories by approximately 3 dB(A). This does not mean that RMG2012 underestimates DAC emission in general, but that the DAC pavement at the N256 emits considerably more noise as compared to the DAC reference in RMG2012. One reason may be that the measurements are all done in the night at lower temperature. The precise temperature effect however is still under research. Figure 12 shows the SEL* values as function of the relative speed V/Vref for the different vehicle categories. For each vehicle category a regression line with coefficients is given, as well as the calculated value according to RMG2012.. 1. The subtraction factor (article 110g of Wgh) has not been applied to the calculations, as this factor anticipates future noise emissions.. Page 19 of 32.
(21) RIVM Letter report 630650003. 100 6069 Light Vehicles RMV2012. SEL* (dB(A)). 90. 80. 70. 60 y = 14.653Ln(x) + 72.814 50 0.5. 1. 1.5 V/Vref. 2. 2.5. 100 1586 Middleweight Vehicles RMV2012. SEL* (dB(A)). 90. 80. 70. 60 y = 6.745Ln(x) + 75.986 50 0.5. 1. 1.5. 2. 1.5. 2. V/Vref 100. SEL* (dB(A)). 90. 1012 Heavyweight Vehicles RMV2012. 80. 70. 60 y = 9.6378Ln(x) + 79.018 50 0.5. 1 V/Vref. Figure 12 SEL* values derived from car passages between 02:00 and 04:00 a.m. in the year 2011 as function of the relative speed (V/Vref) for light vehicles (upper panel, blue), middle weight vehicles (middle panel, orange) and heavy weight vehicles (lower panel, purple). The black line gives the trendline for the measured values with its functiondicated in each panel. The colored lines give the calculated values according to the Dutch standard calculation model RMG2012. Page 20 of 32.
(22) RIVM Letter report 630650003. 2.7. Railway noise For railway noise no measurements over 2011 are available. The monitoring at stations at Esch and Tilburg have been terminated and can measurements can no longer be supplied by the track manager Prorail. Under the supervision of the ministry of Infrastucture and Environment, options for installing new monitoring sites are now evaluated. These site will be needed in the framework of the new Dutch noise regulation, SWUNG-1, which is outlined in the next chapter.. Page 21 of 32.
(23) RIVM Letter report 630650003. 3. Outlook to the new Dutch noise regulation (SWUNG-1). 3.1. Introduction This chapter offers an outlook to the new Dutch noise legislation for motorways and railways as set in July 2012, with a focus on the role of measurements in the new system. The new legislation is the first part of a two-step implementations of new noise legislation for noise from roads, railways and industry under the name of ‘SWUNG’. The first part, SWUNG-1, involves the definition of noise ceilings (NC’s) for Dutch motorways and railways. The NC’s are fixed by means of many so called ‘reference points’. The reference points are located at 50 m distance on both sides of motorways and railways and with an individual separation of 100 m. For each reference point, a noise limit (ceiling) is set for the maximum Lden level that the motorway or railway is allowed cause. The noise levels at the reference points are calculated using RMG2012. The aim of the new regulation is to restrict further increase of environmental noise levels due to traffic growth. Each year, the road- and railway manager will have to specify the noise levels on the reference points that were caused in the previous year and take precautionary measures in case the NC’s at these points are exceeded or are bound to do so. On request of the Dutch parliament two important amendments were added to the Environmental Management Act. The amendments state that calculation methods and their results should be validated by measurements. The amendments are stated in Article 11.22 and 11.33 of the new noise Act: -. Article 11.22 states that report of the road- or railway manager containing the calculated noise levels at the NC’s, should contain ‘an account of the validation of the calculated values for the reference points, whereby the validation is to be carried out by measurements of an independent body’.. -. Article 11.33 is of a more general nature and states that Dutch calculation methods must be validated: ‘When calculating the noise levels, as referred to in the preceding paragraph, noise emissions should be based on the average values over the technical life of the road- or railway, which are to be validated by measurements of an independent body’.. The aim of the amendments is that measurements will ensure the new system’s integrity. It should be prevented, e.g. due to overly optimistic assumptions in the calculation method and/or input data, that an increase in noise emission is not sufficiently reflected in the calculated noise levels at the reference points.. The next section discusses options for a suitable measurement approach for validating calculated noise levels at the reference points. A comparison is made for the locations of the existing RIVM noise monitoring sites with the locations of nearby reference points as defined in SWUNG-1. Also, the measurements of 2011 are compared with the NC’s that were set at the reference points in July 2012.. Page 22 of 32.
(24) RIVM Letter report 630650003. 3.2. Criteria for suitable measurement sites The total number of reference points that are defined lies in the order of 65.000, both for the major roads (motorways) and the railways. It is unfeasible to validate the calculated noise levels at each reference point. Validation should therefore take place through a limited number of measurement sites, that should be placed along a representative sample of the Dutch main road- and railway network. Ideally, these measurement sites should coincide with the reference points, but here there are some important points to consider: -. -. -. The standard calculation method, as defined in RMG2012 for determining the noise levels at the reference points, neglects all buildings and dwellings that are screening or refracting the noise in the propagation path. The calculated levels at the reference points merely represent the total noise emission of the road- or railway and only in areas without buildings a direct comparison with measurement is possible. At 50m distance the influence of noise from other sources and the meteorological conditions become more significant and can outweigh the small changes in noise emissions that one wants to monitor. Furthermore, in practice it is not always possible to set up measurements sites at arbitrary points. For example, the landowner has to agree with placement and power for the measurement device must be available.. One could minimize meteorological influences by measuring close (~10-15 m) to the road or railway, but that makes it more difficult to directly compare the measured values with the calculated levels at the reference points. If a measurement point does not coincide with a reference point, one has to make a correction to account for the different location, thereby introducing an extra uncertainty. If the difference in location is not too large, the correction would remain limited and could be accurately determined by a simultaneous measurement of the noise level at the reference point and the monitoring site. To conclude, measurement sites that are suitable for a straight validation of the calculated noise levels at the reference points, should comply with the following criteria: -. The monitoring sites should be set up in areas that are free of buildings and local noise sources (local traffic, mopeds, busses etc). The difference in position, relative to the road or railway, of the reference point and the measurement site should not be too large.. As to the allowable positions when measuring at shorter distance than 50 m, we expect that measurements in the range of 30-50 m are suitable and offer good possibilities for an adequate validation of calculated noise levels and calculation methods used for emission and propagation. In the next paragraph, we look how the current RIVM noise monitoring sites, as reported in the previous chapter, are positioned in relation to the reference points in SWUNG 1.. Page 23 of 32.
(25) RIVM Letter report 630650003. 3.3. Locations of existing sites in relation to SWUNG-1 reference points. Regarding the noise monitoring sites currently managed by RIVM, there are only three sites placed nearby SWUNG-1 reference points, at positions that are free of obstructing buildings. These are: the A2 motorway at Breukelen, the A20 motorway at Rotterdam, and the A16 motorway at Breda. The site along the A10 motorway is located in a dense built up urban area with large opposing buildings that influence the noise propagation. At the site along the A12 motorway, the microphone is placed above a noise barrier that shields the propagation towards the reference point in the built up environment. At the site along the N256 no reference points are defined, as the N256 still does not fall under the SWUNG regulation.. Figure 13 - Figure 15 show the locations of existing RIVM noise monitoring stations at the A2, the A20 and the A16 relative to the nearby reference points as defined in the SWUNG-1 noise regulation for motorways.. 28m. Figure 13 Position of the noise monitoring station at Breukelen along the A2 motorway (at the time under reconstruction) and the nearby SWUNG-reference point nr 34203.. Page 24 of 32.
(26) RIVM Letter report 630650003. 36m. Figure 14 Position of the noise monitoring station at Zevenbergsen hoek (north of Breda) along the A16 motorway and the nearby reference point nr 11226. 42m. Figure 15 Position of the noise monitoring station at Rotterdam along the A20 motorway and the nearby reference point nr 13762. Page 25 of 32.
(27) RIVM Letter report 630650003. Table 10 gives an estimation of the differences that standard models predict because of the geometries at these locations. Table 10 Calculated difference based on geometry between the measurement sites at A2 Breukelen, A16 Breda and A20 Rotterdam and the nearest reference points Site Reference Dist. ref. point Calc. diff. by Measured point ID meas. site geometry difference A2 Breukelen 34203 28 m 3,5 dB(A) 3,4 dB(A) A16 Breda 11226 36 m 5,7 dB(A) 5,6 dB(A) A20 Rotterdam 13762 42 m 8,0 dB(A) -. In order to validate the calculated differences a number of additional measurements were conducted at Breukelen and Breda. Results are given in Figure 16. The averages are also shown in Table 10. At Rotterdam an additional measurement at the reference point was not possible, because it is situated in water.. Reference position. Laeq (dB). Measurem ent Breukelen A2 20120730 76 75 74 73 72 71 70 69 68 67 66 65 64 63 62 61 60 12:00. 12:05. 12:10. 12:15. 12:20. Measurement position. 12:25. 12:30. 12:35. 12:40. Figure 16 Measured noise levels (downwind condition) at the RIVM noise monitoring station ‘A2- Breukelen’ and the nearby SWUNG-1 reference point nr 34203. The average difference is 3,4 dB(A). Page 26 of 32.
(28) RIVM Letter report 630650003. Measurem ent Breda A16 20120813. Reference position. Laeq (dB). Measurement position 81 80 79 78 77 76 75 74 73 72 71 70 69 68 67 66 65 13:10. 13:15. 13:20. 13:25. 13:30. 13:35. 13:40. 13:45. 13:50. 13:55. Figure 17 Measured noise levels at the RIVM noise monitoring station ‘A16 Breda’ and the nearby SWUNG-1 reference point nr 11226. The average difference is 5,6 dB(A).. The measured differences at Breukelen and Breda are in good agreement with calculated difference. Although here only two sites were measured and due to meteorological conditions variations are possible, these results indicate that the measurement position does not have to coincide exactly with the reference position. One can allow a small deviation in position and correct the measurement result without losing too much accuracy. However, it is preferable to keep corrections limited. In practice as a guideline, a preference value of 3 dB and a maximum of approximately 5 dB could be maintained. In addition, in order to limit the errors due to other sources and the influence of wind it seems advantageous to stay within 50 m from the source. This means that SWUNG validation measurement positions preferably should be between 25 to 40 m from the source and should not be outside a range of 15-50 m. As far as the current RIVM monitor stations are concerned, only the stations ‘A2-Breukelen’ and ‘A16Breda comply with this view. To meet the request of the Dutch parliament, the current monitoring network needs to be extended.. Page 27 of 32.
(29) RIVM Letter report 630650003. 4. Conclusions. . Measured noise levels along the motorways at the sites A2 Breukelen, A10 West Amsterdam, A12 Voorburg, A16 Breda and A20 Rotterdam are in good agreement with calculated noise levels using the update Dutch calculation method (RMG 2012). Differences remain within 1 dB.. . At the N256 near Collijnsplaat measured levels are approximately 2 dB higher than calculated noise levels. Here the difference probably is caused by road surface properties that deviate from the reference pavement (DAC).. . To meet the request of the Dutch parliament for as laid down in the amendments of the new SWUNG(1) legislation, both for railways and motorways the existing number of RIVM noise monitoring sites is insufficient.. . The current RIVM noise monitoring network will have to be extended with new monitoring sites that are within sufficient vicinity of the reference points.. . As a guideline, these new measurement sites should not be placed at distances less than 25 m from the outer lanes of the road or from railway tracks.. Page 28 of 32.
(30) RIVM Letter report 630650003. References Lolkema, D.E., Verheijen, E.N.G., Potma, C.J.M. and Jabben, J. (2011) Noise Monitor 2010, RIVM Letter report 630650001/2011, RIVM, Bilthoven. RMG 2012, Reken en Meetvoorschrift Geluid 2012, Ministry of Infrastructure and the Environment, 12 June 2012. Verheijen et al 2011, RIVM report 680017001, ‘Effect van snelheidsverhoging A16 op geluid’, Bilthoven 2011. Verheijen et al 2011, RIVM report 680013002, ‘Effect van dynamische maximumsnelheden op geluid - proeflocatie A20 Rotterdam, Bilthoven 2011.. Page 29 of 32.
(31) RIVM Letter report 630650003. Appendix 1 Locations of measurement stations. Page 30 of 32.
(32) RIVM Letter report 630650003. Appendix 2 Description of measurement equipment. Microphon. cover. antenna container. Microphone. battery charger. Power supply. Figure A1 Measurement system on road monitoring locations. Figure A1 shows how the measurement system is used as monitor for raod noise. One noise monitor consists of: microphone stand+pre-amp, manufactory Larson-Davis, type 2100K; microphone, manufactory Larson-Davis, type 2541; statistical analyser, manufactory Larson-Davis, type 870; gsm-modem with antenna; battery and charger; container. This type of microphone stand is useful for measurements outside. The microphone itself is equipped with a rain cover and heating. The pre-amp has a heating to prevent the amp from moisture. The microphone is covered with a wind screen. The microphone stand comes with built-in pre-amp to amplify the signal. To prevent the microphone and the pre-amp from moisture, silica gel is used and will be replaced every three months. The statistical analyser measures the signal of the microphone and calculates various statistical parameters like Aweighted level LAeq. The analyser has an internal GSM modem with antenna, which is connected to the microphone. A computer attached with a standard modem has to connect to the GSM modem, in order to retrieve the measurement data. On this computer a NMS (Noise Monitoring System) application of Larson-Davis has been installed. The measurements collected from all road locations are stored on a NMS database on a monthly basis.. Page 31 of 32.
(33) RIVM Letter report 630650003. Appendix 3 Regression noise levels N256. In order to compare measured Sound Exposure Levels with the calculated values according to the Dutch standard calculation model RMG2012, the SEL* has been defined as: SEL*meas = SEL meas + 10·log(V/3600) + 10·log(R) + Dground + Dair. (eq A1). with: SEL V R. = = =. Dground = Dair. =. Sound Exposure Level (dB(A)) of the measured vehicle pass-by speed (km/h) distance lane – receiver (6.7 en 9.2 m for nearest and farthest lane, respectively) ground attenuation according to RMG2012, set at an average value of 1 dB air attenuation ~ 0.1 dB. According to the RMG2012 the SEL* value is given by: SEL*. RMG2012. = a + b·log (V/Vref). (eq A2). where: Vref. =. reference speed (80 km/h for light vehicles and 70 km/h for middleweight and heavy vehicles). If the measured SEL* are plotted against the relative speed V/Vref a logarithmic regression curve through the measurement points should coincide closely with the calculated SEL*RMG2012 values. The average sound power level LWA = SEL* (Vref) + 33.. Page 32 of 32.
(34) Noise Monitor 2011 RIVM Letter Report 630650003/2012 D.E. Lolkema | C. Potma | J. Jabben. National Institute for Public Health and the Environment P.O. Box 1 | 3720 BA Bilthoven www.rivm.com.
(35)
Afbeelding

+7


GERELATEERDE DOCUMENTEN
Objective The objective of the project was to accompany and support 250 victims of crime during meetings with the perpetrators in the fifteen-month pilot period, spread over
De palen met daartussen gebundelde riet geven een betere bescherming tegen afkalven van de oever, dan het type met alleen een cocosmat. Het is pas over een jaar goed te zien of
P: Heel vroeger waren er centrale abonnementen op tijdschriften. Er bestond een leesportefeuille die langs röntgenologen rouleerde en eindigde in het BG te Amsterdam. Daar stonden
The ambient seismic field model for this estimate has been derived from a model that comprises the five-layered subsurface geology, seismic source distribution and PSDs, that have
As knowledge on the effect of anthropogenic noise is full of gaps, it would be important to put more effort and funding in acoustic monitoring methods, and in research on the effects
The SBTM entails that selected students enrolled for a four-year degree (Baccalaureus Educationist (BEd)) or a one-year post-graduate certificate in teaching
17 Nevertheless, this copying practice showed that the regional press deemed the story relevant to its readers, and in June and July 1763 extensive reports appeared throughout
Indicates that the post office has been closed.. ; Dul aan dat die padvervoerdiens
