Contact: A.H. Havelaar
Microbiological Laboratory for Health Protection
e-mail: arie.havelaar@rivm.nl
RIVM report 330080001/2006
Priority setting of foodborne pathogens Disease burden and costs of selected enteric pathogens
J.M. Kemmeren, M.-J.J. Mangen, Y.T.H.P. van Duynhoven, A.H. Havelaar
This investigation has been performed by order and for the account of the Ministry of Public Health, Welfare and Sports; Nutrition, Health Protection and Prevention Department, within the framework of project V/330080, Microbial Food Safety.
Abstract
Priority setting of foodborne pathogens – disease burden and costs of selected enteric pathogens.
Toxoplasmosis causes the highest disease burden among seven evaluated foodborne pathogens. This is the preliminary conclusion of a major study of the disease burden and related costs of foodborne pathogens. The other micro-organisms that were studied are
Campylobacter spp., Salmonella spp., Listeria monocytogenes, Escherichia coli O157,
noroviruses and rotaviruses. The viruses caused the highest costs (mainly due to sickness leave). The study aims to support the setting of priorities in food safety policy. Currently, all transmission routes of the micro-organisms were evaluated, the specific contribution of food will be evaluated later. Attention will also be paid to trends, the effectiveness of preventive measures and risk perception by consumers.
Key words: foodborne illness, priority setting, disease burden, cost of illness, gastro-enteritis, toxoplasmosis, listeriosis.
Rapport in het kort
Prioritering van voedsel-overdraagbare micro-organismen – ziektelast en kosten van geselecteerde enterale pathogenen.
Toxoplasmose veroorzaakt van zeven onderzochte ziekteverwekkende micro-organismen de hoogste ziektelast. Dit is een voorlopige conclusie in een groot onderzoek naar ziektelast van door voedsel overdraagbare micro-organismen en de daaraan gerelateerde kosten. De andere onderzochte micro-organismen zijn Campylobacter spp., Salmonella spp., Listeria
monocytogenes, Escherichia coli O157, norovirussen en rotavirussen. De virussen brachten
de hoogste kosten met zich mee (vooral vanwege ziekteverzuim). Het onderzoek is bedoeld als basis voor het stellen van prioriteiten bij het voedselveiligheidsbeleid. Tot dusverre zijn alle overdrachtsroutes van de micro-organismen beschouwd, later zal de specifieke bijdrage van voedsel worden onderzocht. Er zal ook aandacht worden besteed aan trends, de
effectiviteit van preventieve maatregelen en de perceptie van het risico door consumenten. Trefwoorden: voedselinfecties, prioritering, ziektelast, ziektegebonden kosten, gastro-enteritis, toxoplasmose, listeriose.
Contents
Summary 9
1. Introduction 21
1.1 Review of existing literature 21
1.1.1 Surveillance of communicable diseases 21 1.1.2 Food safety 22
1.1.3 Evaluation 22
1.2 Criteria for priority setting 23 1.2.1 Disease burden 23
1.2.2 Cost of illness 23
1.2.3 Food attributable fraction 24 1.2.4 Trends 24
1.2.5 Involved food products and effectiveness of preventive measures 24 1.2.6 Perception 24
1.2.7 Other criteria 25
1.3 Demarcation of the project 25 2. Methods 27
2.1 Outcome trees and incidence 27 2.2 Disease burden 27
2.2.1 Calculation of the disease burden 27 2.3 Cost of illness 29
2.3.1 General approach 29 2.3.2 Assumptions made 31
2.3.3 Other costs related to foodborne pathogens 37 2.4 Discounting 38
2.5 Uncertainty 38
3. Thermophilic Campylobacter spp. 41
3.1 Outcome tree, incidence and duration of illness 41 3.1.1 Outcome tree and incidence 41
3.1.2 Duration of illness and age distribution 42 3.2 Disease burden 44
3.3 Cost-of-illness 45
3.4 Scenario analysis for Campylobacter-associated ReA 48 3.5 Discussion 50
4. Shiga-toxin producing Escherichia coli O157 53 4.1 Outcome tree and incidence 53
4.2 Disease burden 54 5. Salmonella spp. 55
5.1 Outcome tree, incidence and duration of illness 55 5.1.1 Outcome tree and incidence 55
5.1.2 Duration of illness and age distribution 56 5.2 Disease burden 58
5.3 Cost-of-illness 59
5.4 Scenario analysis of Salmonella-associated ReA 62 5.5 Discussion 63
6. Norovirus 65
6.1 Outcome tree, incidence and duration of illness 65 6.1.1 Outcome tree and incidence 65
6.1.2 Duration of illness and age distribution 66 6.2 Disease burden 68
6.3 Cost-of-illness 69 6.4 Discussion 71 7. Rotavirus 73
7.1 Outcome tree, incidence and duration of illness 73 7.1.1 Outcome tree and incidence 73
7.1.2 Duration of illness and age distribution 74 7.2 Disease burden 75
7.3 Cost-of-illness 76 7.4 Discussion 78 8. Listeriosis 81
8.1 Perinatal listeriosis 81
8.1.1 Outcome tree and incidence 81 8.1.2 Disease burden 83
8.2 Acquired listeriosis 85
8.2.1 Outcome tree and incidence 85 8.2.2 Disease burden 87
8.3 Discussion 88 9. Toxoplasmosis 91
9.1 Congenital toxoplasmosis 91 9.1.1 Outcome tree and incidences 91 9.1.2 Disease burden 96
9.2 Acquired toxoplasmosis 98 9.2.1 Outcome tree and incidences 98 9.2.2 Disease burden 100 9.3 Discussion 102 10. General discussion 107 11. Research recommendations 113 References 116 Acknowledgements 121
Abbreviations
Health Outcomes
CNS abnormalities Central Nervous System abnormalities CR Chorioretinitis GE Gastroenteritis
GBS Guillain-Barré Syndrome
HC Hydrocephalus IBD Inflammatory Bowel Disease
ReA Reactive Arthritis
IC Intracranial Calcifications
GP General practitioner
ICU Intensive Care Unit ORS Oral Rehydration Solution
PHL Public health laboratories
Health Status measures
DALY Disability-adjusted life years YLD Years Lived with a Disability YLL Years of Life Lost
Pathogens
NV Norovirus (formerly known as Norwalk-like virus) RV Rotavirus
STEC O157 Shiga toxin producing Escherichia coli serotype O157
Economic terms
COI Cost-of-illness DHC Direct health care costs
DNHC Direct non-health care costs INHC Indirect non-health care costs
Studies
CaSa Case-control study of Salmonella and Campylobacter laboratory-confirmed cases, April 2002 – April 2003
LSI Laboratory surveillance of infectious diseases (Laboratorium Surveillance Infectieziekten)
NIVEL GP-based study on gastroenteritis, 1996-1999
Pienter Population-based sero-prevalence study on toxoplasmosis, 1995-1996 SENSOR Community-based study on gastroenteritis, 1999
TIP Prospective cohort study to the effects of prevention on congenital toxoplasmosis, 1987
Organisations
CBS Statistics Netherlands (Centraal Bureau voor de Statistiek)
CTG National Health Tariffs Authority (College Tarieven Gezondheidszorg) RBM Netherlands Reference Laboratory for Bacterial Meningitis
Summary
Background
Human health is threatened by a wide variety of pathogens transmitted by food. Effective and efficient policy-making on control, prevention and surveillance of these foodborne pathogens requires focusing on the most relevant ones. This study aims to develop a model that helps Dutch decision makers to establish the priority of pathogenic micro-organisms that can (also) be transmitted by food, as a basis for effective and efficient policy-making on control,
prevention and surveillance.
Priority setting of communicable diseases for surveillance or foodborne pathogens has been studied in several countries. Most studies are based on a semi-quantitative approach,
combining scores on several criteria to an overall score. However, there is no objective basis to combine highly divergent criteria on the same scale and then simply add up or multiply all scores. In the present study a quantitative approach is used, also quantifying the uncertainty of the results caused by insufficient or incomplete data.
In most studies disease burden was considered as an important domain. This is in line with general trends in public health research that increasingly present disease burden as a major tool for priority setting. Besides the burden of disease, the costs for the Dutch society of foodborne infections are considered important. In the present study, the disease burden and costs were calculated for all cases, indepent from for example transmission routes. However, this is an on-going project and it is foreseen to expand the framework in the future with other criteria such as trends in incidences; the fraction of illness cases attributable to different food products; efficiency and effectiveness of interventions and risk perception.
Methods
Selected pathogens
For the present study, five enteric and two non-enteric pathogens that can (also) be transmitted by food, were selected: norovirus (NV), rotavirus (RV), thermophilic
Campyobacter spp., Salmonella spp., Shiga-toxin producing Escherichi coli O157 (STEC
O157), Listeria monocytogenes and Toxoplasma gondii. NV and RV were observed to be the most frequent pathogens causing community-acquired gastroenteritis (GE), and
Campylobacter spp. and Salmonella spp. were the most frequently observed bacterial
pathogens. Although most NV and RV cases are acquired in the community, both viruses are responsible for nosocomial infections. NV is a common source of nosocomial infections acquired during a stay in health-care institutions, such as hospitals, nursing homes and homes for elderly. RV is one of the major pathogens triggering nosocomial infections in paediatrics. Programs to reduce foodborne pathogens in the population would have no or only an indirect impact on nosocomial infections. Therefore in the current study only community-acquired NV and RV cases were considered. STEC O157 is an uncommon cause of illness in the
Netherlands, but is associated with severe illness, in particular Haemolytic Uraemic
Syndrome (HUS) in children. Similarly, Listeria monocytogenes and Toxoplasma gondii are rare causes of disease but are associated with severe illness and high case-fatality ratios. Both pathogens may cause prenatal or perinatal death or congenital disease. It is planned to expand the model in the future for other (foodborne) pathogens and emerging zoonoses.
Outcome trees and incidence
In order to assess the burden of disease and the cost of illness for the various pathogens under study, the disease outcomes following infection need to be defined. Therefore, for each pathogen, separate models of the disease process were designed, resulting in outcome trees. Each block in an outcome tree represents a health outcome and transition probabilities between all blocks must be established. In this study the incidence approach was used to estimate the disease burden and cost of illness, i.e. calculating the present (discounted) expected sum of current and future costs accruing to all incident cases of disease in a specific time period, taking into account age-specific disease risk and related illness costs.
All enteric pathogens may cause acute GE, which in most cases is self-limiting within a few days to weeks. For few patients the disease will be fatal. Apart from GE, no other illnesses are known to be related to a NV infection or a RV infection in humans. Campylobacter and Salmonella infections, however, do occasionally result in complications. Reactive arthritis (ReA) is the most significant sequel occurring after salmonellosis. ReA, Guillain-Barré syndrome (GBS), and inflammatory bowel disease (IBD) are the most significant sequelae occurring after campylobacteriosis. GBS is a neurological disease frequently preceded by an acute infectious illness and affecting at least the motor, sensory, and autonomic nerves supplying the limbs. ReA is an acute aseptic arthritis triggered by an infection elsewhere in the body. Crohn’s disease and ulcerative colitis are collectively classified as IBD. IBD is characterized as chronic intestinal disorders of unknown etiology. The frequency of other post-infectious complications following campylobacteriosis or a salmonellosis is low and was therefore disregarded in the current study.
Listeriosis is potentially life-threatening for risk groups like neonates, elderly (especially with co-morbidity) and patients with impaired cell-mediated immunity, mainly because of
complications like meningitis and septicemia. Infections in previously healthy individuals may cause febrile gastroenteritis and are usually mild and self-limiting. Infection of pregnant women and their foetuses or newborns may lead to abortion or premature labour. Infected newborns may suffer from severe systemic infection which may result in death or long-term neurological sequelae. Toxoplasma gondii infections may be congenitally or postnatally acquired. The severity of congenital toxoplasmosis depends on the stage of pregnancy at the time of infection. Infants born from mothers who acquire their infection in the first and second trimester, more frequently show severe congenital toxoplasmosis or the infection may cause abortion / stillbirth. In contrast, the majority of children born of women who acquire their infection during the third trimester are born with the subclinical form of the infection. Clinical manifestations of congenital toxoplasmosis in the first year of life vary from signs of
the classic triad of toxoplasmosis (chorioretinitis, intracranial calcifications and
hydrocephalus) to abnormalities of the central nervous system and neonatal death. Surviving infants may suffer from neurological deficiencies or may develop clinical signs (mostly affecting the eyes) later in life.
Postnatal infection with T. gondii in immunocompetent humans is usually asymptomatic. Severe manifestations, such as encephalitis, sepsis/shock, myocarditis, or hepatitis may occur, but are very rare. Chorioretinitis, however, may be an important consequence.
Data
For all enteric pathogens, the incidence of acute GE in the entire population and the fraction of cases visiting a general practitioner (GP) were based on SENSOR, a community based cohort study in 1999, and NIVEL, a GP based cohort study from 1996-1999. Except for NV and STEC O157, incidences were extrapolated to 2004 following the trend observed in laboratory-confirmed cases. Age-distributions were also based on these studies (RV and NV) or on laboratory surveillance because the observed number of cases in SENSOR and NIVEL was too low. The incidence of hospital admission data was based on data from the National Disease Registry for hospitalisation (Prismant), laboratory surveillance, and additionally studies from England/Wales and the US. The incidence of fatal cases was based on
international risk estimates, applied to Dutch age-specific incidence data. The incidence of Campylobacter-associated GBS, ReA and IBD and STEC O157 associated HUS was based on previous work. The incidence of Salmonella-associated ReA and IBD was estimated by the same approach as for Campylobacter, using specific risk estimates obtained from the literature.
The incidence of listeriosis and resulting fatalities was based on enhanced surveillance, implemented in the Netherlands since 2005 by the Center for Infectious Disease
Epidemiology (RIVM). Data on long-term sequelae were not yet included. The incidence of congenital toxoplasmosis was based on the TIP-study, a cohort study in the South-West of the Netherlands in 1986. The incidence of postnatal Toxoplasma infection was back-calculated from highly uncertain data on the incidence of chorioretinitis not attributed to congenital infections.
Disease burden
The public health impact of different outcomes of infectious disease can be combined in one single measure, the Disability Adjusted Life Year (DALY). DALYs are the sum of years of life lost (YLL) and years lived with disability (YLD). YLL is the number of years of life lost due to early mortality and YLD is the number of years lived with a disability, weighted with a factor between 0 and 1 for the severity of the disability.
The burden of disease, attributable to one agent, is obtained by adding up the impact of all health outcomes associated with this agent. The disease burden is presented both discounted at a rate of 4% and not discounted. Calculating the present (discounted) expected sum of
current and future disease burden is applied because an immediate profit is generally preferred over a profit at a later moment in time.
Severity weights for the different health states were obtained from the Public Health Status and Forecast studies or, GE and GBS on previous specific studies. Estimates on the duration of the adverse health outcomes were derived from the results of earlier studies in the
Netherlands, supplemented with the results of international studies.
Cost of illness
Cost of illness (COI) was calculated for NV, RV, thermophilic Campylobacter spp. and
Salmonella spp., taking all costs to society into account. Direct health care costs (DHC),
direct non-health care costs (DNHC) and indirect non-health care costs (INHC) were based on Dutch cost estimates for the year 2004. In accordance with current guidelines, we did not consider indirect health care costs, which would comprise the future savings in health care costs in the life years lost due to premature death. Costs are presented both discounted and not discounted.
DHC included medical services such as general practice (GP) consultations, specialists’ consultations, hospitalisation, drugs, rehabilitation and other medical services. Travel costs of patients, costs for additional diapers, informal care and co-payments by patients, are some examples of DNHC. INHC are defined as the value of production lost to society due to disease. Production losses could be the consequences of: a) temporary absence from work; b) permanent or long-term disability; and c) premature mortality. Productivity losses were considered for sick individuals and, where available, also for third persons taking care of patients using the friction cost method. The cost estimates as presented in this paper are not exhaustive. In particular, outbreak related costs and the opportunity costs associated with sickness leave from unpaid work have not yet been considered.
Volumes for use of resources and sickness leave were derived using Dutch and international studies. Actual economic costs were derived from Dutch publications and guidelines and, if required, updated to 2004 using published price indices.
Uncertainty
Due to restrictions in available resources, uncertainty analysis for NV, RV, listeriosis and toxoplasmosis was restricted to using low values, most likely values and high values for uncertain parameters only. Variability was not explicitly modelled. Mean or median values were used as point estimates.
For Campylobacter, STEC 0157 and Salmonella, however, second-order stochastic
simulation models were available from previous work. With the help of these models it was possible to explicitly and separately model variability and uncertainty. Given that variability is less important from a decision making point of view, it was chosen to present only the uncertainty around the most likely estimate in the disease burden or cost. For Campylobacter-associated ReA and Salmonella-Campylobacter-associated ReA, however, the uncertainty was too large to be represented by low, most likely and high values or a single frequency distribution. In that
case, results were calculated using different data sources or assumptions. These scenario analyses were carried out for the incidence of ReA and toxoplasmosis, and for the burden of prenatal deaths.
Results
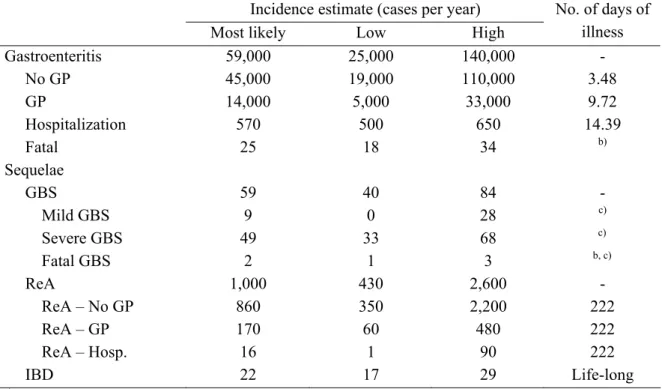
The incidence estimates as used in the current study are summarized in Tables I and II. The estimates relate to a population of 16 million people in 2004.
Table I. Incidence (cases per year) for selected enteric pathogens in the Netherlands, 2004.
Incidence estimate (cases per year)
Most likely Low High
Norovirus GE 470,000 360,000 645,000 No GP 460,000 350,000 625,000 GP 10,000 7,000 16,000 Hospitalisation 1,000 790 2,100 Fatal 5 0 13 Rotavirus GE 190,000 110,000 325,000 No GP 170,000 100,000 305,000 GP 11,000 6,900 17,000 Hospitalisation 3,000 2,000 3,700 Fatal 1.4 0.9 1.7 Campylobacter GE 59,000 25,000 140,000 No GP 45,000 19,000 110,000 GP 14,000 5,000 33,000 Hospitalization 570 500 650 Fatal 25 18 34 Campylobacter sequelae GBS 60 40 85 ReA 1,000 430 2,600 IBD 22 17 29 Salmonella GE 35,000 9,000 140,000 No GP 30,000 7,000 110,000 GP only 5,400 700 20,000 Hospitalisation 640 540 740 Fatal 39 34 42 Salmonella sequelae ReA 460 100 1,900 IBD 7 6 9 STEC O157 GE 1250 85 7200 No GP 1070 75 6300 GP 180 10 860 Fatal 0.6 na na HUS 21 16 29
Table II. Incidence (cases per year) for selected non-enteric pathogens in the Netherlands, 2004 (toxoplasmosis) and 2005 (listeriosis).
Incidence estimate (cases per year)
Most likely Low High
Listeriosis
Perinatal - Death 4 0.7 0.7 - Long term sequelae na na na
Acquired - Sepsis 25 15 40
- Meningitis 15 7 30 - Gastroenteritis 15 7 30 - Pneumonia 10 3 20 - Death 10 5 25 - Long term sequelae 2 1 4
Toxoplasmosis
Postnatal - Still birth 7 6 19 - Chorioretinitis in first year
of life 15 5 35
- Intracranial calcifications 11 0 22 - Hydrocephalus 2 0 5 - CNS abnormalities 16 0 30
- Death 0.5 0 1 - Chorioretinitis later in life 18 6 51
Acquired - Mild symptoms 9,300 6,700 11,000 - Severe symptoms
(chorioretinitis excluded) 470 0 1,500 - Chorioretinitis 200 0 470
na: not available
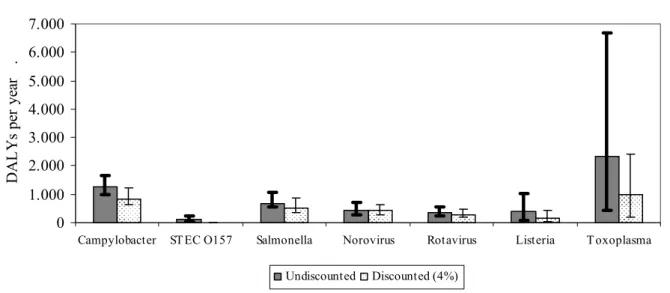
Figure I. Disease burden of infectious diseases that can (also) be transmitted by food in
the Netherlands, 2004 (for listeriosis: 2005). The figure shows the total disease burden associated with different pathogens, undiscounted and discounted at 4%, and the uncertainty around the most likely estimate. 0 1.000 2.000 3.000 4.000 5.000 6.000 7.000
Campylobacter ST EC O157 Salmonella Norovirus Rotavirus Listeria T oxoplasma
D A L Y s p er y ea r . Undiscounted Discounted (4%)
In Figure I the estimated disease burden, most likely estimates and uncertainty range are shown, both undiscounted and discounted at 4%. Most likely estimates for YLD, YLL and DALYs separately are summarized in Table III.
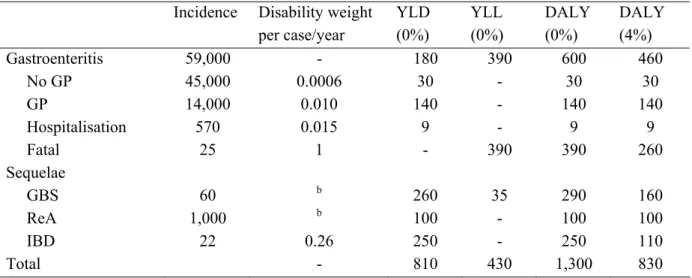
Table III. YLD, YLL and DALY estimates for 2004 (for Listeriosis: 2005) (most likely estimates) of
infectious diseases that can (also) be transmitted by food in the Netherlandsa
Campylobacter STEC
O157
Salmonella Norovirus Rotavirus Listeria Toxoplasma
YLD 810 30 230 390 260 6 1800
YLL 430 84 440 55 110 380 590
DALY 1300 110 670 450 370 390 2400
a Summations do not necessarily tally
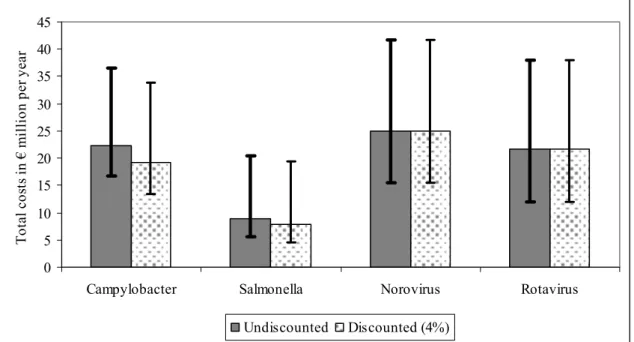
The most likely estimates and the uncertainty range of total cost of illness for 2004 for four pathogens are shown in Figure II. Most likely estimates for DHC, DNHC, INHC separately and total costs are summarized in Table IV.
0 5 10 15 20 25 30 35 40 45
Campylobacter Salmonella Norovirus Rotavirus
T ota l c os ts in € m illio n p er y ea r Undiscounted Discounted (4%)
Figure II. Costs-of-illness of infectious diseases that can (also) be transmitted by food in the
Netherlands. The figure shows the total costs-of-illness associated with different pathogens, undiscounted and discounted at 4%, and the uncertainty around the most likely estimate for the year 2004.
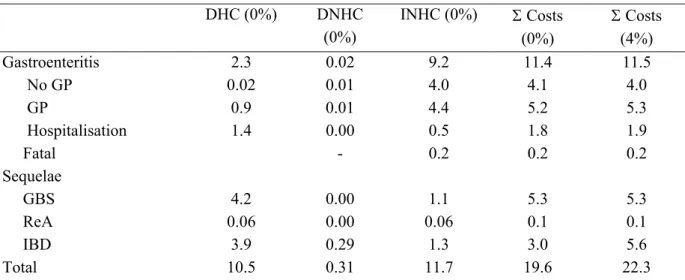
Table IV. DHC, DNHC, INHC and total costs in € million (most likely estimates) of infectious
diseases that can (also) be transmitted by food in the Netherlands, 2004a
Campylobacter Salmonella Norovirus Rotavirus
DHC 10.5 4.0 1.9 7.1
DNHC 0.3 0.1 0.3 0.2
INHC 11.7 4.6 22.8 14.3
Total costs 22.3 8.8 25.0 21.7
The results of our study can also be presented on an individual level instead of a population level. Figures III and IV show the disease burden per case for enteric and non-enteric pathogens, respectively. Note the difference in scale between the two figures, indicating that the individual burden of non-enteric diseases is considerable higher than that of enteric diseases. Discounting has a major effect on the disease burden per case of congential infections.
0 10 20 30 40 50 60 70 80 90 100
Campylobacter STEC O157 Salmonella Norovirus Rotavirus
D A L Y s pe r 10 00 c as es .
Not discounted Discounted (4%)
Figure III. Individual disease burden of enteric infectious diseases that can (also) be transmitted by food in the Netherlands, 2004. Data are presented as average burden per1000 cases of gastro-enteritis in the total population.
0 10 20 30 40 50 60 70 80 90 100
Listeria - C Listeria - A Toxoplasma - C Toxoplasma - A
D A L Y s p er cas e
Not discounted Discounted (4%0
Figure IV. Disease burden of non-enteric infectious diseases that can (also) be transmitted by food in the Netherlands, 2004 (toxoplasmosis) and 2005 (listeriosis). Data are presented as average burden per case of reported congenital or acquired listeriosis, per case of congenital Toxoplasma infection or per case of severe acquired toxoplasmosis. Note the difference in scale with Figure III.
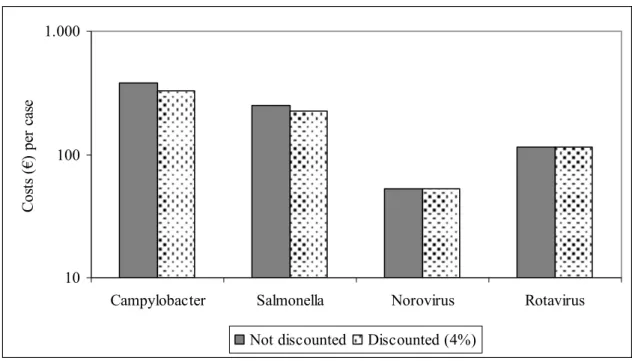
Figure V shows the cost of illness per individual case of gastro-enteritis for four pathogens.
10 100 1.000
Campylobacter Salmonella Norovirus Rotavirus
C os ts (€ ) p er c as e
Not discounted Discounted (4%)
Figure V. Individual cost of illness of enteric infectious diseases that can (also) be transmitted by food in the Netherlands, 2004. Data are presented as average cost per case of gastro-enteritis in the total population.
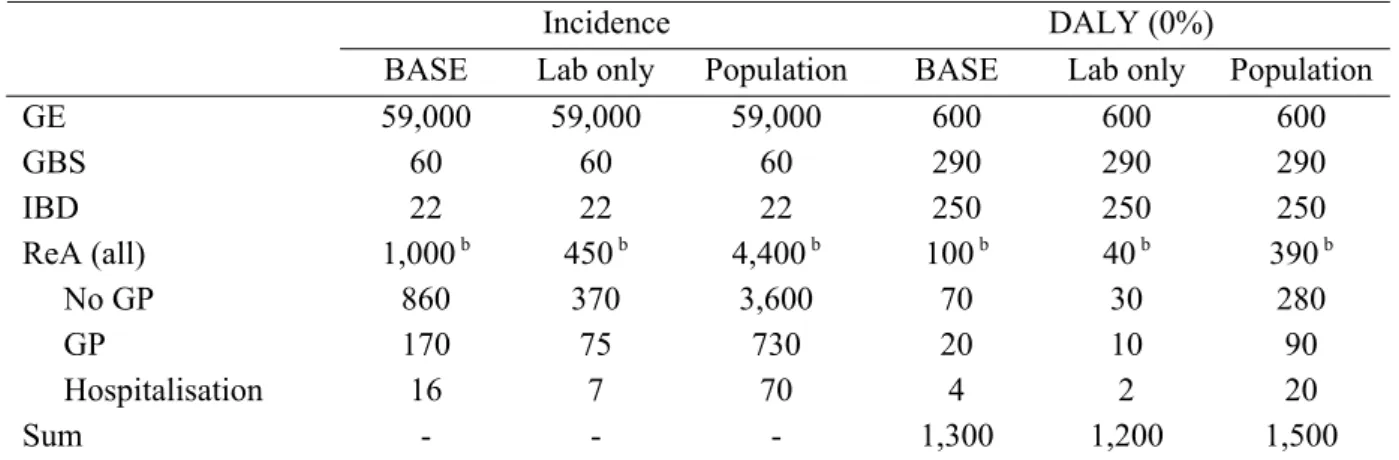
Scenario analysis was applied for Campylobacter and Salmonella-associated ReA. In the baseline model, it was assumed that only patients visiting a GP would be at risk for ReA. The alternative assumption, that also patients who did not visit their GP would be at risk, raised the total disease burden associated with Campylobacter from 1,300 to 1,500 DALYs per year. For Salmonella the burden would increase from 670 to 870 DALYs per year. The cost of illness estimates would increase by less than € 0.5 million for Campylobacter and less than € 0.2 million for Salmonella.
Incidence data for congenital toxoplasmosis were also subjected to scenario analysis. An indirect estimate based on serosurveillance in 1996 (Pienter study) resulted in an estimated incidence rate of 23 cases per 10,000 live births, which is almost threefold the estimate based on the TIP study. Consequently, the disease burden estimate for congenital toxoplasmosis increased from 1,200 to 2,300 DALYs per year. There are no guidelines how to include the impact of abortion or stillbirth in a DALY estimate. In our baseline model we included all prenatal deaths after a gestation period of 24 weeks. Not including any prenatal death would reduce the disease burden of congenital toxoplasmosis to 630 DALYs. If the data from the Pienter study are used to assess the incidence of acquired toxoplasmosis, the disease burden would increase to 4,000 DALYs. Hence, the total disease burden of toxoplasmosis is highly uncertain, but at least 600 DALYs per year, up to a maximum of 5,700 DALYs per year.
Conclusions
Priority setting is a complex process that involves consideration of many different factors and there is no generally accepted single process that will lead to unequivocal conclusions. It is
therefore not expected, nor desirable, that a project on priority setting will lead to a single list of priorities. Rather, the process of priority setting should help to integrate complex
information eventually leading to a structured framework so that it is easily accessible to decision makers, and can easily be updated if new information becomes available. This report presents one step in this direction, by integrating a large body of evidence on the social impact of several infectious diseases that can (also) be transmitted by food into two indicators: disease burden and cost of illness. The choice for these indicators is based on experience from other projects on priority setting. In contrast to other studies on priority setting, a quantitative approach was chosen rather than a qualitative or ranking approach. One advantage of a quantitative approach is that the end result is less dependent on arbitrary choices such as the choice of the type and number of indicators. Also, all factors are weighed in proportion to their true values, instead of on some simplified scale. A disadvantage is that the process is very resource intensive, requiring careful consideration of a large volume of data while many data gaps may exist. Such data gaps result in uncertainties about the final results, but the quantitative approach also helps to prioritize among data needs and to identify key research questions.
Among the pathogens that were evaluated, NV and RV are the agents that cause most cases of gastro-enteritis in the general population. Yet, the disease burden is somewhat lower than that of Salmonella and less than half of that of Campylobacter. This is related to the fact that most cases of viral gastroenteritis are mild, of relatively short duration, and have a low case-fatality ratio. Also, in contrast to viral infections, bacterial gastroenteritis results in more serious sequelae. Often, sequelae associated with bacterial infections are long-lasting and/or chronic, resulting in a considerable disease burden. However, discounting affects the disease burden of both, Campylobacter and Salmonella considerably, because it includes a relatively important component of chronic residual disabilities. For STEC O157, the disease burden in the population is relatively low, but per case it is the highest of all evaluated pathogens. This is mainly related to the relatively high mortality of young children. The disease burden per case of listeriosis and toxoplasmosis is even higher because of high case-fatality ratio’s. Even though the incidence of toxoplasmosis in the Dutch population is very uncertain, our results show that on a population basis Toxoplasma causes the highest disease burden of the seven evaluated pathogens. However, it should be kept in mind that in the disease burden
calculation of acute GE no threshold value was included so no distinctions were made in duration and severity of the disease. Including a threshold value (for example excluding cases who do not visit the GP for their illness) would probably give more valid estimations. This possibly would have resulted in different ranking of the evaluated pathogens.
Using cost of illness as the indicator, the impact of viral gastroenteritis is somewhat larger than that of Campylobacter. Salmonella has the lowest total COI of the four pathogens considered. In all cases, the indirect health care costs (mainly temporary absence from work) were much higher than the direct health care costs. For chronic and long-lasting diseases, such as those associated with bacterial infections, the direct health care costs do contribute significantly to the total cost. Direct non-health care costs were very low for all four
pathogens. These results show that costs associated with foodborne pathogens may have an impact on very different sectors of the society, namely the public health sector, ill citizens and employers. The effects of discounting are limited because most costs relate to acute effects.
The results show that the relative societal impact of foodborne pathogens differs according to the criteria chosen. For example, are all cases considered or only cases searching medical services; what is the indicator chosen (e.g. incidence of illness, incidence of fatal cases, COI or DALYs); what is the perspective taken (for example the society (all costs) or the public health sector only); is the impact on the total population or on an individual considered.
1.
Introduction
The Dutch Ministry of Health, Welfare and Sports wishes to focus its food safety policy on the most relevant pathogens as a basis for effective and efficient decision making on control, prevention and surveillance of foodborne disease. Therefore, the RIVM has been asked to perform a study to establish the priority of pathogenic micro-organisms in food. This report presents the first results of the project. Chapter 1 gives a brief overview of the literature on priority setting of communicable diseases in general and specifically on pathogens in food. It also provides a demarcation of the current project. Chapter 2 describes the methods used in this report. Chapters 3-9 provide information on the primary indicators chosen for priority setting, disease burden and cost of illness, for key enteric pathogens that are (also)
transmitted by food and discuss pathogen-specific issues. Finally, Chapter 10 gives a general discussion of the results obtained so far and an outlook on further work.
1.1
Review of existing literature
In several countries, priority setting of communicable diseases and foodborne pathogens has been studied. In the next paragraphs a short overview of these studies is given, as available at the start of the project (beginning 2004)1.
1.1.1 Surveillance of communicable diseases
Since 1988 several studies have been performed to assess which communicable diseases warranted surveillance. In the studies of the Canadian National Advisory Committee on Epidemiology1 2 on priority setting of several communicable diseases, the sum of the scores on different criteria (i.e. international considerations, other sector interest, incidence, severity, potential to spread to the general population, socioeconomic burden, preventability potential to drive public health policy, risk perception, appearing to or changing patterns over the past five years) were ordered, resulting in an estimation of the importance of the disease for national surveillance. The results of their first study1 showed that from all communicable diseases that were under surveillance, three foodborne pathogens ranked high: salmonellosis (rank 6), botulism (rank 16), and hepatitis A (rank 17). The same kind of strategy was
followed in their study in 19982. Now botulism (rank 10), Creutzfeld-Jacob disease (rank 12),
salmonellosis (rank 16) and hepatitis A (rank 17) were the most important foodborne infections.
In early 1997, the Overview of Communicable Diseases Committee from the Public Health Laboratory Service in the UK carried out a consultation exercise to inform the development of PHLS priorities in communicable diseases for the years 1997 to 19993. The views of PHLS senior staff and scientific committees and consultants in communicable disease control in district health authorities were sought by postal questionnaire, and several organizations of health professionals were asked for their views on the initial findings. The main findings of the exercise were summarized in three areas of priority. High priority foodborne diseases
were: Campylobacter jejuni/coli, Salmonella infections, antimicrobial resistant Salmonella
Typhimurium DT104 infections, Verocytotoxin producing Escherichia coli O157, viral
gastroenteritis (rotavirus and SRSV), and Creutzfeld-Jacob/prion disease. In their study in 1999, the most important foodborne diseases were: E. coli O157 (rank 6), salmonellosis (rank 8) and Campylobacter infections (rank 12)4. More recent studies have not been found.
1.1.2 Food safety
Four publications were found which studied the prioritization of foodborne pathogens more specifically. In a study of the American Food Safety and Inspection Service5 infectious agents transmissible to humans through consumption of undercooked beef were prioritized. Each infectious agent was numerically scored based on potential hazard and potential exposure to human. Highest scores were found for Escherichia coli O157, Salmonella spp. and Listeria
monocytogenes.
In 2002, Ross and Sumner described the development and use of a simple tool for semi-quantitative food safety risk assessment, which has utility for ranking and prioritizing risks from diverse sources6. This tool was used to generate a risk ranking for 10 seafood
hazard/product combinations7. Highest priorities were found for algal biotoxins from uncontrolled waters in an algal event, viruses in shellfish from contaminated waters, and ciguatera from recreational fishing in susceptible areas.
In Canada, the Ontario Ministry of Agriculture and Food is developing a method of systematically ranking food-safety-risks to help prioritize the allocation of food safety resources8. Results from this project are not yet available.
In the USA, the Food Safety Research Consortium is developing decision tools for policy makers to better identify and prioritize opportunities to reduce-food-safety risks and allocate government resources accordingly. With the model, users can produce rankings by
pathogens, by food, and by pathogen-food combination, according to five measures of the impact on public health: number of cases of illness, number of hospitalizations, number of deaths, monetary valuations of health outcomes, and loss of Quality Adjusted Life Years. The model uses a quantitative approach and quantifies the uncertainty of rankings and other results. In practice, the final ranking of the pathogens and pathogen-food combinations depend highly on the criteria9.
1.1.3 Evaluation
Except for one, all studies are based on a semi-quantitative approach: the scores on several criteria (see 2.1.1) are summed to an overall score. However, comparing the studies shows important differences between them with regard to the number of criteria used and the number of criteria per domain (i.e. disease burden, social costs, trends, response, perception, organisation interest, exposure, infectivity). As a consequence, the overall score is dependent on the number of criteria per domain: domains with more than one criterion have implicitly
more weight compared to domains with only one criterion. Also, the arithmetic method for calculating the overall scores differs between the studies which make them less comparable, and the attribution of scores to criteria is arbitrary. For example: is a disease with a high incidence and a low severity (e.g. scores 5 and 1 on the Canadian scale) equally important compared to a disease with a moderate incidence and severity (both score 3)? And do combinations of incidence and severity add as much weight as the sum of scores for risk perception and interest in other sectors? There is no objective basis to combine such highly divergent criteria on the same scale and then simply add up all scores. In this respect, more recent studies in the food safety domain are more balanced; they are based on a more consistent view of the relatedness between different criteria and try to design scales so that they reflect the actual risks. Another disadvantage of the attribution of scores to intervals is the loss of information. For example, if intervals for the incidence of illness are arbitrarily defined as 100-1000 and 1,000-10,000, then two diseases with incidences of 900 and 1,100 would carry different weights, whereas disease with incidence 1,100 and 9,000 would not. So, the validity of semi-quantitative studies is doubtful, and it is difficult to develop consistent criteria and scores. Therefore, in the present study we will use a quantitative approach, although we have to keep in mind that it is important to quantify the uncertainty of the results caused by insufficient data.
1.2
Criteria for priority setting
1.2.1 Disease burden
The previous review showed that disease burden is an important domain. This is in line with general trends in public health research that increasingly present disease burden as a major tool for priority setting. Some examples are the Global Burden of Disease Study by WHO and the World Bank10 and the Dutch series of Public Health Forecast studies11. Accordingly, in the present study, disease burden will be used as primary criterion for the prioritization of foodborne pathogens. To calculate the disease burden an epidemiologic approach will be used, i.e. the surveillance of food-related morbidity and mortality in the Dutch population. Another approach would be one based on risk estimates, which is based on the surveillance of incidence of pathogens in the food chain, combined with consumption and dose-response data. A disadvantage of the latter approach is the lack of data. Besides that, it requires separated risk-assessments for many combinations of pathogens and foods which is
unfeasible. Finally, information about the morbidity and mortality gives a better picture of the influence of foodborne infections on public health, compared to data about microbial
concentrations in food.
1.2.2 Cost of illness
Besides the burden of disease, the costs for the Dutch society of foodborne infections are important as well. Therefore, in the present project we will calculate the direct health care costs and direct non-health care costs as well as indirect non-health care costs associated with foodborne infections and its sequelae. For time reasons, we estimate the cost-of-illness only
for those pathogens for which the disease burden is calculated. For some relevant syndromes (like gastroenteritis and Guillain-Barré syndrome) the costs will be derived from previous Dutch studies12 13. For other syndromes the costs will be derived from international studies. The costs per case for the different illnesses and the different health states combined with the incidence of the syndromes provide us the total costs-of-illness per pathogen.
1.2.3 Food attributable fraction
The estimated incidence and valuation of illnesses caused by each pathogen will be
attributed, by percentage, to food (categories), to obtain estimated incidence and valuation of illnesses caused by each pathogen-food combination. Although in the current report not yet applied, in a later stage the disease burden and cost of illness for the selected pathogens will be expressed in a food attributive fraction. Depending on the availability of the data, the estimates of these food attributed fractions will be based on outbreak studies, case-control studies and expert elicitation.
1.2.4 Trends
Although in some cases the disease burden is still relatively limited, from a policy view an upward trend may be important. Also a downward trend may indicate the efficacy of the current effort. For such reasons, in the present project trends in incidence will be analyzed. Depending on the pathogen and the availability of data, the results will be descriptive or based on regression analysis. Besides trends in incidence, trends in prevalence in the food chain will be assessed as well. The prevalence for a specific pathogen can vary due to
changes in the degree of contamination of domestic or imported food products, changes in the consumption pattern, or changes in volume and origin of imported food. All these trends will be assessed qualitatively.
1.2.5 Involved food products and effectiveness of preventive measures
For all pathogens the proportion of attribution to different food products or categories will be estimated. Some pathogens, like Taenia saginata, can only be transmitted by one product, so this proportion is equal to the total food attributive fraction. Other pathogens can betransmitted by several products. The proportion for each food category will be estimated (quantitatively, when possible) in such a way that the summation is equal to the food attributive fraction. Data for these estimations will be derived from literature and expert elicitation. In the analysis, the uncertainty in the estimates will be taken into account. For the most important pathogens, in terms of disease burden, preventive measures for reducing disease burden will be studied qualitatively. Furthermore, the expected efficacy of these measures and related costs will be indicated.
1.2.6 Perception
The risk concept does not consist exclusively of objectively measurable characteristics of systems but is also a social construct, in which qualitative, socio-psychological characteristics play an important role. This is how existing large differences in money spent on reducing
health risks – where the yield is expressed in terms of postponing death or extending
(healthy) life expectancy – are largely explained. So, besides quantitative criteria, subjective criteria play an important role in the risk perception among the general population.
1.2.7 Other criteria
Besides the criteria included in phase 3, several other criteria are theoretically relevant to study, like health benefits gained in the past, and the efficacy of food inspection. However, making these criteria operational is difficult. Therefore, prioritizing food born pathogens is limited to the earlier mentioned criteria.
1.3
Demarcation of the project
It is impossible to collect and interpret the necessary data for calculating disease burden for all foodborne pathogens. So, the disease burden was only calculated for the most important pathogens. Therefore, pathogens who met one or more of the following criteria were excluded:
1. The incidence in the Netherlands is low (< 20, usually 10 cases per year on a population of 16 million);
2. The infection is usually contracted during a stay in a foreign country; 3. The etiologic significance of the pathogen is not well established.
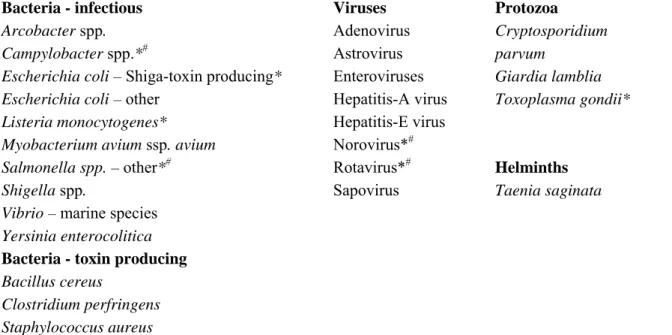
The results of this selection are shown in Table 1. The remaining pathogens are summarized in Table 2.
Table 1. Eliminated pathogens with reasons for elimination.
Pathogen Criterion1 Remarks
Aeromonas spp. Brucella melitensis/abortus/suis Coxiella burnettii Enterobacter sakazakii Francisella tularensis Myobacterium bovis Myobacterium avium ssp. paratuberculosis Salmonella (para)typhi Vibrio cholerae Clostridium botulinum BSE prion Cyclospora cayatenensis Entamoeba histolytica Anisakis simplex Echinococcus granulosis Echinococcus multilocularis Fasciaola hepatica Taenia solium Trichinella spiralis 3 1, 2 1 1 1, 2 1, 2 3 2 1, 2 1 1 1 2 1 1, 23 1, 23 1 1, 23 1, 2 IGZ2: 3
IGZ: 11, average for 1988-2001: 1914 Since 1958 worldwide 70 cases reported15 0 cases per year16
IGZ: 56; stay abroad in > 80% of the cases17 IGZ: 2
IGZ: 1 IGZ: 0
18
19
1 1 = low incidence; 2 = infection contracted mainly during stay abroad; 3 = aetiology not established 2 Number of reported cases by the Dutch Health Care Inspectorate (per year), average for 1998-200220 3 Personal communication J. van der Giessen, RIVM/MGB
Table 2. Selected micro-organisms for calculation of their disease burden.
Bacteria - infectious Viruses Protozoa
Arcobacter spp.
Campylobacter spp.*#
Escherichia coli – Shiga-toxin producing* Escherichia coli – other
Listeria monocytogenes* Myobacterium avium ssp. avium
Salmonella spp. – other*#
Shigella spp.
Vibrio – marine species Yersinia enterocolitica Bacteria - toxin producing Bacillus cereus Clostridium perfringens Staphylococcus aureus Adenovirus Astrovirus Enteroviruses Hepatitis-A virus Hepatitis-E virus Norovirus*# Rotavirus*# Sapovirus Cryptosporidium parvum Giardia lamblia Toxoplasma gondii* Helminths Taenia saginata
Note: the present report concentrates on disease burden estimates for pathogens marked with an asterix (*) and cost of illness estimates for pathogens marked with a cross (#).
2.
Methods
2.1
Outcome trees and incidence
In order to assess the burden of disease and the cost-of-illness for the various pathogens under study, the disease outcomes following each specific exposure and ingestion or infection had to be defined. Therefore for each pathogen, separate models of the disease process had to be collected or designed, resulting in outcome trees. Each block represents a health outcome and transition probabilities between all blocks must be established. In this study we used the incidence approach to estimate the disease burden and cost-of-illness. In the incidence approach, the disease burden and costs-of-illness are defined as the present discounted
expected sum of current and future DALYs and costs accruing to all incident cases of disease in a specific time period, taking into account lifetime probabilities of transiting to each
disease state21. In the present study, data for the various outcome trees were abstracted, where available, from Dutch sources and international literature.
2.2
Disease burden
2.2.1 Calculation of the disease burden
The different outcomes of infectious disease can be combined in one single measure, the Disability Adjusted Life Year (DALY), following the methodology proposed by Murray and co-workers22 23
DALY = YLL + YLD
YLL is the number of years of life lost due to mortality and YLD is the number of years lived with a disability, weighted with a factor between 0 and 1 for the severity of the disability. The YLL due to a specific disease in a specified population is calculated by summation of all fatal cases (n) due to the health outcomes (l) of that specific disease, each case multiplied by the expected individual life span (e) at the age of death. Thus:
∑
× = l l l e d YLLWe derive the expected life span of fatal cases from the standard life tables as reported by Statistics Netherlands or used specific life expectancies for sensitive subgroups as necessary. YLD is calculated by accumulation over all cases (n) and all health outcomes (l) of the product of the duration of the illness (t) and the severity weight (w) of a specific disease:
∑
× × = l l l l t w n YLDInformation on the incidence of illness and death is typically objective data derived from clinical, epidemiological and surveillance studies, whereas information on severity weights is typically derived from elicitation of special panels, preferably from the general population.
Elicitation follows an elaborative protocol. Patients are not well-suited to value their own health or disease state due to coping effects, or, if being aware of the purpose of the use of these data, for risk of aggravation.
The following data were needed for the calculation of DALYs:
Morbidity and mortality
To assess the morbidity and mortality for pathogens, all relevant syndromes associated with a specific pathogen, fatal or not, should be determined. For most of the pathogens,
gastroenteritis is the most common syndrome. However, for a number of pathogens, other syndromes are also important.
For all relevant syndromes the incidence was estimated for 2004, based on syndrome and/or laboratory surveillance data including relevant trends. When no incidence data for the general population were available, data from other sources were used and the degree of
underreporting was estimated.
Duration of the disease
Estimates on the duration of the adverse health outcomes were preferably derived from Dutch studies and where necessary, supplemented with international studies or outbreak studies. Due to selection bias towards more severe and long-term disease, data from laboratory surveillance are not representative for disease in the general populations.
Life expectancy
The mean age of death could be derived from several sources: registrations from Statistics Netherlands for 2004, results from outbreak studies and more specific epidemiological surveys. The life expectancy was based on standard life tables for the general population from Statistics Netherlands. If certain pathogens are associated with severe co-morbidity, life expectancy was, if possible, adjusted for the reduced life span due to these others diseases.
Severity of the disease
The DALY uses explicit preference weights for health status. A major project had been carried out to derive weights for 53 diseases of public health importance, involving the estimation of weights for 175 disease stages and/or severity levels24 25. These weights have the advantage of great detail in terms of severity levels and disease stages. Furthermore, weights for severity were derived from ongoing research in the Netherlands26. Otherwise, severity weights were based on analogous diseases for which weights were already available. For example, for sepsis no severity weight is available. Because of the low incidence, the Dutch Burden of Disease Group decided not to derive a disability weight for this disease. Therefore, we derived a severity weight by taking the disability weight of a disease with a comparable Euroqol-code (i.e. Euroqol-code of sepsis is 333333; Euroqol-code of the
terminal stage of an unspecified disease is 333332 with a severity weight 0.9325). In that case, when necessary the uncertainty was assessed by scenario analysis. The disability weights used in this report are mentioned in Table 3.
Table 3. Disability weights used in this report.
Disability weight Source
Chorioretinitis 0.17 Haagsma et al. (2005) 26 CNS abnormalities 0.09 Melse et al. (1998) 25
Death 1.00 Gastroenteritis Not visiting GP Visiting GP Hospitalized 0.067 0.393 0.393
Havelaar et al. (2000a, b)27 28 Havelaar et al. (2000a, b) 28,27 Havelaar et al (2000a, b) 28,27 Guillain-Barré Syndrome (GBS) a F-score 1 F-score 2 F-score 3 F-score 4 F-score 5 0.10 0.30 0.44 0.80 0.94 Havelaar et al. (2000b) 27 Havelaar et al. (2000b) 27 Havelaar et al. (2000b) 27 Havelaar et al. (2000b) 27 Havelaar et al. (2000b) 27
Hydrocephalus b 0.36 Melse et al. (1998) 25
Inflammatory bowel disease (IBD) 0.26 Mangen
et al. (2004, 2005)12 29h
Intracranial calcificationsc 0.01 Melse et al. (1998) 25 Listeriosis
Mild symptoms (not further specified)c Severe symptoms (not further specified)g
0.01 0.11
Melse et al. (1998) 25 Melse et al. (1998) 25
Meningitis 0.32 Melse et al. (1998) 25
Neurological disordersd 0.25 Melse et al. (1998) 25
Pneumonia 0.04 Melse et al. (1998) 25
Reactive arthritis (ReA) e Not visiting GP Visiting GP Hospitalized 0.127 0.21 0.37 Melse et al. (1998) 25 Melse et al. (1998) 25 Melse et al. (1998) 25
Sepsisf 0.93 Melse et al. (1998) 25
a The functional status of patients with GBS is scored on a seven-point disability scale, ranking from F-score 0 =
healthy (severity weight is 0); to F-score 6 = Death (severity weight is equal to 1).
b Disability weight derived from the disease description ‘Residual symptoms after bacterial infection after birth’
c Disability weight derived from the disease description ‘no to mild difficulties with activities of daily life (ADL)’
d Disability weight derived from the disease description ‘cognitive restrictions after bacterial meningitis’
e Similar as Mangen et al. 12 29 we used disability weights for mild and moderate rheumatoid arthritis, which were
derived from Melse et al.25.
f Disability weight derived from the disease description ‘terminal stage of an unspecified disease’
g Disability weight derived from the disease description ‘large difficulties or not able to ADL’
h Assuming an average clinical course of an average IBD patient, based on Silverstein et al.30, Mangen et al.12 29
estimated the average disability weight /case, using disability weights derived from Melse et al. 25 for different
stages.
2.3
Cost of illness
2.3.1 General approach
Besides the estimation of the burden of disease for the various pathogens under study, the associated costs-of-illness (COI) were estimated. Cost-of-illness studies were applied for
each pathogen separately, using the societal perspective. Following the guidelines of Oostenbrink et al.31, we estimated the cost-of-illness, considering direct health care costs, direct non-health care costs and indirect non-health care costs, using cost estimates for the year 2004. In accordance with the guidelines of Oostenbrink et al.31, this study did not consider indirect health care costs. Indirect health care costs would comprise the future savings in health care costs in the life years lost due to premature death.
Direct health care costs (DHC)
The direct health care cost category included valuation for medical services such as general practice (GP) consultations, specialists’ consultations, hospitalisation, drugs, rehabilitation and other medical services. The direct health care costs were estimated for each pathogen separately, the total direct health care costs were estimated by accumulating the costs for the different medical services for all illness and for all disease severity states related to this pathogen.
For each health outcomes (l) of that specific disease and for each specific medical service, the direct health care costs related to a specific pathogen were estimated by multiplying the number of cases requiring health care service (m) by the required health care service units per case (p) and by the costs per health care service unit (mc). The formula for direct health care costs for a specific pathogen for health outcomes l and for health care service i are in basic notation: l i i i i l mc p m DHC ⎟ ⎠ ⎞ ⎜ ⎝ ⎛ × × =
∑
∑
Direct non-health care costs (DNHC)
Travel costs of patients, costs for additional diapers, informal care and co-payments by patients, are some examples of direct non-health care costs. The direct non-health care costs were estimated for each pathogen separately. For each health outcomes (l) of that specific disease and for each specific non-health care service j, the direct non-health care costs related to a specific pathogen were estimated by multiplying the number of cases requiring non-health care service (r) by the required non-non-health care service units per case (q) and by the costs per non-health care service unit (rc). The formula for direct non-health care costs for a specific pathogen for health outcomes l and for non-health care service j are in basic notation:
l l j j j j q rc r DNHC
∑ ∑
⎟⎟ ⎠ ⎞ ⎜⎜ ⎝ ⎛ × × =Indirect non-health care costs (INHC)
Indirect non-health care costs, which are defined as the value of production lost to society due to disease, were considered in the current study. Production losses could be the consequences of: a) temporary absence from work; b) permanent or long-term disability; and c) premature mortality. We estimated the productivity losses that occur due to sickness leave of sick
individuals, and, where available, information on third persons taking care of patients. In this study we applied the friction cost method to estimate the indirect non-health care costs. In this method, production losses are only considered for the period needed to replace a sick, invalid or dead worker, the so-called ‘friction period32 33. The friction cost method takes into account the economic processes a sick, invalid or dead person can and will be replaced after a period of adaptation32. The length of the friction period depends on the situation on the labour market. A high unemployment rate generally allows fast replacement of a sick, invalid or dead person, whereas in the case of a low unemployment rate, on average more time is needed to find someone on the labour market that could fill in the position. We assumed for the year 2004 a friction period of 154 days, similar to the friction period reported in
Oostenbrink et al.31 for the year 2002.
The indirect non-health care costs for a specific pathogen were estimated for each health outcomes (l) of that specific disease and for each types of sickness leave (k) separately by multiplying the number of cases with sickness leave (s) by the duration of sickness leave (u) by the wage costs (v) per day. The formula for indirect non-health care costs for a specific pathogen for health outcomes l and for each episode of sickness leave k are in basic notation:
∑ ∑
⎟ ⎠ ⎞ ⎜ ⎝ ⎛ × × = l k l k k k u v s INHC GeneralTo calculate the cost-of-illness for the different pathogens, we needed data on the number of cases per age group, the volumes for use of resources and the actual economic costs of each of these items. We needed the information per age group, because of differences in incidence and type of costs (e.g. sickness leave). Details with respect to the assumptions made for the different cost categories are given either in section 2.3.2, if applicable to all pathogens, or are described in more detail in the subsequent chapters, if disease specific.
For some relevant syndromes the associated costs were derived from previous Dutch studies12 and updated to the year 2004. For pathogens where no Dutch cost studies were available, we used published data on medical use and sickness leave, assuming that these data would be similar for the Netherlands. However, wherever possible, Dutch cost unit prices for medical use and sickness leave for the year 2004 were used when estimating the related costs-of-illness for these pathogens.
2.3.2 Assumptions made
Drug use
The only direct health care costs of gastroenteritis patients (GE) not visiting a GP are those for over-the-counter medicines. GE patients visiting a GP, whether hospitalised or not, also use over-the-counter medicines. But apart from these medicines, patients might also have a prescription from their doctor for antibiotics or the like. Hardly any information was available on the drug use for GE cases with specific pathogens, neither over-the-counter medicine nor
other drugs. The only available information on medicine use was that collected in the
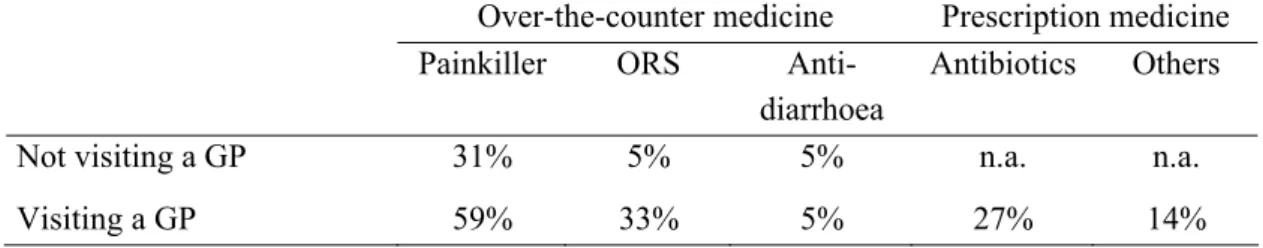
SENSOR study34, a community-based cohort study conducted in 1999 in the Netherlands. In this study, data on the drug use in the Netherlands of GE cases not visiting a GP and GE cases visiting a GP were collected13. The percentage of patients using medicines, as observed in SENSOR, is summarised in Table 4.
Table 4. Percentage of patients not visiting a GP and patients visiting a GP, respectively, using painkillers, oral dehydration solution (ORS), anti-diarrhoea, antibiotics and other medicines as
reported in the SENSOR study (Source: Mangen et al. 12).
Over-the-counter medicine Prescription medicine Painkiller ORS
Anti-diarrhoea
Antibiotics Others Not visiting a GP 31% 5% 5% n.a. n.a.
Visiting a GP 59% 33% 5% 27% 14%
n.a. = not applicable
Based on this information, average costs for drug use of patients not visiting a GP and patients visiting a GP, respectively, were estimated. Results are reported in Table 5. We do know that for small children, in the case of GE, painkillers are hardly used. But on the other hand, ORS and anti-diarrhoea application might be more common in small children than found in the SENSOR study. Therefore, the here presented average drug costs are only an approximation of the potential daily drug costs.
Table 5. Average costs for over-the-counter medicine (in €) per day per patient for GE patients not visiting a GP and GE patients visiting a GP, respectively, and average costs for prescription medicine (in €) per patient for GE patients visiting a GP.
Average costs of over-the-counter medicine (in €) per day
per patient
Average costs of prescription medicine (including prescription
fee) (in €) per patient
Not visiting a GP 0.2 -
Visiting a GP (hospitalised and not hospitalised)
0.5 37.1
GP consultation
Consultation of a GP in the Netherlands might occur either by phone, by a GP practice visit or by a house call from the GP to the patient. Although, inquired by De Wit et al.35, GP telephone consultations of the doctors’ assistant were not included as consultations in their analyses when estimating the incidence of GE cases visiting a GP. Of the considered GP consultations, approximately 90% were GP practice visits and the remaining 10% were house calls from the GP to the patient35. But also the telephone consultations of the doctors’
assistant are a health care service that does cost money. For the recorded 61 GP consultations in the community-based study of De Wit et al.35, an additional 59 telephone consultations were reported. Based on these figures, we assumed that on average per estimated GP
consultation 0.97 additional telephone consultations would occur. For sensitivity reasons, we assumed in our low cost estimate that GP consultations would be limited to GP practice visits, and costs for telephone consultation were not considered in the low cost estimate. No
information were available that would have allowed us a realistic estimate of even more GP consultations than assumed for the most likely estimate. We therefore assumed, similar as for the most likely value that per average estimated GP consultation 0.97 additional telephone consultations would occur. The unit prices for the different GP consultation services are reported in Table 6.
Laboratory-confirmed cases
For some of the patients consulting their GP, a faecal sample is submitted for laboratory testing in order to determine the etiologic agent. In this study we assumed that for each hospitalised patient a faecal sample was submitted for laboratory testing. Subtracting the estimated hospitalised cases from the total number of estimated laboratory-tested positive pathogen-specific cases36 37, we obtained the number of laboratory-tested positive pathogen-specific cases within the group of patients that only visited a GP. Assuming that in general 6 pathogens would be tested, similar as van den Brandhof et al.13; the costs for testing were estimated to be € 67/sample submitted (see Table 6).
Hospitalisation
In the Dutch public health system where the GP is the ‘gatekeeper’ to specialized care, hospitalised patients were assumed to have visited their GP first, before being transferred to a hospital. Based on the total number of Dutch hospital beds, we assumed that approximately 14% of the patients would be admitted to a university hospital and 86% would be admitted to a general hospital38. If not otherwise stated, we assumed that GE patients would stay in a
regular ward room and not in an intensive care unit (ICU). According to the Dutch system, we calculated for each GE patient admitted to the hospital a ‘short subscription’2 for a
paediatrician, if younger than 9 years, and an internist, if 9 years and older. For most medical services we used the cost estimates as reported by Oostenbrink et al.31, but updated to 2004. Furthermore, it was assumed that for each hospitalised GE patients a faecal sample was submitted for laboratory testing. The different costs assumed per medical unit used are given in Table 6.
2 In the Netherlands, apart from their consultation fee and their medical services, specialists charge their patients a so-called ‘subscription fee’. Different forms of fees exist. The short subscription fee is valid for about 1-2 months. If patients return after those 1-2 months an ‘additional subscription fee’ is charged that is then valid for the rest of the year. Patients who need a longer treatment are charged an ‘annual subscription fee’. These fees vary from specialist to specialist. However, only one specialist is allowed to charge these subscription fees per illness. A second specialist involved in the treatment of the illness can only charge what is referred to as a ‘clinical subscription fee’, which is less than the normal subscription fee. For more details see CTG40.