Environmental risk limits for captan
Letter report 601716004/2008
RIVM Letter report 601716004/2008
Environmental risk limits for captan
P.L.A. van Vlaardingen
J.W. Vonk
Contact:
P.L.A. van Vlaardingen
Expertise Centre for Substances
peter.van.vlaardingen@rivm.nl
This investigation has been performed by order and for the account of Directorate-General for
Environmental Protection, Directorate for Soil, Water and Rural Area (BWL), within the framework of the
project "Standard setting for other relevant substances within the WFD".
© RIVM 2008
Parts of this publication may be reproduced, provided acknowledgement is given to the 'National Institute for Public Health and the Environment',
along with the title and year of publication.
Rapport in het kort
Environmental risk limits for captan
Dit rapport geeft milieurisicogrenzen voor het fungicide captan in water. Milieurisicogrenzen zijn de
technisch-wetenschappelijke advieswaarden voor de uiteindelijke milieukwaliteitsnormen in Nederland.
De milieurisicogrenzen zijn afgeleid volgens de methodiek die is voorgeschreven in de Europese
Kaderrichtlijn Water. Hierbij is gebruikgemaakt van de beoordeling in het kader van de Europese toelating
van gewasbeschermingsmiddelen (Richtlijn 91/414/EEG), aangevuld met gegevens uit de openbare
literatuur.
Contents
1
Introduction
7
1.1
Background and scope of the report
7
1.2
Status of the results
7
2
Methods
8
2.1
Data collection
8
2.2
Data evaluation and selection
8
2.3
Derivation of ERLs
9
2.3.1
Drinking water
9
3
Derivation of environmental risk limits for captan
11
3.1
Substance identification, physico-chemical properties, fate and human toxicology
11
3.1.1
Identity
11
3.1.2
Physicochemical properties
11
3.1.3
Behaviour in the environment
12
3.1.4
Bioconcentration and biomagnification
12
3.1.5
Human toxicological threshold limits and carcinogenicity
12
3.2
Trigger values
13
3.3
Toxicity data and derivation of ERLs for water
13
3.3.1
MPC
eco,waterand MPC
eco,marine13
3.3.2
MPC
sp,waterand MPC
sp,marine14
3.3.3
MPC
hh food, water15
3.3.4
MPC
dw, water15
3.3.5
Selection of the MPC
waterand MPC
marine15
3.3.6
MAC
eco15
3.3.7
SRC
eco, water15
3.4
Toxicity data and derivation of ERLs for sediment
16
4
Conclusions
17
References
18
Appendix 1. Information on bioconcentration
19
Appendix 2. Detailed aquatic toxicity data
20
Appendix 3. Detailed bird and mammal toxicity data
28
1
Introduction
1.1
Background and scope of the report
In this report, environmental risk limits (ERLs) for surface water are derived for the fungicide captan. The
derivation is performed within the framework of the project ‘Standard setting for other relevant substances
within the WFD’, which is closely related to the project ‘International and national environmental quality
standards for substances in the Netherlands’ (INS). Captan is part of a series of 25 pesticides that appeared
to have a high environmental impact in the evaluation of the policy document on sustainable crop
protection (‘Tussenevaluatie van de nota Duurzame Gewasbescherming’; MNP, 2006) and/or were
selected by the Water Boards (‘Unie van Waterschappen’; project ‘Schone Bronnen’;
http://www.schonebronnen.nl/).
The following ERLs are considered:
•
Maximum Permissible Concentration (MPC) – the concentration protecting aquatic ecosystems and
humans from effects due to long-term exposure
•
Maximum Acceptable Concentration (MAC
eco) – the concentration protecting aquatic ecosystems from
effects due to short-term exposure or concentration peaks.
•
Serious Risk Concentration (SRC
eco) – the concentration at which possibly serious ecotoxicological
effects are to be expected.
More specific, the following ERLs can be derived depending on the availability of data and characteristics
of the compound:
MPC
eco, waterMPC for freshwater based on ecotoxicological data (direct exposure)
MPC
sp, waterMPC for freshwater based on secondary poisoning
MPC
hh food, waterMPC for fresh and marine water based on human consumption of fishery products
MPC
dw, waterMPC for surface waters intended for the abstraction of drinking water
MAC
eco, waterMAC for freshwater based on ecotoxicological data (direct exposure)
SRC
eco, waterSRC for freshwater based on ecotoxicological data (direct exposure)
MPC
eco, marineMPC for marine water based on ecotoxicological data (direct exposure)
MPC
sp, marineMPC for marine water based on secondary poisoning
MAC
eco, marineMAC for marine water based on ecotoxicological data (direct exposure)
1.2
Status of the results
The results presented in this report have been discussed by the members of the scientific advisory group
for the INS-project (WK-INS). It should be noted that the Environmental Risk Limits (ERLs) in this report
are scientifically derived values, based on (eco)toxicological, fate and physico-chemical data. They serve
as advisory values for the Dutch Steering Committee for Substances, which is appointed to set the
Environmental Quality Standards (EQSs). ERLs should thus be considered as proposed values that do not
have any official status.
2
Methods
The methodology for the derivation of ERLs is described in detail by Van Vlaardingen and Verbruggen
(2007), further referred to as the ‘INS-Guidance’. This guidance is in accordance with the guidance of the
Fraunhofer Institute (FHI; Lepper, 2005).
The process of ERL-derivation contains the following steps: data collection, data evaluation and selection,
and derivation of the ERLs on the basis of the selected data.
2.1
Data collection
In accordance with the WFD, data of existing evaluations were used as a starting point. For captan, the
evaluation report prepared within the framework of EU Directive 91/414/EC (Draft Assessment Report,
DAR) was consulted (EC, 2005; EFSA, 2006; further referred to as DAR). An on-line literature search
was performed on TOXLINE (literature from 1985 to 2001) and Current contents (literature from 1997 to
2007). In addition to this, all potentially relevant references in the RIVM e-tox base and EPA’s ECOTOX
database were checked.
2.2
Data evaluation and selection
For substance identification, physico-chemical properties and environmental behaviour, information from
the List of Endpoints of the DAR was used. When needed, additional information was included according
to the methods as described in Section 2.1 of the INS-Guidance. Information on human toxicological
threshold limits and classification was also primarily taken from the DAR.
Ecotoxicity studies (including bird and mammal studies) were screened for relevant endpoints (i.e. those
endpoints that have consequences at the population level of the test species). All ecotoxicity and
bioaccumulation tests were then thoroughly evaluated with respect to the validity (scientific reliability) of
the study. A detailed description of the evaluation procedure is given in the INS-Guidance (see Section
2.2.2 and 2.3.2). In short, the following reliability indices were assigned:
- Ri 1: Reliable without restriction
’Studies or data … generated according to generally valid and/or internationally accepted testing
guidelines (preferably performed according to GLP) or in which the test parameters documented are
based on a specific (national) testing guideline … or in which all parameters described are closely
related/comparable to a guideline method.’
- Ri 2: Reliable with restrictions
’Studies or data … (mostly not performed according to GLP), in which the test parameters documented
do not totally comply with the specific testing guideline, but are sufficient to accept the data or in
which investigations are described which cannot be subsumed under a testing guideline, but which are
nevertheless well documented and scientifically acceptable.’
- Ri 3: Not reliable
’Studies or data … in which there are interferences between the measuring system and the test
substance or in which organisms/test systems were used which are not relevant in relation to the
exposure (e.g., unphysiologic pathways of application) or which were carried out or generated
according to a method which is not acceptable, the documentation of which is not sufficient for an
assessment and which is not convincing for an expert judgment.’
- Ri 4: Not assignable
’Studies or data … which do not give sufficient experimental details and which are only listed in short
abstracts or secondary literature (books, reviews, etc.).’
All available studies were summarised in data-tables, that are included as Appendices to this report. These
tables contain information on species characteristics, test conditions and endpoints. Explanatory notes are
included with respect to the assignment of the reliability indices.
With respect to the DAR, it was chosen not to re-evaluate the underlying studies. In principle, the
endpoints that were accepted in the DAR were also accepted for ERL-derivation with Ri 2, except in cases
where the reported information was too poor to decide on the reliability or when there was reasonable
doubt on the validity of the tests. This applies especially to DARs prepared in the early 1990s, which do
not always meet the current standards of evaluation and reporting.
In some cases, the characteristics of a compound (i.e. fast hydrolysis, strong sorption, low water solubility)
put special demands on the way toxicity tests are performed. This implies that in some cases endpoints
were not considered reliable, although the test was performed and documented according to accepted
guidelines. If specific choices were made for assigning reliability indices, these are outlined in Section 3.3
of this report.
Endpoints with Ri 1 or 2 are accepted as valid, but this does not automatically mean that the endpoint is
selected for the derivation of ERLs. The validity scores are assigned on the basis of scientific reliability,
but valid endpoints may not be relevant for the purpose of ERL-derivation (e.g. due to inappropriate
exposure times or test conditions that are not relevant for the Dutch situation).
After data collection and validation, toxicity data were combined into an aggregated data table with one
effect value per species according to Section 2.2.6 of the INS-Guidance. When for a species several effect
data were available, the geometric mean of multiple values for the same endpoint was calculated where
possible. Subsequently, when several endpoints were available for one species, the lowest of these
endpoints (per species) is reported in the aggregated data table.
2.3
Derivation of ERLs
For a detailed description of the procedure for derivation of the ERLs, reference is made to the
INS-Guidance. With respect to the selection of the final MPC
watersome additional comments should be made:
2.3.1
Drinking water
The INS-Guidance includes the MPC for surface waters intended for the abstraction of drinking water
(MPC
dw, water) as one of the MPCs from which the lowest value should be selected as the general MPC
water(see INS-Guidance, Section 3.1.6 and 3.1.7). According to the proposal for the daughter directive Priority
Substances, however, the derivation of the AA-EQS (= MPC) should be based on direct exposure,
secondary poisoning, and human exposure due to the consumption of fish. Drinking water was not
included in the proposal and is thus not guiding for the general MPC value. The exact way of
implementation of the MPC
dw, waterin the Netherlands is at present under discussion within the framework
of the “AMvB Kwaliteitseisen en Monitoring Water”. No policy decision has been taken yet, and the
MPC
dw, wateris therefore presented as a separate value in this report. The MPC
wateris thus derived
considering the individual MPCs based on direct exposure (MPC
eco, water), secondary poisoning (MPC
sp,water
) or human consumption of fishery products (MPC
hh food, water); the need for derivation of the latter two
depends on the characteristics of the compound.
Related to this is the inclusion of water treatment for the derivation of the MPC
dw, water. According to the
INS-Guidance (see Section 3.1.7), a substance specific removal efficiency related to simple water
treatment should be derived in case the MPC
dw, wateris lower than the other MPCs. For pesticides, there is
no agreement as yet on how the removal fraction should be calculated, and water treatment is therefore not
taken into account. In case no A1 value is set in Directive 75/440/EEC, the MPC
dw, wateris set to the
general Drinking Water Standard of 0.1 µg/L for organic pesticides as specified in Directive 98/83/EC.
3
Derivation of environmental risk limits for captan
3.1
Substance identification, physico-chemical properties, fate and human
toxicology
3.1.1
Identity
Figure 1. Structural formula of captan.
Table 1. Identification of captan.
Parameter
Name or number
Source
Common/trivial/other name
Captan
Chemical name
N-(trichloromethylthio)cyclohex-4-ene-1,2-dicarboximide
Tomlin, 2002
CAS number
133-06-2
Tomlin, 2002
EC number
205-087-0
Tomlin, 2002
SMILES code
O=C(N(SC(Cl)(Cl)Cl)C(=O)C1CC=CC2)C12
U.S. EPA, 2007
Use class
Fungicide
Mode of action
Non-specific thiol reactant
Tomlin, 2002
Authorised in NL
Yes
Annex 1 listing
Yes
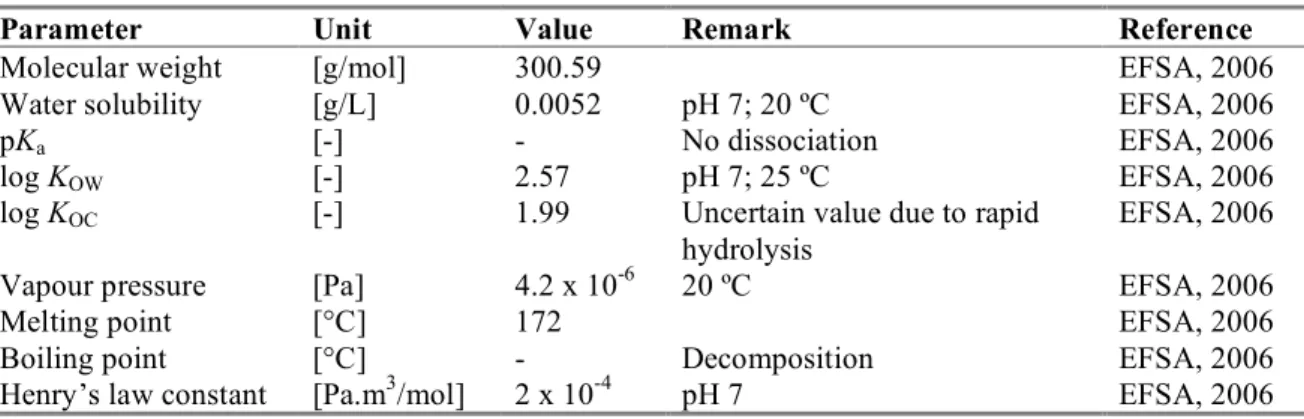
3.1.2
Physicochemical properties
Table 2. Physicochemical properties of captan.
Parameter
Unit
Value
Remark
Reference
Molecular weight
[g/mol]
300.59
EFSA, 2006
Water solubility
[g/L]
0.0052
pH 7; 20 ºC
EFSA, 2006
pK
a[-]
-
No dissociation
EFSA, 2006
log K
OW[-]
2.57
pH 7; 25 ºC
EFSA, 2006
log K
OC[-]
1.99
Uncertain value due to rapid
hydrolysis
EFSA, 2006
Vapour pressure
[Pa]
4.2 x 10
-620 ºC
EFSA, 2006
Melting point
[°C]
172
EFSA, 2006
Boiling point
[°C]
-
Decomposition
EFSA, 2006
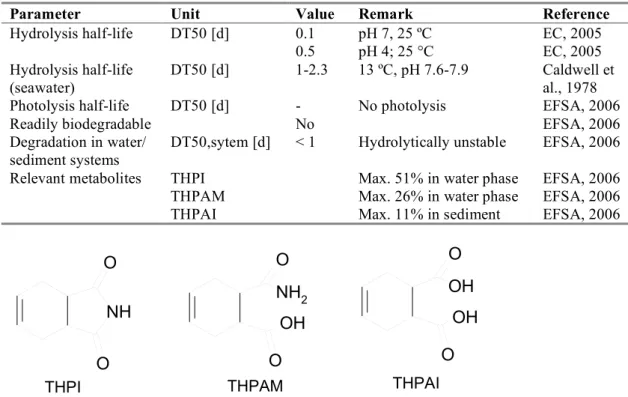
3.1.3
Behaviour in the environment
Table 3. Selected environmental properties of captan.
Parameter
Unit
Value
Remark
Reference
Hydrolysis half-life
DT50 [d]
0.1
pH 7, 25 ºC
EC, 2005
0.5
pH 4; 25 °C
EC, 2005
Hydrolysis half-life
(seawater)
DT50 [d]
1-2.3
13 ºC, pH 7.6-7.9
Caldwell et
al., 1978
Photolysis half-life
DT50 [d]
-
No photolysis
EFSA, 2006
Readily biodegradable
No
EFSA, 2006
Degradation in water/
sediment systems
DT50,sytem [d]
< 1
Hydrolytically unstable
EFSA, 2006
Relevant metabolites
THPI
Max. 51% in water phase
EFSA, 2006
THPAM
Max. 26% in water phase
EFSA, 2006
THPAI
Max. 11% in sediment
EFSA, 2006
NH
O
O
THPI
O
O
NH
2OH
THPAM
O
O
OH
OH
THPAI
Figure 2. Structural formulas of water and sediment metabolites of captan.
3.1.4
Bioconcentration and biomagnification
An overview of the bioaccumulation data for captan is given in Table 4. Detailed bioaccumulation data for
captan are tabulated in Appendix 1.
Table 4. Overview of bioaccumulation data for captan.
Parameter
Unit
Value
Remark
Reference
BCF (fish)
[L/kg]
153
Geometric mean of four values
EFSA, 2006
BMF
[kg/kg]
1
Default value for BFC < 2000 L/kg Van Vlaardingen en
Verbruggen, 2007
3.1.5
Human toxicological threshold limits and carcinogenicity
Captan has the following R phrases: R 23, 40, 41, 43, 50/53. The classification R 63 is not clear (EFSA,
2006). The ADI is 0.1 mg/kg bw. The AOEL is 0.1 mg/kg bw/day. Overall, captan did not show any
genotoxic potential but was found to cause duodenal tumours in mice. A clear threshold for duodenal
tumours in mice was established. The classification Category 3, R40 was proposed (EFSA, 2006).
3.2
Trigger values
This section reports on the trigger values for ERLwater derivation (as demanded in WFD framework).
Table 5. Captan: collected properties for comparison to MPC triggers.
Parameter
Value
Unit
Method/Source
Derived at
section
Log K
p,susp-water1.0
[-]
K
OC× f
OC,susp1K
OC: 3.1.2
BCF
153
[L/kg]
3.1.4
BMF
1
[kg/kg]
3.1.4
Log K
OW2.57
[-]
3.1.2
R-phrases
R 23, 40, 41, 43, 50/53.
[-]
3.1.5
A1 value
1.0
[µg/L]
Total pesticides
DW Standard
0.1
[µg/L]
General value for organic pesticides
1 f
OC,susp= 0.1 kg
OC/kg
solid(EC, 2003).
o
Captan has a log K
p, susp-water< 3; derivation of MPC
sedimentis not triggered.
o
Captan has a log K
p, susp-water< 3; expression of the MPC
wateras MPC
susp, wateris not required.
o
Captan has a BCF ≥ 100 L/kg; assessment of secondary poisoning is triggered.
o
Captan has an R40 classification. Therefore, an MPC
waterfor human health via food (fish)
consumption (MPC
hh food,water) should be derived.
o
For captan, no specific A1 value or Drinking Water Standard is available from Council Directives
75/440, EEC and 98/83/EC, respectively. Therefore, the general Drinking Water Standard for
organic pesticides applies.
3.3
Toxicity data and derivation of ERLs for water
3.3.1
MPC
eco,waterand MPC
eco,marineAn overview of the selected freshwater toxicity data for captan is given in Table 6. Marine toxicity data
are given in Table 7. Detailed aquatic toxicity data for captan are tabulated in Appendix 2.
Because of the extreme fast hydrolysis of captan in water the following criteria for validity were applied to
experiments:
− In static tests if concentrations were not measured: Ri 3;
− in static tests if concentrations were measured (> 80%) and results were based on nominal
concentrations: Ri 2;
− in static tests if concentrations were measured and results were based on initially measured
concentrations (> 80%): Ri 2;
− in static tests if concentrations were measured and results were based on mean measured
concentrations: Ri 2;
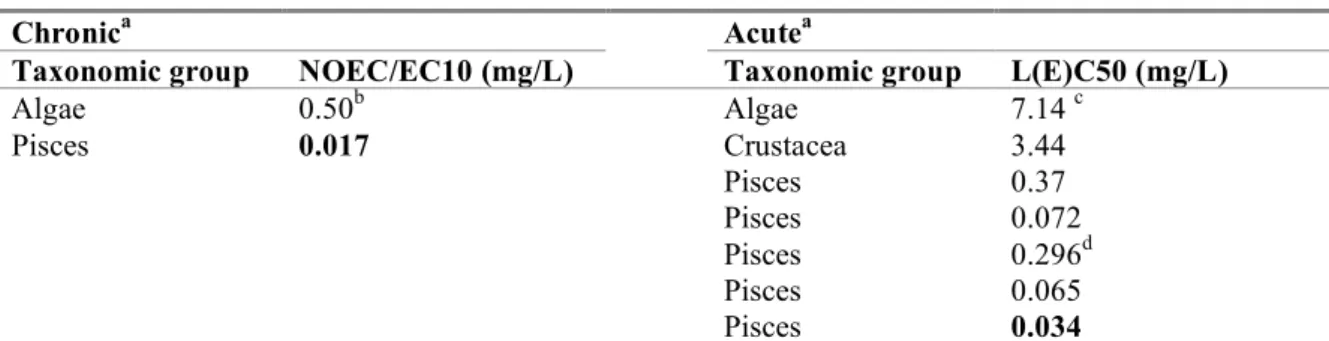
Table 6. Captan: selected freshwater toxicity data for ERL derivation.
Chronic
aAcute
aTaxonomic group
NOEC/EC10 (mg/L)
Taxonomic group
L(E)C50 (mg/L)
Algae
0.50
bAlgae
7.14
cPisces
0.017
Crustacea
3.44
Pisces
0.37
Pisces
0.072
Pisces
0.296
dPisces
0.065
Pisces
0.034
a
For detailed information see Appendix 2. Bold values are used for ERL derivation.
bGeometric mean of 0.72 and 0.34 mg/L for Pseudokirchneriella subcapitata (growth rate)
cGeometric mean of 10 and 5.1 mg/L for Pseudokirchneriella subcapitata (growth rate)
dGeometric mean of 0.47 and 0.186 mg/L for Oncorhynchus mykiss (mortality)
Table 7. Captan: selected marine toxicity data for ERL derivation.
Chronic
aAcute
aTaxonomic group
NOEC/EC10 (mg/L)
Taxonomic group
L(E)C50 (mg/L)
Crustacea
0.0031
a
For detailed information see Appendix 2.
3.3.1.1
Treatment of fresh- and saltwater toxicity data
ERLs for freshwater and marine waters should be derived separately. For pesticides, data can only be
combined if it is possible to determine with high probability that marine organisms are not more sensitive
than freshwater organisms (Lepper, 2005). For captan, not enough marine data are available to make this
comparison and ERLs for the marine compartment cannot be derived.
3.3.1.2
Mesocosm and field studies
No mesocosm studies are available.
3.3.1.3
Derivation of MPC
eco, waterand MPC
eco, marineFor captan, the base set (algae, Daphnia and fish) is complete. Two long-term NOECs of two trophic
levels (algae and fish) are available. Therefore, the MPC
eco, wateris derived using an assessment factor of 50
on the lowest NOEC, i.e. the 96-h NOEC for Pimephales promelas of 0.017 mg/L. The MPC
eco, wateris
0.017/50 = 0.00034 mg/L (0.34 µg/L).
No MPC
eco, marinecan be derived because of the insufficient amount of data available.
3.3.2
MPC
sp,waterand MPC
sp,marineCaptan has a BCF > 100 L/kg, the assessment of secondary poisoning is triggered.
The lowest MPC
oralis 2.78 mg/kg diet for the rat (see Table 8). Subsequently, the MPC
sp, watercan be
calculated using a BCF of 153 L/kg and a BMF of 1 (Table 4) and becomes 2.78 / (153 × 1) = 0.018 mg/L
Table 8. Captan: selected bird and mammal data for ERL derivation.
time
concentration
(mg/kg
diet)
factor
(mg/kg
diet)
Rat
2 year
NOAEL
446
30
14.9
Rat
102 d
NOAEL
250
90
2.78
a
For detailed information see Appendix 3. Bold values are used for ERL derivation.
Because toxicity data for marine predators are generally not available, the MPC
oral, minas derived above is
used as a representative for the marine environment also. To account for the longer food chains in the
marine environment, an additional biomagnification step is introduced (BMF
2). This factor is the same as
given in Table 4. The MPC
sp,marineis 2.78 / (153 × 1 × 1) = 0.018 mg/L (18 µg/L) .
3.3.3
MPC
hh food, waterDerivation of MPC
hh food,waterfor captan is triggered (Table 5). MPC
hh foodis calculated from the ADI (0.1
mg/kg bw), a body weight of 70 kg and a daily fish consumption of 115 g as MPC
hh, food= 0.1 x 0.1 x
70/0.115 = 6.09 mg/kg (Van Vlaardingen en Verbruggen, 2007). Subsequently the MPC
hh food,wateris
calculated according to MPC
hh food,water= 6.09/(BCF
fishx BMF
1) = 6.09/153 x 1 = 0.040 mg/L (40 µg/L).
3.3.4
MPC
dw, waterThe Drinking Water Standard is 0.1 µg/L. Thus, the MPC
dw,wateris also 0.1 µg/L.
3.3.5
Selection of the MPC
waterand MPC
marineThe lowest MPC value should be selected as the general MPC. The lowest value of the routes included
(see Section 2.3.1) is the MPC
eco, water. The MPC
wateris 0.34 µg/L.
No MPC
marinecan be selected due to the insufficient amount of data.
3.3.6
MAC
eco3.3.6.1
MAC
eco,waterThe MAC
eco, watermay be derived from the acute toxicity data. Seven short-term L(E)C
50values for three
trophic levels (fish, Daphnia and algae) are available, captan has a potential to bioaccumulate (BCF > 100
L/kg), the mode of action for the tested species is non-specific and the interspecies variation is high.
Therefore, an assessment factor of 1000 is applied to the lowest L(E)C
50, i.e. the LC
50for Salvelinus
fontinalis: 0.034 mg/L. Therefore, the MAC
ecois derived as 0.034/1000 = 0.000034 mg/L (0.034 µg/L).
However, because the MPC
wateris higher (0.34 µg/L), the MAC
eco, wateris put level with the MPC
waterand
becomes 0.34 µg/L.
3.3.6.2
MAC
eco, marineBecause not sufficient data are available for marine organisms, no MAC
eco, marinecan be derived.
3.3.7
SRC
eco, waterTwo long-term NOECs of two trophic levels are available. The geometric mean of all NOECs (0.0922
mg/L) is higher than the geometric mean of all E(L)C
50s divided by 10 (0.0330 mg/L). Therefore, the
SRC
eco, wateris derived from the geometric mean of the available L(E)C
50s with an assessment factor of 10.
The geometric mean is 0.330 mg/L, the SRC
eco, wateris 0.330/10 = 0.0330 mg/L (33.0 µg/L).
3.4
Toxicity data and derivation of ERLs for sediment
4
Conclusions
In this report, the risk limits Maximum Permissible Concentration (MPC), Maximum Acceptable
Concentration for ecosystems (MAC
eco), and Serious Risk Concentration for ecosystems (SRC
eco) are
derived for captan in water. No risk limits were derived for the marine compartment because data were not
available. Derivation of ERLs for sediment was not triggered.
The ERLs that were obtained are summarised in the table below. The MPC value that was set for this
compound until now, is also presented in this table for comparison reasons.
Table 9. Derived MPC, MAC
eco, and SRC values for captan.
ERL
Unit
MPC
MAC
ecoSRC
Water, old
aµg/L
0.11
-
-
Water, new
bµg/L
0.34
0.34
33.0
Drinking water
bµg/L
0.1
cMarine
µg/L
n.d.
dn.d.
dn.d.
da
MPC based on total content, source: Risico’s van Stoffen http://www.rivm.nl/rvs/
bThe MPC
dw, water
is reported as a separate value from the other MPC
watervalues (MPC
eco, water, MPC
sp, wateror MPC
hh food, water). From these other MPC
watervalues (thus excluding the MPC
dw, water) the lowest one is selected as the ‘overall’
MPC
water.
c
provisional value pending the decision on implementation of the MPC
dw, water
, (see Section 2.3.1)
dn.d. = not derived due to lack of data
References
Caldwell RS, Armstrong DA, Buchanan DV, Mallon MH, Millemann RE. 1978. Toxicity of the Fungicide
Captan to the Dungeness Crab Cancer magister. Mar Biol 48: 11-17.
EC. 2003. Technical Guidance Document in support of Commission Directive 93/67/EEC on Risk
Assessment for new notified substances, Commission Regulation (EC) No.1488/94 on Risk
Assessment for existing substances and Directive 98/9/EC of the European Parliament and of the
Council concerning the placing of biocidal products on the market. Part II. Ispra, Italy: European
Chemicals Bureau, Institute for Health and Consumer Protection. Report no. EUR 20418 EN/2.
EC. 2005. Draft Assessment Report (DAR) Captan. Rapporteur Member State Italy.
EFSA.2006. EFSA Scientific Report, 71. Conclusion on the peer review of captan.
Lepper P. 2005. Manual on the Methodological Framework to Derive Environmental Quality Standards
for Priority Substances in accordance with Article 16 of the Water Framework Directive
(2000/60/EC). 15 September 2005 (unveröffentlicht) ed. Schmallenberg, Germany:
Fraunhofer-Institute Molecular Biology and Applied Ecology.
MNP. 2006. Tussenevaluatie van de nota Duurzame gewasbescherming. Bilthoven, The Netherlands:
Milieu- en Natuurplanbureau. MNP-publicatienummer: 500126001.
Tomlin CDS. 2002. e-Pesticide Manual 2002-2003 (Twelfth edition), Version 2.2. British Crop Protection
Council.
U.S. EPA. 2007. EPI Suite
TM[computer program]. Version 3.2. Washington, DC, U.S.A: U.S.
Environmental Protection Agency (EPA), Office of Pollution Prevention Toxics and Syracuse
Research Company (SRC).
Van Vlaardingen PLA, Verbruggen EMJ. 2007. Guidance for the derivation of environmental risk limits
within the framework of the project 'International and National Environmental Quality Standards for
Substances in the Netherlands' (INS). Bilthoven, The Netherlands: National Institute for Public Health
and the Environment (RIVM). Report no. 601782001. 146 pp.
Appendix 1. Information on bioconcentration
Species Species
properties Test substance Substance purity [%] Analysed Test type Test water pH Hardness [g/L] Exp. time [d] Temperature [°C] Exp. conc. [µg/L] BCF [L/kgww] BCF
type Method Ri Notes Reference
Lepomis macrochirus [14
C-trichloro-methyl]
captan 92 LSC F nw 28+14 d 17 5 140 Whole fish Equilibrium 1 1 EC, 2005
Lepomis macrochirus [14
C-cyclo-hexene]
captan 92 LCS F nw 28+14 d 17 5 113 Whole fish Equilibrium 1 1 EC, 2005
Cyprinus carpio 7.5-9.5 cm,
14-22 g Captan >98 GLC/FTD GLC/ECD F dtw 6.7-6.9 36-38 14+7 d 23-25 1.1 100 Whole fish Equilibrium 2 Tsuda et al., 1992
Gnathopogon caerulescens 3.8-4.3 cm,
0.93-1.43 g Captan >98 GLC/FTD GLC/ECD F dtw 6.7-6.9 36-38 14+3 d 20-21 0.16 350 Whole fish Equilibrium 2 Tsuda et al., 1992 1 The BCF is based on the total radioactivity in fish, not on the concentration of captan in fish.
Appendix 2. Detailed aquatic toxicity data
Table A2.1. Acute toxicity of captan to freshwater organisms.
Species Species properties A Test type Test compound Purity [%] Test water pH T [°C] Hardness CaCO3 [mg/L] Exp.time Criterion Test endpoint Value [mg/L]
Ri Notes Reference
Cyanobacteria
Anabaena azollae N S Captan am 7.5 room 8 d LOEC biomass ! 0.01 3 16,4 Bharati and Angadi, 1981
Anabaena cycadeae N S Captan am 7.5 room 8 d LOEC biomass ! 0.01 3 16, 4 Bharati and Angadi, 1981
Protozoa
Spirostomum ambiguum N Sc Captan am 7.4±0.2 25 4.44 24 h LC50 lethality 0.005 3 27,24,41,
42, 3 Nal"cz-Jawecki et al., 2002
Spirostomum ambiguum N Sc Captan am 7.4±0.2 25 4.44 24 h EC50 deformation 0.004 3 27,24,41,
42,3 Nal"cz-Jawecki et al., 2002
Algae
Chlorella pyrenoidosa 104 cells/mL N S Captan 60.2 am near 8 20±1 96 h IC50 biomass 44.4 3 6,12,14, 15
Antón et al., 1993
Hapalosiphon welwitschii N S am 7.5 room 8 d LOEC growth ! 0.01 3 16,41,2 Bharati and Angadi, 1981
Pseudokirchneriella subcapitata 104 cells/mL Y S Captan 90 am 7.4 24 96 h EC50 growth rate 10 2 44,45,52 EC, 2005
Pseudokirchneriella subcapitata 104 cells/mL Y S Captan 90 am 7.4 24 96 h EC50 biomass (AUG) 1.5 2 44,46,53 EC, 2005
Pseudokirchneriella subcapitata 104
cells/mL Y S 83% WP 83 am 7.3-7.4 24.1-24.2 72 h EC50 growth rate 5.10 2 54 EC, 2005
Pseudokirchneriella subcapitata 104
cells/mL Y S 83% WP 83 am 7.3-7.4 24.1-24.2 72 h EC50 biomass (AUG) 1.18 2 54 EC, 2005
Pseudokirchneriella subcapitata 5 x 10³
cells/mL Captan >98 am 7.7-7.9 21 72 h EC50 growth rate > 5.6 3 Kikuchi, 1993
Pseudokirchneriella subcapitata 5 x 10³ cells/mL Captan >98 am 7.7-7.9 21 72 h EC50 biomass (AUG) 2.60 3 Kikuchi, 1993
Scenedesmus subspicatus 104
cells/mL Y S Merpan 80 WDG 79.6 am 7.2-8.9 23±2 72 h EC50 growth rate 271.8 3 47 EC, 2005
Scenedesmus subspicatus 104 cells/mL Y S Merpan 80 WDG 79.6 am 7.2-8.9 23±2 72 h EC50 biomass (AUG) 50.7 3 55 EC, 2005
Macrophyta
Azolla pinnata bilobed, symbiose with Anabaena azollae
N S Unknown form. 50 nw 21 d EC50 biomass dwt 0.015 3 45,49,51 Kalita and Sarma, 1995
Vallisneria americana non-mycorrhizal laboratory grown
N S am 25 4 h NOEC phosphate uptake
# 50 3 12,31,41 Wigand and Stevenson, 1997
Vallisneria americana field collected, 80% infected with esicular-arbuscular mycorrhizae
N S am 25 4 h LOEC phosphate
uptake # 50 3 12,31,36, 41 Wigand and Stevenson, 1997
Vallisneria americana field collected, 80% infected with esicular-arbuscular mycorrhizae
N S am 25 4 h LOEC ammonium
uptake ! 50 3 12,31,35, 36,41 Wigand and Stevenson, 1997
Mollusca
Indoplanorbis exustus 48 h LC50 mortality 1.4 4 25,28 Hashimoto and Nishiuchi, 1981
Physa acuta 48 h LC50 mortality 1.0 4 25,28 Hashimoto and Nishiuchi, 1981
Semisulcospira libertina 48 h LC50 mortality 1.2 4 25,28 Hashimoto and Nishiuchi, 1981
Crustacea
Daphnia magna < 24 h old Y S Captan 93.5 dtw 7.9 20 170 48 h EC50 Immobilisation > 3.25 2 56 EC, 2005
Daphnia magna < 24 h old Y S Captan 93.5 dtw 7.9 20 170 48 h NOEC Immobilisation 1.10 2 56 EC, 2005
Daphnia magna Y S Captan nw 8.2 20 255 48 h EC50 Immobilisation > 7.1 2 57 EC, 2005
Daphnia magna Y S Captan nw 8.2 20 255 48 h NOEC Immobilisation # 7.1 2 57 EC, 2005
Daphnia magna 6-24 h old Y R Merpan 80 WDG 80 rw 7.9 19.1-19.9 247 48 h EC50 Immobilisation 3.44 2 58 EC, 2005
Species Species properties A Test type Test compound Purity [%] Test water pH T [°C] Hardness CaCO3 [mg/L] Exp.
time Criterion Test endpoint Value [mg/L]
Ri Notes Reference
Daphnia pulex female ad N S Captan tg 24-26 3 h LC50 mortality 1.50 3 Nishiuchi and Hashimoto, 1969
Daphnia pulex 3 h LC50 mortality 1.5 4 25,28 Hashimoto and Nishiuchi, 1981
Daphnia pulex female ad N S Captan tg 24-26 3 h LC50 mortality 1.5 3 28 Nishiuchi and Hashimoto, 1969
Moina macrocopa 3 h LC50 mortality 6.6 4 13,25,28 Hashimoto and Nishiuchi, 1981
Moina macrocopa female ad N S Captan tg 24-26 3 h LC50 mortality 6.8 3 13,28 Nishiuchi and Hashimoto, 1969
Procambarus clarkii immature, 25-36mm N S Captan 80WP dtw 8.4 20±3 100 96 h LC50 mortality 15631 3 12,22 Cheah et al., 1980
Insecta
Cloëon dipterum larvae product 48 h LC50 mortality 1.5 4 25,28 Hashimoto and Nishiuchi, 1981
Pisces
Abramis brama 1.88 g, 4.7 cm N S Captan 95.2 dtw 7.9-8.5 12.7-13.3 172-184 96 h LC50 mortality 0.119 3 44,60 EC, 2005
Abramis brama 1.88 g, 4.7 cm N S Captan 95.2 dtw 7.9-8.5 12.7-13.3 172-184 96 h NOEC tox. symptoms 0.0423 3 44,60 EC, 2005
Carassius auratus 4-8g, 6cm N S tg 60.2 dtw 20±1 96 h LC50 mortality 0.89 3 5,6,14 Antón et al., 1993
Carassius auratus 4-8g, 6cm N S tg 60.2 dtw 20±1 96 h LC100 mortality 1.86 3 5,6,14 Antón et al., 1993
Carassius auratus 48 h LC50 mortality 0.037 4 25,28 Hashimoto and Nishiuchi, 1981
Clarias batrachus ad, 70-75g, 18-19cm N R Captan 75%WP 75 96 h LC50 mortality 4.1036 3 32,33,34,1 Tripathi, 1992
Cpyrinus 48 h LC50 mortality 0.25 4 25,28 Hashimoto and Nishiuchi, 1981
Cyprinus auratus 4.01cm, 1.04g N S Captan tg 23.5±0.5 48 h LC50 mortality 0.037 3 28 Nishiuchi and Hashimoto, 1969
Cyprinus caprio 4.5cm, 1.10g N S Captan tg 23.5±0.5 48 h LC50 mortality 0.25 3 28 Nishiuchi and Hashimoto, 1969
Cyprinus carpio N F Captan 90 dtw 7.6-7.9 22 40 96 h LC50 mortality 0.216 3 44,45,61 EC, 2005
Cyprinus carpio N F Captan 90 dtw 7.6-7.9 22 40 96 h NOEC tox. symptoms 0.16 3 44,45, 61 EC, 2005
Cyprinus carpio 1.7 g, 4.0 cm N S Captan 95.2 dtw 8.1-8.5 20.6-21.1 172-174 96 h LC50 mortality 0.492 3 44,61 EC, 2005
Cyprinus carpio 1.9 g, 5.3 cm N S Captan 95.2 dtw 8.1-8.5 20.6-21.1 172-174 96 h NOEC tox. symptoms 0.113 3 44,61 EC, 2005
Danio rerio larvae, 4 d N S Captan Recrys
tallised dw 90 min LC50 mortality 0.67 3 43 EC, 2005
Gasterosteus aculeatus 0.6 g, 3.46 cm N S Captan 95.2 dtw 7.9-8.4 12-13.6 174-190 96 h LC50 mortality 0.275 3 44,61 EC, 2005
Gasterosteus aculeatus 0.6 g, 3.46 cm N S Captan 95.2 dtw 7.9-8.4 12-13.6 174-190 96 h NOEC tox. symptoms 0.0233 3 44,61 DAR, Jenkins, 2002d
Gasterosteus aculeatus 0.57 g, 3.85 cm Y S Captan 95.4 dtw 12-15 180 96 h LC50 mortality 0.370 2 62 Addendum to EC, 2005
Gasterosteus aculeatus 0.57 g, 3.85 cm Y S Captan 95.4 dtw 12-15 180 96 h NOEC mortality 0.172 2 62 Addendum to EC, 2005
Ictalurus punctatus 1.2 g N S Captan 90 7.4 44 LC50 mortality 0.078 3 Mayer & Ellersieck, 1986
Lepomis macrochirus 1.5 year old Y F Captan 88.4 nw 7.5 45 96 h LC50 mortality 0.072 2 50,63 Hermanutz et al., 1973
Lepomis macrochirus 1.1g N S Captan 90 7.1 44 96 h LC50 mortality 0.140 3 Mayer & Ellersieck, 1986
Misgurnus anguilicaudatus 48 h LC50 mortality 0.34 4 25,28 Hashimoto and Nishiuchi, 1981
Oncorhynchus clarki 0.4 g N S Captan 90 7.4 44 96 h LC50 mortality 0.056 3 Mayer & Ellersieck, 1986
Oncorhynchus kisutch 0.8 g N F Captan 90 7.5 314 96 h LC50 mortality 0.057 3 Mayer & Ellersieck, 1986
Oncorhynchus kisutch 0.8 g N S Captan 90 7.5 44 96 h LC50 mortality 0.140 3 Mayer & Ellersieck, 1986
Oncorhynchus mykiss 34 mm N F Captan 90 dtw 7.5-7.7 15 39 96 h LC50 mortality 0.045 3 44,61 EC, 2005
Oncorhynchus mykiss 34 mm N F Captan 90 dtw 7.5-7.7 15 39 96 h NOEC tox. symptoms 0.016 3 44,45,61 EC, 2005
Oncorhynchus mykiss 1.9 g, 5.3 cm N S Captan 95.2 dtw 7.8-8.5 12.4-13.5 178-180 96 h LC50 mortality 0.205 3 44,61 EC, 2005
Oncorhynchus mykiss 1.9 g, 5.3 cm N S Captan 95.2 dtw 7.8-8.5 12.4-13.5 178-180 96 h NOEC tox. symptoms 0.031 3 44,61 EC, 2005
Oncorhynchus mykiss N F Merpan 80 WDG 79.4 rw 7.1-7.8 12.2-14.1 246-250 96 h LC50 mortality 0.122 3 44,61 EC, 2005
Oncorhynchus mykiss N F Merpan 80 WDG 79.4 rw 7.1-7.8 12.2-14.1 246-250 96 h NOEC tox. symptoms 0.0397 3 44,61 EC, 2005
Oncorhynchus mykiss Y F 83% WP 83 dtw 7.2-7.6 14.7-12.1 27.3-34.4 96 h LC50 mortality 0.161 3 64 EC, 2005
Oncorhynchus mykiss Y F 83% WP 83 dtw 7.2-7.6 14.7-12.1 27.3-34.4 96 h NOEC tox. symptoms 0.085 3 64 EC, 2005
Oncorhynchus mykiss Y S 80% WG 76.5 nw 7.9-8.4 120-128 96 h LC50 mortality 0.47 2 65 EC, 2005
Oncorhynchus mykiss Y S 80% WG 76.5 nw 7.9-8.4 120-128 96 h NOEC tox. symptoms 0.37 2 65 EC, 2005
Oncorhynchus mykiss 12.2 cm, age 375 d N S Captan 50-W 50 nw 7.7 9.4 72 h LC50 mortality 0.16 3 48 Holland et al., 1960
Oncorhynchus mykiss 7.0 cm, age 170 d N S Captan 50-W 50 nw 7.8 13.1 72 h LC61 mortality 0.28 3 48 Holland et al., 1960
Oncorhynchus mykiss 5 d old N W formulation 80 ca. 7.5 10 96 h LC50 mortality 0.075 3 Kikuchi et al., 1996
Species Species properties A Test type Test compound Purity [%] Test water pH T [°C] Hardness CaCO3 [mg/L] Exp.
time Criterion Test endpoint Value [mg/L]
Ri Notes Reference
Oncorhynchus mykiss 83 d old N W formulation 80 ca. 7.5 10-13 96 h LC50 mortality 0.075 3 Kikuchi et al., 1996
Oncorhynchus mykiss 5.3 cm, 1.9 g Y S Captan 95.4 dtw 12-15 180 96 h LC50 mortality 0.186 2 66 Addendum to EC, 2005
Oncorhynchus mykiss 5.3 cm, 1.9 g Y S Captan 95.4 dtw 12-15 180 96 h NOEC mortality 0.118 2 66 Addendum to EC, 2005
Oncorhynchus mykiss 1.0 g N S Captan 90 7.4 44 96 h LC50 mortality 0.073 3 Mayer & Ellersieck, 1986
Oncorhynchus trutta 0.6 g N F Captan 90 7.5 314 96 h LC50 mortality 0.026 3 Mayer & Ellersieck, 1986
Oncorhynchus trutta 0.7g N S Captan 90 7.5 44 96 h LC50 mortality 0.080 3 Mayer & Ellersieck, 1986
Oncorhynchus tshawytscha fingerlings N S Captan 90 7.5 44 96 h LC50 mortality 0.120 3 Mayer & Ellersieck, 1986
Oryzias latipes 2.54 cm, 0,16 g N S Captan tg 23.5±0.5 48 h LC50 mortality 1.0 3 28 Nishiuchi and Hashimoto, 1969
Oryzias latipes 48 h LC50 mortality 1.0 4 25,28 Hashimoto and Nishiuchi, 1981
Oryzias latipes 0.2 g, 2 cm N Captan pa nw 10 48 h LC50 mortality 0.8 3 Tsuji et al., 1986
Oryzias latipes 0.2 g, 2 cm N Captan pa nw 20 48 h LC50 mortality 0.61 3 Tsuji et al., 1986
Oryzias latipes 0.2 g, 2 cm N Captan pa nw 30 48 h LC50 mortality 0.50 3 Tsuji et al., 1986
Perca flavescens 1.0 g N F Captan 90 7.5 314 96 h LC50 mortality 0.12 3 Mayer & Ellersieck, 1986
Pimephales promelas 3.5 months old Y F Captan 88.4 nw 7.5 45 96 h LC50 mortality 0.065 2 51 Hermanutz et al., 1973
Pimephales promelas 0.4 g N F Captan 90 7.5 314 96 h LC50 mortality 0.130 3 Mayer & Ellersieck, 1986
Pimephales promelas 0.3 g N S Captan 90 7.5 44 96 h LC50 mortality 0.20 3 Mayer & Ellersieck, 1986
Rasbora heteromorpha 1-3 cm N F Captan 89 am 8.1 20 96 h LC50 mortality 0.30 3 Tooby et al., 1975
Rutilus rutilus 1.1 g, 4.0 cm N S Captan 95.2 dtw 7.9-8.6 12.9-13.9 172-184 96 h LC50 mortality 0.154 3 44 EC, 2005
Rutilus rutilus 1.1 g, 4.0 cm N S Captan 95.2 dtw 7.9-8.6 12.9-13.9 172-184 96 h NOEC tox. symptoms 0.0423 3 44 EC, 2005
Salmo trutta 3.16 g, 6.0 cm N S Captan 95.2 dtw 7.8-8.5 13.1-14.4 176-182 96 h LC50 mortality 0.098 3 44 EC, 2005
Salmo trutta 3.16 g, 6.0 cm N S Captan 95.2 dtw 7.8-8.5 13.1-14.4 176-182 96 h NOEC tox. symptoms <0.0137 3 44 EC, 2005 salmonoid fish 96 h LC50 mortality 0.056 4 23 Delistraty, 1999
Salvelinus fontinalis 1.5 year old Y F Captan 88.4 nw 7.5 45 96 h LC50 mortality 0.034 2 51 Hermanutz et al., 1973
Salvelinus namaycush 0.42 g N S Captan 90 7.5 44 96 h LC50 mortality 0.049 3 Mayer & Ellersieck, 1986
Salvelinus namaycush fingerlings N F Captan 90 7.5 314 96 h LC50 mortality 0.051 3 Mayer & Ellersieck, 1986
Salvelinus namaycush 2.3 g N S Captan 90 7.4 162 96 h LC50 mortality 0.063 3 Mayer & Ellersieck, 1986
NOTES
1 Unclear whether a formulation or the active substance alone is tested. 2 Unclear whether a formulation or the active substance alone is tested. 3 L(E)C50 determined by graphical interpolation.
4 Unclear whether a formulation or the active substance alone is tested. 5 With aeration.
6 Corrected for purity.
7 Based on nominal test concentrations.
8 Based of measured concentration at the beginning, but after 48h exposition the concentration of captan was less than 0.002 for all test concentration 9 Too high concentration of solvent 1mL/L
10 Only two test concentrations. 11 Hardness recalculated form 14.5°dH.
12 Test concentration above water solubility (5.1mg/l - EPIWIN). 13 Above water solubility (5.1mg/l - EPIWIN).
14 1% concentration of solvents (DMSO or acetone) was used (no information about concentration in test solutions), no control with solvent. 15 Not continuous light, but photoperiod 16/8 light/dark.
16 Growth of the algae was measured in terms of g/10ml wet weight every second day. 17 Nitrate free medium (without KNO3, NaNO3).
18 Growth of the algae was determined using absorbance measurement and result were converted to percentage of control. 19 Value results are estimated from graph ( no the other data in the text or table) and converted from mM concentration.
21 Not clear, if corrected for purity.
22 1% stock solution based on active ingredient in water.
23 Article, where data were obtained from Hazardous Substance Data Bank (HSDB, 1998), no other data test substance and test condition. 24 Hardness calculated (composition of medium is reported).
25 Article is in Japanese, only abstract and tables available in English. 26 Abstract, no other data.
27 Test performed on microplates. 28 Values reported as a TLm.
29 Captan dissolved in acetone than add to 5ml of media, not written how much stock solution was added I estimate high concentration of solvents. 30 Total inhibition of biological activity (CO2 released, denitrification) of cells, CO2 concentrations were zero after 24,48,72 and 96 hours. 31 Only one test concentration.
32 Fishes were acclimatized in tap water (pH 7.3±0.2), not exactly reported if this are also test conditions.
33 Captan dissolved in acetone, not reported how much stock solution was added; control solvent included, but a control without solvent seems omitted. 34 Not clear if corrected for purity.
35 75% greater uptake compared to control but the differences are not statistically significant.
36 The roots in the bottom compartment were separated from shoots in the upper compartment using biocompartmental microcosms, with a leak proof silicone plug. 37 Repeated study according Jenkins 2002d, but with measured test concentration, results are based on mean measured initial concentration.
38 Repeated study according Jenkins 2002a, but with measured test concentration, results are based on mean measured initial concentration 39 Rimless test tube with suba seals.
40 1mL/L of acetone (0.1%).
41 Purity is not clear; it is also not clear if results are reported in mg/L formulation or mg/L active ingredient. 42 Stock dilution prepared in acetone, in test did not exceed 1%.
43 Purity of recrystallised captan not reported; 0.4% acetone used as co-solvent, which showed no effect on mortality in solvent control.
44 Because of the fast hydrolysis of captan the concentration was measured in the stock solution, but not in the test medium. Test result is expressed as nominal captan concentration; fish were not fed 19/21 d prior to and during exposure.
45 Values corrected for the purity of captan.
46 Biomass (Area Under Growth Curve) is not considered to be a reliable endpoint. 47 Extrapolated value. The value is > solubility.
48 Insufficient reporting of test conditions.
49 Experiment performed outdoors in 18 cm deep pots with sediment.
50 LC50 based on most sensitive life stage. Surfactant (Triton X-100) added at 6.7x10⁻⁶ % vol/vol.
51 Surfactant (Triton X-100) added at 6.7x10⁻⁶ % vol/vol; combined effects of captan and surfactant cannot be excluded. Concentrations measured daily; test result based on mean measured concentrations. 52 Concentrations measured only prior to the test; result based on nominal concentration; EC50 is approx. 2 times the aqueous solubility.
53 Concentrations measured only prior to the test; result based on nominal concentration; EC50 is approx. the aqueous solubility. 54 Measured concentrations 74-85% at start and < LOQ at end of test; result expressed as a.s., based on nominal concentrations. 55 Test result is approx. 10x water solubility.
56 Concentrations dropped to < LOQ at 48 h; result based on measured initial concentrations. 57 Measured concentrations 61-73% of nominal; result based on measured initial concentrations.
58 Mean measured concentrations 80% at start, 0-4% at t= 24 h; result expressed as nominal captan concentration.
59 Concentrations were 12 to 39% at the start of the test, below LOQ at end of test; result expressed as nominal captan concentration. 60 Test result is expressed as nominal captan concentration; fish were not fed 19 d prior to and during exposure.
61 Test result is expressed as nominal captan concentration.
62 Test result based on mean measured initial concentrations; concentrations were non detectable at t= 48 h. 63 Concentrations measured daily; test result based on mean measured concentrations.
64 Concentrations in stock solutions 47-65% of nominal; in three lowest treaments captan could not be measured; in highest treatment 260% (at day 0); in other treatments 11-25%; test result is expressed as nominal captan concentration.
65 Concentrations at start of test 98-111% of nominal, and < LOQ at t = 48 and 96 h; test result based on nominal captan concentrations. 66 Concentrations at start of test 79-91% of nominal, and < LOQ at t = 48; test result based on initial measured captan concentrations.
Table A2.2. Acute toxicity of captan to marine organisms.
Species Species properties A Test type Test compound Purity [%] Test water pH T [°C] Salinity [‰] Exp. time Criterion Test endpoint Value [mg/L] Ri Notes Reference Algae/ChlorophytaDunaliella tertiolecta N S Captan 99 30 48 h EC50 2.3 3 2 Mayer, 1986
Algae/Chrysophyta
Isochrysis galbana N S Captan 99 30 48 h EC50 0.21 3 2 Mayer, 1986
Pavlova gyrans N S Captan 99 30 48 h EC50 0.76 3 2 Mayer, 1986
Pavlova tutheri N S Captan 99 30 48 h EC50 0.55 3 2 Mayer, 1986
Algae/Diatomea
Skeletonema costatum N S Captan 99 30 48 h EC50 0.16 3 2 Mayer, 1986
Crustacea
Cancer magister eggs N S Captan 92.8 nw 12-13 30 24h EC50 hatching >10 3 1,2 Caldwell et al., 1978
Cancer magister eggs N S Captan 92.8 nw 12-13 30 24h EC50 development >10 3 1,2 Caldwell et al., 1978
Cancer magister 1st zoael stage N S Captan 92.8 nw 12-13 30 24h EC50 immobility 1.7 3 1,2 Caldwell et al., 1978
1 Hatching in controls and solvent controls was too low: 39 an 36%, respectively (hatching in all other captan treatments was 76%); acetone used as solvent at 0.01%, solvent and control solvent included. 2 Concentrations were not measured.
Table A2.3. Chronic toxicity of captan to freshwater organisms.
Species Species
properties A Test type Test compound Purity [%] Test water pH T [°C] Hardness CaCO3 [mg/L] Exp.
time Criterion Test endpoint Value [mg/L]
Ri
Notes Reference
Cyanobacteria
Anabaena azollae N S Captan am 7.5 room 32 d LOEC growth ! 0.01 3 5,21,25 Bharati and Angadi, 1981
Anabaena cycadeae N S Captan am 7.5 room 32 d LOEC growth ! 0.01 3 5,21,25 Bharati and Angadi, 1981
Aulosira fertilissima N S Hexacap am 25±3 30 d NOEC growth 500 3 6,15,16,22 Gangawane and Saler, 1979
Calothrix sp. N S Hexacap am 25±3 30 d NOEC growth 500 3 6,15,16,22 Gangawane and Saler, 1979
Nostoc sp. N S Hexacap am 25±3 30 d NOEC growth 500 3 6,15,16,22 Gangawane and Saler, 1979
Tolypothrix tenuis N S Hexacap am 25±3 30 d NOEC growth 500 3 6,15,16,22 Gangawane and Saler, 1979
Westiellopsis prolifica N S Hexacap am 25±3 30 d NOEC growth 500 3 6,15,16,22 Gangawane and Saler, 1979
Algae
Chlorella pyrenoidosa 106
cells/mL N S Captan 60.2 am near 8 20±1 96 h NOEC biomass 6.02 3 2,8,9 Antón et al., 1993
Chlorella pyrenoidosa 106
cells/mL N S Captan 60.1 am near 9 20±1 96 h EC10 biomass 5.63 3 2,8,9,10 Antón et al., 1993
Hapalosiphon welwitschii N S am 7.5 room 32 d LOEC growth ! 0.01 3 5,21 Bharati and Angadi, 1981
Pseudokirchneriella
subcapitata 104 cells/mL Y Sc Captan 90 am 7.4 24 96 h NOEC area under the curve (biomass) 0.2 2 7 EC, 2005
Pseudokirchneriella subcapitata
104 cells/mL Y Sc Captan 90 am 7.4 24 96 h NOEC growth rate 0.72 2 7,2 EC, 2005
Pseudokirchneriella subcapitata
104 cells/mL Y Sc Malvin WG 84.62 am 7.3 24 72 h NOEC area under the curve
(biomass) 0.34 2 2,7 EC, 2005
Pseudokirchneriella
subcapitata 10
4
cells/mL Y Sc Malvin WG 84.62 am 7.3 24 72 h NOEC growth rate 0.34 2 2,7 EC, 2005
Scenedesmus subspicatus Y Sc Merpan
80WDG 79.6 am 7.2-8.91 23±2 72 h NOEC area under the curve(biomass) 7.96 3 2,6,7 EC, 2005
Scenedesmus subspicatus Y Sc Merpan
80WDG 79.6 am 7.2-8.91 23±2 72 h NOEC growth rate 15.1 3 2,6,7 EC, 2005
Crustacea
Daphnia magna <24hr old, first
instar Y R Captan 90 rw 8.0-8.4 20 173 21 d NOEC mortality 0.50 3 1,24 EC, 2005
Daphnia magna <24hr old, first
instar Y R Captan 90 rw 8.0-8.4 20 173 21 d EC50 reproduction > 0.9 3 1,24 EC, 2005
Pisces
Clarias batrachus adult, 70-75 g,
18-19 cm N R Captan 75%WP 76 tw 7.3±0.2 room 40 d LC50 mortality 0.5473 3 18,19,20 Tripathi, 1992
Oncorhynchus mykiss N F Captan 90 dtw 7.3-8.1 15 34-47 21 d LC50 mortality 0.068 3 1 EC, 2005
Oncorhynchus mykiss N F Captan 90 dtw 7.3-8.1 15 34-47 21 d NOEC mortality 0.056 3 1 EC, 2005
Oncorhynchus mykiss Y R Merpan 83WP 81.7 rw 7.05-8.5
12.2-13.7 244-270 28 d LC50 mortality >0.1992 2 2 EC, 2005
Oncorhynchus mykiss Y R Merpan 83WP 81.7 rw 7.05-8.5
12.2-13.7 244-270 28 d NOEC mortality #0.1992 2 2 EC, 2005
Pimephales promelas 9 d old Y F Captan 88.4 nw 7.5 45 45 w NOEC mortality 0.040 2 26,30 Hermanutz et al., 1973
Pimephales promelas 9 d old Y F Captan 88.4 nw 7.5 45 45 w NOEC growth 0.017 2 26,30 Hermanutz et al., 1973
Pimephales promelas 1 d old, ELS Y F Captan 88.4 nw 7.5 45 30 d NOEC mortality 0.017 2 26,30 Hermanutz et al., 1973
Pimephales promelas 1 d old, ELS Y F Captan 88.4 nw 7.5 45 30 d NOEC growth 0.017 2 26,30 Hermanutz et al., 1973
Species Species
properties A Test type Test compound Purity [%] Test water pH T [°C] Hardness CaCO3 [mg/L] Exp.
time Criterion Test endpoint Value [mg/L]
Ri
Notes Reference
Pimephales promelas adult Y F Captan 88.4 nw 7.5 45 30 d EC10 egg spawning 0.00059 4 26,27,29,32 Hermanutz et al., 1973
NOTES
1 Measured were only stock solution (between 80-100%), value based of nominal test concentration. 2 Corrected for purity (in the study).
3 Using 0.4% acetone - no mortality in solvent control. 4 Recrystallised captan.
5 Growth of the algae was measured in terms of g/10ml wet weight every eight day. 6 Far above water solubility limit (5.1mg/l - EPIWIN).
7 Based of nominal test concentration.
8 Number of inoculated cells too high to sustain exponential growth, which shows in the control; EC50 at mean aqueous solubility; 1% concentration of solvents (DMSO or acetone) were used (no information about concentration in test solutions), no control with solvent.
9 Photoperiod 16/8 light/dark.
10 Value estimated from graph (using TECHDIG) and then calculated with software TOXEDO. 11 Nitrate free medium (without KNO3, NaNO3).
12 Growth of the algae was determined using absorbance measurement and result were converted to percentage of control. 13 Value results are estimated from graph ( no the other data in the text or table) and converted from mM concentration. 14 No clear duration and condition of the test, not clear what compound was used pure or formulated and if corrected. 15 Fogg´s nitrogen free medium.
16 Incubation for 8 hours at light intensity 1500lux at 25±3 and than allowed to grow for 30 days.
17 Test in petri dishes moist chamber, seeds were irrigated with 10 ml of pesticide suspension, no other data available about test conditions, only one test concentration. 18 Fishes were acclimatized in tap water (pH 7.3±0.2), not exactly reported if this are also test conditions.
19 Captan dissolved in acetone, not written how much stock solution was added, appropriate amount of solvent also in control. 20 Not clear if corrected for purity.
21 Purity is not clear; it is also not clear if results are reported in mg/L formulation or mg/L active ingredient. 22 Results expressed as active ingredient..
23 Calculated from fig 2 (using TECHDIG)
24 Author of DAR summary reports: it was not possible to analyse captan in the test media due to rapid hydrolysis. 25 Unclear whether a formulation or the active substance alone is tested.
26 Surfactant (Triton X-100) added at 6.7x10⁻⁶% vol/vol. 27 EC10 below lowest effect concentration.
28 EC10 calculated by fitting log-logistic dose-effect relationship; EC10 estimate with high uncertainty (95% CI = 0.023-54 $g/L) due to high variation in first two treatments. 29 EC10 calculated by fitting log-logistic dose-effect relationship; EC10 estimate with high uncertainty (95% CI = 0.0045-78 $g/L) due to high variation in first two treatments. 30 Concentrations measured daily; test result based on mean measured concentrations.
31 Concentrations measured daily; test result based on mean measured concentrations; EC10 calculated by fitting log-logistic dose-effect relationship; EC10 estimate with high uncertainty (0.023-54 $g/L) due to high variation in first two treatments.
32 Concentrations measured daily; test result based on mean measured concentrations; EC10 calculated by fitting log-logistic dose-effect relationship; EC10 estimate with high uncertainty (0.0045-78 $g/L) due to high variation in first two treatments.
Table A2.4. Chronic toxicity of captan to marine organisms.
Species Species
properties A Test type Test compound Purity [%] Test water pH T [°C] Salinity [‰] Exp.
time Criterion Test endpoint Value [mg/L] Ri Notes Reference Crustacea
Artemia salina eggs N S captan ag 7-8 27 20 48 h NOEC hatching # 10 3 4,10 Kuwabara et al., 1980
Cancer magister 1st stage zoae N R Orthocide - 50W 50 nw 7.6-7.9 13 25 96 h EC50 cessation of swimming 0.36 2 1 Armstrong et al., 1976
Cancer magister 1st stage zoae N R Orthocide - 50W 50 nw 7.6-7.9 13 25 96 h LC50 mortality 8.0 3 1,4 Armstrong et al., 1976
Cancer magister 1st stage zoae Y F captan 92.8 nw 8.1 12.3±0.5 28.8±1.4 9 d LC50 mortality 0.45 1 2,3 Caldwell et al., 1978
Cancer magister 1st stage zoae Y F captan 92.8 nw 8.1 12.3±0.5 28.8±1.4 21 d LC100 mortality 0.45 1 2,3 Caldwell et al., 1978
Cancer magister 1st stage zoae Y F captan 92.8 nw 8.1 12.3±0.5 28.8±1.4 69 d NOEC molting 0.0031 1 2,3 Caldwell et al., 1978
Cancer magister juv; 1st instar Y F captan 92.8 nw 7.2-8.2 13±2 31-34 36 d NOEC mortality # 0.51 1 2,6,9,3 Caldwell et al., 1978
Cancer magister juv; 3rd instar Y F captan 92.8 nw 7.3-8.1 13±1 32-34.5 80 d NOEC mortality # 0.29 1 2,7,8,9,3 Caldwell et al., 1978
Cancer magister ad Y F captan 92.8 nw 7.0-8.3 11-15 32.4 75 d NOEC mortality # 0.34 1 2,9,8,3 Caldwell et al., 1978
NOTES
1 Test concentrations were adjusted for the percentage of active ingredients. 2 Acetone used as solvent at 0.01%, solvent and control solvent included. 3 Result expressed as mean measured captan concentration.
4 Above water solubility limits (5.1mg/l - EPIWIN). 5 Results are based on the nominal test concentration.
6 Four concentrations tested; in the test aquarium on the bottom a 1 cm layer of sand. 7 In the test aquarium on the bottom a 2 cm layer of sand.
8 Only two test concentrations.
9 Results are expressed in terms of the measured captan test concentration at the beginning, after 24 hours the concentrations of captan remaining in seawater were 48-74% - half life estimate from these data 23 to 54 hours. 10 Solvents acetone or DMSO used at 2%.
Appendix 3. Detailed bird and mammal toxicity data
Species Species
properties Test compound Purity [%]
Application
route Vehicle Test duration Exposure time Criterion Test endpoint Value [mg/kgbw.d] Value [mg/kgdiet] Ri Notes Reference Birds
Colinus virginianus 11 d old Captan 90 Diet 5 d 8 d LC50 Mortality > 4680 2 1 EC, 2005
Colinus virginianus 11 d old Captan 90 Diet 5 d 8 d NOEC Body weight 1170 2 1 EC, 2005
Colinus virginianus 5 months old Captan 91 Diet Corn oil 20 w 18 w NOEC Reproduction # 910 2 1 EC, 2005
Anas platyrhynchos 8 d old Captan 90 Diet 5 d 8 d LC50 Mortality > 4680 2 1 EC, 2005
Anas platyrhynchos 8 d old Captan 90 5 d 8 d NOEC Body weight 1170 2 1 EC, 2005
Anas platyrhynchos 6 months old Captan 91 Diet Corn oil 21 w 19 w NOEC Body weight # 910 2 1 EC, 2005
Mammals
Rat CD strain, male and
female Captan 89 Diet 2 year NOAEL Body weight 22.3 446 2 1 EC, 2005
Dog Beagle, male and
female Captan 90.4 Diet 1 year NOAEL General toxicology # 271 2 1 EC, 2005
Rat COBS CD, male and
female Captan 89 Diet 3 gen (> 100 d) NOAEL Pup body weight < 22.25 2 1 EC, 2005
Rat COBS CD, male and
female Captan tg Diet 102 d NOAEL Pup body weight 12.5 250 2 EC, 2005 1 Values were corrected for the purity of captan.


![Table A2.2. Acute toxicity of captan to marine organisms. Species Species properties A Test type Test compound Purity [%] Test water pH T [°C] Salinity [‰] Exp](https://thumb-eu.123doks.com/thumbv2/5doknet/3061049.8855/25.1263.82.1190.152.367/toxicity-organisms-species-species-properties-compound-purity-salinity.webp)
![Table A2.3. Chronic toxicity of captan to freshwater organisms. Species Species properties A Test type Test compound Purity [%] Test water pH T [°C] Hardness CaCO3 [mg/L] Exp](https://thumb-eu.123doks.com/thumbv2/5doknet/3061049.8855/26.1263.92.1218.149.791/chronic-toxicity-freshwater-organisms-species-species-properties-hardness.webp)
![Table A2.4. Chronic toxicity of captan to marine organisms. Species Species properties A Test type Test compound Purity [%] Test water pH T [°C] Salinity [‰] Exp](https://thumb-eu.123doks.com/thumbv2/5doknet/3061049.8855/28.1263.52.1198.152.318/chronic-toxicity-organisms-species-species-properties-compound-salinity.webp)
