RIVM report 607711007/2012
E.M.J. Verbruggen
National Insitute for Public Health and the Environment
P.O. Box 1 | 3720 BA Bilthoven www.rivm.com
Environmental risk limits for polycyclic
aromatic hydrocarbons (PAHs)
For direct aquatic, benthic, and terrestrial toxicity
Colophon
© RIVM 2012
Parts of this publication may be reproduced, provided acknowledgement is given to the 'National Institute for Public Health and the Environment', along with the title and year of publication.
E.M.J. Verbruggen
Contact:
Eric Verbruggen
Expertise Centre for Substances (SEC)
eric.verbruggen@rivm.nl
This investigation has been performed by order and for the account of Ministry of Infrastructure and Environment (I&M), within the framework of Soil Quality, Prevention and Risk Assessment
Abstract
Environmental risk limits for polycyclic aromatic hydrocarbons (PAHs) For direct aquatic, benthic, and terrestrial toxicity
RIVM derived maximum permissible concentrations (MPCs) and serious risk concentrations (SRC) for ecosystems for the 16 well-known polycyclic aromatic hydrocarbons (PAHs). This is done for all individual PAHs for water, sediment and soil. Data on the toxic effects were collected for each PAH in water, soil and sediment organisms. For this study, the methodology of the framework
‘International and national environmental quality standards for substances in the Netherlands’ (INS) is used. This method is nationally recognized and where possible, based on European directives.
Alternative research method for environmental risk limits PAHs
In this study the environmental risk limits were also derived in an alternative way. For this goal, the knowledge was used from previous research on the environmental risk limits of mineral oil that was suitable for PAHs as well. The environmental risk limits are derived based on the calculated concentration of substances in the organisms after they have taken up the substances from the water (for sediment and soil: water in sediment or soil moisture). This method is based on the assumption that certain effects of all 16 PAHs occur at the same concentrations in organisms that live in water, soil and sediment. Because PAHs cause effects in the same way, the concentrations can be added together. This provides insight into the effect of all PAHs simultaneously, as they occur in the environment (toxic unit aproach).
Difference in internal and external concentrations
The internal effect concentration of PAHs does not differ between organisms in soil, water and sediment. In contrast, large differences between the effect concentrations of the substances outside the organisms were observed. Especially the effect concentrations between soil or sediment on the one hand and water on the other hand were different, and also the effect concentrations of individual PAHs in water. The harmful effects of the substances are thus largely determined by the extent to which a substance is partitioned between water, soil and sediment, and is taken up from water (equilibrium partitioning). As an example, soil binds a substance strongly, so less will end up in soil moisture and eventually in soil organisms. Measurements of concentrations of substances in the environment would thus be better based on concentrations in water. Keywords:
naphthalene, acenaphthene, acenaphthylene, fluorene, phenanthrene, anthracene, pyrene, fluoranthene, chrysene, benz[a]anthracene, benzo[k]fluoranthene, benzo[b]fluoranthene, benzo[a]pyrene, benzo[ghi]perylene, dibenz[a,h]anthracene, indeno[1,2,3-cd]pyrene
Rapport in het kort
Milieurisicogrenzen voor polycyclische aromatische koolwaterstoffen (PAK’s)
Voor directe aquatische, benthische en terrestrische toxiciteit
Het RIVM heeft de maximaal toelaatbare risiconiveaus (MTR) en ernstige risisconiveaus (ER) voor ecosystemen afgeleid voor de 16 bekendste
polycyclische aromatische koolwaterstoffen (PAK’s). Dit is voor alle afzonderlijke PAK’s gedaan voor water, sediment en bodem. Hiervoor zijn gegevens
verzameld over de giftige effecten van elke PAK op water-, bodem- en sedimentorganismen. Voor het onderzoek is de methodologie van het kader ‘(Inter)nationale normen stoffen’ (INS) gebruikt. Deze methode is nationaal erkend en waar mogelijk gebaseerd op Europese richtlijnen.
Alternatieve onderzoekswijze voor milieurisicogrenzen PAK’s
In dit onderzoek zijn de milieurisicogrenzen ook op een alternatieve manier afgeleid. Hiervoor is de kennis gebruikt van eerder uitgevoerd onderzoek naar de milieurisicogrenzen van minerale olie die ook geschikt bleek voor PAK’s. De milieurisicogrenzen zijn afgeleid op basis van de berekende concentratie van stoffen in organismen nadat zij de stoffen via het water hebben opgenomen (voor sediment en bodem: water in sediment of bodemvocht). Deze methode is gebaseerd op de aanname dat bepaalde effecten van alle 16 PAK’s optreden bij dezelfde concentraties in organismen die leven in water, bodem en sediment. Omdat de PAK’s op dezelfde manier effecten veroorzaken, mogen de
concentraties bij elkaar opgeteld worden. Hierdoor wordt inzicht verkregen in het effect van alle PAK’s tegelijkertijd, zoals ze ook in het milieu voorkomen (toxic unit aproach).
Verschil inwendige en externe concentraties
De inwendige effectconcentratie van PAK’s blijkt bij organismen in bodem, water en sediment niet te verschillen. Daarentegen zijn grote verschillen tussen de effectconcentraties van de stoffen aangetroffen als deze buiten de organismen werden waargenomen. Vooral de effectconcentraties tussen bodem of sediment enerzijds en water anderszijds verschilden, evenals de effectconcentraties van de individuele PAK’s in water. De schadelijke effecten van de stoffen worden dus in grote mate bepaald door de mate waarin een stof zich verdeeld tussen water, bodem en sediment en wordt opgenomen vanuit water (evenwichtspartitie). Zo bindt de bodem een stof sterk aan zich waardoor er minder in bodemvocht en uiteindelijk in bodemorganismen terechtkomt. Metingen van concentraties van stoffen in het milieu zouden daardoor beter gebaseerd kunnen worden op concentraties in water.
Trefwoorden:
naftaleen, acenafteen, acenaftyleen, fluoreen, fenantreen, antraceen, pyreen, fluoranteen, chryseen, benz[a]antraceen, benzo[k]fluoranteen,
benzo[b]fluoranteen, benzo[a]pyreen, benzo[ghi]peryleen, dibenzo[a,h]antraceen, indeno[1,2,3-cd]pyreen
Contents
Summary—9
1 Introduction—11
1.1 Project framework—11
1.2 Selection of substances—11
1.3 Reading guide to the report—12
2 Methods—13
2.1 Guidance followed for this project—13
2.2 Trigger values—14
2.3 Data collection and evaluation—16
2.4 Additional methodology and deviations from the guidance—18
3 Derivation of environmental risk limits—21
3.1 Naphthalene—21 3.2 Acenaphthylene—28 3.3 Acenaphthene—30 3.4 Fluorene—34 3.5 Phenanthrene—37 3.6 Anthracene—43 3.7 Pyrene—48 3.8 Fluoranthene—54 3.9 Chrysene—63 3.10 Benz[a]anthracene—65 3.11 Benzo[k]fluoranthene—68 3.12 Benzo[b]fluoranthene—71 3.13 Benzo[a]pyrene—72 3.14 Benzo[ghi]perylene—78 3.15 Dibenz[a,h]anthracene—80 3.16 Indeno[1,2,3-cd]pyrene—82
4 Summary and analysis of data—85
4.1 Overview of derived risk limits—85
4.2 Environmental risk limits on the basis of internal lipid residues—91 References—103
Appendix. Detailed ecotoxicity data—127 Notes—321
Summary
In this report maximum permissible concentrations for ecosystems (MPCseco),
maximum acceptable concentrations for aquatic ecosystems (MACeco,water), and
serious risk concentrations for ecosystems (SRCseco) are derived for polycyclic
aromatic hydrocarbons (PAHs). These environmental risk limits (ERLs) are derived using data on ecotoxicology and environmental chemistry, and represent the potential risk of substances to the ecosystem. They are the scientific basis for environmental quality standards (EQSs) set by the Ministry of Infrastructure and the Environment.
Polycyclic aromatic hydrocarbons are substances that have both natural and anthropogenic origins. They can be formed as a result of combustion, and are constituents of many petroleum products as well. PAHs have different
physicochemical and environmental properties (e.g. log Kow, log Koc, solubility
and BCF). The PAHs that have been considered in this report are the 16 PAHs that were selected by the US Environmental Protection Agency (EPA). These 16 PAHs are also considered in the European Risk Assessment Report (RAR) on coal tar pitch, high temperature (European Commission, 2008). This work forms the basis of the derivation of the environmental risk limits as presented in this report. Additional data that were retrieved after the completion of the RAR, were added to this data set.
For each of the individual PAHs environemental risk limits for direct ecotoxicity were derived for water, soil, and sediment. The methodology used for this derivation was that of the project ‘International and national environmental quality standards for substances in the Netherlands’ (INS). Environmental quality standards should be protective for direct ecotoxicity, secondary poisoning of predators such as birds and mammals, and human toxicology through indirect exposure of humans. However, in this report only the route of direct ecotoxicity is addressed. Thus, the derived risk limits cannot be considered directly as proposals for environmental quality standards.
All cited ecotoxicity studies were collected and carefully evaluated for their usefulness and reliability. Because of the volatility of especially the lower PAHs and the adsorptive behaviour especially for the higher PAHs, only studies in which the exposure concentrations were verified were considered reliable. An overview of the derived risk limits for each individual PAH is given in Table 94. Contrary to earlier reports on derivation of risk limits for PAHs a substantial amount of terrestrial and benthic ecotoxicity data was retrieved. Therefore, the number of risk limits for individual PAHs that is derived by equilibrium
partitioning is substantially lower. Although many more data were retrieved in comparison with earlier risk limit derivations, and consequently lower
assessment factors were applied, the values are in general not higher than, but comparable with the existing risk limits.
Apart from the derivation of risk limits for each PAH individually, an approach is presented in which the risk limits are derived based on internal residues. This method has been developed and applied for the derivation of risk limits for total petroleum hydrocarbons (TPH) before. It is assumed that toxicity of all PAHs is similar and possibly caused by narcosis, for which the total concentration of compounds in the cell membrane is the key parameter. This means that toxicity of different PAHs differs only as a consequence of different accumulation
potential. However, effects are equal on molar basis expressed as residues in the cell membranes. Further, because of similar action, the sum of the internal
concentrations of different compounds gives rise to the same effect as that of a similar concentration of an individual compound, which is referred to as
concentration additivity.
To calculate the total internal residues, pore water concentrations were calculated first for soil and sediment, by considering partitioning between
organic carbon and water. From water concentrations, the internal residues were calculated using a partition coefficient between the membrane and water. From all chronic toxicity data for individual PAHs expressed as internal residues, a set of no observed effect residues (NOERs) for 54 species was obtained, partly geometric means of data for individual PAHs. On basis of these data, a species sensitivity distribution (SSD) was constructed, including aquatic, terrestrial and benthic species. On basis of internal residues there appeared to be no significant differences between the compartments and between the individual PAHs, which confirms the assumption that indeed accumulation from (pore) water is the determining factor for toxicity. This SSD appeared to be very similar to the SSD for TPH, suggesting a similar mode of toxic action.
From the SSD the HC5 and HC50 were derived. These values, based on internal residues, were transferred to the environmental risk limits for water, soil and sediment for each PAH by means of the equilibrium partition coefficients
between membranes and water and between soil or sediment and water. For the MPC values a default assessment factor of 5 has been applied to the HC5, to account for uncertainties in the method and for the potential of certain PAHs to exert a high acute toxicity through phototoxicity, which is not well covered by the chronic data set. The obtained quality standards are generally higher (less conservative) than the quality standard for each PAH individually. An overview of the standards derived by this method is presented in Table 99.
If monitoring data are compared with the environmental risk limits it must be kept in mind that the toxic unit approach should be applied, because of the assumed concentration additivity for PAHs. Because toxicity can be explained by equilibrium partitioning, it could be considered to use techniques that are capable to measure freely dissolved concentrations in field samples (such as SPME). This would take account of the possibly strongly reduced bioavailability of PAHs in the field.
1
Introduction
1.1 Project framework
In this report, environmental risk limits (ERLs) for surface water (freshwater and marine), sediment, and soil are derived for 16 polycyclic aromatic hydrocarbons (PAHs). The following ERLs are considered:
- Negligible concentration (NC) – concentration at which effects to ecosystems are expected to be negligible and functional properties of ecosystems must be safeguarded fully. It defines a safety margin which should exclude combination toxicity. The NC is derived by dividing the MPC (see next bullet) by a factor of 100.
- Maximum permissible concentration (MPC) – concentration in an environmental compartment at which:
1. no effect to be rated as negative is to be expected for ecosystems; 2a no effect to be rated as negative is to be expected for humans (for
non-carcinogenic substances);
2b for humans no more than a probability of 10-6 per year of death can
be calculated (for carcinogenic substances).
The MPCs for water and soil should not result in risks due to secondary poisoning (considered as part of the ecosystem in the definition above) and/or risks for human health aspects. These aspects are therefore also addressed in the MPC derivation. Within the context of the Water Framework Directive a risk of 10-6 on a life-time basis is used.
Therefore, this value has been adapted within the framework of the project ‘International and national environmental quality standards for substances in the Netherlands’ (INS) (Van Vlaardingen and
Verbruggen, 2007). However, in this report only the direct ecotoxic effects are considered.
- Maximum acceptable concentration (MACeco) – concentration protecting
aquatic ecosystems for effects due to short-term exposure or concentration peaks.
- Serious risk concentration (SRCeco) – concentration at which possibly
serious ecotoxicological effects are to be expected. The derivation of SRC values based on human-toxicological endpoints (SRChuman) is not
part of this report.
These ERLs serve as advisory values that are used by the Steering Committee for Substances to set environmental quality standards (EQS) for various policy purposes. EQSs are all legally and non legally binding standards used in Dutch environmental policy.
The NC can be used to set the target value (TV). The MPC and the MACeco can be
used as generic environmental quality standards. The SRCeco can be used to
derive intervention values (IV), after comparison with the human toxicological SRC value, and for groundwater also with the maximum concentration in drinking water. Above IV soil and groundwater is considered to be seriously contaminated.
1.2 Selection of substances
ERLs are derived for naphthalene, acenaphthylene, acenaphthene, fluorene, phenanthrene, anthracene, pyrene, fluoranthene, chrysene,
benzo[a]anthracene, benzo[k]fluoranthene, benzo[b]fluoranthene,
indeno[1,2,3-cd]pyrene (Table 1), which are selected because of their importance for soil, sediment, and groundwater in the scope of the project 'Risk Assessment of contaminated Soil and Ground Water'.
Table 1: Selected compounds
Compound CAS number
Naphthalene 91-20-3 Acenaphthylene 208-96-8 Acenaphthene 83-32-9 Fluorene 86-73-7 Phenanthrene 85-01-8 Anthracene 120-12-7 Pyrene 129-00-0 Fluoranthene 206-44-0 Chrysene 218-01-9 Benz[a]anthracene 56-55-3 Benzo[k]fluoranthene 207-08-9 Benzo[b]fluoranthene 205-99-2 Benzo[a]pyrene 50-32-8 Benzo[ghi]perylene 191-24-2 Dibenz[a,h]anthracene 53-70-3 Indeno[1,2,3-cd]pyrene 193-39-5 These substances have been chosen, because they represent the 16 PAHs
selected by the US Environmental Protection Agency (US EPA). These 16 PAHs were considered in the EU RAR on coal tar pitch high-temperature (European Commission, 2008). The same 16 PAHs were considered for the human toxicological part of the serious risk concentration (SRChuman), with one
additional compound, which was benzo[j]fluoranthene (Lijzen et al., 2001; Baars et al., 2001). This was done for the revision of the first tranche of intervention values in 2001. At that time the ecotoxicological data underlying risk limits for PAHs were not updated and the SRCeco values were derived based on the old
data for 10 PAHs (Verbruggen et al., 2001). These PAHs were selected by the Dutch Ministry for Housing, Spatial Planning and the Environment (VROM) and contained the above mentioned PAHs, except acenaphthylene, acenaphthene, fluorene, pyrene, benzo[b]fluoranthene, and dibenz[a,h]anthracene. The data for these 10 PAHs were collected prior to 1995, when the MPCs and NCs for these substances were derived (Kalf et al., 1995).
1.3 Reading guide to the report
In chapter 2, the methodology followed in the derivation of the environmental risk limits will be shortly derived. In chapter 3, the derivation of the ERLs in water (freshwater and marine water), sediment, and soil will be presented for each of the PAHs individually. In chapter 4, a summary of the derived ERLs will be given and a comparison is presented with existing risk limits and quality standards, including the human toxicological part of the SRCs. Further, an alternative method to the ERLs derived in chapter 3 is proposed. With this approach, ERLs are derived as one value for all PAHs, based on internal concentrations in the lipids (membranes) of organisms.
2
Methods
2.1 Guidance followed for this project
In this report ERLs are derived following the methodology of the project
‘International and national environmental quality standards for substances in the Netherlands’ (INS) (Van Vlaardingen and Verbruggen, 2007). The updated INS guidance is in accordance with the guidance by Lepper (2005) which forms part of the Priority Substances Daughter Directive (2006/0129 (COD)) amending the Water Framework Directive (2000/60/EC) (WFD guidance) and the Technical Guidance Document (TGD) for the risk assessment of new and existing substances and biocides (European Commission, 2003). The WFD guidance, which is based on the Technical Guidance Document, only applies to the derivation of MPC and MACeco for water and the MPC for sediment. ERL
derivations for water and sediment are performed for both the freshwater and marine compartment. For the MPC for soil, the updated INS guidance follows the Technical Guidance Document.
Because of the extent of this work, this report takes only direct aquatic, benthic and terrestrial ecotoxicological effects of PAHs into account. The risk limits derived are the serious risk concentration for ecosystems (SRCeco), which serves
as basis for the intervention value, the maximum permissible concentration for ecosystems (MPCeco) and the maximum acceptable concentration for ecosystems
(MACeco, water), a concentration that protects aquatic ecosystems from adverse
effects caused by short-term exposure or concentration peaks. The
compartments considered in the derivation of the SRCeco and MPCeco are fresh
and marine water, fresh and marine sediment, and soil. The MACeco, water is only
derived for the water compartment, because this is the most dynamic
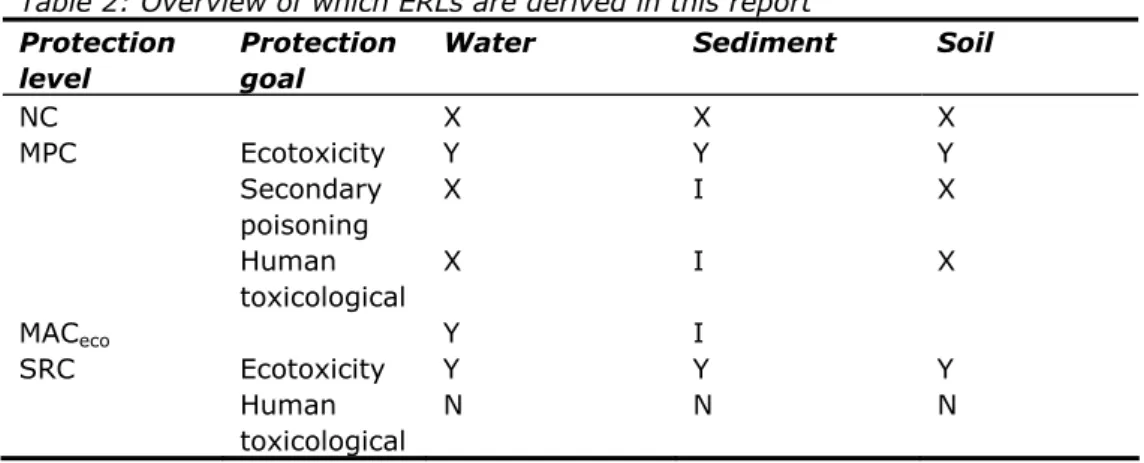
compartment and quickly fluctuating concentrations are not deemed relevant for soil and sediment. An overview of which ERLs are derived in this report is given in Table 2.
It is important to note that a complete SRC, MPC and NC derivation integrates both ecotoxicological data, consisting of both direct toxicity as well as secondary poisoning of predators, and a human toxicological threshold value. The height of the final environmental risk limit can be determined by either one of these protection objectives. Because the indirect routes were not taken into account, no further evaluation of bioconcentration and biomagnification data is made in this report. However, it can be stated that BCF values for these substances are generally higher than 100 (see section 2.2.2). On basis of these BCF values, PAHs trigger the route for the derivation of secondary poisoning and human toxicological based MPC values (see section 2.2.2). The human toxicological values for the SRC for soil and groundwater are derived by the exposure model CSOIL and for the SRC for aquatic sediment by the model SEDISOIL (Lijzen et al., 2001). In section 4.1, these values are compared with the ecotoxicological values derived in this report.
Table 2: Overview of which ERLs are derived in this report
Protection level
Protection goal
Water Sediment Soil
NC X X X MPC Ecotoxicity Y Y Y Secondary poisoning X I X Human toxicological X I X MACeco Y I SRC Ecotoxicity Y Y Y Human toxicological N N N X: Not derived in this report.
Y: Derived in this report.
N: Not relevant for the specific compartment.
2.2 Trigger values
2.2.1 Sediment and suspended matter
This section reports on the trigger values for ERL water derivation (as demanded in the context of the WFD). In line with the upcoming new technical guidance document for deriving environmental quality standards, a sediment quality standard should be derived if the organic carbon-water partition coefficient (Koc)
is larger than 1000. With the equation as given by Karickhoff et al. (1979) for log Koc this is true for all 16 PAHs (see section 2.3.2).
2.2.2 Secondary poisoning
Under the Water Framework Directive (WFD) the route of secondary poisoning is triggered if the bioconcentration factor (BCF) is larger than 100 (Lepper, 2005; Van Vlaardingen and Verbruggen, 2007). Recently, an overview of the
bioaccumulation of PAHs was made (Bleeker and Verbruggen, 2009). Apparently for the PAHs high BCF values are observed in fish (Table 3).
Table 3: Overview of BCF values for fish. If possible, data were normalized to 5% lipid content Compound BCF fish Naphthalene 462, 515, 66, 76, 310, 320 Acenaphthylene 510, 507, 678, 698 Acenaphthene 973, 988 Fluorene 1158, 1658, 818, 755 Phenanthrene 1805, 4751, 2544, 2423, 2546, 1149 Anthracene 2545, 1960, 1126, 3581, 2476, 4973 Pyrene 1474, 75, 50 Fluoranthene 2771 Chrysene Benz[a]anthracene 260 Benzo[k]fluoranthene Benzo[b]fluoranthene Benzo[a]pyrene ~30 Benzo[ghi]perylene Dibenz[a,h]anthracene Indeno[1,2,3-cd]pyrene
For invertebrates, higher and even more variable BCF values were observed, mainly due to the absence of metabolism in these species. For all PAHs for which reliable BCF data (all except benzo[b]fluoranthene and indeno[1,2,3-cd]pyrene) are available, BCF values tend to be much higher than 100 (Bleeker and
Verbruggen, 2009). Therefore, the route of secondary poisoning is triggered for PAHs. This report focuses on direct ecotoxicity only and therefore, this route is not further considered here.
2.2.3 Human toxicological threshold limits and carcinogenicity
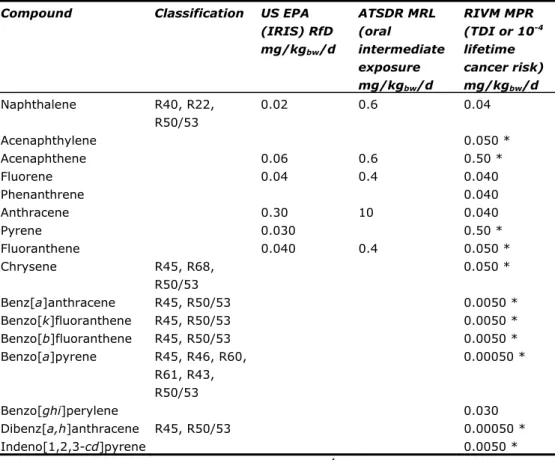
The classification in EU framework is shown in Table 4. Those substances, for which no Risk Phrases (R-phrases) are listed, have not been classified in EU framework (EC Regulation No. 1272/2008). In this table, the values presented by the US Environmental Protection Agency, the Integrated Risk Information System (US EPA IRIS) (http://www.epa.gov/ncea/iris/index.html) and the Agency for Toxic Substances and Disease Registry (ATSDR)
(http://www.atsdr.cdc.gov/mrls/index.asp) are included as well. Further, the human toxicological MPR values that were derived in the framework of
intervention values and served as basis for the SRChuman are presented in Table
4 (Baars et al., 2001). It should be noted that the values for carcinogenicity are based on a cancer risk of 10-4 per lifetime. The limit value for generic quality
standards under the WFD an within the framework of INS is a probability of 10-6
per lifetime (Lepper, 2005). Therefore, these MPR values (Van Vlaardingen and Verbruggen, 2007) should be divided by a factor of 100 for the derivation of the human toxicological MPC values within the context of the WFD and INS.
RIVM (Baars et al., 2001) concluded that naphthalene, fluorene, anthracene, and benzo[ghi]perylene are not carcinogenic. It was concluded that
acenapthene, acenapthylene, phenanthrene and pyrene should be considered as suspected carcinogens. However, for phenanthrene an MPR value was derived based on a threshold approach (TDI), because the relative carcinogenic potential is extremely low. For the other substances (fluoranthene, chrysene,
benz[a]anthracene, benzo[k]fluoranthene, benzo[b]fluoranthene,
benzo[a]pyrene, dibenz[a,h]anthracene, and indeno[1,2,3-cd]pyrene), it was concluded that these substances were probably carcinogenic.
US EPA (IRIS) concluded that acenaphthylene, phenanthrene, anthracene, pyrene, fluoranthene, and benzo[ghi]perylene are not classifiable for human carcinogenicity. For fluoranthene and pyrene this is in contrast with the conclusion by RIVM that pyrene was possibly and fluoranthene probably carcinogenic to humans. US EPA (IRIS) concluded that chrysene, benz[a]anthracene, benzo[k]fluoranthene, benzo[b]fluoranthene,
benzo[a]pyrene, dibenz[a,h]anthracene, and indeno[1,2,3-cd]pyrene are probably human carcinogens.
For all substances with a classification R40 (limited evidence of a carcinogenic effect), R45 (may cause cancer), R46 (may cause heritable genetic damage), R60 (may impair fertility), R61 (may cause harm to the unborn child), or R68 (possible risk of irreversible effects) the derivation of a human toxicological quality standard under the Water Framework Directive is triggered (Lepper, 2005). For the other substances that were not classified in EU framework, but are suspected or probable carcinogens, this holds true as well. Still for the other substances fluorene, phenanthrene and anthracene the TDI values are low, while the BCF values are rather high, which makes them eligible for the derivation of a human toxicological MPC (e.g. one of the R-phrases R22, R25,
R28 (harmful, toxic, or very toxic if swallowed), or R48 (danger of serious damage to health by prolonged exposure) in combination with a BCF > 100 would trigger the human route as well).
However, this report is restricted to the derivation of the environmental risk limits for direct ecotoxicity. As such, the derivation of human toxicological maximum permissible concentration or serious risk concentrations is outside the scope of this report. The derivation of SRChuman for the 16 PAHs can be found in
another report (Lijzen et al., 2001). In section 4.1, they are compared to the SRCeco values derived in this report.
Table 4: Overview of human toxicological data: Classification in EU framework, Reference dose (RfD) from US EPA (IRIS), minimal risk level (MRL) from ATSDR, and maximum permissible risk (MPR) from RIVM
Compound Classification US EPA (IRIS) RfD mg/kgbw/d ATSDR MRL (oral intermediate exposure mg/kgbw/d RIVM MPR (TDI or 10-4 lifetime cancer risk) mg/kgbw/d Naphthalene R40, R22, R50/53 0.02 0.6 0.04 Acenaphthylene 0.050 * Acenaphthene 0.06 0.6 0.50 * Fluorene 0.04 0.4 0.040 Phenanthrene 0.040 Anthracene 0.30 10 0.040 Pyrene 0.030 0.50 * Fluoranthene 0.040 0.4 0.050 * Chrysene R45, R68, R50/53 0.050 * Benz[a]anthracene R45, R50/53 0.0050 * Benzo[k]fluoranthene R45, R50/53 0.0050 * Benzo[b]fluoranthene R45, R50/53 0.0050 * Benzo[a]pyrene R45, R46, R60, R61, R43, R50/53 0.00050 * Benzo[ghi]perylene 0.030 Dibenz[a,h]anthracene R45, R50/53 0.00050 * Indeno[1,2,3-cd]pyrene 0.0050 *
* These values are based on a cancer risk of 10-4 per lifetime (Baars et al.,
2001).
2.3 Data collection and evaluation
2.3.1 Ecotoxicity data
Initially, data were collected for the European Risk Assessment Report on coal tar pitch, high-temperature. An on-line literature search was performed on TOXLINE (literature from 1985 to 2001) and Current Contents (literature from 1997 to 2002) and was updated at regular time intervals up to 2008 by Current Contents or Scopus. In addition to this, all references in the RIVM e-tox base and EPA’s ECOTOX database were evaluated, if available. Next to that, many references were retrieved by retrospective searching of cited references. Evaluated toxicity data are reported in a separate appendix to this report. Ecotoxicity studies were screened for relevant endpoints (i.e. those endpoints that have consequences at the population level of the test species). All
ecotoxicity tests were then thoroughly evaluated with respect to the validity (scientific reliability) of the study. A detailed description of the evaluation procedure is given in the INS-Guidance (Van Vlaardingen and Verbruggen, 2007), sections 2.2.2 and 2.3.2. In short, the following reliability indices were assigned:
Ri 1: Reliable without restriction
’Studies or data … generated according to generally valid and/or
internationally accepted testing guidelines (preferably performed according to GLP) or in which the test parameters documented are based on a specific (national) testing guideline … or in which all parameters described are closely related/comparable to a guideline method.’
Ri 2: Reliable with restrictions
’Studies or data … (mostly not performed according to GLP), in which the test parameters documented do not totally comply with the specific testing guideline, but are sufficient to accept the data or in which investigations are described which cannot be subsumed under a testing guideline, but which are nevertheless well documented and scientifically acceptable.’
Ri 3: Not reliable
’Studies or data … in which there are interferences between the measuring system and the test substance or in which organisms/test systems were used which are not relevant in relation to the exposure (e.g., unphysiologic pathways of application) or which were carried out or generated according to a method which is not acceptable, the documentation of which is not
sufficient for an assessment and which is not convincing for an expert judgment.’ Since most PAHs, especially the lower ones, are volatile
substances, studies using an open system in which actual concentrations are not monitored are rewarded Ri 3.
Ri 4: Not assignable
’Studies or data … which do not give sufficient experimental details and which are only listed in short abstracts or secondary literature (books, reviews, etc.).’
Ri 4*: Data from other sources
’Studies or data … which are most likely copied from other sources’ All available studies were summarized in data tables, which are included as a database to this report. These tables contain information on species
characteristics, test conditions and endpoints. Explanatory notes are included with respect to the assignment of the reliability indices.
Endpoints with Ri 1 or 2 are accepted as valid, but this does not automatically mean that the endpoint is selected for the derivation of ERLs. The validity scores are assigned on the basis of scientific reliability, but valid endpoints may not be relevant for the purpose of ERL-derivation (e.g. due to inappropriate exposure times).
After data collection and validation, toxicity data were combined into an aggregated data table with one effect value per species according to
section 2.2.6 of the INS-Guidance. When for a species several effect data were available, the geometric mean of multiple values for the same endpoint was calculated where possible. Subsequently, when several endpoints were available for one species, the lowest of these endpoints (per species) is reported in the aggregated data table.
2.3.2 Physicochemical data
The collected physicochemical properties were collected for the European Risk Assessment Report on coal tar pitch, high-temperature as well. Most data were retrieved from the Handbook of physical-chemical properties and environmental fate for organic chemicals (Mackay et al., 2006) and the references cited
therein. The selection criteria were based on the INS-Guidance (Van Vlaardingen and Verbruggen, 2007) and preference was given to slow-stirring and generator-column methods for both solubility and the n-octanol-water partition coefficient (Kow), and the gas saturation and effusion methods for the vapour pressure, and
wetted-wall, gas-stripping, or headspace methods for Henry’s law constant. The organic carbon-water partition coefficient (Koc) was calculated from log Kow by
means of the QSAR equation from Karickhoff et al. (1979). This equation proved to be most suitable for describing sorption of PAHs to organic carbon
(Verbruggen et al., 2008): 21 . 0 log logKoc Kow
2.4 Additional methodology and deviations from the guidance
2.4.1 MACeco, marine
The assessment factor for the MACeco, marine value is based on:
- the assessment factor for the MACeco, water value when acute toxicity data for
at least two specific marine taxa are available, or
- the assessment factor for the MACeco, water value with an additional
assessment factor of 5 when acute toxicity data for only one specific marine taxon are available (analogous to the derivation of the MPC according to Van Vlaardingen and Verbruggen, (2007)), or
- the assessment factor for the MACeco, water value with an additional
assessment factor of 10 when no acute toxicity data are available for specific marine taxa.
If freshwater and marine data sets are not combined, the MACeco, marine is derived
on the marine toxicity data using the same additional assessment factors as mentioned above. It has to be noted that this procedure is currently not agreed upon. Therefore, the MACeco, marine value needs to be re-evaluated once an
agreed procedure is available.
2.4.2 Equilibrium partitioning for soil and sediment
Equilibrium partitioning (EqP) can be used to derive ERLs for soil and sediment from ERLs for water. If equilibrium partitioning is applied, an additional factor of 10 should be used for the derivation of the MPC of substances with a log Kow
higher than 5 (Van Vlaardingen and Verbruggen, 2007). This factor was introduced to take account of the possible role of food ingestion, both in
sediment and soil. However, the increase in total uptake due to food ingestion in earthworms was non-exisiting for 1,2,3,4-tetrachlorobenzene, and
pentachlorobenzene and only a factor 2 to 3 for hexachlorobenzene (Belfroid et al., 1994). This set of three compounds is actually too small to base a conclusion upon and in general, it has been shown that this additional uptake is actually very limited (Jager, 1998). Based on experimental data, this was confirmed for the PAHs in this report. Applying an additional factor of 10 would be an
overestimation of the environmental risk limits, while without this factor environmental risk limits derived by equilibrium partitioning and from direct terrestrial and benthic toxicity data are in good accordance with each other.
Therefore, the additional factor of 10 for equilibrium partitioning is not applied in this report.
3
Derivation of environmental risk limits
3.1 Naphthalene
3.1.1 Substance identification and physicochemical properties 3.1.1.1 Identity
Figure 1: Structural formula of naphthalene. Table 5: Identification of naphthalene
Parameter Value
Common/trivial/other name Naphthalene, naphthene
Chemical name Naphthalene
CAS number 91-20-3
EC number 202-049-5
SMILES code c12ccccc1cccc2
3.1.1.2 Physicochemical properties
Table 6: Physicochemical properties of naphthalene
Parameter Unit Value Remark
Molecular weight [g/mol] 128.2
Water solubility [µg/L] 31900 Geometric mean of 7 values by
generator-column method
log KOW [-] 3.34 Average of 1 value by generator-column and
1 by slow-stirring method
log KOC [-] 3.13 QSAR
Vapour pressure [Pa] 10.8 Geometric mean of 8 values by gas
saturation method
Melting point [°C] 81
Boiling point [°C] 217.9
Henry’s law constant [Pa.m3/mol] 50.4 Geometric mean of 7 values by gas stripping
method, 1 value by wetted-wall method and 1 value by headspace method
3.1.2 Water
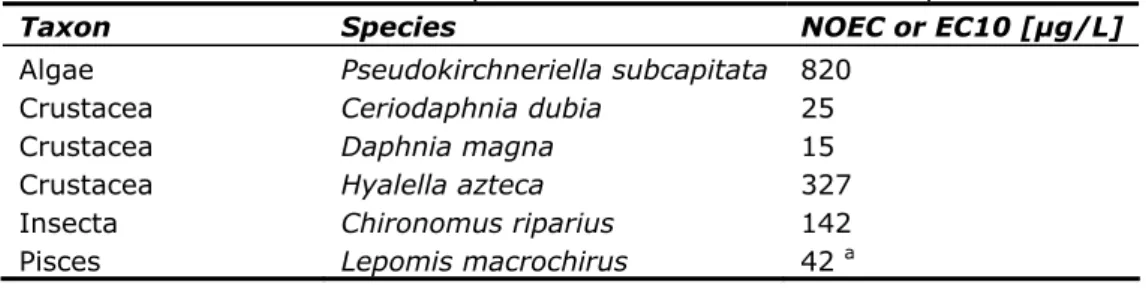
Naphthalene is highly volatile. Many toxicity studies for naphthalene were rejected due to high uncertainty in exposure concentrations, either because analysis showed that the concentrations in static systems dropped very quick or because exposure concentrations were not analytically verified. Still, many valid toxicity data are available for naphthalene. The selected acute toxicity data for freshwater species include algae, an amphibian, crustaceans, a cyanophyte, insects, a mollusk and fish (Table 7). The selected acute toxicity data for marine species include seaweed, an annelid, a bacterium, crustaceans, mollusks and fish (Table 8). No higher plant was selected but a study with duckweed showed that naphthalene only causes about 10% effect up to the solubility of
32,000 µg/L (Ren et al., 1994). It can thus be concluded that duckweed is not a very sensitive species for naphthalene.
Table 7: Selected acute toxicity data of naphthalene to freshwater species
Taxon Species LC50 or EC50 [µg/L]
Algae Nitzschia palea 2820
Algae Pseudokirchneriella subcapitata 2960
Algae Scenedesmus vacuolatus 3800
Amphibia Xenopus laevis 2100
Crustacea Daphnia magna 1896 a
Crustacea Diporeia spp. 1587
Crustacea Gammarus minus 3930
Cyanophyta Anabaena flos-aqua 24,000
Insecta Chironomus riparius 600 b
Mollusca Physa gyrina 5020
Pisces Oncorhynchus mykiss 2212 c
Pisces Pimephales promelas 4572 d
Notes to Table 7
a Geometric mean of 2160 and 1664 µg/L for the most sensitive parameter
(immobility) at a standard exposure time of 48 hours.
b Most sensitive lifestage exposed under light conditions including some UV-A. c Geometric mean of 2100, 3220, and 1600 µg/L.
d Geometric mean of 1680, 1990, and 7900 µg/L.
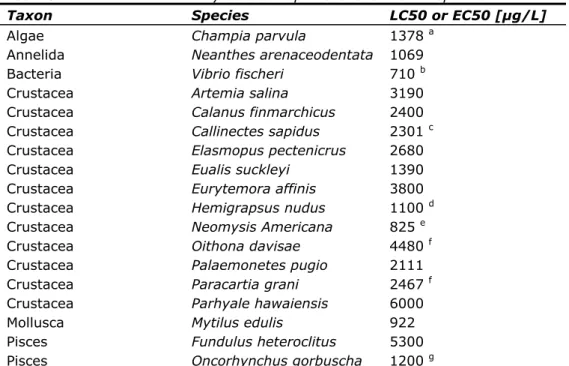
Table 8: Selected acute toxicity data of naphthalene to marine species
Taxon Species LC50 or EC50 [µg/L]
Algae Champia parvula 1378 a
Annelida Neanthes arenaceodentata 1069
Bacteria Vibrio fischeri 710 b
Crustacea Artemia salina 3190
Crustacea Calanus finmarchicus 2400
Crustacea Callinectes sapidus 2301 c
Crustacea Elasmopus pectenicrus 2680
Crustacea Eualis suckleyi 1390
Crustacea Eurytemora affinis 3800
Crustacea Hemigrapsus nudus 1100 d
Crustacea Neomysis Americana 825 e
Crustacea Oithona davisae 4480 f
Crustacea Palaemonetes pugio 2111
Crustacea Paracartia grani 2467 f
Crustacea Parhyale hawaiensis 6000
Mollusca Mytilus edulis 922
Pisces Fundulus heteroclitus 5300
Pisces Oncorhynchus gorbuscha 1200 g
Notes to Table 8
a Geometric mean of 1000 and 1900 µg/L for the most sensitive lifestage
(tetrasporophyte).
b Geometric mean of 700 and 720 µg/L at standard exposure time (15 min). c Lowest value at highest salinity of 30‰.
d Lowest value obtained with continuous exposure instead of intermittent
exposure.
e Geometric mean of 800 and 850 µg/L at highest test temperature of 25 ºC. f Most sensitive parameter (immobility).
g Most relevant exposure time (96 h) and probably also most relevant life-stage
To test for differences in sensitivity between freshwater and marine species, data were log-transformed first. Thereafter, a t-test with two-tailed distribution and equal variance was performed after running an F-test to test for equal variances. No significant differences were observed in the sensitivity of
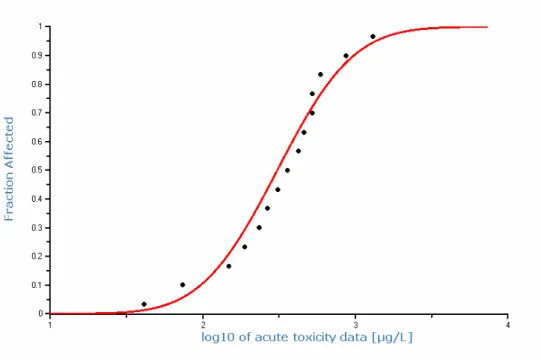
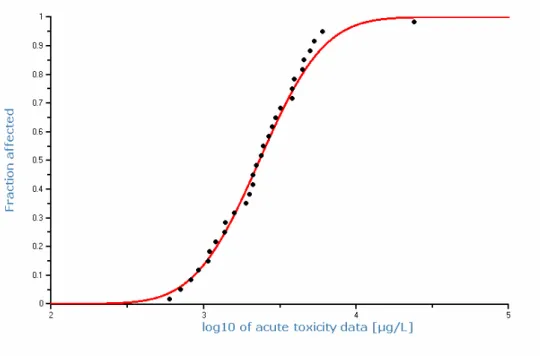
freshwater and marine species in acute toxicity tests (F-test 0.29; t-test 0.13). It is therefore considered justified to calculate a species sensitivity distribution with the acute toxicity data on basis of the combined dataset for 30 species. This SSD is shown in Figure 2. The HC5 of this SSD is 650 µg/L, the HC50 is
2324 µg/L. The MACeco, water is derived from the HC5(acute), default by applying
an assessment factor of 10. However, the number of toxicity data and the taxonomic diversity is high and the differences in species sensitivity are low, which is characteristic of narcotic effects. The MACeco, water should be protective
of any acute toxicity effects. However, the values used in the SSD are 50% effective concentration. Therefore, an assessment is made between the 50% and 10% effective concentrations (EC50 and EC10). A direct comparison can be made for 9 species from 5 taxonomic groups (Table 9). The no-effect level is at most a factor of 5 lower than the 50% effect level. Therefore, an assessment factor of 5 is applied to the HC(acute) to derive the MACeco, water. The MACeco, water
is thus 130 µg/L. Because of the large number of marine data, including non standard species such as seaweed, annelids, or molluscs, an extra assessment factor for the MACeco, marine is not necessary. The MACeco, marine is 130 µg/L too.
Figure 2: Species sensitivity distribution for the acute toxicity of naphthalene to freshwater and marine species
Chronic toxicity studies for naphthalene have often been performed in flow-through systems, with regular renewal of the aqueous phase or with tightly closed vials. This renders a relatively high number of valid toxicity data. The selected chronic data for naphthalene to freshwater species include algae, crustaceans, a higher plant and fish (Table 10). For marine species data are available for seaweed, a sea squirt species, crustaceans, including a crab species, echinoderms, a mollusc and fish (Table 11).
Table 9: Acute no effect levels (10% cut-off by means of EC10) versus 50% effect levels (EC50) for naphthalene
Taxon Species EC50/EC10 or
LC50/LC10
Amphibia Xenopus laevis 1.6
Algae Scenedesmus vacuolatus 2.2
Algae Champia parvula 1.4 – 2.1
Bacteria Vibrio fischeri 4.8
Crustacea Calanus finmarchicus 1.1
Crustacea Oithona davisae 1.8
Crustacea Paracartia grani 1.6
Crustacea Parhyale hawaiensis 1.6
Cyanophyta Anabaena flos-aqua 2.5
Table 10: Selected chronic toxicity data of naphthalene to freshwater species
Taxon Species NOEC or EC10 [µg/L]
Algae Scenedesmus vacuolatus 1700
Crustacea Ceriodaphnia dubia 514
Crustacea Hyalella azteca 1161
Macrophyta Lemna gibba 32,000
Pisces Micropterus salmoides 37
Pisces Oncorhynchus kisutch 460 a
Pisces Oncorhynchus mykiss 20
Pisces Pimephales promelas 450 b
Notes to Table 10
a Most sensitive parameter (length).
b Most sensitive parameter (length and weight).
Table 11: Selected chronic toxicity data of naphthalene to marine species
Taxon Species NOEC or EC10 [µg/L]
Algae Champia parvula 811 a
Crustacea Cancer magister 21 b
Crustacea Paracartia grani 530 c
Echinodermata Paracentrotus lividus 649 d
Echinodermata Strongylocentrotus droebachiensis 738 e
Mollusca Mytilus galloprovincialis 4037 d
Pisces Gadus morhua 1000
Pisces Oncorhynchus gorbuscha 260 f
Tunicata Ciona intestinalis 610 d
Notes to Table 11
a Geometric mean of 1400 and 470 µg/L for the most sensitive lifestage
(tetrasporophyte).
b Most sensitive strain (from Alaska).
c Most sensitive parameter (egg production). d Lowest value with tests performed in the dark. e Geometric mean of 940 and 580 µg/L.
f Most sensitive parameter (weight).
An LC50 of 110 (Black et al., 1983) or 120 µg/L (Milleman et al., 1984) is reported for an early life stage study (ELS) with rainbow trout exposed from 20 minutes after fertilization of the eggs until 4 days after hatching of the fry (after 23 d, total exposure 27 d). The presented data (Black et al., 1983) show a
clear dose-response relationship. The LC50 value of 117 μg/L derived from a dose-response relationship with a log-logistic equation (r2=0.96) is similar to the
values mentioned above. The EC10 for survival after 4 days post-hatching is 20 µg/L. Clearly, this is the lowest usable effect concentration for naphthalene in freshwater species. In the RAR of naphthalene the study of Black et al. (1983), was disregarded because the method could not be repeated with toluene and it generally gives much lower results than standard studies. After reconsideration, it was concluded in the RAR of coal tar pitch that the value could be used. There are some differences between the studies with toluene and naphthalene. First, for toluene the difference with the other toxicity data is several orders of magnitude, while for naphthalene, there are several studies which show the onset of chronic effects or effects on sensitive life stages around the value of 20 μg/L. For the most sensitive strain of Dungeness crabs a NOEC of 21 µg/L was found in a 40-d study (Caldwell et al., 1977). In this study only two exposure concentrations are used. Although well-performed, the statistical power of this test is limited. For the marine herbivorous copepod Eurytemora affinis 1 concentration of 14 µg/L tested in a 15-d study resulted in significant effects (Ott et al., 1978). However, a 10-d study with the same species resulted in no significant effects up to 50 µg/L (Berdugo et al., 1977).
Second, the EC10 for toluene is also an order of magnitude lower than that for naphthalene, while naphthalene is a compound with a log Kow that is 0.6 unit
higher than that of toluene. For this reason, the EC10 for naphthalene would be expected to be lower than the EC10 for toluene, which is apparently not the case.
Further, both EC10s do not originate from the same publication, or at least toluene has been omitted from the publication. If a read-across is performed with the data for phenanthrene instead of toluene with data from the same study (Black et al., 1983), the data are very well in line with another study with the same species and with data for other species tested with phenanthrene. Therefore, the EC10 is considered to be useful in this case.
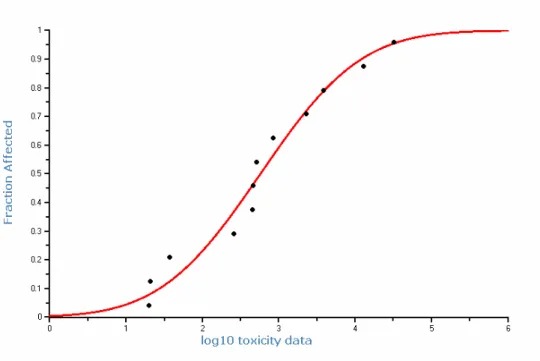
Chronic NOEC or EC10 values are very similar for freshwater and marine species and no significant differences are observed (F-test 0.19; t-test 0.99). Both datasets can therefore be combined. Valid chronic toxicity data are available for 17 species originating from 7 taxonomic groups. No selected value for an insect is available. However, in a full life-cycle study with the midge Tanytarsus dissimilis, it was concluded that concentrations below 500 µg/L resulted in minimal effects (Darville and Wilhm, 1984). However, details on the dose-response relationship for this species are missing. With this value missing, a species sensitivity distribution can in principle not be applied. For comparative purposes the figure is shown below (Figure 3). The HC5 is 25 µg/L and the HC50 is 520 µg/L. The data do not fit well to a log-normal distribution. Next to that, effects for 1 species are observed in 1 study and not in the other or differences exist even between different strains for the same species and there are some effects observed even below the lowest EC10. The wide range of NOEC or EC10 values for different species, also raise some question whether there are more specific modes of toxic action involved besides the baseline toxicity caused by narcosis. Part of the differences might also be explained from the difficulties in maintaining constant exposure concentration in toxicity experiments.
Because the uncertainties, the MPCeco, water is derived by applying an assessment
factor of 10 to the lowest EC10, instead of using the outcome of the species sensitivity distribution. In the EU-RAR no chronic toxicity data for algae were available. Hence, an assessment factor of 50 was applied. Useful data for algae are now available (e.g.Walter et al., 2002). Therefore, the use of an assessment factor of 10 instead of 50 seems to be justified, certainly because of the
freshwater species is the EC10 from the ELS study with Oncorhynchus mykiss of 20 µg/L. The MPCeco, water is thus 2.0 µg/L. This value is almost identical to the
PNEC value derived in the EU-RAR for naphthalene. However, an assessment factor of 10 has been used here instead of 50.
With 6 taxonomic groups for marine species, an assessment factor of 10 can be applied to the lowest NOEC as well. The MPCeco, marine is thus equal to the
MPCeco, water of 2.0 µg/L. The SRCeco is both for freshwater and marine water
equal to the HC50 of 520 µg/L.
Figure 3: Species sensitivity distribution for the chronic toxicity of naphthalene to freshwater and marine species
3.1.3 Sediment
All available effect concentrations for benthic organisms relate to 50% effect. The EC50 for reburial of Rhepoxynius abronius after 10 days of exposure (Boese et al., 1998) is 1700 mg/kgdw, recalculated to Dutch standard sediment with an
organic carbon matter of 10%. Irradiation of the crustaceans with UV light had no effect on this parameter. It should be noted that although this value is an EC50, the exposure time (10-d) as well as the endpoint (reburial) are rather chronic than acute. Nevertheless, the difference with the LC50 is negligible. Table 12: Selected acute toxicity data of naphthalene to benthic species
Taxon Species LC50/EC50 [mg/kgstandard sediment]
Crustacea Rhepoxynius abronius 1712
With an assessment factor of 1000, an MPCeco, sediment of 1.7 mg/kgdw, standard sed
would be derived. Because the MPC is based on 1 acute effect concentration, this MPC has to be compared with one derived by equilibrium partitioning, which is 0.16 mg/kgdw. This value of 0.16 mg/kgdw is therefore the final MPCeco, sediment.
Because the MPCeco, marine is equal to the MPCeco, water the MPCeco, marine sediment is
The SRCeco, sediment is derived by comparing the direct acute EC50 divided by a
factor of 10 with the value derived by equilibrium partitioning. The value derived by equilibrium partitioning is the lowest. This value of 42 mg/kgdw, standard sed is
the SRCeco, sediment.
3.1.4 Soil
Concentrations of naphthalene in soil rapidly diminish. The concentrations at the end of a 28-d experiment with the pot worm Enchytraeus crypticus and the springtail Folsomia candida were only 1 to 10% of the actual initial
concentrations (Bleeker et al., 2003; Droge et al., 2006). In a similar test with the springtail Folsomia fimetaria the concentrations at the end of the 21-d experiment were 4 to 10% of the actual initial concentrations (Sverdrup et al., 2001). In a test on microbial processes (Kirchmann et al., 1991) the
concentrations dropped to 9 and 2% of the actual initial concentration after 5 and 10 days in the highest concentration (21 mg/kgdw) and to 13 and 8% in the
lowest concentration (0.1 mg/kgdw).
Time-weighted average concentrations for these studies were estimated to be 24% over 28 days (Bleeker et al., 2003; Droge et al., 2006), 33% over 21 days (Sverdrup et al., 2001), and 34-38% over 7 days (Kirchmann et al., 1991). It appears that the rate of disappearance varies considerably between the studies. Because of the rapid disappearance of naphthalene in all studies, time-weighted average concentrations are preferred to base the effect concentration upon. Studies that have only measured initial concentrations are prone to errors and especially studies, in which concentrations have not been verified, should be considered as invalid.
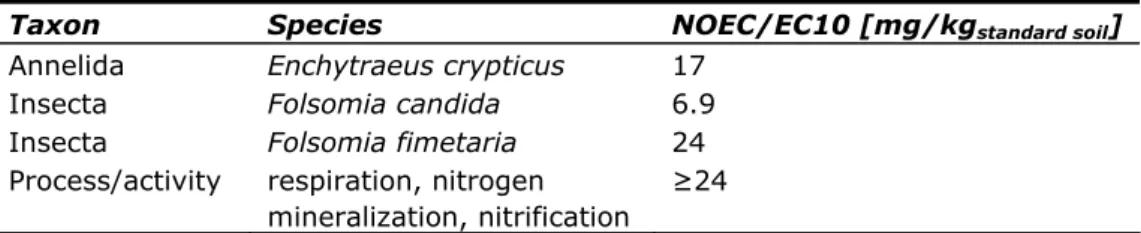
Selected terrestrial toxicity data are available for 1 annelid species, 2 springtail species, and microbial processes (Table 13). Effect concentrations from
terrestrial studies are first transferred to values for standard soil containing 10% organic matter by correcting for the organic carbon content. The lowest usable effect concentration is the NOEC of 6.9 mg/kgdw, standard soil for reproduction of the
springtail Folsomia candida from a 28-d study (Bleeker et al., 2003). No value was selected for terrestrial plants. For lettuce (Lactuca sativa) a NOEC of 230 and an EC10 of 340 mg/kgdw, standard soil are available based on nominal
concentrations. However, at 100 mg/kgdw (714 mg/kgdw, standard soil) the initial
concentration appeared to be only 46%, while at 10 mg/kgdw this measured
initial concentration was only 10%. After the test period of 14 days, the concentration at both levels had dropped below the detection limit of
0.2 mg/kgdw. This means that the time weighted average concentrations over
this period can be at most 5 to 8% of the nominal concentration. Nevertheless, this is still amply higher than the value for Folsomia candida. It is therefore concluded that terrestrial plants are not the most sensitive species for naphthalene.
Table 13: Selected chronic toxicity data of naphthalene to terrestrial species and processes
Taxon Species NOEC/EC10 [mg/kgstandard soil]
Annelida Enchytraeus crypticus 17
Insecta Folsomia candida 6.9
Insecta Folsomia fimetaria 24
Process/activity respiration, nitrogen mineralization, nitrification
≥24
With terrestrial plants included the toxicity data cover primary producers, consumers, and decomposers. Therefore, an assessment factor of 10 can be
applied to the lowest EC10. This results in an MPCeco, soil of
0.69 mg/kgdw, standard soil. The SRCeco, soil based on the chronic data for three
species is 14 mg/kgdw, standard soil.
3.2 Acenaphthylene
3.2.1 Substance identification and physicochemical properties 3.2.1.1 Identity
Figure 4: Structural formula of acenaphthylene Table 14: Identification of acenaphthylene
Parameter Value
Common/trivial/other name Acenaphthylene
Chemical name Acenaphthylene
CAS number 208-96-8
EC number 205-917-1
SMILES code c1ccc2cccc3c2c1C=C3
3.2.1.2 Physicochemical properties
Table 15: Physicochemical properties of acenaphthylene
Parameter Unit Value Remark
Molecular weight [g/mol] 152.2
Water solubility [µg/L] 16,100 Generator-column method
log KOW [-] 3.55 HPLC-RT
log KOC [-] 3.34 QSAR
Vapour pressure [Pa] 0.89 Gas saturation method
Melting point [°C] 91.8
Boiling point [°C] 280
Henry’s law constant [Pa.m3/mol] 11.9 Geometric mean of two values by the gas
stripping method and one by the wetted-wall method
3.2.2 Water
Very few data are available for acenaphthylene. The selected acute toxicity data for freshwater species are presented in Table 16. For all studies the stability of the aqueous concentration is not reported. In the acute toxicity study 48-h with Daphnia magna, concentrations were measured (Bisson et al., 2000). In a 96-h acute toxicity study with the Japanese Medaka, test solutions were renewed but it is unclear whether or not concentrations were measured (Yoshioka and Ose, 1993).
Table 16: Selected acute toxicity data of acenaphthylene to freshwater species
Taxon Species LC50 or EC50 [µg/L]
Crustacea Daphnia magna 1800
The only selected value for marine species is shown in Table 17. In a short-term bioluminescence test with Vibrio fischeri, illumination with simulated solar radiation had no effect on the EC50 (340 µg/L versus 330 µg/L in the dark) (El-Alawi et al., 2001). Concentrations in these tests were not verified, but
considering the exposure time (15 minutes) this is not considered invalidating the test.
Table 17: Selected acute toxicity data of acenaphthylene to marine species
Taxon Species LC50 or EC50 [µg/L]
Bacteria Vibrio fischeri 330 a
Notes to Table 17
a Geometric mean of 330 and 340 µg/L at standard exposure time (15 min).
Strictly, the base set, which consists of acute data for algae, Daphnia, and fish, is not complete, because an acute toxicity study with algae is missing. However, a 72-h static study with Pseudokirchneriella subcapitata was performed but only the EC10 value is reported (Bisson et al., 2000). For algae, the EC50 is derived from the same study as the NOEC or EC10. The EC50 must therefore be higher than this EC10 value. Therefore, the base set is considered to be complete. If there is no significant difference between freshwater and marine species, the data are combined. In this case there are insufficient data for a meaningful statistical test. Therefore, the data are assumed to be similar as for the other PAHs. The most sensitive species in acute tests is the bacterium species Vibrio fischeri. The MACeco, water is based on this value. Normally an assessment factor
of 100 is applied to this value. However, the presumed mode of toxic action of acenaphthylene in ecotoxicity studies is narcosis, at least in acute tests. Further, the EC50 for Vibrio fischeri is considerably lower than the other EC50s and only a factor of 4 to 6 higher than the chronic values (Table 18). Therefore, an assessment factor of 10 seems justified. The MACeco, water thus is 33 µg/L.
Because the data set does not contain a marine species, other than Vibrio fischeri, an extra assessment factor of 10 is applied for the marine environment. The MACeco, marine is thus 3.3 µg/L.
Two long term toxicity studies with acenaphthylene are available (Table 18), a 72-h static study with Pseudokirchneriella subcapitata and a 7-d renewal reproduction study with Ceriodaphnia dubia. In both studies, concentrations were experimentally determined (Bisson et al., 2000).
Table 18: Selected chronic toxicity data of acenaphthylene to freshwater species
Taxon Species NOEC or EC10 [µg/L]
Algae Pseudokirchneriella subcapitata 82
Crustacea Ceriodaphnia dubia 64
Two chronic NOECs for 2 trophic levels are available. These are the EC10 for growth of the algae Pseudokirchneriella subcapitata and for reproduction of the crustacean Ceriodaphnia dubia. To apply an assessment factor of 50 to these data, the group showing the lowest L(E)50 should be included in the data. It can be questioned if algae would be the trophic level showing the lowest L(E)C50, because the bacterium species Vibrio fischeri, which appeared to be the most sensitive species in acute studies, has an EC50 of 330 to 340 µg/L, which is only a factor of 4 higher than the EC10 for Pseudokirchneriella subcapitata. However, chronic data for any species of bacteria are not considered in the derivation of the MPC for water in the case that assessment factors are used.
The 30-min EC50 and EC10 values for Vibrio fischeri were reported based on measured concentrations (Loibner et al., 2004). The EC10 was 180 µg/L. If the
short term EC10 for bioluminescence is considered as a representative measure of growth, growth of Vibrio is not inhibited at concentrations below the lowest EC10 value for Ceriodaphnia dubia. Also the EC10 for Pseudokirchneriella subcapitata is lower than the EC10 for Vibrio fischeri. Some long-term
experiments were performed with Vibrio fischeri as well (El-Alawi et al., 2001). Growth and bioluminescence were examined after 18 hours of exposure. The tests were performed in a complex medium, and therefore, they are not
considered to be representative of the aqueous environment. However, from the test it appeared that bioluminescence is almost 1:1 correlated with growth of the bacteria.
Therefore, an assessment factor of 50 seems to be justified and can be applied to the lowest EC10 of 64 µg/L for Ceriodaphnia dubia. The MPCeco, water then
becomes 1.3 µg/L. With no additional NOECs or EC10s for marine species, an assessment factor of 500 is applied for the marine environment. The
MPCeco, marine thus becomes 0.13 µg/L.
The SRCeco, water is derived by comparing the geometric mean of the acute
toxicity data, divided by a factor of 10, and the geometric mean of the chronic toxicity data. The geometric mean of the chronic toxicity data is the lowest value. The SRCeco, water is 72 µg/L.
3.2.3 Sediment
No data for benthic organisms are available. Therefore, the ERLs are derived by means of equilibrium partitioning. The MPCeco, sediment is 0.17 mg/kgdw, standard sed.
For the marine environment, this number is a factor of 10 lower. The MPCeco, marine sediment is 0.017 mg/kgdw, standard sed. The SRCeco, sediment is
9.5 mg/kgdw, standard sed.
3.2.4 Soil
Only 1 toxicity test with terrestrial species is available for acenaphthylene (Table 19). On the basis of this test an MPCeco, soil of 0.51 mg/kgdw, standard soil is derived.
Because there is only 1 value, the MPC has to be derived by equilibrium
partitioning as well. A value of 0.17 mg/kgdw, standard soil is derived, which is lower
than the value derived from the study with springtails. The MPCeco, soil is thus
equal to 0.17 mg/kgdw, standard soil.
Table 19: Selected chronic toxicity data of acenaphtylene to terrestrial species and processes
Taxon Species NOEC/EC10 [mg/kgstandard soil]
Insecta Folsomia fimetaria 51
Also the SRCeco, soil is derived by comparing the terrestrial value with a value
derived by equilibrium partitioning: 51 versus 9.4 mg/kgdw, standard soil. The
SRCeco, soil is thus 9.4 mg/kgdw, standard soil.
3.3 Acenaphthene
3.3.1 Substance identification and physicochemical properties 3.3.1.1 Identity
Table 20: Identification of acenaphthene
Parameter Value
Common/trivial/other name Acenaphthene, ethylenenaphthalene, periethylenenaphthalene, 1,2-dihydro-acenaphthalene
Chemical name 1,8-hydroacenaphthylene
CAS number 83-32-9
EC number 201-469-6
SMILES code c1ccc2cccc3c2c1CC3
3.3.1.2 Physicochemical properties
Table 21: Physicochemical properties of acenaphthene
Parameter Unit Value Remark
Molecular weight [g/mol] 154.2
Water solubility [µg/L] 4160 Geometric mean of 7 values by
generator-column method
log KOW [-] 3.92 Shake-flask method
log KOC [-] 3.71 QSAR
Vapour pressure [Pa] 0.35 Geometric mean of 2 values by gas
saturation method
Melting point [°C] 93.4
Boiling point [°C] 279
Henry’s law constant [Pa.m3/mol] 13.9 Geometric mean of 5 values by gas stripping
method, 1 value by wetted-wall method and 1 value by headspace method
3.3.2 Water
Acute toxicity tests with freshwater species and acenaphthene have been
performed with crustaceans (Daphnia) and fish (Table 22). The lowest EC50s are for the fish species Salmo trutta and Oncorhynchus mykiss from studies with continuous flow-system and measured concentrations (Holcombe et al., 1983). Table 22: Selected acute toxicity data of acenaphthene to freshwater species
Taxon Species LC50 or EC50 [µg/L]
Crustacea Daphnia magna 958
Pisces Ictalurus punctatus 1720
Pisces Oncorhynchus mykiss 670
Pisces Pimephales promelas 986 a
Pisces Salmo trutta 580
Notes to Table 22
a Geometric mean of 608 and 1600 µg/L.
Acute toxicity data for marine species are available for bacteria, molluscs and fish (Table 23). Illumination with simulated solar radiation had no effect on the EC50 for the bacterium species Vibrio fischeri (830 µg/L versus 810 µg/L in the dark) (El-Alawi et al., 2001).
There is no significant difference between the freshwater and marine acute toxicity data (F-test 0.12, t-test 0.88). Therefore, data can be combined. The lowest value is for the marine species Mytilus edulis. The EC50 for this species is 382 µg/L. However, no EC50 for algae is reported. A valid toxicity study with Pseudokirchneriella subcapitata is available (Bisson et al., 2000) for which only the EC10 of 38 µg/L is reported (Table 24). The EC50 must therefore be higher than this value. However, it is not likely that the EC50 will be higher than the
value for the mollusc species, which is a factor of 10 higher than the EC10 for algae. This has to be taken into account in deriving the MACeco, water. Therefore,
the default assessment factor of 100 is not lowered to 10 in this case. The MACeco, water is then 3.8 µg/L. One EC50 is available for a typical marine species
(mollusc). The extra assessment factor for the MACeco, marine is therefore 5
instead of 10. Then, the MACeco, marine is 0.76 µg/L.
Table 23: Selected acute toxicity data of acenaphthene to marine species
Taxon Species LC50 or EC50 [µg/L]
Bacteria Vibrio fischeri 820 a
Mollusca Mytilus edulis 382
Pisces Cyprinodon variegates 3100
Notes to Table 23
a Geometric mean of 810 and 830 µg/L at standard exposure time (15 min).
With the toxicity study with algae in the chronic data, the base set can be considered complete. Besides algae, chronic toxicity data are available for a crustacean, an insect and fish (Table 24). The crustacean (Bisson et al., 2000) and the insect species (Meier et al., 2000) both have EC10 values that are almost identical to the value for algae. Two independent ELS tests with
Pimephales promelas were carried out, one with dimethylformamide as solvent and one without carrier (Cairns and Nebeker, 1982). The fish were exposed by a flow-through system and concentrations were measured.
Table 24: Selected chronic toxicity data of acenaphthene to freshwater species
Taxon Species NOEC or EC10 [µg/L]
Algae Pseudokirchneriella subcapitata 38
Crustacea Ceriodaphnia dubia 42
Insecta Paratanytarsus parthenogeneticus 39
Pisces Pimephales promelas 289 a
Notes to Table 24
a Geometric mean of 190 and 440 µg/L for the most sensitive endpoint (wet
weight).
The only available valid chronic study with marine species is a flow-through ELS study with the marine fish Cyprinidon variegatus (Ward et al., 1981) (Table 25). Table 25: Selected chronic toxicity data of acenaphthene to marine species
Taxon Species NOEC or EC10 [µg/L]
Pisces Cyprinodon variegatus 610
The algae species Pseudokirchneriella subcapitata is the most sensitive species tested, and although the EC50 for this species is missing, it will most likely also be the species with the lowest EC50 (see discussion above). Hence, an
assessment factor of 10 can be applied to the lowest NOEC or EC10. The MPCeco, water then becomes 3.8 µg/L. No additional chronic toxicity data for
typically marine species are available. Therefore, an assessment factor of 100 will be applied to the lowest NOEC or EC10 to derive the MPCeco, marine. This
MPCeco, marine thus is 0.38 µg/L. The SRCeco, water is derived from the geometric
![Table 22: Selected acute toxicity data of acenaphthene to freshwater species Taxon Species LC50 or EC50 [µg/L]](https://thumb-eu.123doks.com/thumbv2/5doknet/3043731.8195/32.892.164.729.807.929/table-selected-toxicity-acenaphthene-freshwater-species-taxon-species.webp)
![Table 37: Selected acute toxicity data of phenanthrene to freshwater species Taxon Species LC50 or EC50 [µg/L]](https://thumb-eu.123doks.com/thumbv2/5doknet/3043731.8195/39.892.162.731.265.470/table-selected-toxicity-phenanthrene-freshwater-species-taxon-species.webp)