RIVM report 807005 004
The Ecological Footprint of Benin, Bhutan, Costa Rica and the Netherlands
D.P. van Vuuren, E. M.W. Smeets and H.A.M. de Kruijf.
July 1999
This investigation has been performed by order and for the account of the Foundation Ecooperation, within the framework of project 8007005, Development of multidisciplinary indicators for sustainable development in Benin, Bhutan, Costa Rica and the Netherlands.
Abstract
The Ecological Footprint (EF) has received much attention as a potential indicator for sustainable development over the last years. In this report, the EF concept has been applied to four different countries, i.e. Benin, Bhutan, Costa Rica and the Netherlands in 1980, 1987 and 1994. The results of the assessment are discussed and the experiences are used to discuss the current potential and limitations of the EF as a sustainable development indicator. The originally defined methodology has been slightly adapted: 1) the report focuses on individual components of the EF (land and carbon dioxide emissions) instead of focuses on the aggregated EF and 2) the land use calculations are based on local yields instead of global average yields. Although per capita and total land use highly differ among the four countries, available data suggests increasing land use in all four countries while per capita land use decreases. The EF for carbon dioxide emissions increases for all four countries both per capita and in absolute terms. Differences in productivity, aggregation (of different resources) and multi-functional land use have been shown to be important obstacles in EF application – depending on the assessment objective. However, despite the obstacles, the study concludes that the EF has been successful in providing an interesting basis for discussion on environmental effects of consumption patterns including those outside the national borders -and on equity concerning resource use.
Preface
This report was produced by the National Institute of Public Health and the Environment as a study within the project ‘Multidisciplinary Indicators for Sustainable Development’. Within this project, institutes in Benin, Bhutan, Costa Rica and the Netherlands are collaborating to develop indicators for sustainable development and looking into the current environmental and economic situations of these countries, along with the relationships to culture and social aspects. This study applies the Ecological Footprint (EF) concept to the above-mentioned countries. Assessing the EF of these totally different (but all small) countries also indicates the current possibilities and limitations of the footprint as indicator for other countries and situations. In other words, the results of the study could be considered as case-studies supporting the general discussion on the applicability and usefulness of the EF concept within the report. The report also supports ongoing discussion within RIVM on application of the EF in the context of RIVM’s national state-of-the-environment report (Milieubalans) and the fifth environmental outlook report (Milieuverkenning). In this context – and to gain more insight in (un)certainties - also earlier studies for the Netherlands have been focussed on for comparison. The actual data and calculations for this report may be requested from the authors as a separate appendix to the report.
The authors would like to thank the Foundation Ecooperation for making this research possible through its financial support. We would also like to thank Jan Bakkes (RIVM), Henk van Schaik (RIVM) and Jan Juffermans (‘De Kleine Aarde’) for their valuable comments and suggestions. Finally, we would like to thank Mathis Wackernagel (Redefining Progress) for sending the calculation sheets of his EF calculations.
Contents
LIST OF ABBREVIATIONS ... 6 SUMMARY ... 7 1. INTRODUCTION ... 11 1.1 INTRODUCTION... 11 1.2 PROJECT OBJECTIVES... 121.3 ORGANISATION OF THE REPORT... 12
2. CONCEPT AND EARLIER CALCULATIONS ... 13
2.1 SUSTAINABLE DEVELOPMENT AND INDICATORS... 13
2.2 WHAT IS THE ECOLOGICAL FOOTPRINT ?... 14
2.3 EARLIER CALCULATIONS... 16
2.4 DISCUSSION ON THE ECOLOGICAL FOOTPRINT CONCEPT... 19
3. THE CALCULATION METHOD ... 25
3.1 GENERAL STRUCTURE... 25
3.2 LAND USE DUE TO CONSUMPTION OF FOOD AND WOOD PRODUCTS... 26
3.3 BUILT-UP AREA... 27
3.4 CARBON DIOXIDE EMISSIONS... 28
3.5 DIFFERENCES BETWEEN THE ORIGINAL METHOD AND THIS REPORT... 29
4. ECOLOGICAL FOOTPRINT FOR LAND USE ... 30
4.1 LAND USE FOR CONSUMPTION OF AGRICULTURAL PRODUCTS... 30
4.2 LAND USE FOR CONSUMPTION OF WOOD PRODUCTS... 37
4.3 BUILT-UP AREA... 38
4.4 TOTAL LAND USE... 38
4.5 TIME TRENDS IN LAND USE... 41
4.6 UNCERTAINTY OF THE DATA... 42
5. ECOLOGICAL FOOTPRINT FOR CARBON DIOXIDE EMISSIONS... 43
5.1 ENERGY CONSUMPTION... 44
5.2 CARBON DIOXIDE EMISSIONS... 44
5.3 LAND USE FOR SEQUESTERING CARBON DIOXIDE EMISSIONS... 46
5.4 TRENDS IN CARBON DIOXIDE EMISSIONS... 48
6. AGGREGATED ECOLOGICAL FOOTPRINT... 49
7. COMPARISON WITH OTHER STUDIES... 50
7.1 COMPARISON OF FINAL RESULTS WITH THOSE OF WACKERNAGEL ET AL. (1997)... 50
7.2 COMPARISON OF RESULTS FOR THE NETHERLANDS... 51
8. CONCLUSIONS ... 54
8.1 THE ECOLOGICAL FOOTPRINT CONCEPT... 54
8.2 RESULTS OF CALCULATIONS... 55
8.3 POTENTIAL USE OF THE ECOLOGICAL FOOTPRINT... 57
List of abbreviations
CBS Statistics NetherlandsCO2 carbon dioxide
EF Ecological Footprint
EUS Environmental Utility Space
FAO Food and Agricultural Organisation of the United Nations.
GDP Gross Domestic Product
ha. Hectare (100m. x 100m.)
IMAGE Integrated Model to Assess the Greenhouse Effect (RIVM) NGO Non-governmental organisation
RIVM National Institute of Public Health and the Environment
UN United Nations
UN-CSD United Nations Commission on Sustainable Development
UN-DESIPA United Nations-Department for Economic and Social Information and Policy Analysis
UNDP United Nations Development Programme UNEP United Nations Environment Programme
VROM Ministry of Housing, Spatial Planning and Environment (the Netherlands) WCED World Commission on Environment and Development
Summary
The "Ecological Footprint" (EF) was defined some years ago as the total amount of ecologically productive land required to support the consumption of a given population, wherever that land is located. The EF is receiving much attention as a potential indicator for sustainable development. The central metaphor of the EF is probably the most important reason for its popularity: i.e. the expression of the impacts of human consumption in terms of a visible footprint made on the natural carrying capacity. In addition, as a concept, the EF covers simultaneously several issues relevant for sustainable development such as:
• reallocation of environmental pressure to other countries, • squandering of resources and the equity issue in resource use,
• as well as impacts of the use of renewable resources, trade and changes in consumption patterns.
The EF can be determined on various scales (individual, city, country, world). At more detailed levels, the issue of distribution of resource use plays a main role, but, at the global scale, a large EF can be a direct sign of environmental degradation. Though the EF has been calculated by several organisations, work on the indicator is still in an exploratory stage. As well as support, the EF has also received criticism, particularly related to the high level of aggregation and limitations in policy relevance. Aggregation of different types of resource use into one single indicator (land use and carbon dioxide emissions) – as done by Wackernagel and Rees – is based on a weighting system, which includes subjective choices and which has been criticised to create ‘false concreteness’.
In this study, the EF has been applied to Benin, Bhutan, Costa Rica and the Netherlands – so as to subsequently 1) review the EF concept, 2) to gain insight into trends in resource use related to consumption in these countries over time in 1980, 1987 and 1994 and 3) discuss the applicability and usefulness of the EF. The results of the last two objectives are discussed below.
Adapted methodology
On the basis of a review of earlier studies, the present study modifies the original EF calculation method of Wackernagel and Rees on several points. Specifically, the EF has been disaggregated into separate indicators for land and carbon dioxide emissions, thus, avoiding the controversial topic of combining real land use and land equivalents for carbon sequestration while holding on to the more attractive attributes of the EF concept (although outside the scope of this report, the concept of the EF could, defined in this way (see also Box
2.2), also be applied to other resources such as water and biodiversity). In addition, land use
has been calculated on the basis of local yields to show the real land use of countries (a parameter that is more policy relevant at the national level). For comparison, calculations on the basis of global average yields have also been made (as used by Wackernagel and Rees to calculate their figures).
Results of the calculations
• The results of this study suggest that the total land use of all four countries is increasing -or in other w-ords in none of them does absolute de-materialisation takes place in terms of land. In contrast, land use per person is decreasing in all four countries (but is too slow to
offset the increasing population). Increasing yield per product has been the most important factor behind the decrease in per capita land use. On a global scale, available land per capita is declining rapidly due to global population growth, changes in production and consumption patterns, expansion of settlements and land degradation. • Both differences in consumption per capita and differences in yields per hectare have an
impact on land use per capita. Yields are (actively) influenced by, for example, agricultural knowledge, technology and production methods, but also (passively) by natural circumstances. As a result, for international comparison, use of local yields only can lead to results that are difficult to compare unambiguously. Obviously, what is best depends on the objective of the comparison. The present study uses both local and global average yields calculations.
• In 1994, the calculated land use per capita on the basis of local yields (i.e. domestic yields and for imports, the yields of the country of origin or global average yields) is smallest for the Netherlands. Per capita land use of the Netherlands is 0.7 ha., while land use of Benin, Bhutan and Costa Rica are respectively 0.7, 0.9 and 1.2 ha. per capita.
• The Netherlands – as a densely populated country – is strongly dependent on use of land in foreign countries for its food and wood products consumption. After subtracting exports, the total amount of land used is 2 to 3 times the surface area of the Netherlands. The other three countries use a total land area smaller than the surface area of their country.
• If, instead of local yields, global average yields were to be used, the EF is smallest for Bhutan, followed by Benin, Costa Rica and the Netherlands (directly related to consumption levels and patterns). The results are 0.6, 0.7, 1.7 and 3.0 ha. per capita, respectively.
• Comparison of these results with other studies for the Netherlands shows this study to be near earlier estimates (most of them have less detail). However, the range in these studies is still considerable, from 0.5 to a maximum of 1.5 ha. per capita as results of differences in data and methodology.
• The EF for carbon dioxide emissions increases for all four countries, both in per capita and absolute terms (only commercial fuels are taken into account to prevent double counting with land use). For the Netherlands, the EF for 1994 is 8.9 tonne carbon dioxide per capita which is 2.2 times the global average level of 4.0 tonne carbon dioxide per capita. The EF for the Netherlands is, however, 20% lower than the domestic emissions of the country. Emissions of the other three countries are below the global average: 2.5 tonne per capita for Costa Rica and less than 0.1 tonne per capita for Benin and Bhutan.
• In all four countries, population growth can be identified as an important upward pressure on carbon dioxide emissions. In addition, in the Netherlands and Bhutan GDP per capita has increased strongly over the 1980-1994 period.
Applicability and usefulness
On the basis of this study, the following considerations can be made regarding the use of the EF concept as potential (sustainable development) indicator:
• The EF concept can, in principle, be the basis for relevant sustainable development indicators if these indicators are part of a larger set. Specific questions that EF indicators -in pr-inciple - could address are:
− What is the current pressure of a specific population on key resources for sustainable development to support its current consumption? How does use change over time? − How is the current resource use distributed among different countries? What could
this mean for future resource use - either unabated or based on redistribution of the environmental space in a more equitable way?
− Does environmental pressure of industrialised countries shift to industrialising countries from which goods are imported?
− What consequences does the consumption of a specific population have on the environment in other parts of the world? Does international trade result in lower and higher overall environmental pressure ?
• With regard to policy relevance, it is helpful to distinguish between direct and indirect environmental pressures (i.e. pressures originating from the country in study or originated in an exporting country as a result of consumption in the country in study). For the first type of pressures, the question of responsibility is relatively clear – in the second case, moral responsibility and engagement can be leading principles.
• Although the aggregated EF might be useful in communication to a broader public, we are of the opinion that analytical soundness improves if the EF is elaborated as a set of resource indicators.
• Policy measures aimed at reducing EFs will in most cases go in the same direction as current environmental policies for mitigating greenhouse gas emissions and reducing resource squandering. Obviously, the equity issue regarding use of environmental resources is related to the distribution of financial resources – and thus akin to much broader policy themes. The main contribution of the EF here is its metaphor.
• In general, results of EFs can be interpreted more unambiguously for a specific country than for international comparison (inter alia, as result of differences in potential land use). • Measurability problems do not seem to raise concerns. Estimates should, obviously, be
used while acknowledging the uncertainties in these data.
• The analytical soundness of the indicator can still be improved further. Issues that need further attention are:
− possibilities and limitations of aggregation of resources,
− differences in agricultural productivity in international comparison,
− how to handle unsustainable resource use in the context of the EF (e.g. land degradation),
− the role of multi-functional land use, and
− and a more direct link of the EF to the issue of biodiversity.
• Finally, the EF is a macro-indicator which cannot indicate the situation for more specific issues or (still) other important aspects of environmental sustainability not included in the indicator, such as the use chemicals or water consumption. Macro-indicators, in general, are more useful as indicators of an unsustainable than a sustainable situation.
In conclusion, although far from perfect, the EF concept can be concluded to provide a basis for discussion on environmental pressures of consumption patterns, geographical re-allocation of environmental pressure, the equity issue regarding the use of resources and global commons and available means to reduce the present EF – both at individual and global levels.
1. Introduction
1.1 Introduction
In the last few years, the Ecological Footprint (EF) has been frequently mentioned as a potential indicator for the environmental consequences of production and consumption patterns (Rees, 1992; Wackernagel and Rees, 1996). This indicator is defined as the total ecologically productive land (including sea) needed to support the total consumption of a given population in a sustainable way. Most of the attention for the EF originally came from environmental and educational organisations (such as The Earth Council and “De Kleine Aarde” in the Netherlands). Currently, scientists, policy-makers and politicians are increasingly becoming interested. For example, in 1998 in the Netherlands' parliament questions have been raised about the EF (Van der Steenhoven, 1998) and the Minister of Public Housing, Spatial Planning and the Environment (VROM) has expressed his ambition to use the EF concept and asked a consulting agency to look deeper into the issue (Pronk, 1998; Pronk, 1999).
The central metaphor of the EF is probably the most important reason for its popularity: i.e. the expression of impacts of human consumption in terms of a visible footprint made on the natural carrying capacity; the EF refers to the continuing dependency of human societies on nature in terms of the more obvious dependency of traditional societies on their available land. We will discuss the appealing aspects and limitations of the EF in more detail in
Chapter 2.
Several organisations have already calculated EFs at different scale levels, ranging from individual and urban to the global scale (e.g. Wackernagel et al., 1997; Wackernagel and Richardson, 1998, Bicknell et al., 1998; Milieudienst Amsterdam, 1998; Wackernagel et al., 1999). Most of the EF work is still rather exploratory. Clearly, as well as support, the EF has also received criticism from both scientists and policy-makers (e.g. Van den Bergh and Verbruggen, 1999; UN.CSD, 1999). Therefore, explicit work still has to be done on the applicability and usefulness of the EF before it can be used in more regular state-of-the environment or sustainable-development reporting.
In this report, we will present the results of an application of the EF concept for the Netherlands and Benin, Bhutan and Costa Rica. This application is part of a larger Sustainable Development Indicators project for those four countries (see also Van Vuuren and De Kruijf, 1998). By means of this application, we aimed to gain more insight into the potential use of the EF, as well as into trends in resource use of those four countries. In addition, the current report is also produced as an input to ongoing discussions in the context of the ‘Milieuverkenning’ 1. Within this assessment, RIVM has been requested to explicitly
look at the environmental consequences in other countries of consumption and production patterns in the Netherlands.
1 The ‘Milieuverkenning’ is a regularly published environmental outlook report, supporting environmental
In this report, a slightly adopted methodology has been used to calculate EFs in comparison to the work of Wackernagel et al. (1997) as explained in Chapter 2 and Chapter 3. In addition, in comparison to many of the earlier footprint applications, the calculations are more detailed. Finally, we examined the way the EF for the four countries changes through time - while the EF has so-far almost always been applied as a static indicator.
1.2 Project objectives
The objective of the sustainable development indicators project in the context of Sustainable Development Agreements between the Netherlands and Benin, Bhutan and Costa Rica is to develop tools which allow assessment of trends related to sustainable development in these countries. This study applies the EF concept, first of all, in this context. However, by assessing the EF of these totally different (but small) countries, we will also indicate current possibilities and limitations of the footprint as indicator for other countries and situations. The study is also produced as input into discussions and further elaboration in the context of the RIVM’s fifth environmental outlook report ‘Milieuverkenning’.
The following central aims have been chosen for analysis in the study:
• To review the EF concept as introduced by Wackernagel and Rees (1996) (and related publications);
• To calculate the EF for Benin, Bhutan, Costa Rica and the Netherlands on the basis of the chosen EF definition and data sets, and to discuss the results so as to gain insight into trends and driving forces leading to changes in the EF.
• To discuss the applicability and usefulness of the concept on the basis of the results for the four countries.
1.3 Organisation of the report
Chapter 2 describes the EF concept in more detail and discusses earlier research in this area.
The chapter also pays attention to some of the appealing aspects and limitations of the EF indicator as used so-far. Next, Chapter 3 describes the calculation procedure in this report.
Chapter 4 and Chapter 5 discuss the results for land use and carbon dioxide emissions,
respectively. Chapter 6 compares the results of this study to those of earlier assessments. Finally, Chapter 7 discusses the conclusions of the report in view of the objectives as stated in the previous section. The figures shown in this report are based on extensive calculations and data. These may be requested from the authors as a separate appendix to the report.
2.
Concept and earlier calculations
2.1 Sustainable development and indicators
The EF has been mentioned as a potential indicator for sustainable development. As introduction to a more detailed discussion on the EF concept, it is, therefore, useful to pay some attention to sustainable development and sustainable development indicators. This discussion will focus only on relevant points for this report. We certainly do not have the pretension to provide an extensive discussion on these topics here, as a broad range of literature is already available.
Sustainable development
Many national governments and international organisations have adopted the concept of sustainable development as one of the central concepts for environmental and development policy making. The concept was introduced to the policy-making agenda by the World Commission on Environment and Development through the publication of Our Common
Future (WCED, 1987). By using this term, the WCED report emphasised the links between
environmental problems and socio-economic developments (including underdevelopment). In industrialised countries, the publication of the WCED report coincided with a period in which these countries were increasingly confronted with environmental problems. Governments in many of these countries tried to respond to those problems through a combination of technology and command-and-control type policies. For some problems - such as urban air pollution - this approach has been relatively successful. However, for others, results have been less satisfactory, for example because a constant growth of activities and consumption have partly offset the results of end-of-pipe oriented policies. A more integrated approach aimed at ’sustainable development’ might provide an alternative approach here. In less industrialised countries, the relation between environment and development can be even more important as non-sustainable activities can be both a cause and a result of poverty and lack of resources (see for extensive discussions e.g. World Bank, 1992; UNDP, 1998).
Since 1987, several attempts have been made to make the concept of sustainable development more operational for decision-making. An important milestone was the United Nations Conference on Environment and Development in 1992 in Rio de Janeiro (Brazil). However, despite all attention in policy and scientific debates, there is still no single definition which is shared by all actors involved. Most people seem to agree that sustainable development encompasses both environmental, economic and social aspects - and that sustainable development refers to finding a potentially long-lasting balance between development in those three areas. At the same time, however it is clear that sustainable development is a multi-dimensional and value-linked concept and that uncertainties are large. Therefore, rather than try to strictly define sustainable development in an objective way, it seems to be more functional to use it as guiding principle to be applied heuristically (Rotmans and De Vries, 1997; Langeweg, 1998).
An important aspect of sustainable development is the management of resources. In the past, focus of resource management has been mainly on non-renewable resources such as energy and metals. More recently, attention has shifted towards the use of several renewable resources, in particular land and water. The Global Environment Outlook concluded that
water and land (especially highly productive agricultural land) are key-resources for future human development (RIVM/UNEP, 1997). On the Dutch national scale, similar conclusions were drawn in the context of third National Environment Policy Plan (VROM, 1998).
Indicators for sustainable development
Since the introduction of the concept of ’sustainable development’, there has been an ongoing search for indicators that could support decision-making in this context (e.g. Kuik and Verbruggen, 1991; Bakkes et al., 1994; Hammond et al., 1995; World Bank, 1996; UN.CSD, 1996; Moldan and Billharz, 1997). One can identify three type of approaches, although many intermediate ones exist:
1) Developing an aggregated indicator of sustainable development; examples of this approach are the ISEW and GPI indicators (Cobb et al., 1995, Jackson et al., 1998) and the Wealth of Nations approach of the World Bank (World Bank, 1996).
2) Developing a comprehensive assessment framework and systematically deriving indicators from these frameworks; an example of this approach is the report to the Balaton Group (Meadows, 1998).
3) Developing a set of sustainable development indicators based on consensus without a comprehensive, strictly used assessment framework; examples are the sustainable development indicator work of UN.CSD (UN.CSD, 1996) and the Sustainable Seattle project (in Moldan and Billharz, 1997).
Selection criteria are often used to determine whether a certain indicator is suitable for sustainable development. Meaningful criteria are, for instance: 1) policy relevance and utility for users, 2) analytical soundness, 3) measurability (Bakkes et al., 1994) and 4) communication to a broader public. Obviously, it is virtually impossible to comply with all those criteria at the same time – and most of the time compromises need to be made.
At the moment, there is certainly no set of sustainable development indicators or approach that can be regarded as a blueprint. In fact, because sustainable development is a value-dependent concept, it will be a very difficult task to develop an easy, universal method to test current development for sustainability. We know, however, that a complete set of indicators for sustainable development, as currently defined, should cover economic, social, environmental and institutional issues. Therefore, we have to consider the EF as just one indicator out of a much larger set as the EF only takes (a selection of) environmental issues into account.
2.2 What is the Ecological Footprint ?
The Ecological Footprint (EF) intends to provide an overview of the use of resources and the generation of waste that can be attributed to final consumption (either for a certain category or an economy as a whole) on the basis of available technology and processes. As such, it is related to earlier concepts in this area such as 'carrying capacity' and 'environmental utility space' (Weterings and Opschoor, 1994) (see Box 2.1). However, compared to carrying capacity, the EF concept can take into account that human populations often use resources outside their direct environments. As the discussions in Wackernagel and Rees (1996) make clear the EF can be regarded as both a conceptual model and (derived from this concept) a calculation method.
resources:
• crop land and pasture land (for production of food and goods), • built-up land (to support infrastructure),
• forest (for the production of wood products), • fish (food production) and
• carbon assimilating capacity (for carbon dioxide emissions from fossil fuels).
In the EF defined by Wackernagel and Rees (1996) these different types of resources are aggregated in terms of the amount of land. For the first four resources, this is relatively straightforward2. Fish consumption is translated into surface area by estimating the area of productive sea required for producing the fish. Carbon dioxide emissions are accounted for by assessing the area of carbon-sink forest required to sequester the carbon dioxide emissions associated with burning fossil fuels3. This is based on the assumption that increasing the carbon dioxide concentration in the atmosphere can not be regarded as sustainable.
Box 2.1: Related concepts: Carrying capacity and environmental utility space
The EF is closely related to the ecological concept of ’carrying capacity’. Carrying capacity is defined as the population of a given species that can be supported indefinitely in a defined habitat without permanently damaging the ecosystem on which it depends. Related concepts are that of ’maximum sustainable yields’ (maximum harvest that can be supported) or ’critical load’ (maximum pollution or waste that can be absorbed). At the moment many studies exist that are based on these concepts, but the use of carrying capacity concept is limited for at least two reasons: 1) it is often difficult to determine the carrying capacity in a objective way and 2) carrying capacity within a certain region can be increased by means of trade. While the carrying capacity is defined in terms of maximum number of humans per hectare, the ecological footprint is defined in terms the number of hectares used per human. It can be readily adapted to incorporate trade, making it a more appropriate concept to apply to human populations (Bricknell et al., 1998).
Another related notion is that of environmental utility space (EUS) (e.g. Weterings and Opschoor, 1994). The EUS is defined as the potential combinations of resource use and economic welfare within sustainable boundaries. As for the EF, the globally or regionally available amount of environmental space is divided on a per capita basis among countries. In comparison with the EF, the EUS considers more types of resources and does not attempt to aggregate different resources into one denominator. An important element of the EUS approach is the maximum allowable resource use (similar to carrying capacity). Those maximum levels have been the topic of intense debate since it is (again) almost impossible to determine these boundaries on the basis of scientific information only. The EUS has been used in assessments of Friends of the Earth for the Netherlands and Europe (e.g. Buitenkamp et al., 1992).
2 Although not all land is equally productive; this aspect will be given more attention later on in this report. 3
Wackernagel and Rees (1996) also propose alternative measures: 1) calculating the amount of land required to produce a sustainable substitute (biofuels) for fossil fuel and 2) calculating the land area required to rebuild a substitutable form of natural capital at the same rate of fossil fuel being depleted. According to Wackernagel and Rees, these alternatives give comparable results; they decided to account for carbon dioxide emissions on the basis of 1 ha. of forest that can sequester 1 GJ of fossil fuel per year. It should be noted that the proposed methodology is not more than an accounting method. The fact that there are also other methods to reduce carbon dioxide emissions (such as energy efficiency) is not ruled out.
An interesting aspect is that the EF can be defined at different levels of scale: person, countries, the global scale or even products. This allows comparing EFs to the global average footprint or the global available land. Earlier assessments showed that about 75% of the resources consumption included in the EF is attributable to only a quarter of the world’s population (thus so relating environmental issues to equity issues). In assessing the available amount of land for human consumption, Wackernagel et al. (1997) take into account that not all land can be used for human consumption, and they reserve - on the basis of the WCED report (1987) - 12% of the global land for biodiversity.
2.3 Earlier calculations
The EF has been used for country-level assessment in several reports. In Chapter 7, we will pay more extensive attention to the studies covering the Netherlands - comparing our results to those of earlier studies. Here, we have shortly indicate some of the main results, as a basis for our discussion on the concept.
International calculations
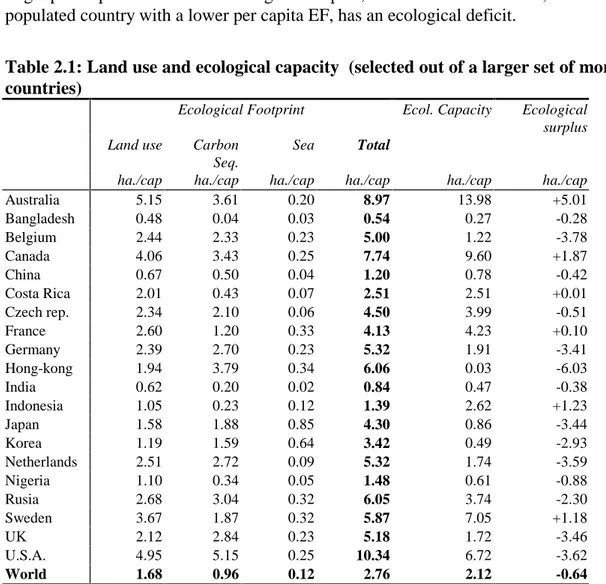
Wackernagel and Rees (1996) and Wackernagel et al (1997a, 1997b, 1997c) have calculated EFs for a large number of countries. Each time, the calculation method was further developed – which also means that results differ. The most advanced study published so-far is that of Wackernagel et al. (1997c)4 (see Table 2.1).
Although all results are expressed in hectares, not all results refer to real land use. This is most obvious for land use for sequestration of carbon dioxide emissions. As will be explained further in this chapter, for individual countries other types of land use are weighted by Wackernagel et al. (1997c) by 1) calculating land use on the basis of global average land productivity (instead of local yields) and 2) including certain equivalence factors for different types of land use.
There are large differences in the amount of land attributed to the per capita consumption of different countries. In terms of terrestrial land, results differ from 0.5 ha. per capita for Bangladesh to 5.0 ha. per capita for the U.S.A. If also land use for carbon dioxide sequestering is included, the data suggests that humanity puts a considerable burden on global natural capital. Humanity’s average ecological footprint measures 2.8 ha. of ecologically productive space, while only 2.1 ha. are available. In other words, there is not enough land available to simultaneously 1) supply food and other resources for human consumption, 2) to conserve enough natural ecosystems for keeping up biodiversity and 3) sequestering all current carbon dioxide emissions.
The share of land for carbon sequestration ranges from about 20% for the non-industrialised countries to slightly more than 50% for the industrialised countries. The area of sea used for fish production is for most countries less than 5% of their EF, with the exception of a few countries for which fish represents a major share of their protein intake such as Japan, Korea and Iceland. For these countries, the sea area is about 20% of the total EF.
4 The calculations of Wackernagel et al. (1997c) have been provided by Wackernagel in 1999. Earlier
There are large differences in ‘ecological deficit’ of countries, which can be explained in terms of differences in consumption levels. However, also size of a country, type of land and population density play an important role. Canada, a large, scarcely populated country with a large per capita EF has an ecological surplus, while the Netherlands, a small, densely populated country with a lower per capita EF, has an ecological deficit.
Table 2.1: Land use and ecological capacity (selected out of a larger set of more than 50 countries)
Ecological Footprint Ecol. Capacity Ecological surplus Land use Carbon
Seq.
Sea Total
ha./cap ha./cap ha./cap ha./cap ha./cap ha./cap
Australia 5.15 3.61 0.20 8.97 13.98 +5.01 Bangladesh 0.48 0.04 0.03 0.54 0.27 -0.28 Belgium 2.44 2.33 0.23 5.00 1.22 -3.78 Canada 4.06 3.43 0.25 7.74 9.60 +1.87 China 0.67 0.50 0.04 1.20 0.78 -0.42 Costa Rica 2.01 0.43 0.07 2.51 2.51 +0.01 Czech rep. 2.34 2.10 0.06 4.50 3.99 -0.51 France 2.60 1.20 0.33 4.13 4.23 +0.10 Germany 2.39 2.70 0.23 5.32 1.91 -3.41 Hong-kong 1.94 3.79 0.34 6.06 0.03 -6.03 India 0.62 0.20 0.02 0.84 0.47 -0.38 Indonesia 1.05 0.23 0.12 1.39 2.62 +1.23 Japan 1.58 1.88 0.85 4.30 0.86 -3.44 Korea 1.19 1.59 0.64 3.42 0.49 -2.93 Netherlands 2.51 2.72 0.09 5.32 1.74 -3.59 Nigeria 1.10 0.34 0.05 1.48 0.61 -0.88 Rusia 2.68 3.04 0.32 6.05 3.74 -2.30 Sweden 3.67 1.87 0.32 5.87 7.05 +1.18 UK 2.12 2.84 0.23 5.18 1.72 -3.46 U.S.A. 4.95 5.15 0.25 10.34 6.72 -3.62 World 1.68 0.96 0.12 2.76 2.12 -0.64
Note: A negative ecological surplus indicates an ecological deficit. Source: Wackernagel et al. (1997c)
Land used for consumption in the Netherlands
The total (real) land use for the inhabitants of the Netherlands has been assessed by several studies, including Rietveld (1985), Harjono et al. (1996), Hoek et al. (1996)/RIVM (1996, 1997)5 and Wackernagel et al. (1997) (see Table 2.2).
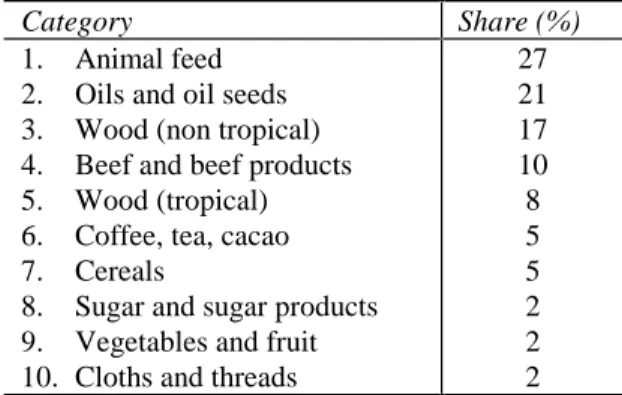
The study of Harjono et al. (1997) covers the highest number of land use categories, including for instance land use for leather and minerals – but for imports only. This study indicates that land use for food production and wood products, however, are by far the largest categories in terms land use (Table 2.3).
5 The methodology is described in Hoek et al. (1996). Results are given in RIVM (1996, 1997). We will refer to
Table 2.2: Land use, ecological capacity and ecological deficit of the Netherlands.
Ecological Footprint Ecol. capacity Ecological surplus Real land
(ha/cap)
Carbon seq. (ha./cap)
Total
(ha./cap) (ha./cap) (ha./cap)
Rees/Wackernagel (1996) - - 3.3 0.2 -3.1
Wackernagel et al.(1997b) - - 4.7 2.8 -1.9
Wackernagel et al. (1997c) 2.5 2.7 5.2 1.7 -3.6
RIVM (1997) 0.5 - - -
-Harjono et al. (1996) 1.5 - - -
-Table 2.3: Land use for different categories.
Category Share (%)
1. Animal feed 2. Oils and oil seeds 3. Wood (non tropical) 4. Beef and beef products 5. Wood (tropical) 6. Coffee, tea, cacao 7. Cereals
8. Sugar and sugar products 9. Vegetables and fruit 10. Cloths and threads
27 21 17 10 8 5 5 2 2 2 Source: Harjono et al., 1996.
Large differences are present between the results of these studies. The following factors play a role in this:
• Comprehensiveness of the study. The studies of Wackernagel and Rees (1996) and Wackernagel et al. (1997b,c) also include land for carbon sequestration – not included in the other two studies. But, also for terrestrial land use estimates, different categories are included in the studies. For instance, Harjono et al. (1996) only concentrate on land use outside the Netherlands but include a large number of categories.
• Primary data: The studies of RIVM (1997) and Harjono et al. (1996) are mainly based on national statistics. Wackernagel and Rees (1996) and Wackernagel et al. (1997) mainly use data from international information sources – in order to use harmonised data for different countries.
• Local yields versus global average yields: Wackernagel et al. (1997) use global average yields to calculate land use in order to make results for different countries more comparable. RIVM (1997), however, use local yields – which are in case of the Netherlands much higher. In case of imports, sometimes they use the yields of the country of origin.
• Detail of the calculations: The calculations of Harjono et al. (1996) and RIVM (1997) are more detailed than the other three studies.
• Definitions: An important factor for the Netherlands is the import of a large amount of fodder, used in animal husbandry and food-industries, of which products are partly exported to other European countries. The studies reviewed all deal with this aspect in a different way. Use of the term ‘net’ and ‘gross’ land use, can help to indicate whether the amount of land is corrected for exports or not (Box 2.2).
Box 2.2: Definition of the EFs featured here
Ecological Footprint concept: the amount of the world’s carrying capacity required to support the consumption of a defined population regardless of where this capacity is used (can be calculated for various resources)
Wackernagel and Rees’ Ecological Footprint (1996): total amount of ecologically productive land required to support the consumption of a given population in a sustainable way.
Gross land use: Total land attributed to imports to and domestic production of a certain defined population, measured in local (= country-specific) productivity.
Net land use: Total land required to support the consumption of a certain defined population , measured in local (= country specific) productivity.
Net land use for international comparison: Total land required to support the consumption of a certain defined population, in which equivalence factors are used to enhance comparison where there are differences in natural circumstances.
EF in terms of carbon dioxide emission: Total carbon dioxide emissions generated to support the consumption of a defined population – regardless of where these emissions are created.
2.4 Discussion on the Ecological Footprint concept
2.4.1 What makes the Ecological Footprint appealing ?
The attractive aspect of the EF is that it highlights several interrelated topics of sustainable development. On the basis of the available literature, we were able to identify several of these topics, which, taken together, could explain the current popularity of the EF (besides the metaphor mentioned in the introduction).
1. Focus on consumption
Traditional environmental policies have often been aimed at reducing emissions on the production side of the economy (industry, businesses, agriculture). However, state-of-the-environment reports on the national (RIVM, 1998), and regional and global scales (EEA, 1998; UNEP, 1997) indicate that for several environmental issues results of such policies are partly or even completely offset by an increasing level of consumption (e.g. greenhouse effect). The EF, in contrast, focuses on consumption and is able to highlight the following aspects.
• Squandering of resources: Several resources are – at least at the moment – limited in
supply; these include safe drinking water, natural areas and biodiversity, energy and land. Squandering of resources does not only lead to resource stress but can also increases environmental pressures due to increased material flows.
• Impacts of the size and composition of consumption patterns: Obviously, certain
consumption patterns can be regarded as more sustainable than others. Although in the past, policy initiatives aimed at changing behaviour to more sustainable patterns have not always been successful, there is considerable potential in this area (in particular via good housekeeping and conscious purchasing).
• Geographic re-allocation of environmental pressures:
Traditionally, environmental pressures are mostly local or national in their characteristics. However, more-and-more decision-makers are confronted with international aspects of environmental problems. Figure 2.1 distinguishes different types of influences between countries. We can use this figure to discuss the issue of geographic re-allocation of
environment pressures. National environment
Country A.
National environmentCountry B.
Social economicdevelopments Social economic developments Global environment;global commons Trade Transboundary pollution 2. 3. 4. 5. Transport 1.
Figure 2.1: Re-allocation relationships between countries Source: after Sips and Brieskorn, 1999.
As Figure 2.1 shows, production and consumption within country A can cause direct environmental pressures at three different levels:
• within the country itself (1),
• in country B, by means of transboundary air pollution (such as acidification) (2) and • by pressures on the global environment and global commons (e.g. carbon dioxide
emissions, ozone-depleting substances and fish consumption) (3).
For all these types of pressures, country A can be identified as the direct originator of pressures, and thus, can be seen as formally responsible for environmental impacts of these pressures. In addition, however, two indirect forms of environmental pressure-related consumption and production in country A can be identified:
• the environmental pressures within country B that are related to imports to and consumption of country A (4),
• the environmental pressures of international transport (5). In most cases, these pressures are not attributable to individual countries and, as results, remain outside the scope of environmental management.
For environmental pressures in country B related to imports to and financial flows of country A (thus type 4) responsibility is not very clear; formally actors in country B can be identified that cause these pressures. Nevertheless, country A is engaged in these pressures – and some might argue that country A has a moral responsibility here. This can, for instance, be the case if country A requires very strict environmental standards for domestic production – but simultaneously imports the same products from countries that are for economic and institutional reasons not able to uphold such standards, resulting in indirect environmental degradation or human health risks.
As indicator, the EF takes all five different categories of pressures directly into account and attributes them to consumption (here of country A). It, therefore, broadens the discussion with respect to the first three types of pressures normally taken into account. Along this line of thinking, it should be noted that production-oriented indicators do not reveal shifts in environmental pressures caused by re-allocation of production to other countries (e.g. basic industries that move to countries with lower labour costs or less strict environmental policies). For global problems, such as climate change, re-allocation reduces the effectiveness of unilateral environmental policies. Particularly for a small country with an open economy such as the Netherlands, it is relevant to include such effects in the assessments.
2. Focus on renewable resources
An attractive attribute of the EF is that it focuses on some resources identified as key resources for sustainable development (land, carbon dioxide emissions). UNEP’s Global Environment Outlook, for instance, concluded that land – suffering from degradation and becoming increasingly scarce – is one of the key resources for sustainable development in most of the world’s regions (UNEP, 1997).
3. Distribution of available environmental resources
The EF addresses the current distribution of resource use (by calculating the per capita footprint for individuals, cities or countries and comparing them to a global average). Assessments of environmental pressure in the next century indicate that strong economic growth in current poor parts of the world (with low-level use of resources, such as Africa and parts of Asia) could result in either an enormous increase in pressures or a claim for reallocation of the environmental space. In that case, after determining a global ‘maximum allowable’ level of environmental pressures for sustainable development, the question is how this can be distributed among the global population. In the context of ongoing climate change negotiations, this is already an important issue, with proposals to base burden-sharing initiatives in the next century on an equitable distribution of per capita emissions rights.
4. Focus on environmental consequences of trade
Some authors (Van der Bergh and Verbruggen, 1999) argue that the EF implicitly promotes autarchy or is against trade. However, the calculation method of the EF does not give any reason for this. Without going into too much detail, trade, in the context of sustainable development, could have both advantages (using ecologically comparative advantages of countries, providing income) and disadvantages (environmental consequences of transport, making the link between human consumption and environmental impact more complex, and potential lack of a stringent environmental law in exporting countries). If international trade is truly based on ecologically comparative advantages (including the effects of transport), it will result in a lower overall EF.
5. Communication / pro-active
Results of the EF are relatively easy to visualise. Moreover, since the EF can be calculated on a per capita basis, EFs can be compared between countries, with the global average or a potentially more sustainable level. These features allow for powerful communication of the results – which explains its popularity among advocacy groups. The EF can also be calculated for individuals – as has been done in the Netherlands for school-going youth and individuals
on Eco-teams - allowing them to relate their behaviour to global objectives and encourage more environmentally-friendly behaviour.
6. Aggregation
Different authors have argued for the development of aggregated environmental indicators which are able to give a rough overview of environmental pressure or sustainability (e.g. Adriaanse et al., 1997; Jesinghaus, 1996). However, at the same time aggregation is extremely difficult and controversial for complicated systems (such as the environment), since there are no general, scientific rules or theory to weigh different impacts from an ecological perspective.
2.4.2 Points of discussion or critism
At the same time, there are several points of the EF which can be subject of discussion. This section summarises a few of these points.
1. Aggregation
The aggregation of the EF currently receives most criticism. Due to the complexity of the environmental system, weighting in indices will always be based on more indirect measures – including some kind of subjective reasoning. In the EF, an indirect weighting system is used on the basis of translating pressures into the amount of land needed to support different ecological functions6. Although the different resources within the EF can indeed be related to the use of land, this requires several subjective assumptions, including the assumption that for sustainable development no increase of greenhouse gas concentrations can be allowed. Van den Bergh and Verbruggen (1999) argue that by using land as an aggregated indicator, the EF could create a false concreteness. It seems to suggest that we are talking of a specific environmental resource (land) while actually it represents (at least partly) a hypothetical amount of land. Moreover, the fixed aggregation scheme does not take into account that in specific situations one resource might be scarcer than another.
2. Sustainable versus unsustainable land use
The EF pays no attention to the sustainability of current land use practices, in particular concerning soil degradation (pollution, erosion, soil nutrient depletion etc.). In cases current agricultural practices do result in soil degradation, a sustainable EF will often be larger than the current EF.
3. Productivity
In international comparison of land use, the issue of productivity ( = land per unit of production) plays a major role. Productivity is influenced by human management factors, including types of product, technology and knowledge, but also natural circumstances, such as soils, climate etc. Comparing land use among countries and global regions is complicated by the fact that in some countries natural circumstances are less favourable for high agricultural productivity (we will return to this in the discussion of our results). ‘Natural yield factors’ could be included in the EF to take account of differences in natural circumstances. In current EF work, the issue is altogether avoided by relating consumption to the global
6
As will be shown further in this article, the EF weighting system results in energy use accounting for over 50% of the total ecological footprint for industrialised countries. Despite the claim of subjectiveness, the present weighting system is in line with the conclusions of many environmental assessments indicating the important role of energy consumption in environmental problems of the industrialised world (e.g. EEA, 1998).
average yield7. For national governments, however, land use based on local yields might be much more relevant since these can be influenced, for instance, by increasing productivity (which might result in unsustainable land use practices). Moreover, using local yields means that the calculated area is equal to the real, touchable, area used for the consumption of a specific country.
4. Use of ecological capacity
Many EF studies also define the ecological capacity of countries and subtract the EF from this capacity to determine so-called ecological deficits or surpluses (e.g. Wackernagel and Rees, 1996; Wackernagel et al., 1997). These indicate whether a country, in principle, is able to supply itself with food and timber on a sustainable basis or whether it has to rely on ‘net imports of land’ outside its national borders – thus indicating (net) self-sufficiency8. On a global scale, the notion of self-sufficiency and sustainability coincide. For other scale levels, however, self-sufficiency (and the deficit/surplus) is a function of among others population density9. Using the ecological deficit as an indicator of sustainable development would imply self-sufficiency to be a meaningful aspect of sustainable development, but we doubt whether a large, scarcely populated, self-sufficient country with a large per capita EF should be regarded as more sustainable than a small, densely populated country with a lower per capita EF.
5. Factors complicating comparison
Several factors such as climate, availability of national resources, population density and tradition can strongly influence consumption patterns. For instance, in Canada energy consumption for heating and transportation is high, among others because of the cold climate and the low population densities.
6. Limited coverage
Some of the criticism about the EF stems from the EF as being seen as the sole indicator for sustainable development. The EF does cover only some of the aspects of sustainable development.
2.4.3. Choices made in this report
On the basis of the discussion above, we have decided to use the EF framework, but to adapt the calculation methodology slightly in order to reduce the weaknesses as discussed above. • We will avoid the issue of aggregation as far as possible by not focusing on the
aggregated EF – but on its components in their own typical units. By doing so, we are still able to keep some of the attractive features mentioned above. The EF is thus defined as ‘the use of the world’s carrying capacity required to support the consumption of a defined population regardless of where this capacity is used’ and can be applied to different resources (land, forest, carbon assimilating capacity)’.
• We will use the notion of ecological surplus/deficit with great care. For sustainable
7
This could be taken to imply that the total global highly productive and marginal lands are equally distributed to all global citizens.
8 ‘Net’ self-sufficiency here indicates that more land is used by country than is available within its national
borders.
9 Among the industrialised countries, for instance, large countries with a low population density have an
ecological surplus (e.g. Canada) – while small countries with a high population density (but comparable consumption patterns) have a considerable ecological deficit (e.g. the Netherlands).
development, comparison of the per capita EF with the average available land at the
global scale is more meaningful.
• In this study, we concentrate on land use based on local yields. In addition, land use based on global yields is shown as a reference in international comparison and to show the differences in results.
• Wackernagel et al. (1997) also include consumption of fish in the EF. By doing so, the EF captures an important source of human food, which was left out before. However, again a weighting factor has to be introduced to avoid that relatively unproductive sea hectares lead to a relatively high EF for fish consuming countries. We have, therefore, decided not to include fish in our assessment.
3.
The calculation method
3.1 General structure
The methodology is based on Wackernagel and Rees (1996) and Wackernagel et al. (1997). However, we introduced some changes in the methodology on the basis of the discussion in
Chapter 2. The most fundamental differences are indicated in Section 3.5.
Figure 3.1: The components of the Ecological Footprint (differences in focus between Wackernagel and Rees and this report are indicated)
In our calculations, we focus at two main categories of resource:
1) the EF for land - subdivided into arable land / pastures, forest and built-up area - and 2) the ecological footprint for carbon dioxide emissions.
These elements can be aggregated into one single indicator following the definitions of Wackernagel and Rees. However, as argued before, this introduces a virtual land use category and includes an implicit valuation of different type of resources.
We have calculated the EF for three years: 1980, 1987 and 1994. In the sections below, we will discuss the methodology for the different aspects of the EF. More details are included in an separate annex (to be obtained from the authors).
Ecological Footprint (Wackernagel and Rees)
EF for actual land use EF for CO2 emissions
land use due to consumption
built-up land fossil energy use of crops, wood and animal
products.
Land use component: Recalculating data on basis of global average yields and equivalance factors.
Energy component: Estimate required sequestration forest. b. b. EF W&R EF this article Domestic resource use
Gross resource use Resource use
for imports
Resource use for exports
+ +
- Net resource use fordomestic consumption
EF + b. E E E
3.2 Land use due to consumption of food and wood products
Calculation method
Land use for domestic consumption has been calculated by determining land use for consumption due to imports, domestic land use and subtracting land use for exports. A simplified equation for our calculations is indicated, see Eq. (1). For some product categories calculation schemes were more complex, as these products are further processed (e.g. wheat into bread). In that case, also imports and exports of manufactured products have to be taken into account.
For yields, see Eq. (1), in principle real, local yields were used – thus domestic yields for domestic production and the yields of the country of origin for imports of products. In many cases, however, the origin of exports were unknown and global average yields per hectare have been used for imported products. Sometimes, global average yields were used when domestic yields were unavailable. Finally, we have also calculated land use based completely on global average yields as a reference.
land use prod
yield import yield export yield dom c dom c c imp c c c _ , , , exp, = + + (1)
Note: In Eq. 1 land_use is net real land use in hectares; c the different production categories, so that
prod, import and export are domestic production and imports and exports, respectively, in tons per year; yielddom is the domestic yield in tonnes per ha. per year and yieldexp and yieldimp the yields that
can be attributed to imports and exports. In most cases, the former has been set equal to domestic yields (except for re-exports) and the latter to the yields of the region from which products are imported; if unknown, global average yields were used.
Table 3.1: Main product groups
Categories Main product groups used in calculations
Cereals wheat (inc. flour) (1), rice (2)., maize (3)., barley (4.), other coarse grains (5). Fruit citrus fruit (including tropical fruit) (6.), bananas (7), other fruit (8).
Meat and other animal products1
cattle meat (including horse meat) (9)., milk (total fresh milk) (10), sheep and goat meat (11.), pig meat (12.), poultry (13.), eggs (total eggs) (14.)
Oil-bearing crops & derived products
oil crops (15.) tree nuts (16.), vegetable oils (17.), cakes (18.)
Pulses pulses, total (19.)
Roots & tubers potatoes (20.), yams (21.), cassava (22.), other roots & tubers (23.) Stimulants cacao beans (24.), coffee (25.), tea (26), tobacco (27.)
Sugar crops & sugar sugar cane/sugar beets (28.), sugar, total (29.) Vegetables vegetables, total (30)
Wood1 wood for charcoal (31.), industrial round wood (32.), imports of wood products (33.), pulp, paper and paperboard (34.)
Other products diverse products (rubber, cotton) (35.)
Note: The number of the main product groups corresponds with the numbers used in the separate
Previous calculations have shown that the two most important land use categories are meat and wood (see for instance Table 2.3). Unfortunately, calculations for these products are relatively complicated due to production of various products in different processing stages. Conversion factors have been used to account land use to the imports and exports of different sub-products.
A total number of 35 main product groups have been used as indicated in Table 3.1. They are assumed to represent the total consumption of agricultural products and wood products. The chosen product groups are based on large differences between the yields per hectare, the relative importance in terms of land use and the availability of data.
Data sources
The data used in this study have been mainly taken from the statistics of the United Nations’ Food and Agricultural Organisation (FAO, 1995 -1998), assuming that this would make the results more comparable between countries. We have compared these data, if available, with data from national sources (mainly from statistical offices of the countries involved). In most cases the different sources did match well; if not, we have used those considered to be most reliable on the basis of available information (as described in detail in the separate Annex). For animal and wood products in Netherlands, more data was needed than available from FAO; so, more national data have been used (e.g. CBS, 1994-1996).
The FAO database is compiled by FAO on the basis of national data. When no data are available, the FAO-database includes estimates based on expert judgement and modelling. For the Netherlands and Costa Rica more reliable and detailed information are available than for Bhutan and Benin.
3.3 Built-up area
Built-up area includes land use for housing and infrastructure (airports, industrial sites and roads). The data in this report refer only to domestic land use of built-up area (no account is taken of land use outside national borders, e.g. for tourism). Data for built-up area were difficult to obtain and have been selected from various sources:
• For Benin built-up area per capita of Nigeria has been used (Wackernagel and Rees, 1997a);
• For Bhutan, national data for 1994 have been used (Chhewang Rinzin, 1997);
• For Costa Rica, national data for 1979 and 1992 have been used (Orozco and Acuña, 1997);
• The Netherlands, national data for 1980, 1987 and 1994 have been used (CBS, 1994).
For Benin and Bhutan, domestic land use has been assumed to grow along with the size of the population. It should be noted that this type of land use is relatively small, in comparison to other forms of land use.
3.4 Carbon dioxide emissions
The calculation method
Carbon dioxide emissions were - in principle - accounted for in a similar way as for land use as indicated in Figure 3.2. For the 1985-1994 period for the Netherlands, earlier calculations by RIVM and Statistics Netherlands (RIVM, 1998) were used, in which the EF for carbon dioxide emissions was assessed on the basis of: 1) consumption statistics, 2) energy intensities per product and 3) types of energy consumed. For 1980, we have estimated net carbon dioxide emissions on the basis of normal carbon dioxide emissions statistics and trends in the 1985-1997 period.
Domestic carbon dioxide emissions Carbon dioxide emissionsfor domestic consumption Carbon dioxide
emissions for imports
Carbon dioxide emissions for exports
+
+
-Virtual land use for absorption of carbon dioxide
Figure 3.2: Overall methodology for carbon dioxide calculations
Domestic carbon dioxide emissions in Benin, Bhutan and Costa Rica have been calculated using energy consumption statistics as collected by Van Vuuren and De Kruijf (1998). For carbon dioxide emissions related to net imports of manufactured goods in Costa Rica, we have used the results of Wackernagel et al. (1997). For Bhutan and Benin, we have used statistics from the United Nations Trade Statistics (UN, 1983, 1990 and 1995). However, we only used them to get a very rough indication as we considered available statistics and energy intensities (which have been determined for industrialised countries only) to be insufficiently reliable to calculate the size of these emissions - and thus only used domestic emissions.
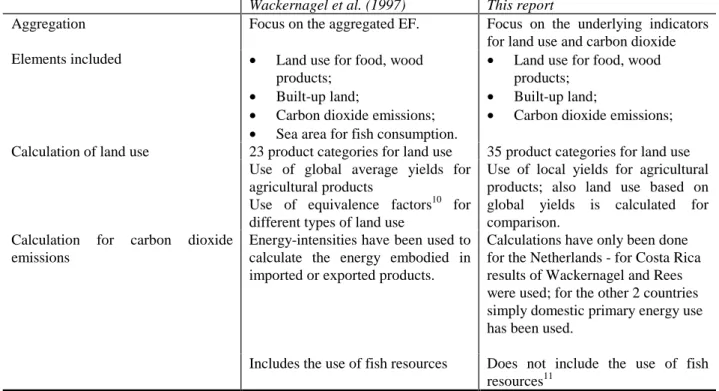
3.5 Differences between the original method and this report
Table 3.2 summarises the most important differences between the calculation method of
Wackernagel and Rees and the calculations described in this report.
Table 3.2: Differences between the methodology of Wackernagel et al. (1997) and the methodology in this report
Wackernagel et al. (1997) This report
Aggregation Focus on the aggregated EF. Focus on the underlying indicators for land use and carbon dioxide Elements included • Land use for food, wood
products;
• Built-up land;
• Carbon dioxide emissions;
• Sea area for fish consumption.
• Land use for food, wood products;
• Built-up land;
• Carbon dioxide emissions; Calculation of land use 23 product categories for land use 35 product categories for land use
Use of global average yields for agricultural products
Use of equivalence factors10 for different types of land use
Use of local yields for agricultural products; also land use based on global yields is calculated for comparison.
Calculation for carbon dioxide emissions
Energy-intensities have been used to calculate the energy embodied in imported or exported products.
Calculations have only been done for the Netherlands - for Costa Rica results of Wackernagel and Rees were used; for the other 2 countries simply domestic primary energy use has been used.
Includes the use of fish resources Does not include the use of fish resources11
10
Wackernagel et al. (1997) realise that not all land is equally productive and that the impacts of current land use can be different with regard to future potential of this land. Therefore they multiply their main categories of land use by so-called equivalence factors (for pasture land, forest land, cropland and built-up areas: 0.54, 1.14, 2.82 and 2.82, respectively). These factors are chosen so that on the global scale total land use still equals total available land. The equivalence factors do not deal with large differences in productivity within the land use types. We have decided not to include any equivalence factors, since we intended to assess the real amount of land used by each country.
11 The reason not to include fish is that we did not like to mix up the sea and land - this, again, requires
weighting factors. This means that for countries where fish is an important of the food consumption, the EF will be typically lower.
4.
Ecological Footprint for land use
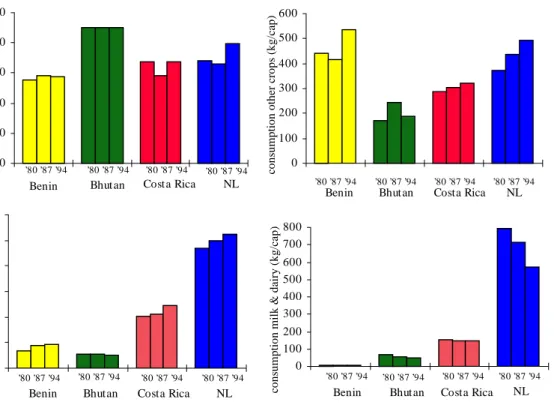
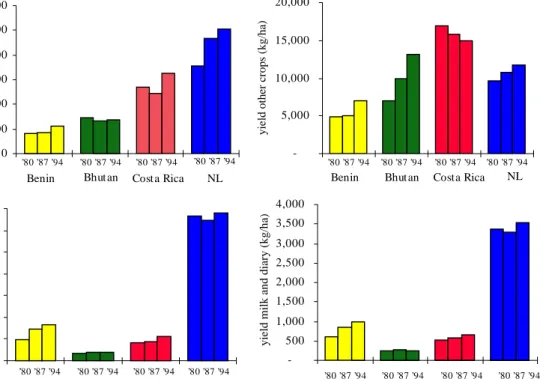
4.1 Land use for consumption of agricultural products
Land use for (per capita) consumption of agricultural products can be related to the following three factors:
• consumption levels,
• yields and production methods (both domestically as for imports),
• type of consumption (some production require much more land than others).
These factors are discussed in the next sections.
4.1.1 Consumption levels
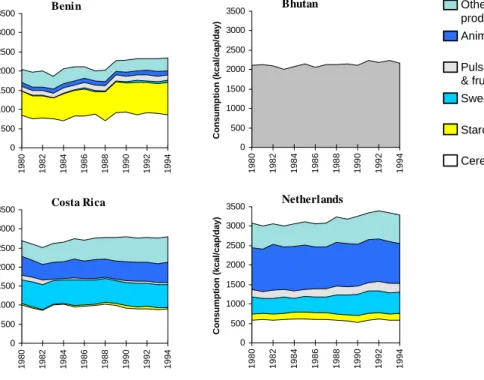
Figure 4.1 shows the consumption in the four countries in terms of calories intake per capita
per day. The data refer to direct human consumption (FAO, 1998). It should be noted that not all agricultural products are directly used for human consumption; some products are processed further, part of the harvests is used as seed, another part is used as animal feed and, finally, part of the consumption is simply wasted.
Figure 4.1 shows that between 1980 and 1994 the consumption per capita increased in all
four countries. The Netherlands have by far the largest average consumption, ca. 3000 kcal per day, which is about 1.5 times the critical level of 2100 kcal per person per day (FAO, 1996). In Costa Rica, average intake per capita is circa 600 kcal above the critical level, while in Benin and Bhutan the average intake is only slightly higher than the critical level. In Benin, occasional malnutrition occurs (partially due to seasonal availability of agricultural products). In the Netherlands, the share of animal products in total consumption is much higher than in
0 500 1000 1500 2000 2500 3000 3500 1980 1982 1984 1986 1988 1990 1992 1994 C ons um pt ion ( k c a l/c a p /da y ) Benin 0 500 1000 1500 2000 2500 3000 3500 1980 1982 1984 1986 1988 1990 1992 1994 C ons um pt ion ( k c a l/ c a p /d a y ) Bhutan Other vegetable products Animal products Pulses, vegetables & fruit Sweeteners Starchy roots
Cereals ex. beer
0 500 1000 1500 2000 2500 3000 3500 1980 1982 1984 1986 1988 1990 1992 1994 C ons um pt ion ( k c a l/c a p /da y ) Costa Rica 0 500 1000 1500 2000 2500 3000 3500 1980 1982 1984 1986 1988 1990 1992 1994 C ons um pt ion ( k c a l/ c a p /d a y ) Netherlands
Figure 4.1: Direct consumption of agricultural products