Dit is een uitgave van:
Rijksinstituut voor Volksgezondheid en Milieu
Postbus 1 | 3720 ba bilthoven www.rivm.nl
Environmental risk limits for chrysene
RIVM Letter report 601357008/2011 E.M.J. Verbruggen| R. van Herwijnen
Colofon
© RIVM 2011
Parts of this publication may be reproduced, provided acknowledgement is given to the 'National Institute for Public Health and the
Environment', along with the title and year of publication.
E.M.J. Verbruggen
R. van Herwijnen
Contact:
R. van Herwijnen
Expertise Centre for Substances
rene.van.herwijnen@rivm.nl
This investigation has been performed by order and for the account of Directorate-General for Environmental Protection, Directorate
Environmental Safety and Risk Management, within the framework of the project 'International and National Environmental Quality Standards for Substances in the Netherlands' (INS)
Abstract
Environmental risk limits for chrysene
RIVM has derived environmental risk limits (ERLs) for chrysene. This derivation has been performed because the current ERLs have not been derived according to the current valid methodology. Chrysene is a substance belonging to the group of PAHs and is included in the Dutch decree on water quality objectives in the context of the Water
Framework Directive (WFD). The ERLs in this report are advisory values that serve as a scientific background for the Dutch Steering Committee for Substances, which is responsible for setting those standards.
The maximum permissible concentration in water (MPCwater) is the level at which no harmful effects are expected, based on annual
concentrations. This MPC is based on three routes: direct toxicity, secondary poisoning and consumption of fish by humans. The latter of the three routes is the most critical of these three routes and
determines the overall MPC for fresh- and saltwater (1.2 nanogram per liter). The Maximum Acceptable Concentration (MACwater, eco), that protects the ecosystem from effects of short term concentration peaks, is 0.07 microgram per liter for freshwater and 0.007 microgram per liter for saltwater.
The newly derived ERLs for water and suspended matter are lower than the currently valid ERLs. This can be explained by the fact that the risk through exposure of humans by consumption of fish and exposure of birds and mammals by consumption of water animals have been considered for these new ERLs. Monitoring data indicate that the new MPC and MACeco for water, suspended matter and sediment are being exceeded. In this observation, mixture toxicity for the total of PAHs has not been included.
Trefwoorden / Key words:
environmenal quality standard, chrysene, maximum permissible concentration, negligible concentration
Rapport in het kort
Milieurisicogrenzen voor chryseen
Het RIVM heeft in opdracht van het ministerie van Infrastructuur en Milieu (I&M), milieurisicogrenzen voor chryseen bepaald. Dit was nodig omdat de huidige norm voor chryseen voor waterkwaliteit niet is afgeleid volgens de meest recente methodiek. Chryseen is een stof die behoort tot de stofgroep PAK’s. De stof is opgenomen in de Regeling Monitoring Kader Richtlijn Water, waarin staat aan welke eisen oppervlaktewater in Nederland moet voldoen. De Stuurgroep Stoffen stelt deze nieuwe normen vast op basis van de wetenschappelijke advieswaarden in dit rapport.
Het Maximaal Toelaatbaar Risiconiveau (MTR) is de concentratie in water waarbij geen schadelijke effecten te verwachten zijn, gebaseerd op jaargemiddelde concentraties. Hiervoor zijn drie routes onderzocht: directe effecten op waterorganismen, indirecte effecten op vogels en zoogdieren via het eten van prooidieren, en indirecte effecten op mensen via het eten van vis. De laatste van de drie levert de laagste waarde en bepaalt daarmee het MTR voor zoet- en zoutwater
(1,2 nanogram per liter). De Maximaal Aanvaardbare Concentratie (MACwater, eco), die het ecosysteem beschermt tegen kortdurende concentratiepieken, is 0,07 microgram per liter voor zoetwater en 0,007 microgram per liter voor zoutwater.
De nieuw afgeleide milieurisicogrenzen voor water en in water zwevend stof zijn lager dan de nu geldende milieurisicogrenzen. Dit kan direct worden verklaard doordat consumptie van waterdieren door vogels and zoogdieren en menselijke visconsumptie in de nieuwe norm zijn
meegewogen. Gebaseerd op monitoringsgegevens worden de nieuwe MTR en MACeco voor water, zwevend stof en sediment naar verwachting overschreden. Bij deze beoordeling is mengseltoxiciteit voor het totaal aantal PAK’s nog niet in beschouwing genomen.
Trefwoorden / Key words:
milieukwaliteitsnormen, milieurisicogrenzen, chryseen, maximaal toelaatbaar risiconiveau, verwaarloosbaar risiconiveau
Contents
Summary—9 1 Introduction—11 1.1 Project framework—11 1.2 Current MPCs—12 1.3 Use of chrysene—12 1.4 Methodology—121.5 Status of the results—14
2 Substance properties, fate, human toxicology and trigger values—15
2.1 Identity—15
2.2 Physicochemical properties—15
2.3 Bioconcentration and biomagnification—15
2.4 Human toxicological threshold limits and carcinogenicity—17 2.5 Trigger values—17
3 Toxicity data and derivation of ERLs for water—19
3.1 Toxicity data—19
3.2 Treatment of fresh- and saltwater toxicity data—19 3.3 Derivation of MPCfw and MPCsw—19
3.4 Derivation of MPCdw, hh—21 3.5 Derivation of MACeco—21 3.6 Derivation of NC—21
3.7 Derivation of SRCwater, eco—21 3.8 Lipid approach—21
4 Toxicity data and derivation of ERLs for sediment—23
4.1 Toxicity data—23
4.2 Derivation of MPCsediment—23 4.3 Derivation of NCsediment—23 4.4 Derivation of SRCsediment, eco—23 4.5 Lipid approach—23
5 Toxicity data and derivation of ERLs for soil—25
5.1 Toxicity data—25 5.2 Derivation of MPCsoil—25 5.3 Derivation of NCsoil—25 5.4 Derivation of SRCsoil, eco—25 5.5 Lipid approach—26
6 Derivation of ERLs for groundwater—27
6.1 Derivation of MPCgw—27 6.2 Derivation of NCgw—27 6.3 Derivation of SRCeco, gw—27
7 Derivation of ERLs for air—29
7.1 Derivation of MPCair—29 7.2 Derivation of NCair—29
9 Conclusions—35 References—37
Summary
Environmental risk limits are derived using ecotoxicological, physicochemical, and human toxicological data. They represent
environmental concentrations of a substance offering different levels of protection to man and ecosystems. It should be noted that the ERLs are scientifically derived values. They serve as advisory values for the Dutch Steering Committee for Substances, which is appointed to set the Environmental Quality Standards (EQSs) from these ERLs. ERLs should thus be considered as preliminary values that do not have an official status.
This report contains ERLs for chrysene in water, groundwater, sediment, soil and air. The following ERLs are derived: Negligible Concentration (NC), Maximum Permissible Concentration (MPC), Maximum Acceptable Concentration for ecosystems (MACeco), and Serious Risk Concentration for ecosystems (SRCeco). The risk limits were mostly based on data presented in the RIVM report “Environmental risk limits for polycyclic aromatic hydrocarbons (PAHs)” (Verbruggen, in prep.).
For the derivation of the MPC and MACeco for water and sediment, the methodology used is in accordance with the Water Framework
Directive. For the derivation of ERLs for air, no specific guidance is available. However, as much as possible the basic principles underpinning the ERL derivation for the other compartments are followed for the derivation of atmospheric ERL. For the MPCs for soil, and the NCs and the SRCseco in general, the guidance developed for the project ‘International and National Environmental Quality Standards for Substances in the Netherlands’ was used (Van Vlaardingen and
Verbruggen, 2007). An overview of the derived environmental risk limits is given in Table 1. The newly derived ERLs are lower than the current EQSs, in which the routes secondary poisoning and fish consumption were not included.
Monitoring data for chrysene suggests that currently the MPCfw, the MPCsusp, fw and the MPCsusp, sw derived in this report are likely to be exceeded in the Dutch surface waters. Also, the MPCsediment, fw could be exceeded in some cases and the NCsediment, fw is likely to be exceeded in many cases. For this observation, the additive mixture toxicity for all PAHs has not been taken into account.
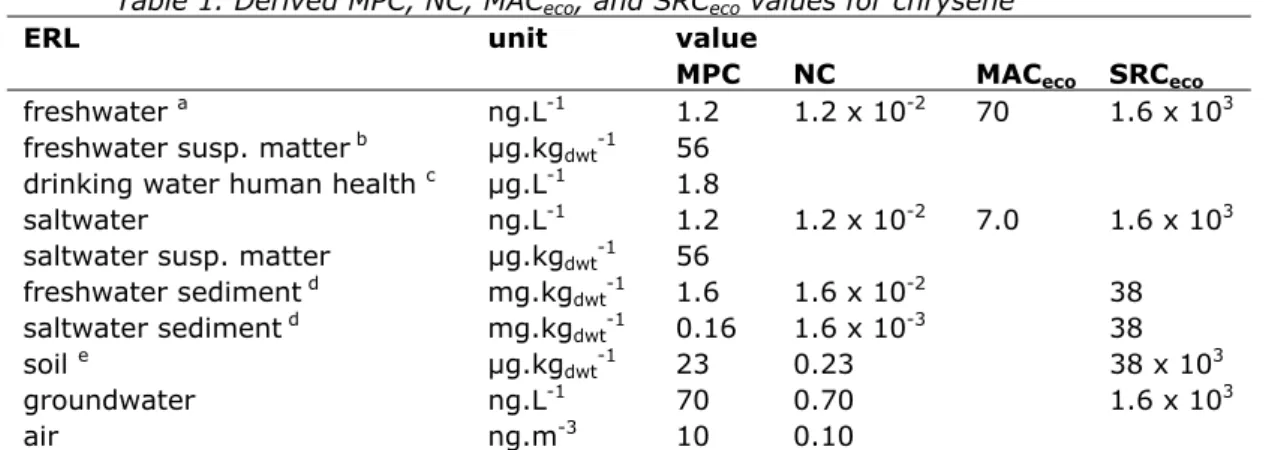
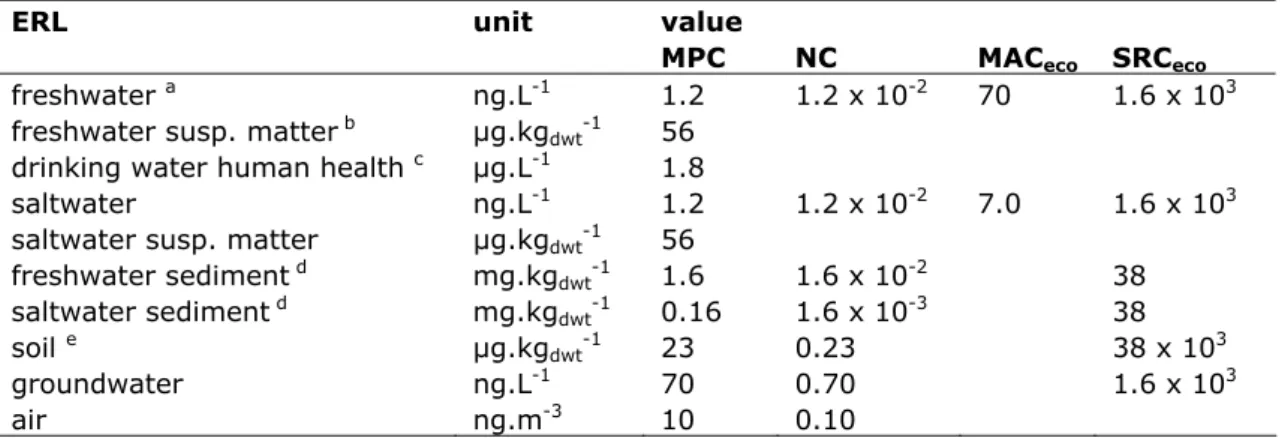
Table 1. Derived MPC, NC, MACeco, and SRCeco values for chrysene
ERL unit value
MPC NC MACeco SRCeco
freshwater a ng.L-1 1.2 1.2 x 10⁻² 70 1.6 x 10³
freshwater susp. matter b µg.kg
dwt-1 56
drinking water human health c µg.L-1 1.8
saltwater ng.L-1 1.2 1.2 x 10⁻² 7.0 1.6 x 10³
saltwater susp. matter µg.kgdwt-1 56 freshwater sediment d mg.kg dwt-1 1.6 1.6 x 10⁻² 38 saltwater sediment d mg.kg dwt-1 0.16 1.6 x 10⁻³ 38 soil e µg.kg dwt-1 23 0.23 38 x 103 groundwater ng.L-1 70 0.70 1.6 x 10³ air ng.m-3 10 0.10
a From the MPCfw, eco, MPCfw, secpois and MPCfw, hh food the lowest one is selected as the ‘overall’ MPCwater.
b Expressed on the basis of Dutch standard suspended matter.
c As stated in the new WFD guidance, the MPCdw, hh is not included in the selection of the final MPCfw. Therefore, the MPCdw, hh is presented as a separate value in this report.
d Expressed on the basis of Dutch standard sediment. e Expressed on the basis of Dutch standard soil. n.d. = not derived.
1
Introduction
1.1 Project framework
In this report environmental risk limits (ERLs) for surface water (freshwater and saltwater), soil, groundwater and air are derived for chrysene. Chrysene is listed in the Dutch decree on WFD-monitoring (Regeling monitoring Kaderrichtlijn water) as a specific pollutant. The aim of this report is to present updated risk limits that can be used to set water quality standards in accordance with the WFD. Chrysene is relevant for other compartments as well, therefore, ERLs for soil and air have also been derived. MPCs for direct ecotoxicity have already been derived by Verbruggen (in prep.). Additional ERLs, including those considering secondary poisoning and human health through fish consumption, are derived in this report. The derivation of the ERLs is performed in the context of the project National Policy on Substances. The following ERLs are considered:
- Maximum Permissible Concentration (MPC) – defined in VROM (1999, 2004) as the standard based on scientific data which indicates the concentration in an environmental compartment for which:
1 no effect to be rated as negative is to be expected for ecosystems;
2a no effect to be rated as negative is to be expected for humans (for non-carcinogenic substances);
2b for humans no more than a probability of 10-6 per year of death can be calculated (for carcinogenic substances). Within the scope of the Water Framework Directive (WFD), a probability of 10-6 on a life-time basis is used.
The MPCs for water and soil should not result in risks due to secondary poisoning (considered as part of the ecosystem in the definition above) and/or risks for human health aspects. These aspects are therefore also addressed in the MPC derivation. Separate MPC-values are derived for the freshwater and saltwater environment.
- Negligible Concentration (NC) – the concentration at which effects to ecosystems are expected to be negligible and functional properties of ecosystems are safeguarded fully. It defines a safety margin which should exclude combination toxicity. The NC is derived by dividing the MPC by a factor of 100.
- Maximum Acceptable Concentration (MACeco) for aquatic ecosystems – the concentration protecting aquatic ecosystems from effects due to short-term exposure or concentration peaks. The MACeco is derived for freshwater and saltwater ecosystems.
- Serious Risk Concentration for ecosystems (SRCeco) – the concentration at which possibly serious ecotoxicological effects are to be expected. This value should be compared with the Serious Risk Concentration for humans (SRChuman), which is not derived elsewhere (Lijzen et al., 2001).
- Maximum Permissible Concentration for surface water that is used for drinking water abstraction (MPCdw, hh). This is the concentration in surface water that meets the requirements for use of surface water for drinking
water production. The MPCdw, hh specifically refers to locations that are used for drinking water abstraction.
The quality standards in the context of the WFD refer to the absence of any impact on community structure of aquatic ecosystems. Hence, not the potential to recover after transient exposure, but long-term undisturbed function is the protection objective under the WFD. Recovery in a test situation, after a limited exposure time, is therefore not included in the derivation of the MPC and MAC.
1.2 Current MPCs
The current MPCs for chrysene are 0.9 µg.L-1 for water-total, 0.03 µg.L-1 for water-dissolved, 22 mg.kgdwt-1 for suspended matter and 11 mg.kgdwt-1 for sediment. The derivation of these values is reported by Kalf et al. (1995). For air there is an indicative MPC of 0.255 ng.m-3. Derivation of this value is described by Hansler et al. (2008).
1.3 Sources of chrysene
There is no production of chrysene as a pure product. Chrysene, like most other polycyclic aromatic hydrocarbons (PAHs), is however present in fossil fuels and derived products; human use of these products is one of the main source of chrysene in the environment. Other important anthropogenic sources are industrial processes, such as iron steel works, coke manufacturing, asphalt production, wood preservation, ship protection and petroleum cracking. Most of these industries have however improved their processes or reduced or stopped the use of PAH containing products and current emissions are highly reduced as compared to the past. Apart from anthropogenic sources, there are also natural sources like vegetation fires and volcanic emissions.
1.4 Methodology
The methodology for risk limit derivation is described in detail in the INS-guidance document (Van Vlaardingen and Verbruggen, 2007), which is further referred to as the INS-Guidance. The methodology is based on the Technical Guidance Document (TGD), issued by the European Commission and developed in support of the risk assessment of new notified chemical substances, existing substances and biocides (EC, 2003) and on the Manual for the derivation of Environmental Quality Standards in accordance with the Water Framework Directive (Lepper, 2005). The European guidance under the framework of WFD is currently being revised, and the updated guidance has been published recently (EC, 2011). The risk limits in this report will be used for setting water quality standards that will become effective after the new guidance has come in to force. Therefore, the terminology is harmonised as much as possible and the new guidance is followed in the case it deviates from the INS-guidance. This specifically applies to the derivation of the MAC (see section 3.5), for which the new methodology is used. This also holds for the MPC for surface waters
intended for the abstraction of drinking water (MPCdw, hh, see section 3.4). In the INS-guidance, this is one of the MPCs from which the lowest value should be selected as the general MPCwater (see section 3.1.6 and 3.1.7 of the INS-Guidance). According to the new guidance, the MPCdw, hh is not taken into account for the derivation of the general MPCwater, but specifically refers to locations that are used for drinking water abstraction. For the derivation of ERLs for air, no specific guidance is available. However, as much as possible, the basic principles underpinning the ERL derivation for the other compartments are followed for the derivation of an atmospheric ERL.
1.4.1 Data sources
The RIVM report “Environmental risk limits for polycyclic aromatic hydrocarbons (PAHs)” (Verbruggen, in prep.) is used as the source of physicochemical and (eco)toxicity data. Information given in this report is checked thoroughly and approved by the scientific committee of the project 'International and National Environmental Quality Standards for Substances in the Netherlands' (INS). Therefore, no additional evaluation of data is performed for the ERL derivation. Only valid data combined in an aggregated data table are presented in the current report. Occasionally, key studies are discussed when relevant for the derivation of a certain ERL. Since in the report of Verbruggen only ERLs for direct toxicity are reported, the additional ERLs to be derived according to the INS guidance are derived in this report.
1.4.2 Data evaluation
Ecotoxicity studies were screened for relevant endpoints (i.e. those endpoints that have consequences at the population level of the test species) and thoroughly evaluated with respect to the validity (scientific reliability) of the study. A detailed description of the evaluation procedure is given in section 2.2.2 and 2.3.2 of the INS-Guidance and in the Annex to the draft EQS-guidance under the WFD. In short, the following reliability indices were assigned, based on Klimisch et al. (Klimisch et al., 1997):
Ri 1: Reliable without restriction
’Studies or data … generated according to generally valid and/or internationally accepted testing guidelines (preferably performed according to GLP) or in which the test parameters documented are based on a specific (national) testing guideline … or in which all parameters described are closely related/comparable to a guideline method.’
Ri 2: Reliable with restrictions
’Studies or data … (mostly not performed according to GLP), in which the test parameters documented do not totally comply with the specific testing guideline, but are sufficient to accept the data or in which investigations are described which cannot be subsumed under a testing guideline, but which are nevertheless well documented and scientifically acceptable.’
Ri 3: Not reliable
’Studies or data … in which there are interferences between the measuring system and the test substance or in which organisms/test systems were used which are not relevant in relation to the exposure (e.g., unphysiologic pathways of application) or which were carried out or generated according to a method which is not acceptable, the documentation of which is not sufficient for an assessment and which is not convincing for an expert judgment.’
Ri 4: Not assignable
’Studies or data … which do not give sufficient experimental details and which are only listed in short abstracts or secondary literature (books, reviews, etc.).’
Citations
In case of (self-)citations, the original (or first cited) value is considered for further assessment, and an asterisk is added to the Ri of the endpoint that is cited.
All available studies are summarised in data-tables that are included as Annexes to this report. These tables contain information on species characteristics, test conditions and endpoints. Explanatory notes are included with respect to the assignment of the reliability indices. In the aggregated data table only one effect value per species is presented. When for a species several effect data are available, the geometric mean of multiple values for the same endpoint is calculated where possible. Subsequently, when several endpoints are available for one species, the lowest of these endpoints (per species) is reported in the aggregated data table.
1.5 Status of the results
The results presented in this report have been discussed by the members of the scientific advisory group for the INS-project (WK-INS). It should be noted that the ERLs in this report are scientifically derived values, based on
(eco)toxicological, fate and physicochemical data. They serve as advisory values for the Dutch Steering Committee for Substances, which is appointed to set the Environmental Quality Standards (EQSs). ERLs should thus be considered as advisory values that do not have an official status.
2
Substance properties, fate, human toxicology and trigger
values
2.1 Identity
Figure 1. Structural formula of chrysene Table 2. Identification of chrysene
Parameter Name or number
Chemical name Chrysene
Common/trivial/other name Chrysene
CAS number 218-01-9
EC number 205-923-4
Molecular formula: C18H12
SMILES code c12ccccc1ccc3c4ccccc4ccc23
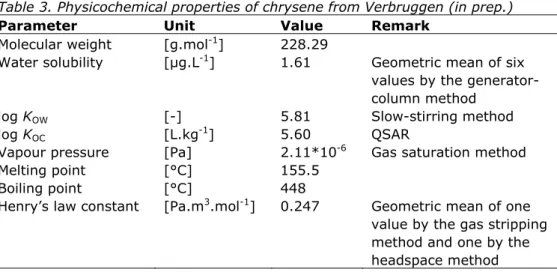
2.2 Physicochemical properties
Table 3. Physicochemical properties of chrysene from Verbruggen (in prep.)
Parameter Unit Value Remark
Molecular weight [g.mol-1] 228.29
Water solubility [µg.L-1] 1.61 Geometric mean of six values by the generator-column method
log KOW [-] 5.81 Slow-stirring method
log KOC [L.kg-1] 5.60 QSAR
Vapour pressure [Pa] 2.11*10-6 Gas saturation method
Melting point [°C] 155.5
Boiling point [°C] 448
Henry’s law constant [Pa.m3.mol-1] 0.247 Geometric mean of one value by the gas stripping method and one by the headspace method
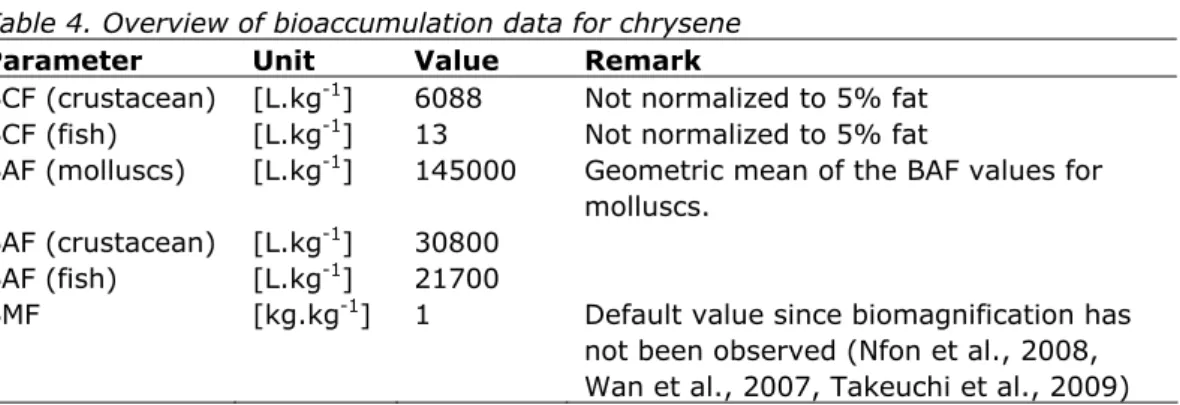
2.3 Bioconcentration and biomagnification
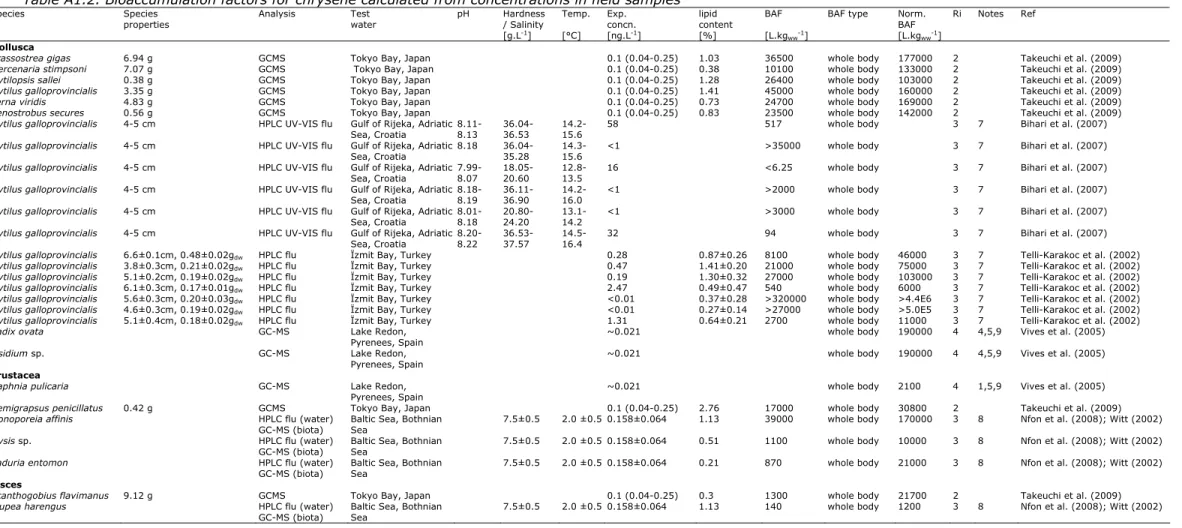
Bioconcentration data (based on lab studies) and bioaccumulation data (based on field studies) for chrysene are given in Table 4. The data in this table are based on studies reviewed by Bleeker and Verbruggen (2009) according to the Ri classification of Klimisch et al. (1997) and considered reliable (Ri1 or 2). These data are supplemented with a few additional studies from the public literature which were published after publication of Bleeker and Verbruggen (2009) or were not considered relevant for that report. A full overview of these studies is given in Appendix 1.
Table 4. Overview of bioaccumulation data for chrysene
Parameter Unit Value Remark
BCF (crustacean) [L.kg-1] 6088 Not normalized to 5% fat BCF (fish) [L.kg-1] 13 Not normalized to 5% fat
BAF (molluscs) [L.kg-1] 145000 Geometric mean of the BAF values for molluscs.
BAF (crustacean) [L.kg-1] 30800 BAF (fish) [L.kg-1] 21700
BMF [kg.kg-1] 1 Default value since biomagnification has not been observed (Nfon et al., 2008, Wan et al., 2007, Takeuchi et al., 2009)
BCFs are only available for crustaceans and fish. In addition BAFs are available. These BAFs (derived from field samples) indicate that the BCFs (derived from laboratory studies) are most likely underestimating bioaccumulation in the field. For example, the BCF for fish is very low compared to the BCFs for crustacean while this difference is smaller for the BAFs. The BAF values for whole animals presented in Appendix 1 show a difference of only a factor 1.4 between crustaceans and fish. This difference does not support the observations of the lab studies in Table 4 and suggests that the low BCF for the fish is
underestimating the BAF in the field. In the original report (Hooftman and Evers-de Ruiter, 1992), the low BCF value is explained by metabolism to more polar metabolites and subsequent depuration. However, given the lifestage tested (embryo-larval), this is not very likely as young fish are known to have less metabolic capacities than juvenile and adult fish. The value of 13 L.kg-1 should therefore be considered as an outlier.
These findings are supported by three trophic magnification studies, in which both molluscs and/or crustaceans and fish were included. In all three studies there appeared to be a dilution with trophic level. TMF values on lipid weight basis calculated from the studies were higly consistent (0.26 in Bohai Bay, North China (Wan et al., 2007); 0.23 in the Bothnian Gulf, Baltic Sea (Nfon et al., 2008); 0.22 in Tokyo Bay (Takeuchi et al., 2009)). Because the difference between the species from these taxa is less than two trophic levels, the difference in BAF values is at most a factor of 20.
Therefore, the BAF data will be used in the calculation of the MPCs for secondary poisoning of mammals and birds (MPCfw, secpois and MPCsw, secpois) and the MPC for human food consumption (MPCwater, hh food) that are triggered in Section 2.5.
When deciding which BAF should be used for calculation of the MPCfw, secpois MPCsw, secpois and the MPCwater, hh food, it should be considered that humans have a much more selective food choice (fishery products) than mammals and birds, for which diets can vary considerably amongst different species. Therefore different BAFs should be used when deriving the different MPCs.
Therefore, the BAF to be used to calculate the MPCwater, hh food should be based on a human food consumption pattern. The human food consumption pattern used to determine the BAF is based on the Dutch food consumption survey for 1998 (Anonymous, 1998). The relative consumption of fish, molluscs and crustacean is 90% : 7% : 3% for fish: molluscs: crustacean. On the basis of this relative consumption, a weighted average is calculated from the BAFs for fish, molluscs and the crustacean that is suitable for human consumption.
The calculated BAF is: 26000 L.kg-1, based on a geometric mean value for molluscs and other BAF values normalized to 5% lipids. It should be noted that this approach is not the most conservative. A person having an equal daily consumption of molluscs only might not be protected by this BAF. On the other
hand, the derivation of the MPCwater, hh food is already precautionary for the general Dutch population, because of the relatively high daily intake (115 g fishery prodcucts) and the fact that the contribution of the consumption of fishery products to the total daily exposure is only 10%. Therefore, a large risk for such a person is considered unlikely.
For the BAF to calculate the MPCfw, secpois, it is presumed that some predatory species have strong preference for one of the three groups (fish, crustaceans, molluscs) for their diet. The selected BAF for the MPCfw, secpois is the highest of these three groups and is the geometric mean of the BAF values for molluscs, normalized to 5% lipids, which is 145000 L.kg-1.
2.4 Human toxicological threshold limits and carcinogenicity
Chrysene has been classified in EU framework with the R phrases R45, R68 and R50-53. The U.S. EPA (IRIS) concluded that chrysene is probably a human carcinogen. RIVM concluded that chrysene is a suspected carcinogen and has derived a human toxicological limit of 0.050 mg.kgbw-1.day-1. This value is based on a cancer risk of 10-4 per lifetime for non-treshold toxicity (Baars et al., 2001). As this risk under the WFD is 10-6 per lifetime (a factor of 100 lower) (Lepper, 2005, Van Vlaardingen and Verbruggen, 2007), this value should be divided by 100. Therefore, in this report a risk limit for human health (TLhh) of
0.50 µg.kgbw-1.day-1 is used.
For inhalation toxicity, no individual TCA (Tolerable Concentration in Air) is available for chrysene. A limit value of 0.01 ng.m-3 has been proposed by the EU working group on PAHs (EC, 2001) for a lifetime exposure risk of 10-6 for
benzo[a]pyrene (BaP) as indicator for the total PAHs and this value has been adopted in EU legislation (EU, 2004). To obtain a limit value for benzo[a]pyrene as an individual substance, the limit value can be increased with a factor 10 (a factor that is used to estimate the risk of total PAHs on the risk of BaP only) to 0.1 ng.m-3. TCAs for other PAHs can be derived from this value on the basis of their relative carcinogenic potency. The relative carcinogenic potency of
chrysene is set at 0.01 (Baars et al., 2001). With this value the TCA for chrysene is 10 ng.m-3.
2.5 Trigger values
This section reports on the trigger values for ERLwater derivation (as demanded in WFD framework) as reported in Verbruggen (in prep.).
Table 5. Chrysene: collected properties for comparison to MPC triggers
Parameter Value Unit Method/Source
Log Kp,susp-water 4.60 [-] KOC × fOC,suspa
BCF 26000 / 145000 b [L.kg-1] BMF 1 [kg.kg-1] Log KOW 5.81 [-] R-phrases 45, 68, 50-53 [-] A1 value n.a. [µg.L-1] DW standard n.a. [µg.L-1]
a fOC,susp = 0.1 kgOC.kgsolid-1 (EC, 2003).
b Different BCF values are given to be used separately for calculation of the MPCwater, hh food and the MPCfw, secpois respectively.
o chrysene has a log Kp, susp-water > 3; derivation of MPCsediment is triggered. o chrysene has a log Kp, susp-water > 3; expression of the MPCwater as
MPCsusp, water is required.
o chrysene has a BCF > 100 L.kg-1; assessment of secondary poisoning is triggered.
o chrysene is classified as R45 (may cause cancer, therefore, an MPCwater for human health via food (fish) consumption (MPCwater, hh food) should be derived.
3
Toxicity data and derivation of ERLs for water
3.1 Toxicity data
The available saltwater and freshwater toxicity data for chrysene as reported by Verbruggen (in prep.) are given in Table 6 and discussed in Section 3.3.1.
Table 6. Chrysene: selected freshwater toxicity data for ERL derivation
Chronica NOEC/EC
10 Acutea L(E)C50
Taxonomic group (µg.L-1) Taxonomic group (µg.L-1)
Algea > water solubility
Crustacea
Daphnia magna 0.7
Fish > water solubility
3.1.1 Mesocosm studies
No mesocosm studies are available.
3.2 Treatment of fresh- and saltwater toxicity data
No comparison between saltwater and freshwater could be made, because of the lack of effects in the majority of the studies. Therefore ERLs for the marine environment will be based on freshwater toxicity data.
3.3 Derivation of MPCfw and MPCsw
3.3.1 MPCfw, eco and MPCsw, eco
The following derivation of the MPCfw, eco and MPCsw, eco is cited from Verbruggen (in prep.).
Reliable chronic toxicity studies were performed with algae (Bisson et al., 2000), daphnids (both Daphnia magna (Hooftman, 1991) and Ceriodaphnia dubia (Bisson et al., 2000)) and fish (Hooftman and Evers-de Ruiter, 1992), but no significant effects were observed for any species in a regular toxicity experiment around or below the aqueous solubility. The only study that showed a
considerable effect of chrysene, was a determination of the median lethal time for neonates of Daphnia magna (Newsted and Giesy, 1987). In this experiment, the daphnids were exposed to one concentration of chrysene (measured
concentration of 0.7 µg.L-1). The test was performed as a static-renewal acute toxicity test. After 24 hours of exposure with a 16:8 light:dark photoperiod, the animals were exposed to UV-light with an intensity of 25 ± 3 µW.cm-2 UV-B (310 ± 36 nm), 120 ± 5 µW.cm-2 UV-A (365 ± 36 nm), and 680 ± 10 µW.cm-2 visible light (400 to 700 nm). The median lethal time after UV-radiation started was 24 hours. Thus, after 48 hours, of which the last 24 hours were with UV radiation, 50% mortality of the daphnids occurred at 0.7 µg.L-1.
For marine species acute toxicity studies were performed with bacteria, annelids and crustaceans. No significant effects at or below the aqueous solubility were observed in any of these toxicity studies as well. Moreover, only one study with the luminescent bacterium species Vibrio fischeri can be considered as reliable (Loibner et al., 2004).
No acute toxicity data for algae and fish are available. However, for algae the EC10 and thus the EC50 for growth of Pseudokirchneriella subcapitata is higher than 1 µg.L-1. Due to the limited solubility of chrysene, no acute effects are
expected for fish either. Besides that, an ELS study with the zebra fish Brachydanio rerio is available. Chronic studies were performed with algae, daphnids (two species) and fish. Therefore an assessment factor of 10 to the lowest NOEC or EC10 can be applied. However, no effects were observed at all, although in the test with Ceriodaphnia dubia the highest tested measured concentration was 0.09 µg.L-1 which means that this species was not tested up to the water solubility of chrysene. The only study with a significant effect below the aqueous solubility was 50% mortality after 48 hours at 0.7 µg.L-1. In this study, toxicity of chrysene was enhanced by irradiation with UV-light, although the intensity was considerably less than natural sunlight. Sunlight or UV-light comparable with sunlight was also used in the case of the lowest effect
concentrations for anthracene and fluoranthene. Similar to these compounds an assessment factor of 10 is applied to the lowest effect concentration. The resulting MPCfw, eco is thus 0.07 µg.L-1. No additional chronic toxicity data for typically marine species are available. Therefore, an assessment factor of 100 will be applied to derive the MPCsw, eco. This MPCsw, eco thus is 0.007 µg.L-1.
The final MPCfw, eco is 0.07 µg.L-1 and the final MPCsw, eco is 0.007 µg.L-1.
3.3.2 MPCfw, secpois and MPCsw, secpois
Chrysene has a BCF > 100 L.kg-1, thus assessment of secondary poisoning is triggered. Therefore toxicological data on birds and mammals should be used to derive an MPCoral, min from which the MPCfw, secpois and MPCsw, secpois can be derived. However no relevant studies with population relevant endpoints for mammals and birds could be found. The EPA ECOTOX Database does contain NOELs for birds and mammals. However, the underlying studies did not examine
population relevant endpoints and/or only applied the PAH in a single dose and mostly only one concentration was tested.
Considering the fact that chrysene is a suspected carcinogen and that the risk of the MPR is 10-6 per lifetime, the MPC
water, hh food is expected to be much more protective than the MPCs for secondary poisoning based on endpoints derived with the threshold approach. Therefore, derivation of the MPCfw, secpois and MPCsw, secpois is not deemed necessary.
3.3.3 MPCwater, hh food
Derivation of MPCwater, hh food for chrysene is triggered (Table 5). This derivation is based on the TLhh of 0.50 µg.kgbw-1.day-1. MPChh, food = 0.1 * 0.50*70/0.115 = 30 µg.kgfood-1. The resulting MPCwater, hh food is then: 30 / (26000*1) =
1.2 x 10⁻³ µg.L-1 = 1.2 ng.L-1.
3.3.4 Selection of the MPCfw and MPCsw
The MPCfw and the MPCsw are determined by the lowest MPCwater derived, this is the MPCwater, hh food. Therefore the MPCfw. and the MPCsw are 1.2 ng.L-1.
Chrysene has a log Kp, susp-water ≥ 3; expression of the MPCwater as MPCsusp, water is required. The MPCsusp, water is calculated according to:
MPCsusp, water = MPCwater, dissolved × Kp, susp-water, Dutch standard
For this calculation, Kp,susp-water,Dutch standard is calculated from the log Koc of 5.6 as given in Table 3. With an fOC,susp, Dutch standard of 0.1176 the Kp, susp-water, Dutch standard can be calculated to 46800 L.kg-1. With this value the MPC
susp, fw and MPCsusp sw are 56 µg.kgdwt-1.
3.4 Derivation of MPCdw, hh
No A1 value and DW standard are available for chrysene. With the TLhh of 0.50 µg.kgbw-1.day-1 an MPCdw, hh, provisional can be calculated with the following formula: MPCdw, hh, provisional = 0.1 x TLhh x BW / uptakedw where the TLhh is the limit for human health, BW is a body weight of 70 kg, and uptakedw is a daily uptake of 2 L. As described in section 2.2 water treatment is currently not taken into account. Therefore the MPCdw, hh = The MPCdw, hh, provisional and becomes: 0.1 x 0.50 x 70 / 2 = 1.8 µg.L-1.
3.5 Derivation of MACeco
The following derivation of the MACeco originates from Verbruggen (in prep.). Because the MPC values are based on an acute study with Daphnia and no further information is available, the MACfw, eco and MACsw, eco are set equal to their corresponding MPC values: 0.07 µg.L-1, and 0.007 µg.L-1 respectively.
3.6 Derivation of NC
Negligible concentrations are derived by dividing the MPCs by a factor 100. This gives an NCfw of 12 pg.L-1 and an NCsw of 12 pg.L-1.
3.7 Derivation of SRCwater, eco
The following derivation of the SRCwater, eco is cited from Verbruggen (in prep.). Because no toxicity was observed up to the solubility in chronic studies, the SRCwater, eco is set equal to the aqueous solubility. The SRCwater, eco thus is 1.6 µg.L-1.
The final SRCwater, eco is 1.6 µg.L-1. The SRCwater, eco is valid for the marine and the freshwater environment.
3.8 Lipid approach
In Verbruggen (in prep.) ERLs were also calculated on the basis of internal lipid concentrations. In this approach all individual toxicity data for all examined PAHs were recalculated to internal lipid concentrations and concentrations were expressed on a molar basis. The obtained dataset was set out in a species sensitivity distribution and the values for HC5 and HC50 have been recalculated to concentrations for the individual PAHs in water, sediment and soil. More details on this approach can be found in Verbruggen (in prep.). With this method, an MPCfw, eco of 0.058 µg.L-1 was calculated after application of an assessment factor of 5 to the HC5. The HC50 of 3.3 µg.L-1 was taken over as the SRCwater, eco. These values are comparable to the derived ERLs values for freshwater.
4
Toxicity data and derivation of ERLs for sediment
4.1 Toxicity data
According to Verbruggen (in prep.) no ecotoxicity data for benthic organisms are available.
4.2 Derivation of MPCsediment
Verbruggen (in prep.) derived the MPCsediment by means of equilibrium
partitioning. The MPCsediment, fw is 1.6 mg.kgdwt -1 for Dutch standard sediment. For the MPCsediment, sw, this number is a factor of 10 lower, 0.16 mg.kgdwt -1 for Dutch standard sediment.
The final MPCsediment, fw is 1.6 mg.kgdwt-1 for Dutch standard sediment and the final MPCsediment, sw is 0.16 mg.kgdwt-1 for Dutch standard sediment
4.3 Derivation of NCsediment
The NCsediment, fw is set a factor of 100 lower than de MPCsediment at 16 µg.kgdwt-1 and the MPCsediment, sw at 1.6 µg.kgdwt-1 for Dutch standard sediment.
4.4 Derivation of SRCsediment, eco
Verbruggen (in prep.) derived an SRCsediment, eco of 38 mg.kgstandard sediment-1 by mean of equilibrium partitioning from the SRCwater, eco.
The final SRCsediment, eco is 38 mg.kgdwt-1 for Dutch standard sediment. The SRCsediment, eco is valid for the marine and the freshwater environment.
4.5 Lipid approach
With the lipid approach as briefly described in Section 3.8, Verbruggen (in prep.) calculated an MPCsediment, fw of 1.4 mg.kg dwt-1 was calculated, after application of an assessment factor of 5 to the HC5. The HC50 of 77 mg.kg dwt-1 was taken over as the SRCsediment, fw. Both values were normalised for Dutch standard sediment. These values are comparable to the derived ERL values for sediment.
5
Toxicity data and derivation of ERLs for soil
5.1 Toxicity data
The soil toxicity data for chrysene as reported by Verbruggen (in prep.) are discussed in Section 5.2.1.
5.2 Derivation of MPCsoil
5.2.1 MPCsoil, eco
The following derivation of the MPCsoil, eco is cited from Verbruggen (in prep.). For soil, two studies with three species are available. No effects were observed in a 14-d study with the earthworm Eisenia fetida (Bowmer et al., 1993), a 21-d study with the springtail Folsomia candida (Bowmer et al., 1993), and a 28-d study with the springtail Folsomia fimetaria (Sverdrup et al., 2002). However, pore water concentrations are possibly already saturated below
50 mg.kgdwt standard soil-1. Therefore, the ERLs are derived by means of equilibrium partitioning from the MPCfw, eco. The MPCsoil, eco is 1.6 mg.kgdwt-1 for Dutch
standard soil.
The final MPCeco for soil is 1.6 mg.kgdwt-1 for Dutch standard soil.
5.2.2 MPCsoil, secpois
Chrysene has a BCF > 100 L.kg-1 and therefore secondary poisoning is triggered. However no relevant studies with population relevant endpoints for mammals and birds could be found. Considering the fact that chrysene is a suspected carcinogen and that the risk of the TLhh is reduced to 10-6 per lifetime, the MPCsoil, hh food is expected to be much more protective than the MPC for secondary poisoning. Therefore, derivation of the MPCsoil, secpois is not deemed necessary.
5.2.3 MPCsoil, hh food
For the derivation of the MPCsoil, hh food, the TLhh of 0.50 µg.kgbw-1.day-1 can be used (with the method as described in van Vlaardingen and Verbruggen (2007)). Specific human intake routes are allowed to contribute 10% of the human toxicological threshold limit. Four different routes contributing to human exposure have been incorporated: consumption of leafy crops, root crops, milk and meat. Uptake via root crops was determined to be the critical route. The calculated MPCsoil, hh food is 23 µg.kgdwt-1 for Dutch standard soil.
5.2.4 Selection of the MPCsoil
The lowest MPCsoil is the MPCsoil, hh food, this sets the MPCsoil to 23 µg.kgdwt-1 for Dutch standard soil.
5.3 Derivation of NCsoil
The NCsoil is set a factor of 100 lower than de MPCsoil at 0.23 ug.kg dwt –1 for Dutch standard soil.
5.4 Derivation of SRCsoil, eco
Verbruggen (in prep.) derived the SRCsoil, eco through equilibrium partitioning from the SRCwater, eco. The SRCsoil, eco is 38 mg.kgdwt soil-1 for Dutch standard soil.
5.5 Lipid approach
With the lipid approach as briefly described in Section 3.8, Verbruggen (in prep.) calculated an MPCsoil, eco of 1.4 mg.kg dwt-1, after application of an assessment factor of 5 to the HC5. The HC50 of 77 mg.kg dwt-1 was taken over as the SRCsoil, eco. Both values were normalised for Dutch standard soil. These values are comparable to the derived ecotoxicological ERL values for soil.
6
Derivation of ERLs for groundwater
6.1 Derivation of MPCgw
6.1.1 MPCgw, eco
Since groundwater-specific ecotoxicological ERLs are absent, the surface water MPCfw, eco is taken as a substitute. Thus the MPCgw, eco = MPCfw, eco = 0.07 µg.L-1.
6.1.2 MPCgw, hh
The MPCgw, hh is set equal to the MPCdw, hh: 1.8 µg.L-1.
6.1.3 Selection of the MPCgw
The lowest MPCgw sets the MPCgw this is the MPCgw, eco: 0.07 µg.L-1.
6.2 Derivation of NCgw
The NCgw is set a factor 100 lower than the MPCgw: 0.7 ng.L-1.
6.3 Derivation of SRCeco, gw
7
Derivation of ERLs for air
7.1 Derivation of MPCair
7.1.1 MPCair, eco
No data are available to derive an MPCair, eco.
7.1.2 MPCair, hh
The MPCair, hh is set by the TCA of 10 ng.m-3 given in Section 2.4.
7.1.3 Selection of the MPCair
The MPCair will be determined by the only MPCair derived, the MPCair, hh: 10 ng.m-3.
7.2 Derivation of NCair
8
Comparison of derived ERLs with monitoring data
Surface water
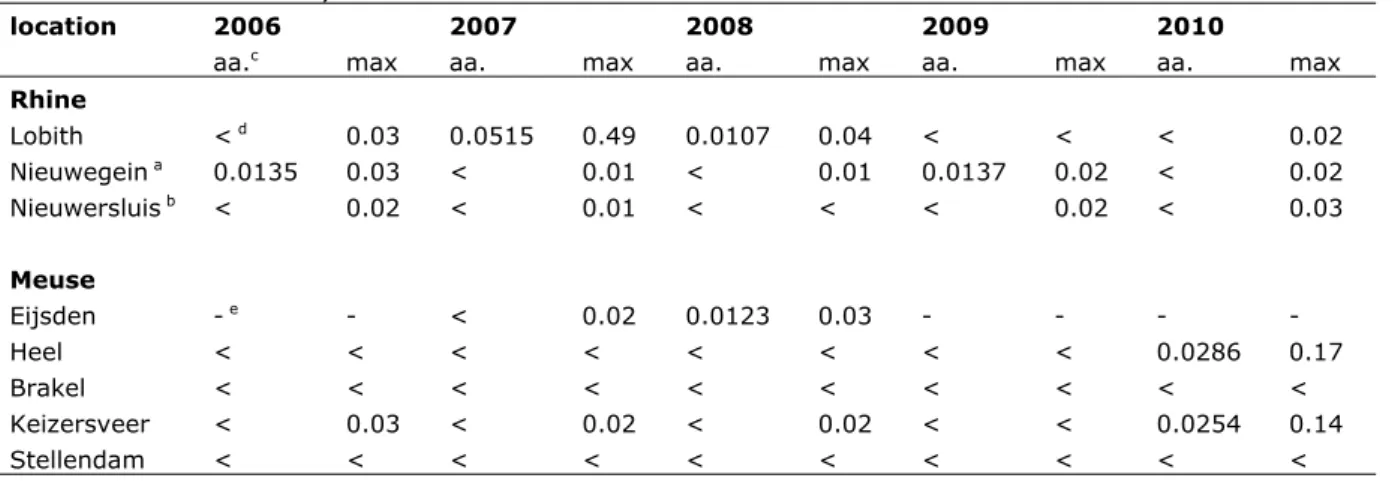
The RIWA (Dutch Association of River Water companies) reports monitoring data for chrysene in the Rhine and Meuse basins. The concentrations for the years 2006-2010 are given in Table 7. These values cannot be directly compared with the ERLs derived in this report since they are expressed as dissolved
concentrations. Presuming a concentration of suspended matter in surface water varying between 15 and 30 mg.L-1 and the K
p, susp-water, Dutch standard given in Section 3.3.4, the fraction of the total concentration sorbed to suspended matter is 40 to 60%. Nevertheless, the limit of quantification reported by the RIWA (0.01 µg.L-1) is already higher than the MPC
water of 0.0012 µg.L-1 derived in this report. Therefore, all reported annual average concentrations exceed the MPCwater and in the other cases, where the concentrations were below the detection limit, it is unknown if the MPCwater is being exceeded. In 2007, even with 60% of the total concentration sorbed to suspended matter, one of the maximum concentrations in the Rhine basin exceeds the MACfw, eco of 0.07 µg.L-1 derived in this report. In the Meuse basin, based on the concentration of suspended matter measured at the same time, this occurred one times in 2010 at Heel. Considering the facts that the reported concentrations exceeding the MPCwater and MACfw, eco are from recent years and the fact that the detection limit is higher than the MPCwater, it is likely that the new ERLs are currently being exceeded.
Table 7 Total concentrations (µg.L-1) of chrysene in surface water of the Rhine and Meuse for the years 2006-2010. Source: RIWA
location 2006 2007 2008 2009 2010
aa.c max aa. max aa. max aa. max aa. max
Rhine Lobith < d 0.03 0.0515 0.49 0.0107 0.04 < < < 0.02 Nieuwegein a 0.0135 0.03 < 0.01 < 0.01 0.0137 0.02 < 0.02 Nieuwersluis b < 0.02 < 0.01 < < < 0.02 < 0.03 Meuse Eijsden - e - < 0.02 0.0123 0.03 - - - - Heel < < < < < < < < 0.0286 0.17 Brakel < < < < < < < < < < Keizersveer < 0.03 < 0.02 < 0.02 < < 0.0254 0.14 Stellendam < < < < < < < < < < a Lek canal. b Amsterdam-Rhine canal. c aa. = annual average.
d < = below limit of detection/quantification. e - = not reported.
The Dutch Ministry of Infrastructure and Environment does present monitoring data for chrysene on their website (www.waterbase.nl). For the years 2001 to 2010 maximum peak values for surface waters are reported up to 1.4 µg.L-1. In several cases, even with 60% of the total concentration sorbed to suspended matter, the MACfw, eco derived in this report has been exceeded, for example at Lobith in June 2007 and in Nederweert in December 2009 and April 2010.
Similarly, the MACsw, eco has been exceeded in many occasions in marine and brackish waters, for example at Huibertsgat oost, July 2009; Haringvlietsluis, April 2005 and Lauwersoog havenmond, September 2007. For suspended matter, the average of the concentrations for almost all Dutch sampling locations reported for 2008, 2009 and 2010 do exceed the MPCsusp, fw or MPCsusp, sw with exception of the locations Markermeer (2008, 2009 and 2010), Pampus oost (2009 and 2010) and Vrouwenzand (2009 and 2010).
For remote mountain lakes, dissolved water concentrations for chrysene in combination with triphenylene are 21, 24 and 105 pg.L-1 for the Pyrenees, alps and central Norway, respectively (Vilanova et al., 2001). In these water samples chrysene counted for 7 to 19% of the total PAH concentration. For the marine environment, background concentrations have been agreed for several regions of the North-East Atlantic. The background concentration of chrysene and triphenylene together ranges from 0.036 to 0.057 ng.L-1 (OSPAR, 2005).
Sediment
For sediment, over the years 2001 to 2010 the reported concentrations
exceeded the new derived MPCsediment, fw only in one location. The MPCsediment, sw is also exceeded in one location. Almost all of the other reported values exceed the newly derived NCsediment, fw or NCsediment, sw. Concentrations in North Sea sediment are also collected for the OSPAR convention. Actual concentrations are not report for chrysene but in the assessment report for 2008/2009 (OSPAR, 2009b) can be seen that the concentration in all samples exceed the OSPAR
"Background Assessment Concentration" of 20 µg.kgdwt-1 normalised to 2.5% TOC (OSPAR, 2009a). Normalised to Dutch standard sediment, this value would be a factor 3 lower than the MPCsediment derived in this report but higher than the NCsediment. The trends for concentrations of chrysene in North Sea sediment over the period 2003-2007 are in general stabile and at some locations declining.
Soil
In the year 2000, the AW2000 project examined the concentrations of many contaminants in agricultural soil and soils in nature reserves in the Netherlands, which were not exposed to local sources of contamination, in order to determine their background values in the Netherlands (Lamé et al., 2004b). The median concentration of chrysene in the upper soil (0-0.1 m) was determined at 14 µg.kgdwt-1 for Dutch standard soil. In the lower soil (0.5-1.0 m) the median was determined at 4 µg.kgdwt-1 for Dutch standard soil. These values are
comparable to the estimated natural background concentration of 1-10 µg.kgsoil-1 for individual PAHs as determined by Wilcke (2000). It seems in contradiction that soils in European high mountain areas, recently examined on their PAH concentration (Quiroz et al., 2011) showed higher concentrations. For chrysene and triphenylene together, the average concentrations were 120 µg.kg-1, 27 µg.kg-1, 125 µg.kg-1 and 176 µg.kg-1 for Montseny (Spain), Pyrenees (French-Spanish border), Alps (Austria) and Tatras (Slovakia) respectively. However, the actual concentration is correlated to the altitude and these high concentrations are attributed to condensation effects at higher altitudes caused by the lower temperatures. When this correlation is extrapolated to sea level, the estimated value is comparable to those determined within the AW2000 project (Lamé et al., 2004a) and by Wilcke (2000). The maximum
concentrations monitored in the AW2000 project are 0.741 mg.kgdwt-1 and 0.083 mg.kgdwt-1 for the upper and lower soil respectively normalised to Dutch standard soil. These values exceed the derived MPC value for soil. The 80% level in the upper soils was 0.029 mg.kgdwt-1 meaning that at least 20% of the uppers soil samples exceed the MPCsoil. In the lower soils, the 95% level of 0.024 was
higher than the MPCsoil. From this can be concluded that the newly derived MPCsoil will be exceeded in many areas with a relatively low exposure of PAHs. It can also be concluded that the concentrations in remote areas are most likely not only from natural sources, application of the added risk approach is
therefore not appropriate. Considering the NCsoil, it should be mentioned that the NCsoil is much lower than the background concentrations determined by Lamé et al. (2004b) and Wilcke (2000) but since these values might not be fully caused by natural sources alone, it is unsure if the NCsoil is representing a system with no pollution or that it is too low.
Sum of PAHs
The observations reported above are based on the reported concentrations for chrysene alone. It should be considered that chrysene will not occur on its own but as part of the mixture of PAHs. Therefore, the occurrence of mixture toxicity should be considered when performing a risk assessment. PAHs are a large group of substances of which the mechanisms of toxicity are comparable. Therefore, the risk assessment for every environmental compartment should be based on concentration addition for every PAH determined and not on a single PAH like chrysene alone.
9
Conclusions
In this report, the risk limits Negligible Concentration (NC), Maximum Permissible Concentration (MPC), Maximum Acceptable Concentration for ecosystems (MACeco), and Serious Risk Concentration for ecosystems (SRCeco) are derived for chrysene in water, groundwater, sediment, soil and air.
Monitoring data suggests that currently the MPCfw, the MPCsw the MPCsusp, fw and the MPCsusp, sw derived in this report are likely to be exceeded in the Dutch surface waters. The MPCs for sediment could be exceeded in some cases and the NCs for sediment are likely to be exceeded in many cases. Also, the MPCsoil will be exceeded in many cases including soils with a relatively low exposure to PAHs. Besides that, it should be mentioned that chrysene will not occur on its own but as part of the mixture of PAHs. For a substance group like PAHs, additive effects (mixture toxicity) should not be ruled out and the total group of PAHs should be assessed by application of concentration addition, at least for ecotoxic effects. The ERLs that were obtained are summarised in the table below. For the NCsoil should be mentioned that it might not be representative (too low) for soils with a natural exposure to PAHs.
Table 8. Derived MPC, NC, MACeco, and SRCeco values for chrysene
ERL unit value
MPC NC MACeco SRCeco
freshwater a ng.L-1 1.2 1.2 x 10⁻² 70 1.6 x 10³
freshwater susp. matter b µg.kg
dwt-1 56
drinking water human health c µg.L-1 1.8
saltwater ng.L-1 1.2 1.2 x 10⁻² 7.0 1.6 x 10³
saltwater susp. matter µg.kgdwt-1 56 freshwater sediment d mg.kg dwt-1 1.6 1.6 x 10⁻² 38 saltwater sediment d mg.kg dwt-1 0.16 1.6 x 10⁻³ 38 soil e µg.kg dwt-1 23 0.23 38 x 103 groundwater ng.L-1 70 0.70 1.6 x 10³ air ng.m-3 10 0.10
a From the MPCfw, eco, MPCfw, secpois and MPCfw, hh food the lowest one is selected as the ‘overall’ MPCwater.
b Expressed on the basis of Dutch standard suspended matter.
c As stated in the new WFD guidance, the MPCdw, hh is not included in the selection of the final MPCfw. Therefore, the MPCdw, hh is presented as a separate value in this report. d Expressed on the basis of Dutch standard sediment.
e Expressed on the basis of Dutch standard soil. n.d. = not derived.
References
Anonymous. 1998. Basisrapportage derde voedselconsumptiepeiling. Zeist: TNO. Baars A, Theelen R, Janssen P, Hesse J, van Apeldoorn M, Meijerink M, Verdam
L, Zeilmaker M. 2001. Re-evaluation of human-toxicological maximum permissible risk levels. Bilthoven, The Netherlands: National Institute of Public Health and the Environment (RIVM). Report no. 711701025. Baussant T, Sanni S, Jonsson G, Skadsheim A, Børseth JF. 2001a.
Bioaccumulation of polycyclic aromatic compounds: 1. Bioconcentration in two marine species and in semipermeable membrane devices during chronic exposure to dispersed crude oil. Environ Toxicol Chem. 20: 1175-1184.
Baussant T, Sanni S, Skadsheim A, Jonsson G, Børseth JF, Gaudebert B. 2001b. Bioaccumulation of polycyclic aromatic compounds: 2. Modeling
bioaccumulation in marine organisms chronically exposed to dispersed oil. Environ Toxicol Chem. 20: 1185-1195.
Bayona JM, Fernandez P, Porte C, Tolosa I, Valls M, Albaiges J. 1991. Partitioning of urban wastewater organic microcontaminants among coastal compartments. chemosphere. 23: 313-326.
Bihari N, Fafandel M, Piskur V. 2007. Polycyclic aromatic hydrocarbons and ecotoxicological characterization of seawater, sediment, and mussel Mytilus galloprovincialis from the gulf of Rijeka, the Adriatic Sea, Croatia. Arch. Environ. Contam. Toxicol. 52: 379-387.
Bisson M, Dujardin R, Flammarion P, Garric J, Babut M, Lamy M-H, Porcher J-M, Thybaud É, Vindimian É. 2000. Complément au SEQ-Eau: méthode de détermination des seuils de qualité pour les substances génotoxiques. Verneuil-en-Halatte, France, Institut National de l'Environnement Industriel et des Risques (INERIS), Agence de l'eau Rhin-Meuse. Bleeker EAJ, Verbruggen EMJ. 2009. Bioaccumulation of polycyclic aromatic
hydrocarbons in aquatic organisms. Bilthoven: RIVM. Report no. 601779002.
Boese BL, Ozretich RJ, Lamberson JO, Swartz RC, Cole FA, Pelletier J, Jones J. 1999. Toxicity and phototoxicity of mixtures of highly lipophilic PAH compounds in marine sediment: Can the ΣPAH model be extrapolated? Arch. Environ. Contam. Toxicol. 36: 270-280.
Bowmer CT, Roza P, Henzen L, Degeling C. 1993. The development of chronic toxicological tests for PAH contaminated soils using the earthworm Eisenia fetida and the springtail Folsomia candida. Delft, the
Netherlands: TNO Environmental and Energy Research, TNO Institute of Environmental Sciences. Report no. IMW-R 92/387.
Burkhard LP, Lukasewycz MT. 2000. Some bioaccumulation factors and biota-sediment accumulation factors for polycyclic aromatic hydrocarbons in lake trout. Environmental Toxicology and Chemistry. 19: 1427-1429. Cailleaud K, Budzinski H, Le Menach K, Souissi S, Forget-Leray J. 2009. Uptake
and elimination of hydrophobic organic contaminants in estuarine copepods: An experimental study. Environ.Toxicol.Chem. 28: 239-246. Cheikyula JO, Koyama J, Uno S. 2008. Comparative study of bioconcentration
and EROD activity induction in the Japanese flounder, red sea bream, and Java medaka exposed to polycyclic aromatic hydrocarbons. Environ. Toxicol.: 354-362.
Chen S, Ke R, Zha J, Wang Z, Khan SU. 2008. Influence of humic acid on bioavailability and toxicity of benzo[k]fluoranthene to Japanese medaka.
Environ. Sci. Technol. 42: 9431-9436. Environmental Science & Technology. 42.
Eastmond DA, Booth GM, Lee ML. 1984. Toxicity, accumulation, and elimination of polycyclic aromatic sulfur heterocycles in Daphnia magna. Arch. Environ. Contam. Toxicol. 13: 105-111.
EC. 2001. Ambient air pollution by polycyclic aromatic hydrocarbons (PAH). Position paper prepared by the working group on polycyclic aromatic hydrocarbons. Luxembourg: Office for official publications of the european communities. Report no. KH-41-01-373-EN-N.
EC. 2003. Technical Guidance Document on risk assessment in support of Commission Directive 93/67/EEC on risk assessment for new notified substances, Commission Regulation (EC) No 1488/94 on risk assessment for existing substances and Directive 98/8/EC of the European
Parliament and of the Council concerning the placing of biocidal products on the market. Ispra, Italy: European Commission Joint Research Centre.
EC. 2011. Common implementation strategy for the Water Framework Directive (2000/60/EC). Guidance document No. 27. Technical guidance for deriving environmental quality standards. Brussels: European Commission.
EU. 2004. Directive 2004/107/EC of the European Parliament and of the Council of 15 December 2004 relating to arsenic, cadmium, mercury, nickel and polycyclic aromatic hydrocarbons in ambient air. Official Journal of the European Union. European Union.
Hansler RJ, Van Herwijnen R, Posthumus R. 2008. Indicatieve
milieukwaliteitsnormen voor prioritaire stoffen. Bilthoven: RIVM. Report no. 601782012.
Hooftman RN. 1991. Ecotoxicological testing of polycyclic aromatic
hydrocarbons. Delft, the Netherlands. Delft, the Netherlands: TNO Environmental and Energy Research, TNO Institute of Environmental Sciences. Report no. IMW-P91-026.
Hooftman RN, Evers-de Ruiter A. 1992. Early life stage tests with Brachydanio rerio and several polycyclic aromatic hydrocarbons using an intermittent flow-through system (draft OECD guideline). Delft, the Netherlands: TNO Environmental and Energy Research, TNO Institute of
Environmental Sciences. Report no. IMW-R 92/210.
Jonker MTO, Van der Heijden SA. 2007. Bioconcentration factor hydrophobicity cutoff: An artificial phenomenon reconstructed. Environmental Science & Technology. 41: 7363-7369.
Kalf DF, Crommentuijn GH, Posthumus R, Van de Plassche EJ. 1995. Integrated environmental quality objectives for polycyclic aromatic hydrocarbons (PAHs). Bilthoven: RIVM. Report no. 679101018.
Klimisch HJ, Andreae M, Tillman U. 1997. A systematic approach for evaluating the quality of experimetnal toxicological and ecotoxicological data. Regulatory Toxicology and Pharmacology. 25: 1-5.
Lamé FPJ, Brus DJ, Nieuwenhuis RH. 2004a. Achtergrondwaarden 2000 - Bijlage Rapport 1 AW2000: Datasheets voor de geanalyseerde stoffen. Utrecht: Nederlands Instituut voor Toegepaste Geowatenschappen. Report no. NITG 04-2420A.
Lamé FPJ, Brus DJ, Nieuwenhuis RH. 2004b. Achtergrondwaarden 2000 - Hoofdrapport AW2000 fase 1. Utrecht: Nederlands Instituut voor Toegepaste Geowatenschappen. Report no. NITG 04-2420-A. Lepper P. 2005. Manual on the Methodological Framework to Derive
Environmental Quality Standards for Priority Substances in accordance with Article 16 of the Water Framework Directive (2000/60/EC).
Schmallenberg, Germany: Fraunhofer-Institute Molecular Biology and Applied Ecology.
Lijzen JPA, Baars AJ, Otte PF, Rikken MGJ, Swartjes FA, Verbruggen EMJ, van Wezel AP. 2001. Technical evaluation of the intervention values for soil/sediment and groundwater - Human and ecotoxicological risk assessment and derivation of risk limits for soil, aquatic sediment and groundwater. Bilthoven, the Netherlands: National Institute of Public Health and the Environment (RIVM). Report no. 711701023.
Loibner AP, Szolar OHJ, Braun R, Hirmann D. 2004. Toxicity testing of 16 priority polycyclic aromatic hydrocarbons using Lumistox®.
Environ.Toxicol.Chem. . 23: 557-564.
Neff JM, Anderson JW, Cox BA, Laughlin JRB, Rossi SS, Tatem HE. 1976. Effects of petroleum on survival, respiration and growth of marine animals. Sources, Effects and Sinks of Hydrocarbons in the Aquatic Environment. pp. 515-539. Arlington, USA, American Institute of Biological Sciences. Newsted JL, Giesy JP. 1987. Predictive models for photoinduced acute toxicity of
polycyclic aromatic hydrocarbons to Daphnia magna, Strauss (Cladocera, crustacea). Environ.Toxicol.Chem. 6: 445-461.
Nfon E, Cousins IT, Broman D. 2008. Biomagnification of organic pollutants in benthic and pelagic marine food chains from the Baltic Sea. Science of the Total Environment. 397: 190-204.
Okay OS, Karacik B. 2008. Bioconcentration and phototoxicity of selected PAHs to marine mussel Mytilus galloprovincialis. Journal of Environmental Science and Health Part A. 43: 1234-1242.
OSPAR. 2005. Agreement on background concentrations for contaminants in seawater, biota and sediment. London: OSPAR commission.
OSPAR. 2009a. Background document on CEMP assessment criteria for QSR 2010. London, UK: OSPAR commission.
OSPAR. 2009b. CEMP assessment report: 2008/2009 - Assessment of trends and concentrations of selected hazardous substances in sediments and biota. London, UK: OSPAR commission.
Quiroz R, Grimalt JO, Fernandez P, Camarero L, Catalan J, Stuchlik E, Thies H, Nickus U. 2011. Polycyclic aormatic hydrocarbons in soils from European high mountain areas. Water Air and Soil Pollution. 215: 655-666. Sverdrup LE, Nielsen T, Krogh PH. 2002. Soil ecotoxicology of polycyclic
aromatic hydrocarbons in relation to soil sorption, lipophilicity, and water solubility. Environ.Sci.Technol. 36: 2429-2435.
Takeuchi I, Miyoshi N, Mizukawa K, Takada H, Ikemoto T, Omori K, Tsuchiya K. 2009. Biomagnification profiles of polycyclic aromatic hydrocarbons, alkylphenols and polychlorinated biphenyls in Tokyo Bay elucidated by 13C adn 15N isotope ratios as guides to trophic web structure. Marine Pollution Bulletin. 58: 663-671.
Telli-Karakoc F, Tolun L, Henkelmann B, Klimm C, Okaya O, Schramm K-W. 2002. Polycyclic aromatic hydrocarbons (PAHs) and polychlorinated biphenyls (PCBs) distributions in the Bay of Marmara sea: Izmit Bay. Environmental Pollution. 119: 383-397.
Van Vlaardingen PLA, Verbruggen EMJ. 2007. Guidance for the derivation of environmental risk limits within the framework of "International and national environmental quality standards for substances in the Netherlands" (INS). Bilthoven, The Netherlands: National Institute of Public Health and the Environment (RIVM). Report no. 601782001. Verbruggen EMJ. in prep. Environmental risk limits for polycyclic aromatic
hydrocarbons (PAHs). Bilthoven, The Netherlands: National Institute of Public Health and the Environment (RIVM). Report no. 711701XXX.
Vilanova RM, Fernandez P, Martinez C, Grimalt JO. 2001. Polycyclic aromatic hydrocarbons in remote mountain lake waters. Water Research. 35: 3916-3926.
Vives I, Grimalt JO, Ventura M, Catalan J. 2005. Distribution of polycyclic aromatic hydrocarbons in the food web of a high mountain lake, Pyrenees, Catalonia, Spain. Environ.Toxicol.Chem. 24: 1344-1352. VROM. 1999. Environmental risk limits in the Netherlands. A review of
environmental quality standards and their policy framework in the Netherlands. The Hague, The Netherlands: Ministry of Housing, Spatial Planning and the Environment.
VROM. 2004. (Inter)nationale Normen Stoffen. Den Haag, the Netherlands: Ministerie van Volkshuisvesting, Ruimtelijke Ordening en Milieubeheer. Wan Y, Jin X, Hu J, Jin F. 2007. Trophic dilution of polycyclic aromatic
hydrocarbons (PAHs) in a marine food web from Bohai Bay, North China. Environ.Sci.Technol. 41: 3109-3114.
Wilcke W. 2000. Polycycilc aromatic hydrocarbons (PAHs) in soil - a Review. J. Plant Nutr. Soil Sci. 163: 229-248.
Witt G. 2002. Occurence and transport of polycyclic aromatic hydrocarbons in the water bodies of the Baltic sea. Marine Chemistry. 79: 49-66.
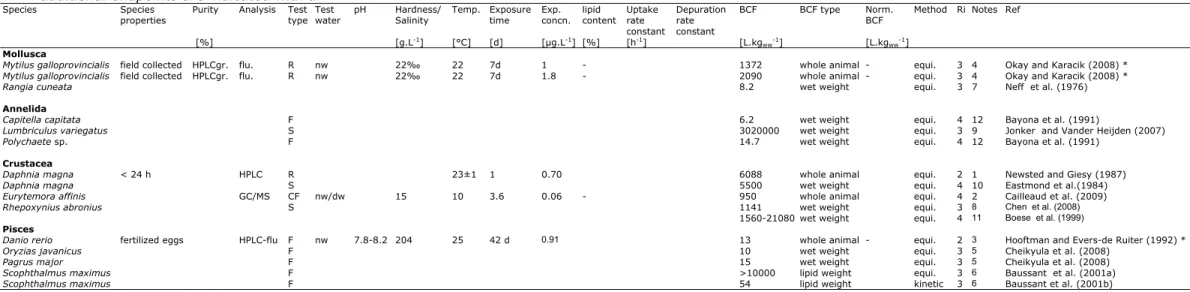
Table A1.1. Bioconcentration factors for chrysene taken over from RIVM report 601779002 (Bleeker and Verbruggen, 2009). Studies for additional endpoints are indicated with a *
Species Species
properties Purity Analysis Test type Test water pH Salinity Hardness/ Temp. Exposure time Exp. concn. lipid content Uptake rate constant
Depuration rate constant
BCF BCF type Norm.
BCF Method Ri Notes Ref [%] [g.L-1] [°C] [d] [µg.L-1] [%] [h-1] [L.kg
ww-1] [L.kgww-1]
Mollusca
Mytilus galloprovincialis field collected HPLCgr. flu. R nw 22‰ 22 7d 1 - 1372 whole animal - equi. 3 4 Okay and Karacik (2008) * Mytilus galloprovincialis field collected HPLCgr. flu. R nw 22‰ 22 7d 1.8 - 2090 whole animal - equi. 3 4 Okay and Karacik (2008) *
Rangia cuneata 8.2 wet weight equi. 3 7 Neff et al. (1976)
Annelida
Capitella capitata F 6.2 wet weight equi. 4 12 Bayona et al. (1991)
Lumbriculus variegatus S 3020000 wet weight equi. 3 9 Jonker and Vander Heijden (2007)
Polychaete sp. F 14.7 wet weight equi. 4 12 Bayona et al. (1991)
Crustacea
Daphnia magna < 24 h HPLC R 23±1 1 0.70 6088 whole animal equi. 2 1 Newsted and Giesy (1987)
Daphnia magna S 5500 wet weight equi. 4 10 Eastmond et al.(1984)
Eurytemora affinis GC/MS CF nw/dw 15 10 3.6 0.06 - 950 whole animal equi. 4 2 Cailleaud et al. (2009)
Rhepoxynius abronius S 1141 wet weight equi. 3 8 Chen et al. (2008)
1560-21080 wet weight equi. 4 11 Boese et al. (1999)
Pisces
Danio rerio fertilized eggs HPLC-flu F nw 7.8-8.2 204 25 42 d 0.91 13 whole animal - equi. 2 3 Hooftman and Evers-de Ruiter (1992) *
Oryzias javanicus F 10 wet weight equi. 3 5 Cheikyula et al. (2008)
Pagrus major F 15 wet weight equi. 3 5 Cheikyula et al. (2008)
Scophthalmus maximus F >10000 lipid weight equi. 3 6 Baussant et al. (2001a)
Scophthalmus maximus F 54 lipid weight kinetic 3 6 Baussant et al. (2001b)
Notes
1 Exposure duration ≤ 4d, but steady state reported. 2 Concentration Factor based on dry weight.
3 Flow-through system was an intermittent flow-through system: Automatic renewal of the medium every hour.
4 BCF based on nominal concentrations, highest test concentration probably toxic.
5 Exposure concentration above water solubility.
6 Exposure to oil, PAH concentration above water solubility; BCF based on lipid weight.
7 Exposure type not reported; steady state unlikely.
8 Exposure via sediment; exposure concentration above water solubility. 9 Static exposure; sediment present; steady state unlikely.
10 Based on total radioactivity. 11 Exposure via sediment. 12 Exposed in the field.