Projectnr.: 72.095.01
Risicoanalyse en Advisering Thema 1 Project leader: J.D. van Klaveren
Dietary intake of brominated diphenyl ether congeners by the Dutch
population
Anika de Mul, Renata de Winter-Sorkina1, Polly E. Boon, Gerda van Donkersgoed, Martine I. Bakker1, Jacob D. van Klaveren
1) Center for Substances and Integrated Risk Assessment (SIR), National Institute for Public Health and the Environment, RIVM, Bilthoven, The Netherlands
Business Unit: Safety & Health
Group: Databases, Risk Assessment & Supply Chain Management
This project was partly financed by the Ministry of Agriculture, Nature and Food Quality within the framework of project 72.095.01, Risk Analysis and Advice, Theme 1 (RIKILT) and partly by the Food and Consumer Product Safety Authority within the framework of project 310305, Dioxins in Food (RIVM).
RIKILT - Institute of Food Safety
Bornsesteeg 45, 6708 PD Wageningen, the Netherlands P.O. Box 230, 6700 AE Wageningen, the Netherlands Tel: +31 317 475422
Fax: +31 317 417717 Internet: www.rikilt.wur.nl
RIVM report 310305004
Copyright 2005, RIKILT - Institute of Food Safety.
The client is allowed to publish this report in an integral way and to give this report for perusal to a third party. Without approval in writing of RIKILT - Institute of Food Safety it is not allowed:
• to publish this report partial;
• to use this report or title of this report for setting up calls, to conduct legal procedures, for advertising or non-adverting and for acquisition in general;
• to use the name of RIKILT - Institute of Food Safety apart from author of this report.
MAILING LIST:
Biometris, Wageningen UR, Wageningen, The Netherlands (Ir. W.J. de Boer, Dr. H. van der Voet) Health Canada, Ottawa, Canada (Dr. J.J. Ryan)
Health Council of the Netherlands, The Hague, The Netherlands (Prof.dr. W.F. Passchier) Health Service Amsterdam, Amsterdam, The Netherlands (Dr. J.H. van Wijnen)
Laboratory of Toxicology and Environmental Health, Reus, Spain (Dr. A. Bocio)
Ministry of Agriculture, Nature and Food Quality, Department of Food Quality and Animal Health, The Hague, The Netherlands (Drs. N.M.I. Scheidegger, Dr. R.M.C. Theelen)
Ministry of Agriculture, Nature and Food Quality, Fisheries Department, The Hague, The Netherlands (Drs. H. van der Giesen, Dr. A.L. de Kok)
Ministry of Health, Welfare and Sport, The Hague, The Netherlands (Dr.ir. R.J. Dortland, Ir. J.I.M. de Goeij, Drs. A. Ottevanger, Dr.ir. J.M. Stoppelaar, Dr. W. Tas)
Ministry of Housing, Spatial Planning and the Environment, Directorate General for Environmental Protection, The Hague, The Netherlands (Dr. J.A. van Zorge)
National Food Administration, Uppsala, Sweden (Dr. P.O. Darnerud)
National Institute of Public Health and the Environment, Bilthoven, The Netherlands (Dr. A.J. Baars, Dr. M.I. Bakker, Dr. R.A. Baumann, Ing. M.H. Blokland, Dr. L.A. van Ginkel, Dr. R. Hoogerbrugge, Dr. D.A. Houweling, Dr. F.X.R. van Leeuwen, Dr.ir. M.N. Pieters, Dr. R.C. Schothorst, Dr.ir. A.J.A.M. Sips, Prof.dr. W. Slob, Prof.dr. J.G. Vos, Dr. R. de Winter-Sorkina, Dr. M.J. Zeilmaker, SBC/afdeling Communicatie, Bureau Rapportenregistratie, Bibliotheek RIVM, Archief SIR)
NIZO Food Research, Ede, The Netherlands (Dr. G. Ellen)
Norwegian Institute of Public Health, Oslo, Norway (Dr. G. Becher)
State Institute for Chemical and Veterinary Analysis of Food, Freiburg, Germany (Dr. R. Malish) The Food and Consumer Product Safety Authority (VWA), The Hague, The Netherlands (Ir. J.F. de Leeuw, Dr.ir. H.P.J.M. Noteborn, Drs. B.W. Ooms, Prof.dr. E.G. Schouten)
The Food and Consumer Product Safety Authority (VWA), Inspectorate for Health Protection and Veterinary Public Health, The Hague, The Netherlands (Dr. D.G. Groothuis, Drs. H.J. Jeuring, Drs. H. de Sitter)
The Food and Consumer Product Safety Authority, Inspectorate for Health Protection and Veterinary Public Health, Zutphen, The Netherlands (M. van Bruynsvoort, Drs. H.M. Plate, Drs. J. de Vries) The Netherlands Institute of Fisheries Research, IJmuiden, The Netherlands (Dr. J. de Boer, Dr. S.P.J. van Leeuwen, Dr. H. Pieters)
The Netherlands Nutrition Centre, The Hague, The Netherlands (Dr.ir. L. Jansen, Ir. L.R. van Nieuwland)
TNO, Food and Nutrition, Zeist, The Netherlands (Dr. K. Hulshof) University of Birmingham, Birmingham, UK (Dr. S. Harrad)
CONTENTS Page
SUMMARY 3
1 INTRODUCTION 5
2 SAMPLING OF FOODS FOR BDE CONGENER ANALYSES 6
2.1 Selection of foods 6
2.2 Sampling strategy 6
2.3 Collection and composition of samples 7 2.4 Chemical analysis of BDE congeners in foods 7
3 DIETARY EXPOSURE CALCULATION 9
3.1 From BDE congener level in food subcategories to levels in NEVO foods 9
3.2 Modelling exposure 9
3.3 Uncertainty analyses 10
4 RESULTS 12
4.1 BDE congener levels in food 12
4.2 Exposure levels to BDE congeners and ΣBDE in the general Dutch population 12 4.3 Scenario’s regarding uncertainty analyses 13
5 DISCUSSION 15 5.1 Exposure estimation 15 5.2 Uncertainty analyses 16 5.3 Conclusions 18 ACKNOWLEDGEMENTS 19 REFERENCES 20
ANNEX A Food subcategories and their composition
ANNEX B Analysed brominated diphenyl ether (BDE) congeners
SUMMARY
The dietary exposure to brominated diphenyl (BDE) congeners in the general Dutch population was estimated using analyses performed by the RIVM (pooled samples from food purchased at different supermarkets, including among others butter, cheese, meat, fruit) and The Netherlands Institute for Fisheries Research (RIVO; fish and crustaceans), and food consumption data from the third Dutch National Consumption Survey (DNFCS 3). This group of BDE congeners belong to a variety of compounds known as brominated flame retardants. The long-term dietary exposure was calculated for six individual congeners (BDE47, BDE99, BDE100, BDE153+154 and BDE183), and for the sum of BDE congeners (ΣBDE). This sum included the six congeners mentioned as well as congeners BDE28, BDE66, BDE85 and BDE138.
The highest levels of ΣBDE congeners were found in fish, especially herring. The congener with the highest incidence was BDE47: this congener was present in all fish and crustacean samples analysed as well as in a large fraction of the food samples. The median exposure ranged from 0.08 ng/kg bw/day (BDE100) to 0.50 ng/kg bw/day (BDE183). BDE47 had the highest P97.5 exposure level (1.59 ng/kg bw/day). The median long-term intake of ΣBDE was 1.72 ng/kg bw/day (P97.5 = 4.62 ng/kg bw/day). Foods belonging to food subcategories oils & fats, milk, fish (herring) and meat contributed most to the intake of BDE congeners.
The results of the exposure calculations were compared with the results of other studies, showing that the intakes were similar to the intakes in Canada, Sweden and Finland, and lower than those reported in Spain and UK.
Different types of uncertainty are discussed in relation to the results of the exposure calculations, namely model uncertainty, uncertainty due to the level assigned to samples with a level below the limit of detection (LOD) and sampling uncertainty. Calculations with two models (MCRA and STEM) used to address model uncertainty resulted in different outcomes of long-term exposure. Research into the underlying differences between STEM and MCRA form a relevant point for future research.
The second type of uncertainty addressed showed that assigning zero or ½LOD to samples with a BDE congener level below LOD highly affected the intake of congeners only present in a few food subcategories. It was argued that replacing samples with a level below the LOD with zero or a positive level (e.g. ½LOD) should depend on the likelihood that such samples will contain any residue (e.g. based on the other food subcategories with a level at or above LOD).
The sampling uncertainty related to the food consumption levels was quantified using the bootstrap procedure indicating that the P95 of exposure to ΣBDE may be 17% higher or lower. It was not possible to quantify the sampling uncertainty related to the residue data, because just one level per BDE congener per food subcategory was available. The sampling uncertainty is however expected to be large. Therefore a relevant point for future research is the analysis of individual food items or, to reduce costs, to analyse more than one (composite) sample per food subcategory.
The following recommendations are made:
a. Research into the underlying differences between STEM and MCRA which resulted in different intake levels of BDE congeners form a relevant point for future research.
b. Sampling uncertainty is inherently present in exposure calculations based on empirically derived input data and should be considered, if possible, to evaluate the outcome of the exposure
calculations. For this the bootstrap procedure can be used and it is therefore recommended to elaborate further on bootstrapping of data when assessing long-term exposure in future projects. c. It is recommended in the future to analyse individual food items or, to reduce costs, to analyse
more than one (composite) sample per food subcategory when addressing the exposure to BDE congeners.
1
INTRODUCTION
Brominated flame retardants (BFRs) are widely present in the environment. Monitoring programs have shown a strong increase in the presence of BFRs during the last decades [1]. They are applied in numerous polymer products, like consumer electronics (televisions and computers), plastics, textile, building materials and polyurethane foam, to reduce the chance of ignition and burning [2]. These retardants include a variety of substances, such as polybrominated diphenyl ether (PBDE),
tetrabromobisphenol A (TBBPA), hexabromocyclododecane (HBCD), and polybrominated biphenyl (PBB). The annual global production of BFRs in 2001 was estimated at 204,000 metric tonnes [3], of which circa 67,000 metric tonnes was due to the production of PBDEs [4,5].
BFRs are of concern because of their high production volume, their structural resemblance to other well-known environmental contaminants such as PCBs, and because of the limited knowledge of their toxicity [1,2]. BFRs are present in the environment due to incineration and waste disposal, and increased exponentially starting early 1970s [1]. BFRs are lipophilic and several are known to
accumulate in biota. The highest levels of many BFRs in wildlife are found in the aquatic environment [3]. BFRs are also found in foods, including foods of animal and plant origin. For example, a Spanish study reported that olive and vegetable oils were the second most contaminated foods after blue fish [6]. Mechanisms on how BFRs transfer into plants are not yet elucidated [5]. However, atmospheric deposition is likely the most important route, as for other lipophilic organic pollutants such as dioxins and polycyclic aromatic hydrocarbons [7].
BFRs are also present in human adipose tissue, blood and in breast milk [1,5]. The predominant BFR in human milk and blood is a congener of the PBDE group, namely brominated diphenyl ether (BDE) 47 [8]. A Swedish study reported that the concentration of several BDE congeners in breast milk increased sharply between 1972 and 1997 [9]. In Sweden these levels are again declining, while in the United States levels are still rising [8].
BFRs are recognised as emerging risk chemicals with possible negative effects for health. In 2003 a report was released describing the intake of BFRs in the Dutch population using levels of BFRs in different foods [10]. However, because it is unknown how BFR levels will develop, new analyses were performed, including more food groups. These levels were used in this report to recalculate the
exposure to BFRs in the general Dutch population. The analyses were performed for congeners belonging to the PBDE group. In this report we also address different sources of uncertainty related to exposure assessment: model uncertainty, uncertainty related to the levels assigned to samples with a level below the limit of detection (LOD), and sampling uncertainty.
2
SAMPLING OF FOODS FOR BDE CONGENER ANALYSES
2.1 Selection of foods
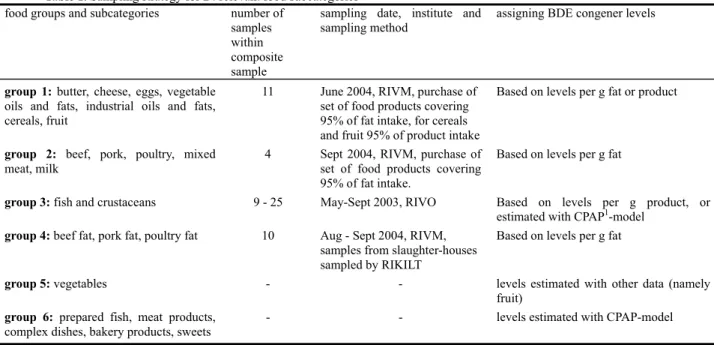
A sampling programme was designed to obtain representative levels of BDE congeners in foods consumed by the general Dutch population. The sampling strategy was based on the assumption that BDE congeners are almost entirely present in the fat fraction of foodstuffs. For the selection of foods, the database of the third Dutch National Food Consumption Survey (DNFCS 3) was used. The survey has been described in detail elsewhere [11]. Briefly, 6,250 individuals aged 1 - 97 years (including 530 young children, aged 1 - 6 years) from 2,564 households were selected. Respondents recorded their food consumption over two consecutive days. The amount eaten was weighed accurately. This resulted in consumption data of 1,209 different food products. Of each food, a comprehensive description of the nutrients present, including percentage total fat, was available from the Netherlands Nutrient database (NEVO database; [12]). The descriptions in this database were used to study the type(s) of fat or oil in the 1,209 food products. Food products not expected to contain BDE congeners were not considered in the selection procedure [13]. This screening procedure resulted in a reduction of 1,209 to 714 food products. These products were ranked in six food groups, consisting of different food
subcategories (Table 1). The ranking in groups was based on sampling procedure and the way in which congener levels were assigned to the different food subcategories.
2.2 Sampling strategy
Food subcategories belonging to food groups 1 and 2 were sampled in the present study and analysed at the Laboratory of Analytical Chemistry of RIVM (Table 1). These subcategories comprised various
Table 1. Sampling strategy for 24 relevant food subcategories
food groups and subcategories number of
samples within composite sample
sampling date, institute and sampling method
assigning BDE congener levels
group 1: butter, cheese, eggs, vegetable
oils and fats, industrial oils and fats, cereals, fruit
11 June 2004, RIVM, purchase of
set of food products covering 95% of fat intake, for cereals and fruit 95% of product intake
Based on levels per g fat or product
group 2: beef, pork, poultry, mixed
meat, milk
4 Sept 2004, RIVM, purchase of
set of food products covering 95% of fat intake.
Based on levels per g fat
group 3: fish and crustaceans 9 - 25 May-Sept 2003, RIVO Based on levels per g product, or
estimated with CPAP1-model
group 4: beef fat, pork fat, poultry fat 10 Aug - Sept 2004, RIVM, samples from slaughter-houses sampled by RIKILT
Based on levels per g fat
group 5: vegetables - - levels estimated with other data (namely fruit)
group 6: prepared fish, meat products,
complex dishes, bakery products, sweets
- - levels estimated with CPAP-model
sorts of meat and dairy, eggs, oils and fats, cereals and fruit. For each of these subcategories, a set of food products was defined covering at least 95% of the total fat intake of each respective category, or in the case of fruit and cereals, covering at least 95% and 92% of the food products, respectively (Annex A, Table A.1). In addition to these subcategories, the food product tinned tuna fish was sampled in the same manner and added to food group 3 (fish and crustaceans; Annex A, Table A.2). The latter was sampled and analysed by RIVO (The Netherlands Institute for Fisheries and Research; [14]). Food groups 5 and 6 were not sampled and analysed as such. Levels of BDE congeners in these two groups were estimated using either the Conversion model of Primary Agricultural Products (CPAP), developed at RIKILT – Institute of Food Safety [15], or data considered representative for the subcategory (Annex A, Table A.3). Finally, samples of animal fat were derived from RIKILT – Institute of Food Safety and analysed at RIVM (food group 4).
2.3 Collection and composition of samples
For food groups 1 and 2 (Table 1) a sample was prepared per food subcategory of foods belonging to this subcategory (Annex A, Table A.1). These foods were purchased by volunteers at 11 different supermarkets all over The Netherlands and brought to RIVM. Foods per food subcategory were mixed with each food item added in weight proportional to its average consumption (as determined from DNFCS 3) and stored at –20°C until chemical analysis. Animal fat samples (at least ten samples per species) were collected and mixed by RIKILT. The animal fat originated from various slaughterhouses in The Netherlands. Samples of fish and crustaceans (at least two samples per fish and crustacean type with each sample consisting of 9 to 25 animals) were collected and measured by RIVO [14].
2.4 Chemical analysis of BDE congeners in foods
For the Dutch population the pesticide residue intake was calculated using the point estimate and probabilistic approach for the general population (1-97 years) and for young children (1-6 years). For the Swedish population the calculation of residue intake was restricted to the adult population (18-74 years).
2.4.1 General information
In total 11 BDE congeners, with the highest appearance in biological matrices, were analysed by RIVM (Annex B). Additionally, 7 more congeners were analysed in fish by RIVO. Samples were extracted with organic solvents in order to isolate the fat fraction containing the BDE congeners. Before fat clean-up, 13C
12-labeled standards of the different congeners were added to the samples in order to quantify and identify the compounds according to the isotope dilution technique. An aliquot of extracted fat was dissolved in hexane and purified on a silica chromatographic column in a normal phase LC system. The eluting fraction containing the compounds of interest was collected and concentrated. Analysis was performed by injecting aliquots of the concentrated eluates into a GC/MS system. In the following sections, the various extraction steps and additional refinements applied in the analysis of the different food samples will be described.
2.4.2 Sample extraction
After homogenisation, a part of the sample was weighed for extraction. The further preparation and extraction procedures carried out for the different food items are outlined in detail in [16]. After refluxing, all extracts were evaporated to dryness and the amount of (extracted) fat was weighed to determine the fat content of the original sample.
2.4.3 Clean-up
An aliquot of the extracted fat was dissolved in hexane at a concentration of 45 mg/ml, while 0.5-1.0 ml PBDE 13C
12 label was added. A volume of 1.0 ml of this extract was injected onto a normal phase HPLC system, equipped with a silica column. A fraction of 4 ml containing the compounds of interest was collected, evaporated to dryness and re-dissolved in 0.5 ml hexane.
2.4.4 Gas chromatography – mass spectrometry
GC/MS analyses were performed on a GC-MSD Voyager coupled to a GC8000 top (Thermo Finnigan, Breda, The Netherlands) gas chromatograph. GC separations were carried out on a non-polar column (30 m DB-5MS ; J&W Scientific, Folsom, USA; 0.25 mm ID, 0.10 µm film thickness). The
temperature programme consisted of an isothermal period (50°C, 5 min), a rise at 30°C/min to 180°C, then at 10°C/min to 300°C and finally a second isothermal period of 10 min at 300°C. 100 µl of the samples for the PBDEs analysis were injected using a Optic PTV-injector (ATAS), and helium was used as carrier gas with constant pressure at 150 kPA. The GC/MS interface was maintained at 300°C in all cases and the source temperature was 250°C. Ionization of samples was performed in the electron impact mode with 70 eV electrons. Detection was performed by selected ion mode.
2.4.5 Quality control
The reproducibility of the method is good for all BDE congeners (RSD < 16 %), except for BDE183 which shows a relatively large variation (RSD 65 %). This large variation of BDE183 is probably connected with the variable extraction efficiency of BDE183, for which an explanation could not be found (letter report 47602/LOC/RB).
3
DIETARY EXPOSURE CALCULATION
3.1 From BDE congener level in food subcategories to levels in NEVO foods
BDE congener levels analysed in food subcategories were converted to concentrations in all relevant consumed foods (NEVO foods) as recorded in DNFCS 3. NEVO foods belonging to the subcategories fruit and cereals were assigned BDE congener levels based on the whole product. Note that the foods belonging to the subcategory vegetables were assigned the levels measured in the food subcategory fruit (Table 1). Foods belonging to the subcategories meat, egg, milk, butter and cheese products were assigned the BDE congener levels as measured in the respective food subcategories based on fat content. For this the congener level per g fat of the food subcategories was calculated, and then multiplied with the fat content of the NEVO food. The fat content of the analysed food subcategories was measured in the analysis, while the fat content of the NEVO foods was derived from the NEVO database [12]. NEVO foods containing several ingredients, for example pizza, were assigned BDE congener levels by using CPAP (food group 6 in Table 1). The levels of the separate ingredients were multiplied with the BDE congener concentrations of the relevant food subcategories, and then the congener levels of all ingredients were summed to get the BDE congener level of the NEVO food. For example pizza was assigned BDE congener levels based on levels in food subcategories cereals, vegetables (= fruit), cheese, meat and industrial fat. Fish and crustaceans products were either assigned a BDE congener level directly based on the fishes and crustaceans analysed, or using CPAP (food group 3). CPAP converted the levels for the different fish and crustaceans species to the specific fish and crustacean products. For eel, 13% of the analysed eel consisted of farmed eel, 6% of IJselmeer eel and 81% of other eel. To convert levels analysed to levels in consumed eel, we assumed that the Dutch consumption of eel consisted for 90% of farmed eel, 5% of IJselmeer eel (‘wild’ eel) and 5% other eel. Analysed beef - and pig fat were assigned to the specific NEVO foods containing those fats. Chicken fat was not assigned to a NEVO food because none of the foods contained chicken fat. We did not assign BDE congener levels analysed in animal fats to meat products, because levels measured in fat differed substantially from those measured in the whole product (expressed on fat basis).BDE congener levels in NEVO foods were calculated for six congeners. These congeners were analysed by both RIVM and RIVO and were detected at levels at or above the limit of detection (LOD) by both institutes. This was true for the congeners 47, 99, 100, 153+154 and 183. Additionally the exposure to the sum of the BDE congeners (ΣBDE) was calculated. This sum included the six congeners mentioned, as well as the congeners 28, 66, 85, and 138. The last three congeners were only detected at levels at or above LOD for one or more of the food groups analysed by either RIVM or RIVO. BDE28 was however detected at levels at or above LOD by both institutes, but was not addressed separately due to very low concentrations detected. The four congeners were included in the sum to make the estimation as complete as possible. The ΣBDE levels per NEVO food were calculated by simply summing the levels over the different congeners, assuming equal toxicity.
3.2 Modelling exposure
People are exposed to BDE congeners daily, during their whole lifetime. As these compounds have relatively long half-lives, the relevant intake measure for these substances is, just as for dioxins and PCBs, long-term intake. We therefore calculated the long-term intake of the six selected BDE
congeners and ΣBDE using the Monte Carlo Risk Assessment (MCRA) programme release 3.4 developed at RIKILT in collaboration with Biometris Wageningen UR [17]. MCRA calculates the exposure using BDE congener levels in NEVO foods and consumption levels of these foods as recorded in DNFCS 3 (see § 2.1) as input data. We also calculated the contribution of the different food subcategories to the intake of BDE47, BDE183 and ΣBDE.
3.2.1 Long-term intake
All daily consumption patterns (e.g. 12,500 for the total population (2 days × 6,250 individuals)) were multiplied with the BDE congener or ΣBDE level per NEVO food, and summed over NEVO foods consumed per day per individual. The resulting set of intakes was analysed for usual intake with statistical methods developed at Iowa State University [18-20]. Briefly, the method works by first restricting the statistical analysis to the non-zero intake values, and later recombining the results with the perceived frequencies of zero intakes. The non-zero intake values are transformed by an initial logarithmic transformation, and subsequently by a spline function in order to approach normality of the distribution of transformed values as good as possible. For these assumedly normally distributed values the variance components within individuals and between individuals are calculated. In this step heterogeneity of variance within individuals (people can have more or less variable consumption habits) is allowed for by application of a measurement error model. For usual intake the within-individual variation is not relevant. The between-within-individual variance component is used to construct a normal distribution of usual intake at the transformed scale, which is subsequently back-transformed to the original intake scale. For details of the method see the papers mentioned earlier [18-20] or Dodd [21].
BDE congener and ΣBDE intake was calculated for the total Dutch population. Estimated intakes were adjusted for the individual’s self-reported body weight and expressed in ‘ng/kg bw/day’. Samples with levels below LOD, the so-called non-detects, were assigned levels equal to ½LOD. The LOD was determined separately for each analysis.
3.2.2 Contribution of food subcategories to intake
To calculate the contribution of the different food subcategories to the long-term BDE congener and ΣBDE intake, we calculated the intake by multiplying 500,000 randomly drawn consumption patterns from the food consumption database with the BDE congener levels per NEVO food. The resulting set of intakes was used to assess the contribution. Non-detects were assigned levels equal to ½LOD.
3.3 Uncertainty analyses
We performed two uncertainty analyses to assess the impact of these uncertainties on the exposure estimates. These analyses included 1) model uncertainty and 2) uncertainty related to non-detects.
3.3.1 Model uncertainty
To assess the uncertainty related to the correctness of the assumptions underlying the model used to calculate the exposure, calculations were repeated using the STatistical Exposure Model (STEM), developed by Slob [22,23] at RIVM. This model uses the same input data as MCRA, but uses a different technique to transform daily intakes to long-term intakes. Briefly, as by MCRA, first all daily consumption patterns are multiplied with the BDE congener or ΣBDE level per food, and summed over foods. This was performed by FRIDGE (Food classification for RIsk analysis and Dietary and inGestive Exposure assessment) software [16]. To convert the set of daily intakes to usual intake
distributions the STatistical Exposure Model (STEM) was used. STEM models the mean dietary intake as a function of age. For this, it transforms the data logarithmically, performs a regression analysis of log-intake on age, estimates the intra-individual (day-to-day) variance from the residuals, subtracts the intra-individual variance from the total variance to obtain the inter-individual (between-subject) variance and returns the percentiles of the long-term (usual) intake. Further details on the procedure and an extensive evaluation of the assumptions inherent of the method can be found in Slob [22,23].
3.3.2 Uncertainty related to non-detects
The uncertainty related to non-detects is the uncertainty related to the level assigned to those samples with levels below LOD. To assess this, we repeated the exposure calculations as described in § 3.2.1 by replacing the levels below LOD with zero. This was done for all six congeners and ΣBDE. We also calculated the contribution of the different food subcategories to the BDE47, BDE183 and ΣBDE intake as described in § 3.2.2.
4
RESULTS
4.1 BDE congener levels in food
The results of the analytical chemical analyses are summarised in Annex C (Table C.1-4) for each of the food subcategories. BDE47 and BDE99 were detected in almost all samples, whereas BDE100 and BDE153+154 were almost exclusively detected in fish and crustacean samples. BDE183 was only detected in a few samples. In summary, assuming levels below LOD equalled 0 ng/g product or fat: Meat, dairy products and eggs: Concentrations of ΣBDE varied between 0 and 0.22 ng/g product. The highest values were measured in butter and cheese, the lowest in mixed meat.
Fruit and cereals: ΣBDE concentrations in fruit and cereals were relatively low: 0.004 and 0.015 ng/g product, respectively.
Oils and fats: ΣBDE level in vegetable oils and fats was considerable, 0.88 ng/g product. The concentration in industrial oils and fats was 0.12 ng/g product. The concentrations in the animal fat samples were in between (0.24-0.37 ng/g product, which is 100% fat). This was not equal to the fat-based concentrations in meat (1.08-4.20 ng/g fat).
Fish: Overall, the concentrations of ΣBDE in fish and crustaceans were higher than in meat, except for tuna fish. The highest average concentrations were found in fatty fish, especially herring (5.1 ng/g product). The lowest values were found in tuna fish (0.02 ng/g product).
4.2 Exposure levels to BDE congeners and ΣBDE in the general Dutch
population
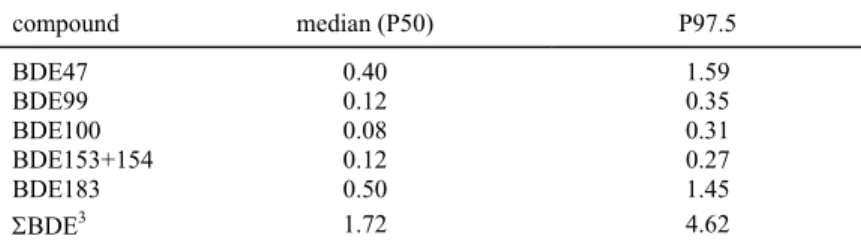
Table 2 lists the median (P50) and the 97.5th percentile (P97.5) of long-term exposure for the six BDE congeners and ΣBDE. The median exposure ranged from 0.08 ng/kg bw/day (BDE100) to 0.50 ng/kg bw/day (BDE183). BDE47 had the highest P97.5 exposure level (1.59 ng/kg bw/day). The median usual intake of ΣBDE was 1.72 ng/kg bw/day (P97.5 = 4.62 ng/kg bw/day).
In figure 1 we plotted the most important food subcategories contributing to BDE47, BDE183 and ΣBDE exposure. BDE47 and BDE183 were selected because they had the highest intake levels in the total population (Table 2). The main products contributing to the ΣBDE intake were oils & fats, milk, and fish (herring), which corresponds with the BDE levels measured in these products. The food
Table 2. Percentiles of long-term dietary intake to BDE1 congeners and ΣBDE (ng/kg bw/day) in the total Dutch
population calculated with MCRA2. Levels below limit of detection (LOD) were set at ½LOD.
compound median (P50) P97.5 BDE47 0.40 1.59 BDE99 0.12 0.35 BDE100 0.08 0.31 BDE153+154 0.12 0.27 BDE183 0.50 1.45 ΣBDE3 1.72 4.62
1 BDE = brominated diphenyl ether
2 MCRA = Monte Carlo Risk Assessment programme
subcategories contributing most to the intake varied between the congeners, due to the varying presence of congeners. For the two congeners, BDE47 and BDE183, milk and oils & fats were respectively the main products contributing to the BDE congener intake. In the upper intake
percentiles for all BDE congeners except BDE183, herring was the main source of BDE exposure. For ΣBDE even over 80% originated from fish (herring).
4.3 Scenario’s regarding uncertainty analyses
4.3.1 Model uncertaintyTo assess model uncertainty in the outcome of the exposure calculations, we calculated the long-term exposure using STEM. Results for the median and the P97.5 intake of the different BDE congeners and ΣBDE are listed in Table 3. It is clear that the median exposure levels calculated with STEM were similar to those calculated with the MCRA programme. This was true for all six congeners and ΣBDE. The P97.5 of exposure tended however to be lower than the levels calculated with MCRA. Differences ranged from 15% lower for BDE153+154 to 48% lower for BDE100.
4.3.2 Levels assigned to non-detects
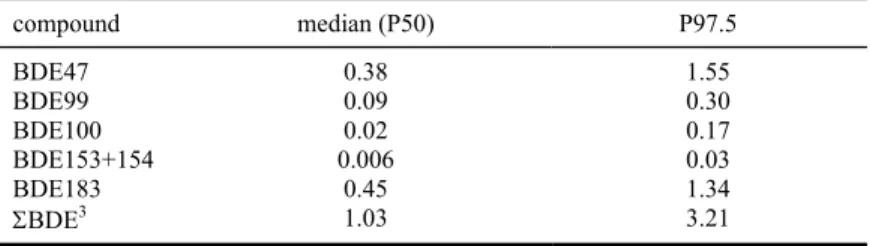
In the results presented in § 4.2 non-detects were assigned ½LOD. To assess the uncertainty related to this choice, we repeated the analyses by assigning zero to these samples. Results are presented in Table 4 and show that for some congeners (such as BDE47, BDE99 and BDE183) the exposure was
BDE 183 others 21% cake&biscuit 3% meat 1% crips&snack 13% oils&fats 62% b BDE 47 fish 20% oils&fats 2% milk 49% meat 1% others 19% cheese 4% cake &biscuit 5% a
Fig. 1. Contribution of the different food subcategories to the intake of (a) BDE47, (b) BDE183 and (c)
the sum of BDE congeners (includes BDE congeners 28, 47, 66, 85, 99, 100, 138, 153+154, 183). Levels below the limit of detection (LOD) were set at ½LOD (BDE = brominated diphenyl ether).
sum of BDE crips&snack 6% cake&biscuit 5% oils&fats 25% milk 19% fish 13% meat 11% others 17% cheese 4% c
Table 3. Percentiles of long-term dietary intakes to BDE1 congeners and ΣBDE (ng/kg bw/day) by the
total Dutch population calculated with STEM2. Levels below limit of detection (LOD) were set
at ½LOD. compound median (P50) P97.5 BDE47 0.40 1.09 BDE99 0.11 0.21 BDE100 0.08 0.14 BDE153+154 0.12 0.23 BDE183 0.42 1.19 ΣBDE3 1.73 3.33
1 BDE = brominated diphenyl ether
2 STEM = STatistical Exposure Model
more or less unaffected by the level assigned. However, for other congeners the exposure decreased substantially. This was also true for the ΣBDE intake: median exposure decreased from 1.72 ng/kg bw/day to 1.03 ng/kg bw/day. The contribution of the different subcategories was hardly affected by the level assigned to the non-detects (results not shown).
Table 4. Percentiles of long-term dietary intake to BDE1 congeners and ΣBDE (ng/kg bw/day) in the total
Dutch population calculated with MCRA2. Levels below limit of detection (LOD) were set at
zero. compound median (P50) P97.5 BDE47 0.38 1.55 BDE99 0.09 0.30 BDE100 0.02 0.17 BDE153+154 0.006 0.03 BDE183 0.45 1.34 ΣBDE3 1.03 3.21
1 BDE = brominated diphenyl ether
2 MCRA = Monte Carlo Risk Assessment programme
5
DISCUSSION
5.1 Exposure estimation
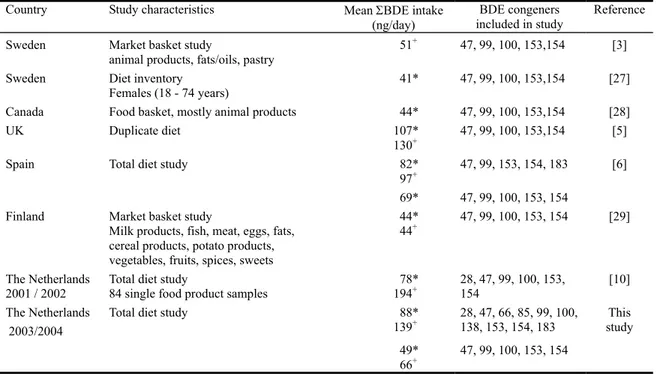
The P50 of long-term intake of the sum of BDE congeners (ΣBDE) in the total Dutch population was 1.72 ng/kg bw/day. BDE47 and BDE183 contributed most to the total BDE congener intake with oils and fats, milk and fish being the most important sources. There have been some earlier studies examining the dietary exposure to BDEs. For an overview see Table 5. The results presented in this table are short-term mean exposure levels. We therefore also calculated the mean short-term ΣBDE intake: 88 ng/day (non-detects equal to zero) and 139 ng/day (non-detects equal to ½LOD). It is clear that the intake reported in the other studies were either higher or lower than those reported in this study. One explanation for this is the difference in congeners addressed. To be able to compare the intakes reported in the different countries with the results of the present study, we recalculated the ΣBDE intake addressing only the sum of BDE congeners 47, 99, 100, 153 and 154, the combination of congeners addressed in Sweden, Canada, UK, Spain and Finland. This resulted in ΣBDE intake levels of 49 ng/day (non-detects equal to zero) and 66 ng/day (non-detects equal to ½LOD). Comparing these intakes with those reported elsewhere showed that the intake calculated with LOD equal to zero was similar to the intakes estimated in Canada, Sweden and Finland, and lower than those reported in Spain and UK (Table 5). The intake with LOD equal to ½LOD was somewhat higher than in Finland and Sweden, and again lower than that reported in the UK. For Spain no intake calculation was reported for these five congeners for LOD equal to ½LOD.
Table 5. Dietary ΣBDE1 intake in different countries
Country Study characteristics Mean ΣBDE intake
(ng/day)
BDE congeners included in study
Reference
Sweden Market basket study
animal products, fats/oils, pastry 51
+ 47, 99, 100, 153,154 [3]
Sweden Diet inventory
Females (18 - 74 years)
41* 47, 99, 100, 153,154 [27]
Canada Food basket, mostly animal products 44* 47, 99, 100, 153,154 [28]
UK Duplicate diet 107*
130+ 47, 99, 100, 153,154 [5]
Spain Total diet study 82*
97+ 47, 99, 153, 154, 183 [6]
69* 47, 99, 100, 153, 154
Finland Market basket study
Milk products, fish, meat, eggs, fats, cereal products, potato products, vegetables, fruits, spices, sweets
44*
44+ 47, 99, 100, 153, 154 [29]
The Netherlands
2001 / 2002 Total diet study 84 single food product samples 19478* + 28, 47, 99, 100, 153, 154 [10]
The Netherlands 2003/2004
Total diet study 88*
139+ 28, 47, 66, 85, 99, 100, 138, 153, 154, 183 study This
49*
66+ 47, 99, 100, 153, 154
1 ΣBDE = sum of brominated diphenyl ether congeners
* levels below limit of detection (LOD) were assigned the level zero
5.2 Uncertainty analyses
To address the uncertainty in the exposure assessment conducted in this report, and which may generally apply to other exposure assessments, we studied two sources of uncertainly. Model uncertainty is uncertainty about the correctness of the assumptions underlying the applied model. Uncertainty about non-detects is the uncertainty related to the level assigned to those samples. These two types of uncertainty will be discussed below.
5.2.1 Model uncertainty
To address model uncertainty we calculated the exposure using two different models, MCRA and STEM. Both approaches are based on a variance components model to calculate usual intake percentiles from daily intake values. However, the approaches differ in several important respects. First, the variance components model is based on normality and on homogeneous variances (equal variance between days for all consumers). Whereas STEM applies a lognormal transformation of the daily intakes to obtain approximate normality, MCRA applies a combination of two transformations: first a lognormal and then a spline transformation, which can for example correct for bimodality (two ‘humps’ in the distribution). A second difference is that MCRA accommodates non-homogeneous variances by using an adapted model, whereas STEM relies on the assumption of homogeneous variances (this was found to be adequate in specific cases in simulations by Slob [22]. A third important difference is also the incorporation of age-dependency, modelled within STEM and not within MCRA.
The general result of the comparison between MCRA en STEM showed that intakes estimated with MCRA tended to be higher compared to STEM (Table 2 and 3). In the current study it was not investigated which of the differences between STEM and MCRA were responsible for this difference. Clearly, this is a relevant point for future research.
5.2.2 Levels assigned to non-detects
A source of uncertainty in exposure assessments that include samples containing residue levels below LOD (so-called non-detects) is the level assigned to these samples. Levels assigned can range from zero (no residue) up to the LOD level (worst-case assumption). The effect of the level chosen on the result of the exposure assessment will depend on the percentage of non-detects, the level assigned, the relative magnitude of the LOD versus the levels measured, and the percentile of exposure of interest. For example, when only a few samples are non-detects the impact of assigning a level to these samples on the exposure will be negligible. Also when you are interested in a high percentile of the exposure distribution the effect of assigning zero or LOD to the non-detects may be of less interest than when you are interested in a low percentile.
In this report we assigned zero or ½LOD to the non-detects. The largest increase in exposure was shown for congeners BDE153+154 and BDE100, 1900% and 300% increase of the median exposure, respectively. The smallest increase was shown for BDE47, about 5%. This difference can be explained by the fact that for only three food subcategories (industrial and vegetable oils & fats, and mixed meat) no BDE47 levels could be detected, while for BDE153+154 and BDE100 only one or two food subcategories (eggs for BDE153 and BDE100, and cheese for BDE100) contained levels at or above LOD (Annex C). Replacing all the zero levels for the other food subcategories with ½LOD will have a large impact on the resulting exposure level.
Deciding to assign a level to the non-detects will depend on whether you expect those samples to contain any residue (e.g. based on the samples with a level at or above LOD). For example, in pesticide risk assessment the US Environmental Protection Agency developed a method in which the percentage of the non-detects assigned a level between zero and LOD depends on the percentage of the crop that has been treated with the pesticide [24]. However, in the case of environmental contaminants, which are omnipresent, this method cannot be used. In this report none of the food subcategories contained BDE154 and it may therefore be questionable whether assigning ½LOD to all these food subcategories does not overestimate the exposure. On the other hand, BDE47 and BDE99 were present in almost all food subcategories, and it may therefore be realistic that also those subcategories not containing levels above LOD may have contained some BDE.
5.2.3 Sampling uncertainty
Apart from the two uncertainties addressed above, exposure calculations inherently also include sampling uncertainty. This ‘third’ type of uncertainty is related to the quality of input data (in our case food consumption and residue levels) used in the exposure assessment. In the assessment performed in this study we used just one BDE congener level per food subcategory obtained from a composite sample consisting of a large sample of food items, or at least two (but still based on mixed samples) levels for the fish and crustaceans group. This choice of sampling was based on the available resources (measurements are expensive), and the long-term toxicity of BDE congeners. Because it is still uncertain how levels of BDE congeners in food items will develop over time (see also chapter 1), it is important to monitor the levels every one to two years in a most cost effective way and to perform corresponding intake calculations. Due to this way of sampling quantification of the uncertainty in the BDE congener levels used in the present intake estimations is not possible. However this uncertainty is expected to be substantial, and therefore a relevant point for future research could be the analysis of individual food items or, to reduce costs, to analyse more than one (composite) sample.
The other input variable that is subject to uncertainty is consumption. To quantify this uncertainty the bootstrap method [25,26] can be used. Simply said, with this method a sample of n observations (e.g. food consumption levels) is resampled from the original consumption database consisting of also n observations. Sampling is performed with replacement so that every observation can occur more than once in the bootstrap sample. By repeating this process many times (say 100), one obtains 100 bootstrap samples, which each consists of the same number of observations as in the original dataset (in our case 6,250). These bootstrap samples can be considered as alternative data sets that, given the variation in consumption within a population, could have been obtained during sampling from the population of interest. This method has been implemented in MCRA and showed that the P95 of exposure to ΣBDE could have been somewhere between a range of levels 17% higher or lower (2.5% and 97.5% confidence limits). Uncertainty in exposure calculations can thus be quantified and should be addressed when possible to evaluate the outcome of exposure calculations. The estimates of uncertainty given above were based on bootstrapping of short-term exposure and may therefore be only indicative of the uncertainty that exits in the long-term exposure levels presented here. An updated version of MCRA (3.5) will include the possibility to bootstrap long-term exposure assessment. We therefore recommend further elaboration related to bootstrapping of data when assessing long-term exposure in future projects.
5.3 Conclusions
In this report we calculated the exposure to BDE congeners using Dutch food consumption data and residue levels of several congeners as measured in foods as eaten. The P50 of long-term intake of the sum of BDE congeners (ΣBDE) in the total Dutch population was 1.72 ng/kg bw/day. BDE47 and BDE183 contributed most to the total BDE congener intake with oils and fats, milk and fish being the most important sources. We demonstrated that the intakes were similar to the intakes in Canada, Sweden and Finland, and lower than those reported in Spain and UK (non-detects equal to zero). The results of the present study were discussed in relation to different types of uncertainty, namely model uncertainty, uncertainty related to samples with levels below LOD and sampling uncertainty. The following conclusions could be drawn:
a. Research into the underlying differences between STEM and MCRA which resulted in different intake levels of BDE congeners form a relevant point for future research.
b. Sampling uncertainty is inherently present in exposure calculations based on empirically derived input data and should be considered, if possible, to evaluate the outcome of the exposure
calculations. For this the bootstrap procedure can be used and it is therefore recommended to elaborate further on bootstrapping of data when assessing long-term exposure in future projects. c. It is recommended in the future to analyse individual food items or, to reduce costs, to analyse
6
ACKNOWLEDGEMENTS
We would like to thank ing. Willie Hijman for her contribution to this report considering the chemical analysis of BDE congeners.
References
[1] M. Alaee, R.J. Wenning, The significance of brominated flame retardants in the environment: current understanding, issues and challenges, Chemosphere 46 (2002) 579-582.
[2] P.O. Darnerud, Toxic effects of brominated flame retardants in man and in wildlife, Environment International 29 (2003) 841-853.
[3] P.O. Darnerud, G.S. Eriksen, T. Johannesson, P.B. Larsen, M. Viluksela, Polybrominated diphenyl ethers: occurence, dietary exposure and toxicology, Environmental Health Perspectives 109 (2001) 49-68.
[4] J.L. Domingo, Human exposure to polybrominated diphenyl ethers through the diet, Journal of Chromatography A 1054 (2004) 321-326.
[5] S. Harrad, R. Wijesekera, S. Hunter, C. Halliwell, R. Baker, Preliminary assessment of U.K. human dietary exposure to polybrominated diphenyl ethers, Environmental Science and Technology 38 (2004) 2345-2350.
[6] A. Bocio, J.M. Llobet, J.L. Domingo, J. Corbella, A. Teixido, C. Casas, Polybrominated diphenyl ethers (PBDEs) in foodstuffs: human exposure through the diet, Journal of Agricultural and Food Chemistry 51 (2003) 3191-3195.
[7] S.R. Wild, K.C. Jones, A.E. Johnston, The polynuclear aromatic hydrocarbon (PAH) content of herbage from a long-term grassland experiment, Atmospheric Environment, Part A, General Topics 26 (1992) 1299-1307.
[8] A. Schecter, O. Papke, K. Tung, D. Staskal, L. Birnbaum, Polybrominated diphenyl ethers contamination of United States food, Environmental Science and Technology 38 (2004) 5306-5311.
[9] Y. Lind, P.O. Darnerud, S. Atuma, M. Aune, W. Becker, R. Bjerselius, S. Cnattingius, A. Glynn, Polybrominated diphenyl ethers in breast milk from Uppsala county, Sweden, Environmental Research 93 (2003) 186-194.
[10] R. de Winter-Sorkina, M.I. Bakker, G. van Donkersgoed, J.D. van Klaveren, Dietary intake of brominated flame retardants by the Dutch population, Report nr.: 310305001/2003,
RIVM/RIKILT, Bilthoven, 2003, available at http://www.rivm.nl/bibliotheek/rapporten/ rapporten2003.html.
[11] Anonymous, Zo eet Nederland 1998 [Results of the Dutch National Food Consumption Survey 1997-1998], Voedingscentrum, Den Haag, 1998.
[12] NEVO-tabel, Nederlands voedingsstoffenbestand 1996 [Dutch Food Composition Table 1996], Stichting NEVO, Voedingscentrum, Den Haag, 1996.
[13] C. Kistemaker, M. Bouman, K.F.A.M. Hulshof, De consumptie van afzonderlijke producten door Nederlandse bevolkingsgroepen - Voedselconsumptiepeiling 1997-1998 [Consumption of food products by Dutch population groups - Dutch National Food Consumption Survey 1997-1998], Report nr.: V98.812, TNO-Voeding, Zeist, 1998.
[14] S.P.J. Leeuwen, H. Pieters, J. de Boer, A. de Mul, Levels of brominated flame retardants in Dutch fish and shellfish including an estimation of the dietary intake, Netherlands Institute for Fisheries Research (RIVO) and RIKILT-Institute of Food Safety, 2005 (in press).
[15] M.M.H. van Dooren, I. Boeijen, J.D. van Klaveren, G. van Donkersgoed, Conversie van consumeerbare voedingsmiddelen naar primaire agrarische produkten [Conversion of foods to primary agricultural commodities], Report nr.: 95.17, RIKILT-DLO, Wageningen, The Netherlands, 1995.
[16] J.I. Freijer, R. Hoogerbrugge, J.D. van Klaveren, W.A. Traag, L.A.P. Hoogenboom, A.K.D. Liem, Dioxins and dioxin-like PCBs in foodstuffs: Occurence and dietary intake in The Netherlands at the end of the 20th century, Report nr.: 639102 022, RIVM/RIKILT, Bilthoven, 2001.
[17] H. van der Voet, W.J. de Boer, P.E. Boon, G. van Donkersgoed, J.D. van Klaveren, MCRA, a web-based program for Monte Carlo Risk Assessment, Release 3, Reference Guide, Biometris/ RIKILT, Wageningen UR, Wageningen, 2004, available at
http://mcra.rikilt.wur.nl/mcra/Reference%20Guide%20MCRA_3.pdf.
[18] S.M. Nusser, A.L. Carriquiry, K.W. Dodd, W.A. Fuller, A semiparametric transformation approach to estimating usual daily intake distributions, Journal of the American Statistical Association 91 (1996) 1440-1449.
[19] S.M. Nusser, W.A. Fuller, P.M. Guenther, Estimating usual dietary intake distributions: adjusting for measurement error and nonnormality in 24-hour food intake data, in: L. Lyberg, P. Biemer, M. Collins, E. DeLeeuw, C. Dippo, N. Schwartz and D. Trewin (Eds.), Survey measurement and process quality, Wiley, New York, 1997, pp. 689-709.
[20] P.M. Guenther, P.S. Kott, A.L. Carriquiry, Development of an approach for estimating usual nutrient intake distributions at the population level, Journal of Nutrition 127 (1997) 1106-1112.
[21] K.W. Dodd, A technical guide to C-SIDE, Technical Report 96-TR 32, Department of Statistics and Center for Agricultural and Rural Development, Iowa State University, Ames, Iowa, 1996.
[22] W. Slob, Modeling long-term exposure of the whole population to chemicals in food, Risk Analysis 13 (1993) 525-530.
[23] W. Slob, Modelling human exposure to chemicals in food, Report nr.: 639102002, RIVM, Bilthoven, 1993.
[24] US EPA, Assigning values to non-detected/non-quantified pesticide residues in human health food exposure assessments, Report nr.: 6047, US Environmental Protection Agency,
Washington DC, 2000.
[25] B. Efron, Bootstrap methods: another look at the jackknife, Annals of Statistics 7 (1979) 1-26. [26] B. Efron, R. Tibshirani, An introduction to the bootstrap, Chapman & Hall, New York, 1993. [27] Y. Lind, M. Aune, S. Atuma, W. Becker, R. Bjerselius, A. Glynn, P.O. Darnerud, Food intake
of the brominated flame retardants PBDEs and HBCD in Sweden, Organohalogen Compounds 58 (2002) 181-184.
[28] J.J. Ryan, R. Patry, Body burdens and food exposure in Canada for polybrominated diphenyl ethers (BDEs), Organohalogen Compounds 51 (2001) 226.
[29] H. Kiviranta, M.-L. Ovaskainen, T. Vartiainen, Market basket study on dietary intake of PCDD/Fs, PCBs, and PBDEs in Finland, Environment International 30 (2004) 923-932.
ANNEX A Food subcategories and their composition
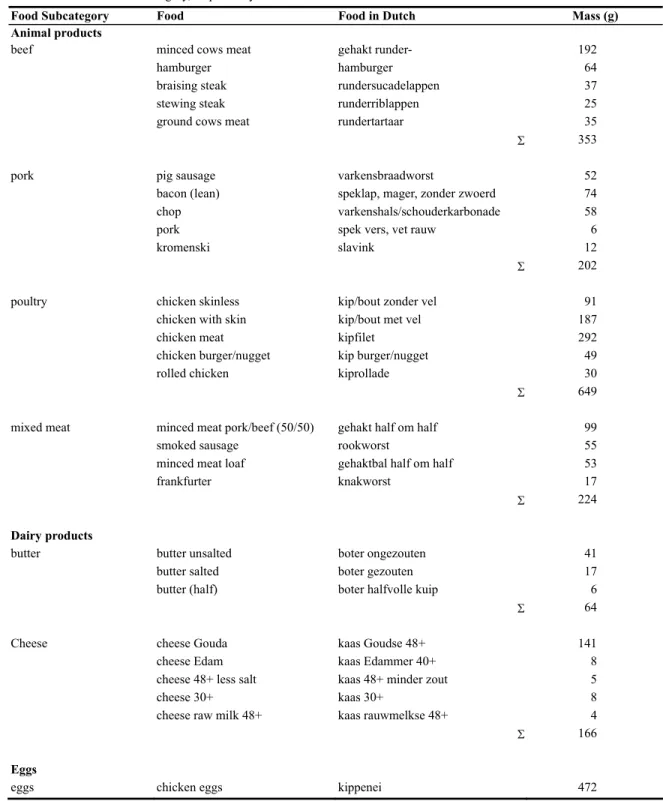
Table A.1. Composition of the food subcategories that represent at least 95% of the fat intake of the respective food
subcategories. For cereals and fruit the composition represents at least 95% and 92% of the food intake of the subcategory, respectively.
Food Subcategory Food Food in Dutch Mass (g) Animal products
beef minced cows meat gehakt runder- 192
hamburger hamburger 64
braising steak rundersucadelappen 37
stewing steak runderriblappen 25
ground cows meat rundertartaar 35
Σ 353
pork pig sausage varkensbraadworst 52
bacon (lean) speklap, mager, zonder zwoerd 74
chop varkenshals/schouderkarbonade 58
pork spek vers, vet rauw 6
kromenski slavink 12
Σ 202
poultry chicken skinless kip/bout zonder vel 91
chicken with skin kip/bout met vel 187
chicken meat kipfilet 292
chicken burger/nugget kip burger/nugget 49
rolled chicken kiprollade 30
Σ 649
mixed meat minced meat pork/beef (50/50) gehakt half om half 99
smoked sausage rookworst 55
minced meat loaf gehaktbal half om half 53
frankfurter knakworst 17
Σ 224
Dairy products
butter butter unsalted boter ongezouten 41
butter salted boter gezouten 17
butter (half) boter halfvolle kuip 6
Σ 64
Cheese cheese Gouda kaas Goudse 48+ 141
cheese Edam kaas Edammer 40+ 8
cheese 48+ less salt kaas 48+ minder zout 5
cheese 30+ kaas 30+ 8
cheese raw milk 48+ kaas rauwmelkse 48+ 4
Σ 166
Eggs
Table A.1.(continued)
Food Subcategory Food Food in Dutch Mass (g) Industrial oils and fats
industrial oils/fats low-fat margarine halvarine 43
cooking-fat vet bak- en braad- 15
frying-fat vet frituur- 5
French fries frites bereid 71
puff pastry korstgebak (bladerdeeg) 144
Σ 278
Vegetable / fruit products
vegetable oils/fats margarine margarine, kuipje/pak 41
low-fat margarine halvarine 10
cooking-fat vet bak- en braad- 3
potato crisps chips 22
mayonnaise (80 % oil) mayonaise (80% olie) 5
Σ 81
cereals wheat bread tarwebrood 835
wholemeal bread volkorenbrood 570
white bread witbrood 450
müsli muesli 23
gingerbread ontbijtkoek 52
Σ 1930
fruit apple appel 61
orange sinaasappel 56 banana banaan 14 grape druif 14 mandarin mandarijn 9 pear peer 8 strawberry aardbei 4 grapefruit grapefruit 4 kiwi kiwi 2 peach perzik 2 Σ 174
Table A.2. Composition of the food subcategories analysed either by RIVO (fish samples) or RIVM (tuna fish, milk,
animal fat). These samples were measured directly, i.e. not in a sample composed of several items from one category.
Food Subcategory Food Food in Dutch Fish
lean fish1 cod kabeljauw
plaice schol coal-fish koolvis haddock schelvis sole tong flounder bot pikeperch snoekbaars
tuna fish2 tuna (tin) tonijn (blik)
fatty fish1 herring haring
Eel3 paling
mackerel makreel
salmon zalm
crustaceans1 mussels mosselen
shrimps garnalen
Milk
milk milk, semi-skimmed halfvolle melk
Animal fat4
pork fat beef fat chicken fat
1 Samples from composite samples (2003) analysed by RIVO
2 Sampled by RIVM (n=11)
3 Farmed eel (n = 2), IJselmeer eel (n = 1) and other eel (n = 13)
4 Composite samples collected by RIKILT (originally from slaughterhouses) and analysed by RIVM
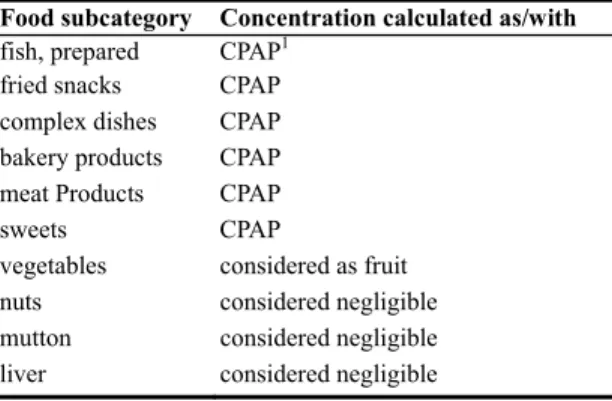
Table A.3. Composition of the food subcategories that were recognised to contain BDE congeners, but which
were not sampled or analysed.
Food subcategory Concentration calculated as/with
fish, prepared CPAP1
fried snacks CPAP
complex dishes CPAP
bakery products CPAP
meat Products CPAP
sweets CPAP
vegetables considered as fruit
nuts considered negligible
mutton considered negligible
liver considered negligible
ANNEX B Analysed brominated diphenyl ether (BDE) congeners BDE17 2,2’,4-Tribromodiphenyl ether
BDE28 2,4,4’-Tribromodiphenyl ether BDE47 2,2’,4,4’-Tetrabromodiphenyl ether BDE66 2,3’,4,4’-Tetrabromodiphenyl ether BDE85 2,2’,3,4,4’-Pentabromodiphenyl ether BDE99 2,2’,4,4’,5-Pentabromodiphenyl ether BDE100 2,2’,4,4’,6-Pentabromodiphenyl ether BDE138 2,2’,3,4,4’,5’-Hexabromodiphenyl ether BDE153 2,2’,4,4’,5,5’-Hexabromodiphenyl ether BDE154 2,2’,4,4’,5,6’-Hexabromodiphenyl ether BDE183 2,2’,3,4,4’,5’,6-Heptabromodiphenyl ether
ANNEX C Concentrations of brominated diphenyl ether (BDE) congeners per food category
Table C.1. Average concentration of brominated diphenyl ether (BDE) congeners and the sum of BDE congeners
(ΣBDE)1 (ng/g product) in food subcategories analysed in the present study (for tuna fish, see Table C.3).
Scenario 1: samples < LOD2 = 0.
Food subcategory Fat (%) BDE47 BDE99 BDE100 BDE153 BDE154 BDE183 ΣBDEs1
butter 81.4 0.125 0.090 0 0 0 0 0.215
cheese 31.1 0.065 0.057 0.024 0 0 0 0.146
eggs 9.8 0.022 0.022 0.013 0.095 0 0.024 0.090
vegetable oils & fats 56.8 0 0.027 0 0 0 0.857 0.884
industrial oils & fats 35.3 0 0 0 0 0 0.119 0.119
cereals 1.1 0.010 0.004 0 0 0 0 0.015 fruit 0 0.004 0 0 0 0 0 0.004 beef 15.8 0.018 0.020 0 0 0 0 0.038 pork 26.0 0.037 0.036 0 0 0 0 0.073 poultry 9.2 0.017 0.019 0 0 0 0 0.035 mixed meat 22.4 0 0 0 0 0 0 0 milk 1.4 0.028 0 0 0 0 0 0.028 beef fat 100 0.189 0.183 0 0 0 0 0.372 pork fat 100 0.079 0.158 0 0 0 0 0.237 poultry fat 100 0.079 0.158 0 0 0 0 0.237 1 Sum of BDE 28, 47, 66, 85, 99, 100, 138, 153, 154, 183
2 LOD = limit of detection
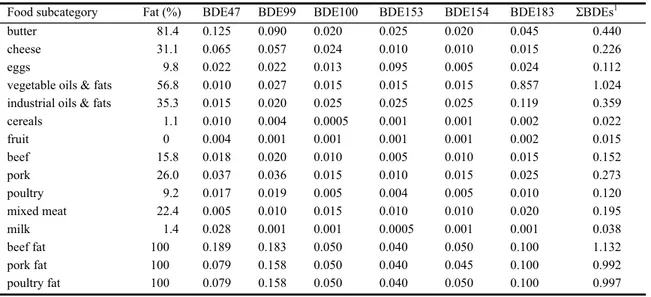
Table C.2. Average concentration of brominated diphenyl ether (BDE) congeners and the sum of BDE congeners
(ΣBDE)1 (ng/g product) in food subcategories anayled in the present study (for tuna fish, see Table C.4).
Scenario 2: samples < LOD2 = ½LOD.
Food subcategory Fat (%) BDE47 BDE99 BDE100 BDE153 BDE154 BDE183 ΣBDEs1
butter 81.4 0.125 0.090 0.020 0.025 0.020 0.045 0.440
cheese 31.1 0.065 0.057 0.024 0.010 0.010 0.015 0.226
eggs 9.8 0.022 0.022 0.013 0.095 0.005 0.024 0.112
vegetable oils & fats 56.8 0.010 0.027 0.015 0.015 0.015 0.857 1.024
industrial oils & fats 35.3 0.015 0.020 0.025 0.025 0.025 0.119 0.359
cereals 1.1 0.010 0.004 0.0005 0.001 0.001 0.002 0.022 fruit 0 0.004 0.001 0.001 0.001 0.001 0.002 0.015 beef 15.8 0.018 0.020 0.010 0.005 0.010 0.015 0.152 pork 26.0 0.037 0.036 0.015 0.010 0.015 0.025 0.273 poultry 9.2 0.017 0.019 0.005 0.004 0.005 0.010 0.120 mixed meat 22.4 0.005 0.010 0.015 0.010 0.010 0.020 0.195 milk 1.4 0.028 0.001 0.001 0.0005 0.001 0.001 0.038 beef fat 100 0.189 0.183 0.050 0.040 0.050 0.100 1.132 pork fat 100 0.079 0.158 0.050 0.040 0.045 0.100 0.992 poultry fat 100 0.079 0.158 0.050 0.040 0.050 0.100 0.997 1 Sum of BDE 28, 47, 66, 85, 99, 100, 138, 153, 154, 183
Table C.3. Average concentration of brominated diphenyl ether (BDE) congeners and the sum of BDE congeners
(ΣBDE)1 (ng/g product) in fish and crustaceans, sampled and analysed by RIVO, except for tuna fish,
which was sampled and analysed by RIVM. Scenario 1: Samples < LOD2 = 0.
Fish Fat (%) BDE47 BDE99 BDE100 BDE153+154 BDE183 ΣBDEs1
cod 0.8 0.20 0 0.20 0.005 0 0.69 coalfish 1.1 0.20 0 0.05 0 0 0.35 plaice 0.9 0.25 0 0.08 0.02 0 0.35 sole 1.2 0.20 0.05 0.05 0.05 0 0.35 tuna fish 1.2 0.005 0 0 0 0 0.02 mackerel 11 0.53 0.47 0.13 0.10 0 1.53 herring 17.2 2.90 0.68 0.93 0.10 0 5.07 eel 27.8 2.44 0.28 0.88 0.24 0.09 4.07 salmon 11.9 0.80 0.35 0.15 0.05 0 1.80 mussels 2.2 0.53 0.20 0.20 0.10 0 1.43 shrimp 2.2 0.35 0.40 0 0.10 0 0.90 1Sum of BDE 28, 47, 66, 85, 99, 100, 138, 153,154,183
2 LOD = limit of detection
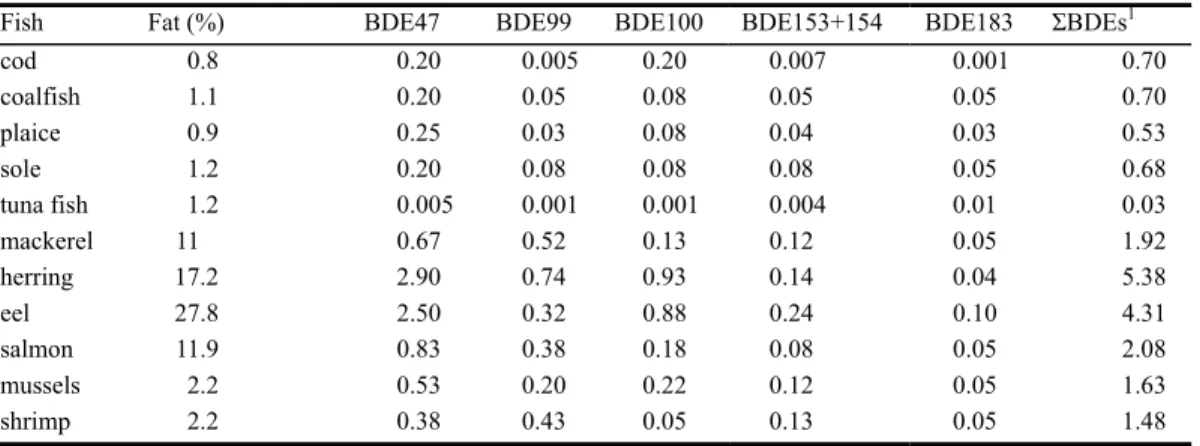
Table C.4. Average concentration of brominated diphenyl ether (BDE) congeners and the sum of BDE congeners
(ΣBDE)1 (ng/g product)) in fish and crustaceans, sampled and analysed by RIVO, except for tuna fish,
which was sampled and analysed by RIVM. Scenario 2: Samples < LOD2 = ½LOD.
Fish Fat (%) BDE47 BDE99 BDE100 BDE153+154 BDE183 ΣBDEs1
cod 0.8 0.20 0.005 0.20 0.007 0.001 0.70 coalfish 1.1 0.20 0.05 0.08 0.05 0.05 0.70 plaice 0.9 0.25 0.03 0.08 0.04 0.03 0.53 sole 1.2 0.20 0.08 0.08 0.08 0.05 0.68 tuna fish 1.2 0.005 0.001 0.001 0.004 0.01 0.03 mackerel 11 0.67 0.52 0.13 0.12 0.05 1.92 herring 17.2 2.90 0.74 0.93 0.14 0.04 5.38 eel 27.8 2.50 0.32 0.88 0.24 0.10 4.31 salmon 11.9 0.83 0.38 0.18 0.08 0.05 2.08 mussels 2.2 0.53 0.20 0.22 0.12 0.05 1.63 shrimp 2.2 0.38 0.43 0.05 0.13 0.05 1.48 1Sum of BDE 28, 47, 66, 85, 99, 100, 138, 153,154,183