RIVM-report 320100002/2006
Brominated flame retardants: occurrence, dietary intake and risk assessment
R. de Winter-Sorkina, M.I. Bakker, G. Wolterink, M.J. Zeilmaker
Corresponding author: M.J. Zeilmaker
Centre for Substances and Integrated Risk Assessment mj.zeilmaker@rivm.nl
This investigation has been performed by order and for the account of the Dutch Food and Consumer Product Safety Authority, within the framework of project 320100, ‘Flame retarding substances in the food chain’.
Abstract
Brominated flame retardants: occurrence, dietary intake and risk assessment
Brominated flame retardants have entered the human food chain. For the time being the occurrence of these chemicals in Dutch food does not pose a human health risk. However, this might easily change at increasing contents of flame retardants in Dutch food. The monitoring of brominated flame retardants in Dutch food therefore remains necessary.
Brominated flame retardants are environmental contaminants which have entered the human food chain. Next to food these chemicals can also enter the human body by ingestion of housedust. Due to their persistent behaviour brominated flame retardants leave the human body very slowly. Brominated flame retardants therefore have bioaccumulating properties. In order to determine the health risk of brominated flame retardants these chemicals have been investigated in Dutch food product and, as a measure of the amount in the body, in Dutch breast milk. In Dutch food twelve flame retardants were found, eleven of which also occurred in breast milk. Contrary to results in Sweden the content of flame retardants in Dutch breast milk did not decline between 1998 and 2003.
For health risk assessment a maximal allowed intake level is needed. Such an intake level is only available for the flame retardant PolyBromoDiphenylEther-99 (PBDE-99). At the moment the exposure to PBDE-99 from food equals its maximal intake level. So, though the exposure to PBDE-99 does not pose an immediate health risk, this may easily change when the content of brominated flame retardants in Dutch food would increase. The continuous monitoring of brominated flame retardants in Dutch food therefore remains necessary. Key words: brominated flame retardants, food, dietary intake, risk assessment
Rapport in het kort
Gebromeerde vlamvertragers: voorkomen, inname via de voeding en risicoevaluatie
Gebromeerde vlamvertragers zijn tot de voedselketen van de mens doorgedrongen. De aanwezigheid van deze stoffen in voedsel vormt vooralsnog geen risico voor de gezondheid. Dit is wel het geval wanneer het gehalte in voedingsmiddelen toe zou nemen.
Het in kaart brengen van gebromeerde vlamvertragers in voeding blijft daarom nodig.
Vlamvertragers met broom zijn vanuit het milieu in het voedsel terechtgekomen. Vanuit voedsel, maar ook uit bijvoorbeeld huisstof, worden deze stoffen in het lichaam opgenomen. Door hun scheikundige eigenschappen verlaten zij het lichaam maar heel langzaam. Hierdoor slaat het lichaam vlamvertragers in feite op.
Om vast te stellen of blootstelling aan vlamvertragers schadelijk is zijn voedingsmiddelen op aanwezigheid van vlamvertragers onderzocht. Daarnaast is, als maat voor de hoeveelheid in het lichaam, ook moedermelk onderzocht.
In Nederlandse voedingsmiddelen konden twaalf vlamvertragers aangetoond worden. Hiervan bleken er elf ook in moedermelk voor te komen. Het moedermelkonderzoek liet verder zien dat de hoeveelheid vlamvertragers in het lichaam tussen 1998 en 2003 niet afgenomen is. Om vast te stellen of de blootstelling aan vlamvertragers ook risicovol is, moet gewerkt worden met de maximaal dagelijks toelaatbare inname van deze stoffen. Zo’n maximale inname is voor één vlamvertrager beschikbaar. Tussen de blootstelling aan deze
vlamvertrager via de voeding en zijn maximaal toelaatbare inname bestaat slechts een zeer kleine marge. Hoewel er op dit moment nog geen nadelige effect op de gezondheid is, kan dit snel veranderen wanneer het gehalte van vlamvertragers in voedingsmiddelen toe zou nemen. Monitoringsonderzoek naar vlamvertagers in voeding blijft nodig. Daarnaast zou de
blootstelling via huisstof beter in kaart gebracht moeten worden.
Trefwoorden: gebromeerde vlamvertragers, blootstelling, voeding, risicoschatting
Contents
Summary 6
1. Introduction 9
2. Background information 11
2.1 Production and discharge of BFRs 11
2.2 Toxicity and kinetics of BFRs 14
2.2.1 Toxicity studies of BFRs 14
2.2.2 Bioaccumulation of BFRs 15
3. Temporal trends of BFRs in environment and humans 17
3.1 Diet 17
3.2 Meta-analysis of PBDE concentrations in environment and humans 17
3.2.1 Marine mammals 17
3.2.2 Human samples 18
3.3 North America 18
3.4 Japan 19
3.5 Europe 19
3.5.1 Fish and mussels 19
3.5.2 Dated sediment core 22
3.5.3 Birds 22
3.5.4 Human samples 23
4. Brominated flame retardants in the diet 29
4.1 Brominated flame retardants concentrations in food products 29 4.2 Dietary intake estimates of brominated flame retardants from 2001/2002 data 31 4.3 Dietary intake estimates of PBDEs from 2003/2004 data 33
4.4 Comparison of different studies 35
5. Risk assessment of PBDE-99 39
6. Conclusions and recommendations 41
References 43
Appendix 1 PBDE analyses by RIVO and RIVM 55
Appendix 2 Toxicity, kinetics and bioaccumulation of BFRs 57 Appendix 3 Temporal trends of BFRs in environment and humans: North America 67
and Japan
Appendix 4 Comparison of BFR concentrations in food products 73 Appendix 5 Flow diagram of the dietary intake estimation method 81 Appendix 6 Percentiles of the long-term dietary intake distributions of PBDE congeners
in the Dutch population estimated from 2003/2004 data 83
Summary
The study recorded in this report considers the risk assessment and the temporal trends of the three predominant brominated flame retardants (BFRs): hexabromocyclododecane (HBCDD), tetrabromobisphenol-A (TBBP-A) and polybrominated diphenyl ethers (PBDEs). It also overviews the concentrations of the BFRs recently measured in food and food products in the Netherlands, including estimates of the dietary intake.
Time trend in environment and humans
BFRs have widely spread in the environment, with European levels being orders of magnitude lower than those in North-America. In Europe environmental levels are declining or levelling off. Comparison of trends in the environmental concentrations with concentrations in breast milk in Sweden indicates a lag-time of at least a decade before a positive environmental effect in the form of decreasing levels of PBDEs was passed on to the human population. As reflected by PBDE levels in breast milk, this has already led to a decreasing trend in effective PBDE exposure (amount residing in the body) in Sweden (time period: decline from 2000 onwards). In the Netherlands such a decreasing trend has not been observed
(period: 1998–2003)
Exposure via food and house dust
Information on the occurrence of BFRs in Dutch food products is limited to two monitoring campaigns in 2001/2002 and in 2003/2004. Estimates of the mean dietary intake of HBCDD and TBBP-A by the Dutch population are from the 2001/2002 study and amount to 2.9 and 0.04 ng/kg body weight, respectively. The most recent dietary intake estimate of PBDEs in the Netherlands (2003/2004) reports a long-term median dietary intake of the sum of PBDEs of 1.7 ng/kg bw /day (95th percentile 3.0 ng/kg bw/day).
Measurements of PBDEs in housedust from European homes have shown that the ingestion of soil/dust is an important route of exposure, in particular for toddlers and children. Though ingestion of PBDEs via soil/dust may lead to significant exposure, the contribution of soil/dust ingestion to the accumulation of PBDEs in the body remains to be clarified, in particular the extent to which PBDEs from soil/dust are absorbed from the gastrointestinal tract.
Risk assessment
For PBDE-99 a maximal allowed intake level of 0.26 ng/ kg-bw per day was calculated. This is equal to the 99-percentile of the PBDE-99 intake from food in the Dutch population
(0.24 ng/kg-bw per day). The relative small margin between the human exposure to PBDE-99 from food and its maximal allowed intake level indicates the intake of of this flame retardant to be of relevant health concern.
Recommendations
Monitoring of BFRs in food and breast milk
As only limited data are available of the occurrence of BFRs in Dutch food products, it is not possible to present, at the moment, a time trend. It is therefore recommended to monitor the PBDE, HBCDD and TBBP-A concentrations in food products and/or human milk regularly (yearly for a period of 5 years) in order to determine the time trend of the BFR exposure of the Dutch population from food and the effective BFR exposure, i.e. the amount of BFRs which has accumulated in the body. Measurements in pooled samples of different food categories and/or milk samples following the specific procedure used to sample 2004 RIVM food data (De Mul et al. 2005) or breast milk (Zeilmaker et al., 2002; Zeilmaker, 2005) is recommended. In view of the large variations in concentrations, multiple samples should be analysed per food category. Concentration variability may further be reduced by improvement of measurement accuracy.
Exposure to PBDEs from house dust
In order to clarify the extent to which PBDEs from soil/dust contribute to the accumulation of PBDEs in the body, the absorption of these compounds from the gastrointestinal tract should be determined. In this context an in vitro digestion system is recommended (Oomen et al., 2003; Versantfoort et al., 2005). In this in vitro test system the processes which occur in the human gastrointestinal tract after ingestion of PBDEs from food or soil-dust are simulated, resulting in a estimate of the absorption of PBDEs from soil/dust relative to food.
Risk assessment
To date PBDE-99 is the only BFR for which a quantitative risk assessment can be performed. For the other bioaccumulating BFRs, i.e. the other PBDEs and HBCDD, a corresponding risk assessment can only be carried if suitable results of toxicity and toxicokinetic studies will become available. As the research on BFRs is fully under way the regular reviewing of its progress over the next coming years is necessary in order to keep the risk assessment presented in this report up to date.
1. Introduction
Brominated flame retardants (BFRs) are widely used in electronic household equipment (e.g. personal computers and television sets), plastics, textile and polyurethane foam in furniture and cars for safety reasons. BFRs have been produced since the 1970s. The annual world market demand of brominated flame retardants in 2001 was about 204,000 tons, of which 58 % was coming from Asia, 26 % from the two Americas, and 14 % from Europe. The most widely used BFRs are tetrabromobisphenol A (TBBP-A), hexabromocyclododecane (HBCDD) and polybrominated diphenylethers (PBDEs) (see structures below).
O
Bry Brx
Polybrominated diphenyl ether (x = 1-5, y = 1-5) O H Br Br OH Br C CH3 CH3 Br Tetrabromobisphenyl-A Hexabromocyclododecane Br Br Br Br Br Br
Potential routes of discharging BFRs into the environment are through incineration, sewage, leaching from landfills and through volatilisation from electrical components during their lifetime (Darnerud et al., 2001).
The intake of BFRs by humans occurs via the food, the ingestion of house dust and the inhalation of (indoor) air. Just as for PCBs and dioxins, food products of animal origin with high fat content (fatty fish, meat and dairy products) are expected to be major contributors to dietary exposure. The contamination of human food products by brominated flame retardants is not well known. However in recent years a number of studies have been carried out to measure the BFR concentrations in food. There is a larger number of measurements in fish reported, but mainly as an indicator of environmental pollution and to a much less extent in fish from the food markets. There is as well a number of new studies assessing the dietary intake of brominated flame retardants by the population. These studies demonstrate that there is indeed exposure of the Dutch population to BFRs.
Because of their tendency to accumulate in fat, the environmental fate of BFRs is similar to the fate of other persistent organic pollutants, such as PCBs and dioxins. If the exposure pattern, the toxicity and the kinetics of BFRs are also similar to that of dioxins and related compounds, i.e., repeated exposure, low effect-doses and high biological half-lives, these properties may (in addition to the occurrence in food) be used for setting priorities in monitoring campaigns of BFRs.
This report regards two research questions:
1. What is the time trend of BFR concentrations in food products?
2. What is the in vivo toxicity and bioaccumulation of BFRs in test animals and humans? To answer these questions an overview is given of the occurrence, temporal trends and
toxicity of the three major classes of BFRs: TBBP-A, HBCDD and PBDEs. Information on the production and discharge into the envrironment, the toxicity and the bioaccumulation of these substances is given in chapter 2. As information on the temporal trends of BFRs in food products appeared non-available, the temporal trends of BFR concentrations in the
environment are described, which could give indications on possible trends in food
(chapter 3). In the same chapter, the trends in human samples are reported which reflect the long-term intake of BFR contaminated food. In chapter 4 concentrations of BFRs which are recently measured in food and food products and dietary intake estimates in the Netherlands and other countries are given. Finally, the risk assessment of PBDE-99 with the present data is given (chapter 5).
2. Background information
2.1 Production and discharge of BFRs
BFR compounds
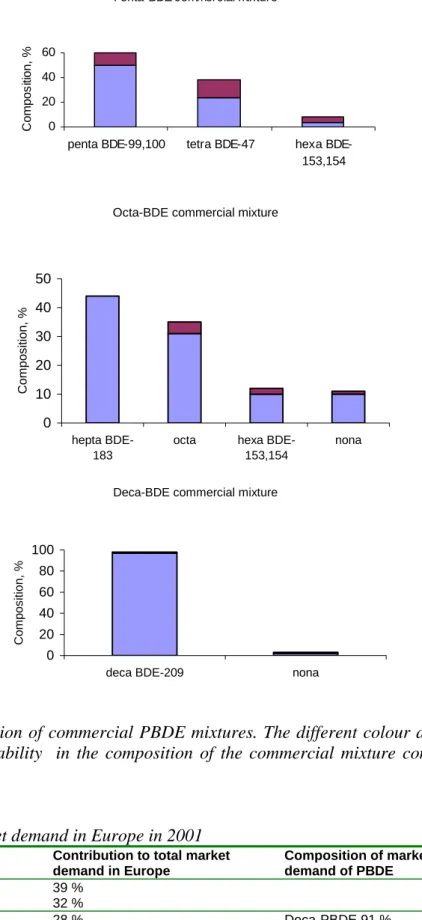
Of the total BFRs produced in 2001, about two-third (59 %) contain tetrabromobisphenol-A (TBBP-A) and derivatives, about one-third (33 %) contain polybrominated diphenyl ethers (PBDEs) and 8 % contain hexabromocyclododecane (HBCDD) (Bromine Science and Environmental Forum, 2004). PBDEs are in production in three formulations: the penta-PBDE (DBDPO decabromodiphenyl oxide), octa-penta-PBDE (OBDPO octabromodiphenyl oxide) and deca-PBDE (PBDPO polybrominated diphenyl oxide) mixtures, of which deca-PBDE is produced in the largest amounts (Bromine Science and Environmental Forum, 2004). Penta-PBDE, octa-PBDE and PBDE commercial products contain penta-, octa- and deca-PBDEs as main components and additionally other deca-PBDEs as well (Figure 2, PBDE congener numbering is given in Appendix 1). The commercial HBCDD product is composed of three diastereomers: λ-, β-, and γ-HBCDD.
Other main commercial BFRs are brominated polymers such as brominated epoxy, brominated polystyrene, brominated polycarbonate, poly(brominated acrylate), and brominated polyols. Polybrominated biphenyls (PBBs), the brominated counterpart of polychlorinated biphenyls (PCBs), were banned in U.S.A. and not produced any more as of 1979. In Europe PBBs were in production in Germany until 1985 and in France until 2000. Polybrominated and mixed brominated/chlorinated dibenzo-p-dioxins and furans (PBDD/Fs and PXDD/Fs) are mainly produced as by-products of waste incineration. These substances are formed, for example, when plastics containing BFRs are heated. Given the common mechanism of action and effects of dioxin like compounds, it is reasonable to predict that their presence will incrementally add to the total dioxin body burden (Birnbaum et al., 2003). The available information on the occurrence and toxicity of BFRs is mostly restricted to the three major ones: TBBP-A, HBCDD and various PBDE congeners.
European market
The market demand in 2001 for BFRs in Europe was estimated to be about 29,000 tons, TBBP-A, HBCDD and PBDE each accounting for about a third of the production (Table 1). Of the PBDE market demand in Europe, deca-PBDE has by far the largest part (Table 1). HBCDD is used more extensively in Europe than in North America. The total BFRs market demand in the two Americas is roughly 2 times larger than in Europe. On the other hand, the HBCDD market demand in Europe is about 3 times larger than in the Americas (Bromine Science and Environmental Forum, 2004).
The penta-PBDE technical product was voluntarily banned in the European Union last
10 years. This has led within the EU to increases in the use of HBCDD and TBBP-A. The use of penta-PBDE and octa-PBDE technical products in all applications for the European Union market is officially banned from 15 August 2004. The use of penta-PBDE, octa-PBDE and PBBs in new electrical and electronic equipment will be banned by July 2006.
Penta-BDE commercial mixture
0 20 40 60
penta BDE-99,100 tetra BDE-47 hexa BDE-153,154 C o mpos iti on, %
Octa-BDE commercial mixture
0 10 20 30 40 50 hepta BDE-183
octa hexa BDE-153,154 nona C o m p os ition, %
Deca-BDE commercial mixture
0 20 40 60 80 100
deca BDE-209 nona
Com pos it io n, %
Figure 2. Composition of commercial PBDE mixtures. The different colour at the top of the bars gives the variability in the composition of the commercial mixture composition (data from De Wit, 2002).
Table 1. BFR market demand in Europe in 2001
BFR Contribution to total market demand in Europe Composition of market demand of PBDE TBBP-A 39 % HBCDD 32 % PBDE 28 % Deca-PBDE 91 % Octa-PBDE 7 % Penta-PBDE 2 %
Discharge into environment and intake by humans
PBDEs, HBCDD and PBBs are additives mixed into polymers and are not chemically bound to the plastic or textiles. Therefore, they may separate or leach from the surface of their product applications into the environment. TBBP-A is bound to the material chemically, but may not have polymerized and is released to the environment (De Wit, 2002). The waste from the products containing BFRs is either incinerated or deposited in landfills. The sources of BFRs also include industrial facilities that produce BFRs as well as consumer manufacturing facilities that use BFRs in a wide range of consumer products. The presence of BFRs in the environment has been shown in air, sewage sludge, sediments, fish, birds and mammals, including human breast milk, blood and adipose tissue (De Wit, 2002; Boon et al., 2002). The presence of PBDE in samples from living organisms and in air in the Arctic indicate long-range transport of PBDEs in air.
The intake of BFRs by humans can occur via the intake of food, the ingestion of house dust and the inhalation of (indoor) air. Just as for PCBs and dioxins, food products of animal origin with high fat content (fatty fish, meat and dairy products) are expected to be major
contributors to dietary exposure. Estimates of median exposures in the UK indicate diet and inhalation to contribute 93 and 7 % respectively (Harrad et al., 2004). A Canadian/British study (Wilford et al., 2004) reported that for median inhalation exposure the maximum contribution of the inhalation pathway to the total intake (sum of both dietary and inhalation intake) is 4 %. However, a 50-fold variation between the 5th and 95th percentiles of inhalation exposure was shown. Consequently, the higher percentiles demonstrated a much higher contribution of the inhalation pathway to the total intake (32-34 % for the 95th percentile). House dust may contain appreciable amounts of flame retardants. In house dust of German homes average concentrations of 122, 180, 21 and 1404 ng/g dry mass were found for PBDE-47, 99, 100 and total PBDE (Knoth et al., 2003). When compared with similar measurement in American homes the latter measurements were a magnitude higher than in German homes, average PBDE-47, 99 and 100 and total PBDE concentrations amounting 1220, 1700, 274 and 5900 ng/g dry mass (Stapleton et al., 2005).
Combining measured concentrations in air, food and dust with modeling techniques Jones-Otazo et al. (2005) calculated for the Canadian population daily PBDE exposures of 1965 ng/day for the breast fed infant (0-0.5 year), 261 ng/day for toddlers (0.5–4.0 year), 209 ng/day for children (5 –11 year), 155 ng/day for teens (12-19 year) and 155 ng/day for adults (20+ years). These exposures mainly occurred from the ingestion of food and soil/house dust, the latter exposure route contributing 89 % (toddlers), 78 % (children), 61 % (Teens) and 61 % (adults) to the total exposure.
As already mentioned the concentrations of PBDEs in house dust of European origin are far less than in American or Canadian homes. Consequently, the exposure via ingestion of house dust in Europe is expected to be lower in comparison with the U.S.A. or Canada. For
example, taking the (median) concentration of PBDEs in Germany as a reference
(62 ng total PBDEs/g dry mass, Knoth et al., 2003), and assuming a soil/dust ingestion of 0.02 – 0.05 g/day for adults and maximally 0.2 g/day for toddlers (Oomen and Lijzen, 2004) a daily exposure of 1.2 – 3.1 ng may be calculated for adults and (maximally) 12.4 ng for toddlers. These calculations anyway indicate that, in comparison with the (median) life-long exposure in the Netherlands via food (1.73 ng/kg/day, corresponding with 121 ng/day for an adults body weigth of 70 kg, see chapter 4) the exposure to PBDEs via ingestion of soil/dust seems only a minor route of exposure when compared with the exposure via food. However, both the exposure assessment from food and housedust contain quite some uncertainty. For, neither of these exposure assessments incorporates the contribution of the decabromo congener PBDE-209. In housedust this congener may contribute up to 70 – 80 % of total PBDEs. Furthermore, the exposure via food mainly occurs by the ingestion of PBDEs in a
matrix which very well suites uptake (absorption) in the body, i.e. the food’s fat fraction, however, the absorption of PBDEs originating from house dust is expected to significant less than from food. In this context the (widely made) assumption that the absorption of PBDEs from soil/house dust lies between 50 and 100 % (Otazo et al., 2005) may easily overestimate the accumulation of PBDEs originating from housedust in the body. Clearly, more research is needed to characterise the total exposure to PBDEs, i.e. by incorporating PBDE-209, and by determining the absorption of PBDEs from soil/house dust.
2.2 Toxicity and kinetics of BFRs
2.2.1 Toxicity studies
2.2.1.1 Tetrabromobisphenol-A
Tetrabromobisphenol-A (TBBP-A) was not found toxic for rodents in dose levels up to 1000 - 10000 mg/kg/day (EU RAR, 2003; see Appendix 2).
2.2.1.2 Hexabromocyclododecane
For hexabromocyclododecane (HBCDD) the thyroid and the liver appeared to be target organs. A (preliminary) 5 % Bench Mark Dose (BMD) in the range of < 10 – 37 mg/kg bw has been reported for induced hyperplasia in these organs. Based on the absence of mutagenicity and and carcinogenicity in mice it was concluded that ‘there are no reasons to explore this endpoint, i.e. carcinogenicity, further’. HBCDD failed to demonstrate any fetotoxic, teratogenic or any adverse developmental effects in the rat. However, it may lead to developmental neurotoxic effects in offspring after single exposure during the neonatal period (LOAEL of 0.9 mg/kg/ day) (EU RAR, 2005; see Appendix 2).
2.2.1.3 Polybrominated flame retardants
In rodents, lower brominated PBDEs may induce developmental neurotoxicity and the disturbance of homeostasis of thyroid hormones (Appendix 2). Single doses of lower brominated PBDEs (PBDEs 47, 99 and 153), when administered during the period of pregnancy, lactation or shortly after birth, may lead to neurodevelopmental toxicity as assessed in offspring later in life. At the level of the thyroid PBDEs may interfere with the synthesis of thethyroid hormone thyroxine (T4). Furthermore PBDEs may interfere with the transport of thyroid hormones in the blood through competitive binding of PBDEs to the transthyretin transsporter (TTR). When the lower brominated PBDEs are compared on the basis of their reported NOAELs, LOAELs or 10 % Bench Mark Doses (1) it appears that reproductive and developmental toxicity, as measured by impaired spermatogenesis, altered mitochondrial morphology in the ovaries, increased resorption rates and external and skeletal anomalies, is the hitherto most sensitive toxic endpoint of these congeners in rodents (Kuriyama et al., 2005; Talsness et al., 2005).
The toxicity of PBDEs has recently been evaluated by the Joint FAO/WHO Expert Committee on Food Additives (JECFA, 2005). With regard to the disturbance of thyroid homeostasis by PBDEs the JECFA concluded that the available data were insufficient to determine the mechanism for the reported effects. With regard to the neurotoxic effects the conclusion was that ‘Because of the preliminary nature of the (neurotoxicity) findings, an interpretation of significance for human health could not be made’. JECFA furthermore concluded that: ‘The available data are inadequate to establish a common mechanism of
1 NOAEL: no observed adverse effect level; LOAEL: lowest observed adverse effect level, 10 % BMD: Dose at
action that would allow a single congener to be used as a surrogate for total exposure or, alternativily, as the basis for establishing toxic equivalency factors’.
The JECFA did not allocate a provisional tolerable monthly/daily intake for PBDEs because the available toxicity data on PBDEs were considered not adequate for such an approach (see Appendix 2). Taking all toxicity data together the JECFA concluded: ‘The limited toxicity data suggest that for the more toxic PBDE congeners adverse effects would be unlikely to occur at doses of less than approximately 100 μg/kg bw per day’. The JECFA furthermore stated that the current estimates of dietary intake were approximately 0.004 μg/kg bw per day, while intake by breast feeding infants could be up to 0.1 μg/kg bw per day for the sum of all measured PBDE congeners, including the toxic ones. In consequence, there appeared to be a large Margin of Exposure (MoE) between the (expected) NOAEL in animals and the actual human exposure, despite of the inadequacy of the data on toxicity and intake. This gives reassurance that intakes of PBDEs are not likely to be a significant health concern. The JECFA noted that, as with related bioaccumulative persistent contaminants (PCBs, dioxins: WHO, 2002; SCF, 2000, 2001; JECFA,2002), a more appropriate dose-metric for interspecies comparison of risk would be a measure of the accumulating potency of PBDEs (‘body burden’ approach). For the majority of PBDEs studied, however, the data from experimental animals or on concentrations in human tissues were considered insufficient to allow a comparison with external dose. Notwithstanding this conclusion the JECFA ‘considered that continuing studies of PBDEs in samples from humans, including human milk, would be useful in assessing the overall exposure to PBDEs in foods and other possible sources’.
2.2.2
Bioaccumulation of BFRs
Regarding the extent of bioaccumulation, knowledge on the (terminal) half–life, an aggregate measure for the rate of removal of the parent compound and its metabolites from the body, is crucial (WHO, 2002; SCF, 2000, 2001; JECFA, 2002). When the exposure to a compound occurs daily via the intake of food, half-lives in humans of the order of magnitude of months-years lead to the bioaccumulation of the substance: as the duration of exposure increases, more and more of the substance will accumulate in the body until the concentration in the body (‘body burden’, BB) reaches a constant level (‘steady state’). For example, the dioxin 2,3,7,8-TCDD has a terminal half-life of about 20 days in rodents and more than 7 years in man. A near ‘steady state’ situation in humans will be reached after 28-35 years. As shown in Table 2 (provisional) estimates of the terminal half-life of TBBP-A, PBDEs and HBCDD in rats and in humans are yet available. As with 2,3,7,8-TCDD the estimated half-lives in humans tend to be far greater than in rats, with half-lives of tetra, penta, and hexabrominated PBDEs being in the order of that of 2,3,7,8-TCDD. TBPP-A did not indicate bioaccumulating properties in the rat nor in humans, whereas HBCDD has been found to have clear bioaccumulating properties in the rat (Chengelis, 2001, as cited in EU RAR, 2005).
Table 2. Terminal half-lives of TBPPA, HBCDD and PBDEs in rats and in humans (Geyer et al. 2004; Hagmar et al., 2000; Jakobsson et al., 2003).
Compound Half-life
Rat 1(days) Humans2 (years)
TBBP-A 2.8 - HBCDD 8/203 0.17 PBDE-47 (tetrabromo) 21.4 1.8 PBDE-99 (pentabromo) 33.0 2.9 PBDE-100 (pentabromo) 21.2 1.6 PBDE-154 (hexabromo) 35.4 0.74 ; 3.3 PBDE-153 (hexabromo) 59.3 1.9 ; 6.5 PBDE-183 (heptabromo) - 0.24 ; 0.30 PBDE-209 (decabromo) - 0.019 1
As measured in adipose tissue; 2 Total body half-life in non-occupationally exposed humans as assessed with a linear one-compartment pharmacokinetic model; 3Chengelis, 2001, as cited in EU RAR, 2005
3
. Temporal trends of BFRs in environment and humans
Unlike several of the ‘classical’ persistent organic pollutants such as PCBs, dioxins and furans, whose levels have been decreasing markedly during the last 20 years, several studies have reported rising trends in environmental concentrations of PBDEs. There is therefore a serious question as to whether levels of PBDEs (and other BFRs) will continue to increase in the environment and humans.There is a large difference in levels of BFRs between North America and Europe, due to different production and use. For example, North America consumes half of the world’s production of PBDEs and 98 % of the penta-PBDE mixture (Hale et al., 2003). Furthermore, while penta-PBDE has been restricted for over ten years and has been banned within Europe since 2004, the production and use of this mixture continue to rise in North America (Alcock et al., 2003). As a consequence, levels of BFRs in North America are higher than in Europe. For example PBDE concentrations in U.S.A. and Canadian sewage sludge as well as in human milk and serum in women from North America appear to be at least 10-fold greater than European levels.
3.1 Diet
There is no information on the trends of BFRs in the diet, however, two studies analysed a few historic diet samples.
Australian historic butter samples originating from around 1944 were analysed (Müller et al., 2003). The PBDE concentrations in the butter samples were consistently below the limit of detection and the sum of 8 PBDEs was less than 0.20 ng/g lw (lipid weight).
PBDE levels were measured in four vegetable oils (olive and peanut) from the Middle East, two of which were produced in the 1940s and two were present day samples. PBDE-28, -47, -49, -99, -100, -153, -154, -183 were below detection limit in all of the oil samples, the sum of 8 PBDEs was less than 0.05 ng/g lw.
3.2 Meta-analysis of PBDE concentrations in environment and
humans
Hites (2004a) acquired and classified most of the literature on PBDEs in the environment or in humans published before August 2003, and made a meta-analysis of concentrations. The present section gives a summary of this meta-analysis with regard to temporal trends.
3.2.1 Marine mammals
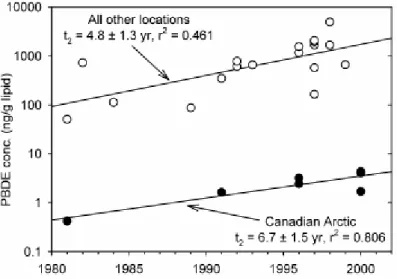
Current PBDE concentrations in marine mammals from the Canadian Arctic are very low (see Figure 3) at about 5 ng/g lw, but they have increased exponentially with a doubling time of about 7 years. Marine mammals from the rest of the world (Europe and U.S.A.) have current PBDE levels of about 1000 ng/g lw, and these concentrations have also increased exponentially with a doubling time of about 5 years.
Figure 3. Sum of PBDEs concentrations in marine mammals shown as a function of the year in which the samples were collected (figure taken from Hites, 2004a).
3.2.2 Human samples
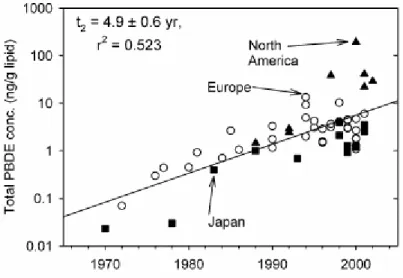
Hites (2004a,b) reviewed PBDE concentrations measured in human samples: ambient human tissue (from people not occupationally exposed), blood (usually serum) and human milk. A plot of all these concentrations versus sampling year (see Figure 4) shows an exponential increase with a doubling time of about 5 years. In general, the PBDE concentrations in people have increased by a factor of about 100 during the last 30 years. The North American samples are always above the regression line (in recent years by a factor of >10), the Japanese samples are usually below the regression line (by a factor of about 5). This indicates again that people in the United States are exposed to higher levels of PBDEs than are Europeans and that the Japanese are exposed to less than the Europeans. The concentrations of PBDEs are about 20 times higher in people from the U.S. (~35 ng/g lw) as compared to people from Europe (~2 ng/g lw).
3.3 North America
The environment and the people in North America are much more contaminated with PBDEs than in Europe. PBDE concentrations in the North American environment (sediments, fish, birds and marine mammals) and in human samples (blood, breast milk and fetal liver) increase exponentially with time doubling every 4-6 years and there are no indications of levelling off. PBDE concentrations in Canada and especially the Canadian Arctic are lower than in the U.S.A. and the trends are somewhat slower.
The concentrations of PBB-153, which was a main component of hexabromobiphenyl banned in the 1970s, generally remained the same in U.S.A. Great Lakes fishes. On the other hand, they are decreasing in the serum of the U.S.A. general population.
A detailed review on the environmental and human temporal trends of BFRs in North America can be found in Appendix 3.
Figure 4. Total PBDE concentrations in human blood, milk, and tissue shown as a function of the year in which the samples were taken (figure taken from Hites, 2004b). The three symbol types indicate the location from which the samples were collected. The overall regression is shown.
3.4 Japan
In Japan, PBDE concentrations in the environment (sediments and fish) increased exponentially up to early 1990s. This was followed by a decrease, due to the reduction of the commercial tetra-PBDEs consumption in Japan after 1990. The time-trend of total PBDEs in Japanese breast milk, which began levelling off after 1998, and the PBDE levels therein are not remarkably different from those in Swedish breast milk.
The historical trends of polybrominated dibenzo-p-dioxins and furans (PBDD/F) in Japanese sediment cores of Tokyo Bay were similar to those of PBDEs.
A detailed review on environmental and human temporal trends of BFRs in Japan can be found in Appendix 3.
3.5 Europe
In Europe the temporal trend of BFRs in environmental samples appears to be dependent on the region and the type of sample, as is illustrated below. Note that the use of the technical PentaPBDE product in the European Union has been drastically reduced in the last 10 years and has been banned from August 2004, while HBCDD continues to be used.
3.5.1 Fish and mussels
Concentrations in fish are highly variable depending on the type of fish and the location from which they were collected. These variations are likely due to the proximity of the fish feeding grounds to PBDE sources. In general, fish from Europe have about 10 times lower PBDE concentrations than fish from North America. The mean and median of the sum of PBDEs are 120 and 49 ng/g lw, respectively, for the European fish (Hites, 2004a).
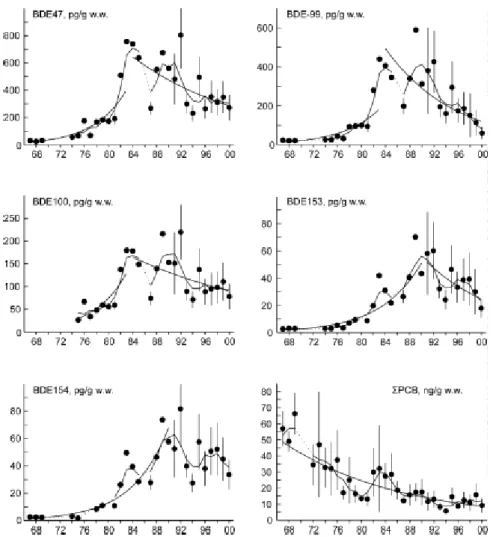
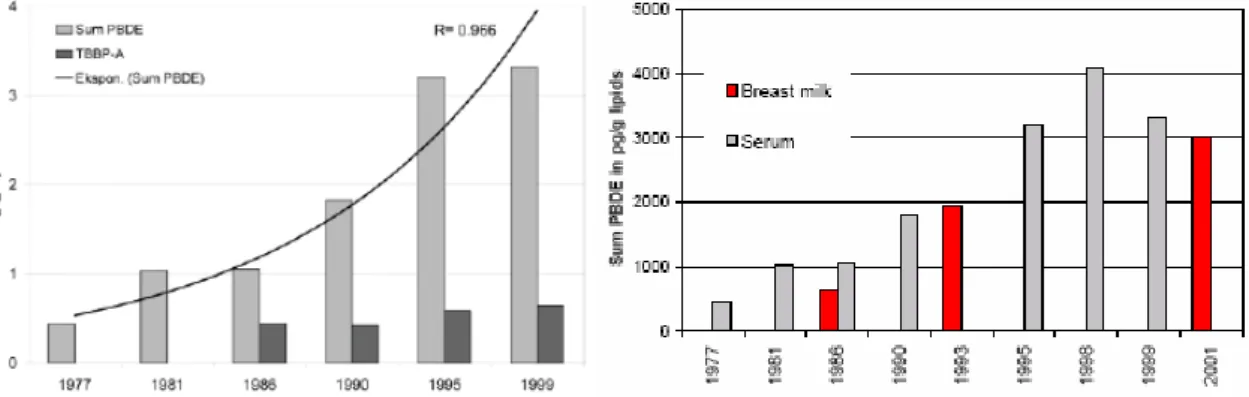
Pike are collected yearly from Lake Bolmen in southern Sweden and the PBDE congeners PBDE-47, -99, -100, -153 and -154 were analysed for most years between 1967 and 2000 (Kierkegaard et al., 2004). The temporal trends for all PBDE congeners show increasing
concentrations from the 1970s to the mid-1980s (Figure 5). The concentration of PBDE-47 showed a 30-fold increase between 1968 and 1983 (doubling time of 4-5 years). PBDE congeners reached their maximum concentrations in the mid- to late 1980s and then leveled off or decreased. The trend may be indicative of decreasing use and production of lower brominated PBDE products.
Figure 5. Temporal trends of tetra- to hexa-PBDEs and the sum of PCB (on wet weight basis) in pike fromLlake Bolmen. The line represents a three-point running mean smoother, the dots the arithmetic means with the 95% confidence interval indicated. The curves represent the log-linear regression for selected time periods (figure taken from Kierkegaard et al., 2004).
No significant trend was detected for PBDE-47, -99 and-100 in roach from Lake Krankesjön in Sweden between 1980 and 1996 (De Wit, 2002; Kierkegaard et al., 1999). This is in agreement with the more or less constant levels found in pike from Lake Bolmen between 1982 and 1996 (De Wit, 2002; Kierkegaard et al., 1999).
Eel samples from the Rhine and Meuse Rivers revealed decreasing PBDE levels during 1983-1993, whereas PBDE levels increased in the River Roer eel during the same time period (Darnerud et al., 2001; De Boer, 1995). However, decreasing PBDE concentrations were observed in yellow eel from the River Roer over the period 1977-1999 and Haringvliet-east (1983-1999) in the Netherlands (Kierkegaard et al., 2004; De Boer and Allchin, 2001).
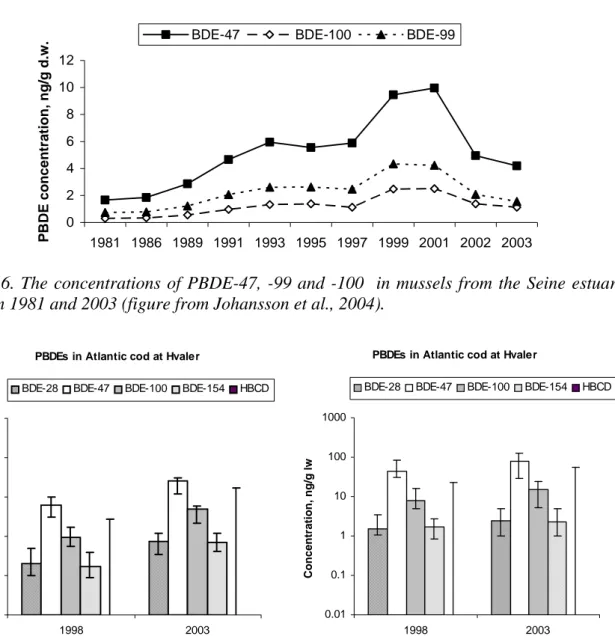
The concentrations of PBDE-47, -99 and -100 have increased exponentially in mussels from the Seine estuary between 1981 and 1999/2001 (Johansson et al. 2004). The concentration of these congeners was constant between 1999 and 2001, whereas in 2002 and 2003 the concentrations of 47 and –99 decreased significantly (Figure 6). The levels of PBDE-47 and –99 in mussels from the Seine estuary are comparable to the levels observed in mussels from the Netherlands.
0 2 4 6 8 10 12 1981 1986 1989 1991 1993 1995 1997 1999 2001 2002 2003 PB D E c onc e n tr a tion, n g /g d.w
. BDE-47 BDE-100 BDE-99
Figure 6. The concentrations of PBDE-47, -99 and -100 in mussels from the Seine estuary between 1981 and 2003 (figure from Johansson et al., 2004).
PBDEs in Atlantic cod at Hvaler
0.01 0.1 1 10 100 1000 1998 2003 Conc e n tra tion, ng/g ww
BDE-28 BDE-47 BDE-100 BDE-154 HBCD
PBDEs in Atlantic cod at Hvaler
0.01 0.1 1 10 100 1000 1998 2003 C oncentrati on, ng/ g l w
BDE-28 BDE-47 BDE-100 BDE-154 HBCD
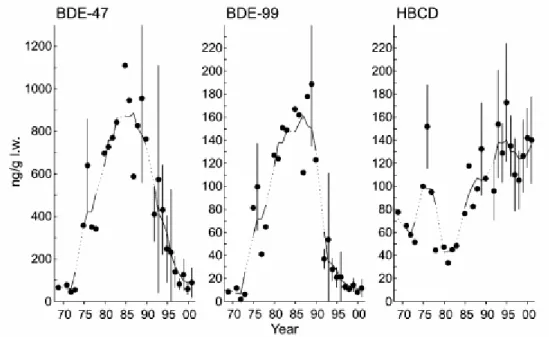
Figure 7. Temporal trends of BFRs in Atlantic cod at Hvaler in 1998 and 2003 (data from Bytingsvik et al., 2004, ww – wet weight, lw – lipid weight). Error bars represent the data ranges.
An increase of 3-4 times was seen in wet weight concentrations of all PBDE congeners, when comparing Atlantic cod from Hvaler (outer Oslo fjord) in 1998 and 2003 (Bytingsvik et al., 2004). The concentration of HBCDD was about 8 times higher in 2003 as compared to 1998 (see Figure 7). When expressed on a lipid weight basis, the increase was more modest, with levels 1.5 times higher for all PBDEs, whereas HBCDD showed an increase of 3-4 times. This study indicates that there has been an increase in concentrations of both PBDEs and especially HBCDD, in the Hvaler, outer Oslo fjord area during the last five years. However,
only one site and two time points are considered here. This study points out that the concentration of HBCDD, in particular, has been increasing the last years, and that HBCDD is now present in relatively high concentrations even in remote areas like Bear Island, Barends Sea.
3.5.2 Dated sediment cores
The analysis of a sediment core from the Baltic Sea, close to the south coast of Sweden, provided a retrospective trend from 1939 to 1987 and showed that the PBDE levels have increased, especially after 1980 (see De Wit, 2002).
Zegers et al. (2000) measured 14 PBDEs in sediment cores from three locations in Western Europe. Starting from the beginning of the 1970s, the pentaPBDE-mixture is clearly present in the sediment cores, while the deca-mix formulation is only present since the late 1970s, in agreement with the production figures for the commercial formulations. The sediment cores from Drammenfjord, Norway indicate a continuous increase in PBDEs from the early 1970s up to the most recent sediments from 1999. Analysis by Hites (2004a) shows that at this location, the PBDE concentrations increased with a doubling time of about 3 years until the mid-1980s, at which time the concentrations seem to have levelled off (the doubling time increased to about 8 years). In sediment cores taken from Lake Woserin, Germany and the Dutch Wadden Sea the penta- brominated congeners were levelling off in the most recent sediment layers representing 1995 and 1997. PBDE-209 decreased in the most recent layer of all three locations. These differences may reflect differences in exposure routes. Lake Woserin receives its input of contaminants from long range transport through air. The Wadden Sea and the Drammenfjord are both areas in close contact with major industrial areas via water currents. A PBDE input from local sources via the dissolved phase or suspended particles is much more likely for these two areas.
3.5.3 Birds
A decreasing trend for the lower brominated PBDE congeners has been found in eggs from guillemots (Dutch: zeekoeten) from the Baltic Sea since the voluntary withdrawal of use in a number of countries, but levels of HBCDD are still increasing (Sellström et al., 2003). The PBDE-47, PBDE-99 and PBDE-100 concentrations increased from the 1970s to the 1980s, peaking around the mid- to the late 1980s, then followed by a rapid decrease during the rest of the study period (Figure 8). In 2000-2001 the concentrations of the major PBDE congener were less than 10 % of its peak values. The concentrations of HBCDD show an increasing tendency from 1969 to 1997 (Figure 8). After a peak in the middle of the 1970s followed by a decrease, the concentrations increased during the latter part of the 1980s. During 1993-2001 the annual mean concentrations are more or less stable at a higher level as compared to the beginning of the study period in 1969.
Figure 8. Temporal trends of PBDE-47, PBDE-99, and HBCDD in guillemot egg from Stora Karlsö, Sweden (figure taken from Sellström et al., 2003).
This significant decrease in PBDE concentrations after the late 1980s is in disagreement with other Swedish trend studies covering the same time period. Pike from the Swedish Lake Bolmen showed the same increase in concentrations, but after the late 1980s the concentrations have decreased slowly or levelled out (Kierkegaard et al., 1999; 2004, see section 3.5.1). Reductions in the emissions from the European production and downstream use of lower PBDEs could be the explanation for decreasing concentrations in guillemot eggs from the Baltic Sea. The slow decrease or levelling off in concentrations in pike may indicate a local source of PBDE to that lake, while the increasing concentrations in humans may reflect a continuous direct exposure from flame retarded products. The trends in guillemot eggs indicate that the environmental concentration declined rather quickly after emissions have decreased in a region.
The deca-PBDE (PBDE-209) trend was studied in peregrine falcon eggs (1973-2002) and sparrow hawk muscle tissue samples (1975-2001) from the UK (De Boer et al., 2004; Law et al., 2004). A statistically significant increase of concentrations of PBDE-209 in peregrine falcon eggs over the period 1975 to 1995 was observed, as well as a significant decrease from 1995 to 2001. This may suggest a correlation with the consumption of the Deca-PBDE mixture in the UK, with a peak in 1989 and a decrease since that time. Data for sparrow hawks did not show any significant trend, but more positive samples were observed in samples from later years. The HBCDD concentrations found in the peregrine falcon eggs and sparrow hawk were generally very low, and no time trend could be established.
3.5.4 Human samples
PBDE and HBCDD levels in blood from Dutch mothers and infants are reported by Weiss et al. (2004). The mean PBDE-47 concentrations were 3.2 and 3.7 ng/g lw in maternal serum and cord blood (infant level), respectively. This is lower than reported mean levels in the U.S.A. of respectively 28 and 25 ng/g lw (Mazdai et al., 2003), and comparable to levels found in Swedish blood reported in 2001. Notably the mean PBDE-153 concentration was the highest concentration of all PBDEs in maternal serum, PBDE-47 being the most abundant congener in the past. In cord blood PBDE-47 levels were higher than PBDE-153 levels. HBCDD mean concentration was 1.1 and 2.4 ng/g lw in maternal serum and cord blood,
respectively, which is similar to serum sample concentrations from Swedish women. This indicates that the exposure of Dutch women to HBCDD has resulted in a considerable accumulation in the body.
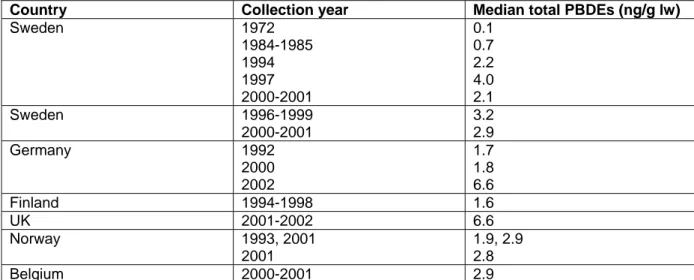
The sum of the six PBDEs (PBDE-28, -47, -99, -100, -153, -154) in serum from Norway increased from 0.44 ng/g lw in 1977 to 3.3 ng/g lw in 1999 (Figure 9, left side, Thomsen et al., 2002).
On average, the PBDE content in Norwegian breast milk has increased by more than 300 % from 1986 to 2001 and by 58 % from 1993 to 2001 (Thomsen et al., 2003). The mean PBDE level in 2001 of 3038 pg/g lw agrees well with the level of 2800 pg/g lw reported in Swedish breast milk. The levels in serum and breast milk are quite consistent and the PBDE level seems to peak around 1998 (see Figure 9, right side) which supports the recent trend found in Swedish breast milk (Lind et al., 2003).
The flame retardant TBBP-A is industrially the most important individual BFR used. However, reports on TBBP-A in human samples and in the environment in general are scarce. TBBP-A was not identified in the Norwegian serum pools from 1977 and 1981, but a slight increase of TBBP-A concentration in serum was observed from 1986 to 1999 (Thomsen et al., 2002, Figure 9).
Figure 9. The concentration of TBBP-A and total PBDE concentration in pooled serum samples from 40 to 50 year old Norwegian men (left; figure taken from Thomsen et al., 2002). The mean PBDE levels in Norwegean breast milk compared to levels in Norwegian serum (right; figure taken from Thomsen et al., 2003).
The median total PBDE concentration in European human milk of most reported studies are summarised in Table 3 (Ryan, 2004).
PBDE levels in the human breast milk from Stockholm, Sweden increase exponentially between 1972 and 1997, doubling every five years (Meironyté et al., 1999; Noren and Meironyté, 2000). However, PBDE levels in human milk showed a decreasing trend from 1998 to 2000. An increase in mean values of both the sum of PBDEs and PBDE-47 in individual breast milk samples from Uppsala county, Sweden was seen from 1996 to 1998, after which the levels decreased up to year 2001 (Lind et al., 2003). These changes in levels are similar to what has been reported in pooled samples from Stockholm (Figure 10), although a large within-year variation was found in individual concentrations (Lind et al., 2003).
Comparison of trends in guillemot eggs, with a decrease starting the mid-1980s, and in breast milk from Sweden, with a decrease starting 1998, indicates a potential lag-time of a decade
before a positive effect in the environment was translated to decreasing levels in the human population (Sjödin, 2003).
Table 3. PBDEs in human milk from Europe (data from Ryan, 2004).
Country Collection year Median total PBDEs (ng/g lw)
Sweden 1972 1984-1985 1994 1997 2000-2001 0.1 0.7 2.2 4.0 2.1 Sweden 1996-1999 2000-2001 3.2 2.9 Germany 1992 2000 2002 1.7 1.8 6.6 Finland 1994-1998 1.6 UK 2001-2002 6.6 Norway 1993, 2001 2001 1.9, 2.9 2.8 Belgium 2000-2001 2.9
Figure 10. A comparison between data on PBDE levels in pooled breast milk from Stockholm, Sweden (white bars) and mean values of individual breast milk samples from Uppsala county, Sweden (grey bars) (Figure from Lind et al., 2003).
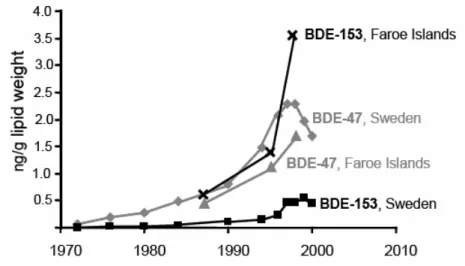
A steep increase of PBDE concentrations is shown in human milk from the Faroe Islands from 1987 to 1999 (Fängström et al., 2004, Figure 11). The Faroe Islands are situated between the Norwegian Sea and the North Atlantic Ocean, about one-half of the way from Iceland to Norway. The Faroe Islands are located quite far from the European continent and from industrial sources of PBDEs. The range of PBDE concentrations in Faroe human milk is similar to those observed in the UK and Germany, with average total PBDE concentrations of about 6-7 ng/g lw, which is up to 3-fold higher than observed in Sweden and Japan. The PBDE pattern in Faroe breast milk is different from the one reported in studies elsewhere, with PBDE-153 as the dominant congener, rather than PBDE-47 otherwise being the most
prevalent congener. The PBDE-47 trend is in accordance with findings from Sweden (see Figure 11). However, the PBDE-153 profile is different from Swedish data, with considerably higher concentrations and a steeply increasing trend.
Figure 11. A time trend comparison between Sweden and Faroe Islands (figure from Fängström et al., 2004).
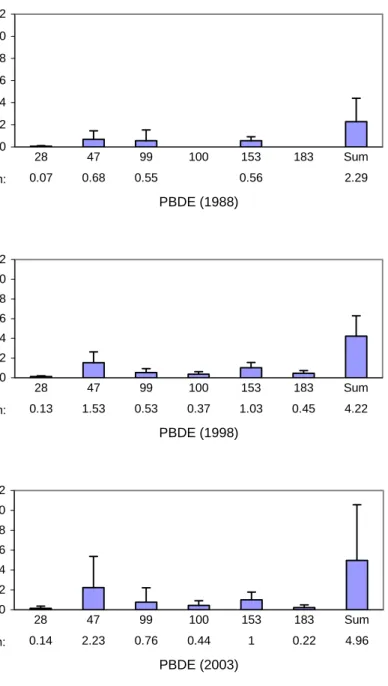
In the Netherlands the occurrence of PBDEs in breast milk was investigated in 1988, 1998 and 2003 (Zeilmaker, 2002; 2005). In 1988 a pilot-study, comprising 10 individual breast milk samples, revealed the presence of PBDE-28, -47, -99 and -153 in Dutch breast milk (Figure 12, top). More extended monitoring campaigns were performed in 1998
(103 invidual samples) and 2003 (99 individual samples). In comparison with the 1988 samples additionally PBDE-100 and -183 were found in breast milk, together with an increase in the sum of PBDEs. PBDE-47 and -153 were found the predominant congeners, followed in decreasing amounts by PBDE-99, -100, -183 and -28 (Figure 12, middle and bottom).
Qualitatively, the occurrence of PBDEs in Dutch breast milk correlated well with the occurence of these compounds in serum of Dutch women during week 20 and 35 of pregnancy (78 samples, Weiss et al., 2004). As in serum PBDE- 47, -99, -100, -153 were found in breast milk (28 was found in breast milk but not in serum, whereas PBDE-154 was found in serum but not in breast milk). As in serum PBDE-47 and -153 appeared the most abundant congeners in breast milk. The amounts of the PBDEs found in breast milk were lower than in serum (mean serum concentrations were 3.2 ng/g lw for PBDE-47, 0.69 ng/g lw for PBDE-100, 0.98 ng/g lw for PBDE-99, 1.4 ng/g lw for PBDE-154 and 4.5 ng/g lw for PBDE-153). Similarly, the sum of PBDEs in breast milk of 4-5 ng/g lw (Figure 12, middle and bottom) is lower than the sum of PBDEs found in serum of 10.8 ng/g lw.
Next to PBDEs also HBCDD was found in serum (mean concentration: 1.1 ng/g fat),
indicating that the exposure of Dutch women to this compound has resulted in a considerable accumulation in the body (note that, as HBCDD was not investigated in breast milk, a
comparison of the amount of HBCDD in serum and breast milk cannot be made).
The PBDE congener concentrations as well as the sum of PBDEs in Dutch breast milk increased in time or stayed about the same for all congeners, except PBDE-183. No substantial difference in the sum of PBDEs was found between the 1998 and the 2003 samples, even a small increase was found, therefore there are no indications on decrease of PBDEs in Dutch breast milk in this period.
0 2 4 6 8 10 12 PBDE (1988) Conc . (ng/ g m ilk f a t) Concentration: 0.07 0.68 0.55 0.56 2.29 28 47 99 100 153 183 Sum 0 2 4 6 8 10 12 PBDE (1998) Conc . (pg/ g m ilk f a t) Concentration: 0.13 1.53 0.53 0.37 1.03 0.45 4.22 28 47 99 100 153 183 Sum 0 2 4 6 8 10 12 PBDE (2003) Conc . (ng/ g m ilk f a t) Concentration: 0.14 2.23 0.76 0.44 1 0.22 4.96 28 47 99 100 153 183 Sum
Figure 12. The content of PBDE in Dutch breast milk. Top - 1988 (10 samples), middle - 1998 (103 samples), bottom - 2003 (99 samples). Indicated: mean content + SD (ng/g milk fat).
4. Brominated flame retardants in the diet
4.1 Brominated flame retardants concentrations in food
products
Food products sampled in the Netherlands
The Netherlands Institute for Fisheries Research (RIVO) investigated the background concentrations of brominated flame retardants in food products (total 84 samples of poultry, pork, beef, cow fat, pig fat, cheese, milk, whipped cream, eggs, vegetable oil, fish, crustaceans) sampled in 2001/2002 (Leonards et al., 2002). The RIVO measured concentrations of polybrominated diphenyl ethers (PBDEs), hexabromocyclododecane (HBCDD), tetrabromobisphenol-A (TBBP-A) and polybrominated biphenyls (PBBs). The PBBs and PBDE congeners PBDE-71, -77, -190 were not detected in any of the samples. The PBDE-209 is found only in beef fat sample and needs further confirmation. The congeners PBDE-28, -47, -99, -100, -153 and -154 were reported by RIVO; the RIVO total PBDE concentration also includes these congeners.
RIVM investigated the background concentrations of PBDEs in food products sampled in 2003/2004. A sampling programme was designed to obtain representative data on levels of lipophilic components like PBDEs in foods consumed by the general population in the Netherlands. The sampling strategy is based on the assumption that these substances are almost entirely present in the fat fraction of the foodstuffs. For the selection of foods, the database of the Dutch National Food Survey 1998 (Kistemaker et al., 1998) was used. This survey describes the consumption pattern of the Dutch population and includes information on the daily consumption over two consecutive days and a record of age, sex and body weight of 6250 individuals (Kistemaker et al., 1998). Relevant food categories (butter, cheese, milk, eggs, vegetable oils and fats, industrial oils and fats, cereals, fruit, beef, pork, poultry, mixed meat, cow fat, pig fat, chicken fat) were sampled in 2004 and analysed at the Laboratory of Analytical Chemistry of the RIVM in addition to the three fish categories (lean fish, fatty fish, crustaceans) which were sampled in 2003, and analysed by RIVO. For further details see De Mul et al. (2005).
Comparison of different studies
Figure 13 contains a comparison of the total lower bound PBDE concentrations found in European food products. A extensive overview of the Dutch residue data in food products, including comments, and a comparison with the measurements from the literature is given in Appendix 4. Measurements in fish from the literature are only included if they are relevant for fish consumption and reported as concentration per wet weight as RIVO data
(not per g lipids). TBBP-A is not included in the comparison because we did not find any literature on this compound.
The largest total PBDE residues are found in fatty fish, followed by lean fish, vegetable oil and fats, meat, diary products and eggs. It is also clear that there is a large variation in concentrations, which can significantly influence the dietary intake estimates. Some variation can be explained by different congeners measured in different studies and by different food products included in the food groups in different studies. But the large variation cannot be totally explained by the reasons mentioned. Note that the same congeners are measured with the same measurement method in the RIVM samples of 2004 and in the samples of the FIRE project (Flame retardant Integrated Risk assessment for Endocrine Effects, an EU-project
which aims at improving the risk assessment of BFRs for human health and wildlife) at the RIVM.
Total PBDE in food
0 3 6 9 12 15 18 21 24 27 Fish Chee se But ter Eggs Chick en C o n c e n tr a ti o n, n g /g pr od uc t
Total PBDE in food
0 0,1 0,2 0,3 0,4 0,5 0,6 0,7 0,8 0,91 Chic ken Pork Beef Butte r Cheese Milk Eggs Vege tabl e oi l & fat s Cere als Vege table s C onc e n tr a ti o n , ng/ g pr oduc t
Figure 13. Total PBDE residues in European food products (lower bound measurements, <LOD=0 in pooled samples). Residues larger than 1 ng/g are shown in the top figure, residues lower than 1 ng/g are shown in the bottom figure.
From left to right:
Fish (Netherlands FIRE 1999 fatty fish, Netherlands FIRE 1999 fatty fish, Netherlands 2001/2 fatty fish mean, Netherlands 2003 fatty fish mean, Netherlands FIRE 1999 lean fish, Netherlands FIRE 1999 lean fish, Netherlands 2001/2 lean fish mean, Netherlands 2003 lean fish mean, Spain 2000 Bocio et al. 2003, Finland 1997-1999 Kiviranta et al. 2004, EU supermarket salmon Hites et al. 2004);
Cheese (Netherlands FIRE 1991, Netherlands FIRE 1991, Netherlands FIRE 1999, Netherlands FIRE 1999, Netherlands 2001/2 mean, Netherlands 2004, Spain 2000 yogurt and cheese, Finland 1997-1999);
Butter (Netherlands FIRE 1991, Netherlands FIRE 1991, Netherlands FIRE 1999, Netherlands FIRE 1999, Netherlands 2004);
Eggs (Netherlands FIRE 1991, Netherlands FIRE 1991, Netherlands FIRE 1999, Netherlands 2001/2 mean, Netherlands 2004, Spain 2000);
Chicken, pork, beef, vegetable oils and fats (Netherlands FIRE 1999, Netherlands FIRE 1999, Netherlands 2001/2 mean, Netherlands 2004, Spain 2000);
Milk (Netherlands 2001/2 mean, Netherlands 2004, Spain 2000, Finland 1997-1999 milk, sour milk, yogurt, UK D’Silva et al. 2003, France mean Tritscher et al. 2003);
Cereals (Netherlands FIRE 1991 mean, Netherlands 2004); Vegetables (Spain 2000, Finland 1997-1999).
Time trend
In conclusion, there is a large variation in reported concentrations in food products in Europe. Furthermore, consistent information on the temporal trend is lacking. Therefore, it is important to continue the monitoring of PBDE and HBCDD time trends in food products in the future. Therefore regular measurements in pooled samples of different food categories following the procedure used to sample the RIVM data of 2004 (De Mul et al. 2005) is recommended. In view of the large variations in concentrations, a number of samples should be analysed per food category. It is important as well to achieve a good measurement accuracy, as otherwise an unnecessary measurement variability is introduced.
4.2 Dietary intake estimates of brominated flame retardants from
data 2001/2002
The dietary intake in the Netherlands was estimated in 2001 using the RIVO contamination data and the consumption data of the third Dutch National Food Consumption Survey (DNFCS, in Dutch VCP3) (De Winter-Sorkina et al., 2003). The mean dietary intakes of brominated flame retardants by the Dutch population were calculated by multiplication of the mean compound concentration with the mean consumption per food group and summing over food groups. In the middle estimate, for samples with a BFR level lower than the limit of detection (LOD), a value of 0.5 × LOD was assumed. The RIVO determined a LOD for every analysis separately (Leonards et al., 2002). When a compound or a congener could not be detected at all in a food group, the food group was omitted for that compound or congener. In the lower estimate the concentrations of non-detects were set to zero. The reason to perform two calculations was that for some samples RIVO reported very high detection limits. For example, one pork sample has a detection limit for PBDE-153 of 8.2 ng/g, while the maximum measured PBDE-153 concentration in pork equals 0.2 ng/g. Thus, in this case the assigned non-detect concentration dominates the calculation of the intake.
In addition to the separate compounds, we calculated the intake of the sum of the PBDEs. The PBDE congeners having only non-detects in a food group were assumed to have a concentration of zero. If one or more samples of a congener in a food group was positive, for this congener the rest of the samples in this group got a value of 0.5 × LOD for the middle estimate or zero for the lower estimate. In comparison with previous calculations (De Winter-Sorkina et al., 2003) the present report contains corrected intakes of the sum of PBDEs.
Table 4 shows the mean dietary intakes of BFRs by the Dutch population.The dietary intake of HBCDD is comparable to the dietary intake of the sum of PBDEs, while that of TBBP-A is much lower. The relative contribution of food categories to the mean intake of the sum of PBDEs and HBCDD by the Dutch population are shown in Figures 14 and 15. The major contribution to the dietary intake of the sum of PBDEs and of HBCDD comes from meat and meat products. For the sum of PBDEs the contribution of fish and fish products is also relatively high.
Table 4. Mean dietary intake of BFRs by the Dutch population estimated from 2001/2002 data.
Compound Middle dietary intake estimate (ng/kg-bw/day)
Lower dietary intake estimate (ng/kg-bw/day) PBDE-28 0.009 0.009 PBDE-47 0.7 0.5 PBDE-99 0.5 0.3 PBDE-100 0.2 0.1 PBDE-153 1.0 0.1 PBDE-154 0.5 0.2 Sum PBDEs 2.9 1.2 HBCDD 2.9 1.5 TBBP-A 0.04 0.04
LOD – limit of detection, bw – body weight, the mean body weight of DNFCS participants was 65.8 kg.
Sum of PBDEs <LOD=0 cheese 7% vegetable oil 2% meat 52% fish 38% others 1%
Sum of PBDEs <LOD=0.5LOD
fish 15% meat 78% vegetable oil 3% cheese 3% others 1%
Figure 14. The relative contribution of food categories and food products to the mean intake of the sum of PBDEs by the Dutch population, according to lower bound (left) and middle (right) estimates. Only food products with contributions ≥ 2 % are included.
Figure 15. The relative contribution of food categories and food products to the mean intake of HBCDD by the Dutch population, according to lower bound (left) and middle (right) estimates. Only food products with contributions ≥ 2 % are included.
4.3 Dietary intake estimates of PBDEs from data 2003/2004
Recently the dietary intake of PBDEs in the Netherlands was estimated using the most recent RIVM and RIVO food contamination measurements from 2004/2003, and the food consumption data of the third Dutch National Food Consumption Survey (DNFCS, in Dutch: VCP 3) performed in 1997/1998. Lower and middle dietary intake estimates have been made for PBDE congeners PBDE-47, PBDE-99, PBDE-100, sum of PBDE-153 and PBDE-154, PBDE183, and the sum of PBDEs (based on PBDE28, 47, 66, 85, 99, 100, 138, 153, -154, -183 congener concentrations). Just as in the previous estimate of the dietary intake of PBDEs (section 4.2), a lower and a middle estimate were calculated, assigning a value of 0 or 0.5 × LOD for the non-detects respectively. The LOD concentration level was determined separately for every analysis.
Appendix 5 shows the principal flow scheme which has been employed to analyse human dietary intake of PBDEs in the Netherlands. The dietary intake estimation method is extensively described in Freijer et al., 2001. The DNFCS distinguishes 1207 different food products. For 495 of these products it was assumed that they did not contain PBDEs. The conversion of the measured PBDE concentrations to concentrations in 712 NEVO food products is made using the RIKILT Conversion Programme for Agricultural Products (CPAP) model (Van Dooren et al., 1995).
Daily intakes for all individuals that participated in the survey were calculated for the two consecutive days considered in the survey. This was performed by multiplying for each individual the consumed food products with the contaminant concentration and summing up all intakes of one day. A frequency distribution of the intakes of all individuals yields information on the variability of daily intakes in the population. Such a distribution shows the variation in short-term intake, but is unsuitable for an assessment of the long-term intake. A distribution of life-long averaged intakes would be considerably narrower than the distribution of daily intakes, because within-subjects variations level out. Slob (1993a, 1993b) developed a statistical model for the description of dietary intake of chemicals with long-term effects (like dioxins, PCBs and brominated flame retardants): the STatistical Exposure Model (STEM). STEM performs a regression analysis of the log-intake on age, obtains the between-subjects variation and returns the percentiles of the long-term (usual) intake. Further details on the procedure and an extensive evaluation of the assumptions can be found in Slob (1993a, 1993b).
Table 5 gives the medians and the 90, 95, 97.5 and 99 percentiles of the lower and the middle estimate of the long-term daily dietary intake distributions of the sum of PBDEs for ages 2, 10, 40 years and life-long exposure. The dietary intake for children (per unit body weight) is higher than for adults. The results for PBDE congeners PBDE-47, PBDE-99, PBDE-100, the sum of PBDE-153 and PBDE-154, PBDE-183 are shown in Appendix 6.
Table 5. Percentiles of the long-term daily dietary intake distribution of the sum of PBDEs in the Dutch population estimated from 2003/2004 data.
Age (yrs)
Lower dietary intake estimate (ng/kg-bw/day)
Middle dietary intake estimate (ng/kg-bw/day) Sum of PBDEs P50 P90 P95 P97.5 P99 P50 P90 P95 P97.5 P99 2 2.54 4.27 4.95 5.63 6.54 4.37 6.71 7.57 8.41 9.51 10 1.27 2.15 2.49 2.83 3.28 2.26 3.46 3.91 4.34 4.91 40 0.78 1.31 1.52 1.73 2.00 1.38 2.12 2.40 2.66 3.01 Averaged life-long 0.98 1.66 1.92 2.19 2.54 1.73 2.65 3.00 3.33 3.76
A summary for median averaged life-long daily dietary intakes of individual and total PBDEs is shown in Table 6. Most surprising result is a large intake of PBDE-183 which is about equal to the intake of PBDE-47 congener. PBDE-47, a part of the penta-PBDE commercial product, was voluntarily banned in EU the last 10 years. PBDE-183 is a main compound in octa-PBDE commercial product. However, for PBDE-183 the reproducibility of the measurements was less. PBDE-183 shows a relatively large variation (Relative Standard Deviation: 65 %, other PBDE congeners: 16 %).
Table 6. Median of the averaged life-long daily dietary intakes of PBDEs by the Dutch population estimates from 2003/2004 data.
Compound Lower dietary intake estimate (ng/kg-bw/day)
Middle dietary intake estimate (ng/kg-bw/day) PBDE - 47 0.38 0.40 PBDE - 99 0.08 0.11 PBDE - 100 0.012 0.080 PBDE -153 + PBDE - 154 0.0018 0.119 PBDE - 183 0.34 0.42 Sum of PBDEs (28, 47, 66, 85, 99, 100, 138, 153, 154, -183) 0.98 1.73
The model uncertainty can be estimated when a different model for the same purpose is used. The PBDE intake calculation was also performed by RIKILT using the Monte Carlo Risk Assessment (MCRA) programme release 3.4 developed at RIKILT in collaboration with Biometris Wageningen UR (De Mul et al., 2005). The middle intake estimates from both STEM and MCRA models are shown in Table 7. It is clear that the median exposure levels calculated with MCRA were similar to those calculated with the STEM model. This was true for all congeners and the sum of PBDEs. The 97.5 percentiles of exposure from MCRA tended however to be higher than the levels calculated with STEM. Differences ranged from 17 % higher for the sum of PBDE-153 and PBDE-154 to 121 % higher for PBDE-100 (De Mul et al., 2005).
Table 7. Medians and 97.5 percentiles of long-term dietary intakes of PBDEs by
the Dutch population, according to middle estimate from 2003/2004 data by STEM and MCRA models.
Median intakes
ng/kg bw/d P97.5 intakes ng/kg bw/d Compound
STEM MCRA STEM MCRA
PBDE - 47 0.40 0.40 1.09 1.59 PBDE - 99 0.11 0.12 0.21 0.35 PBDE - 100 0.08 0.08 0.14 0.31 PBDE -153 + PBDE - 154 0.12 0.12 0.23 0.27 PBDE - 183 0.42 0.50 1.19 1.45 Sum of PBDEs (-28, -47, -66, -85, -99, -100, -138, -153, -154, -183) 1.73 1.72 3.33 4.62
Figure 16 gives contributions of different food subcategories to the middle estimate of the total PBDE intake as calculated by the MCRA model. The largest contributions are from oils and fats (25 %) and from milk, fish and meat (19, 13 and 11 % respectively). For the middle estimate of the 47 intake the contribution of milk dominates with 49 %, and for PBDE-183 the contribution of oils and fats dominates with 62 % (De Mul et al. 2005).
Sum of PBDEs <LOD=0.5LOD
oils & fats 25% milk 19% fish 13% meat 11% crisp & snack 6% cake & biscuit 5% cheese 4% others 17%
Figure 16. The relative contribution of food categories and food products to the middle estimate of the sum of PBDEs by the Dutch population ( from De Mul et al., 2005).
4.4 Comparison of different studies
Figure 17 shows a comparison of the mean PBDE dietary intakes estimated from 2003/2004 data and the previous Dutch study based on RIVO measurements from 2001/2002
(De Winter-Sorkina et al., 2003). The comparison shows that the mean PBDE-47 intake is about the same for both studies, while the mean intakes of PBDE-99 and PBDE-100 are smaller from the 2003/2004 data. The mean intake of the sum of PBDE-153 and PBDE-154 is much smaller for the 2003/2004 data. In the 2001/2002 study the PBDE-153 and PBDE-154 concentrations found in beef and pork showed the highest contribution to the mean intake. In the 2003/2004 study PBDE-153 and PBDE-154 was found mainly in fish, there were no