RIVM Report 2015-0128
A.M.A. van der Linden et al.
Scenarios for exposure of
aquatic organisms to plant
protection products in the
Netherlands
Soilless cultivations in greenhouses RIVM Report 2015-0128
Colophon
© RIVM 2015
Parts of this publication may be reproduced, provided acknowledgement is given to: National Institute for Public Health and the Environment, along with the title and year of publication.
A.M.A. van der Linden (author), RIVM E.A. van Os (author), WUR
E.L. Wipfler (author), WUR A.A. Cornelese (author), Ctgb D.J.W. Ludeking (author), WUR T. Vermeulen (author), WUR Contact:
Ton van der Linden RIVM
This investigation has been performed by order and for the account of the Ministry of Infrastructure and the Environment (research
programme M/607407, exploration and evaluation of plant protection policy) and the Ministry of Economic Affairs (research programme BO-AGRO-20-002, Authorisation plant protection products), within the framework of development of risk assessment methodology.
This is a publication of:
National Institute for Public Health and the Environment
P.O. Box 1 | 3720 BA Bilthoven The Netherlands
Synopsis
Scenarios for exposure of aquatic organisms to plant protection products in the Netherlands.
Soilless cultivations in greenhouses
New methodologies for the assessment of the exposure of aquatic organisms to plant protection products (PPP) after their use in substrate cultivations in greenhouses were developed. The relevant protection goal is the aquatic ecosystem. In contrast with the current methodology, which was not specifically developed for substrate cultivations, the new methodology accounts for two major potential emission routes: the discharge of recirculation water and the discharge of filter cleaning water into surface water. The Dutch Ministry of Economic Affairs and the Ministry of Infrastructure and the Environment initiated this research to develop an exposure assessment methodology suitable for substrate cultivations in greenhouses.
The new methodology assigns substrate cultivations to four different crop groups according to their water requirement and sodium tolerance. For each of the groups an assessment scenario was developed, taking into account nutrient emission limits. A representative discharge-receiving ditch was selected and parameterised. For each scenario and PPP application method, the Greenhouse Emission Model calculates water flows and PPP behaviour in the growing system, emissions of water and PPP to surface water and the fate of the PPP in the surface water. The resulting concentrations in surface water can be used to decide on the authorisation of PPPs.
Keywords: plant protection products, authorisation, covered crops, emission, exposure, environmental risk assessment, surface water
Publiekssamenvatting
Scenario’s voor de berekening van de blootstelling van waterorganismen aan gewasbeschermingsmiddelen. Substraatteelt in kassen.
Als door het gebruik van gewasbeschermingsmiddelen in kassen restanten van deze middelen in het nabijgelegen oppervlaktewater terechtkomen, kan dat het waterleven aantasten. Hiermee wordt te weinig rekening gehouden bij de huidige risicobeoordeling van het gebruik van een gewasbeschermingsmiddel voor gewassen die in kassen op substraat, bijvoorbeeld steenwol, worden geteeld. Daarom zijn voor deze toepassingen nieuwe methoden voor de risicobeoordeling
ontwikkeld waarin dat wel is ingecalculeerd.
Bij de meeste substraatteelten wordt water zoveel mogelijk opnieuw gebruikt. Gedurende dit proces neemt de concentratie van zouten en andere stoffen toe, waardoor zo nu en dan ‘vervuild’ water moet worden geloosd en vers water moet worden toegevoegd. Ook moeten filters worden schoongespoeld.
De nieuwe methoden omvatten scenario’s voor vier groepen gewassen (vertegenwoordigd door roos, ficus, tomaat en paprika) waarmee de lozingen en resulterende concentraties in oppervlaktewater door het jaar heen kunnen worden berekend. De indeling in de gewasgroepen is gemaakt op basis van de mate waarin gewassen behoefte aan water hebben en zout verdragen. De mate waarin restanten van
gewasbeschermingsmiddelen in het oppervlaktewater komen is onder andere afhankelijk van het teeltsysteem, de wijze van toediening van het gewasbeschermingsmiddel, de mate waarin planten het middel opnemen en de snelheid waarmee het middel in water wordt afgebroken.
De methoden zijn ontwikkeld door het RIVM, de onderzoeksinstituten Alterra en Wageningen UR Glastuinbouw en het College voor de toelating van gewasbeschermingsmiddelen en biociden (Ctgb). Kernwoorden: gewasbeschermingsmiddelen, bedekte teelt, emissie, oppervlaktewater, milieu, risico evaluatie, toelatingsbeoordeling
Contents
Summary — 9 1 Introduction — 11 1.1 Background — 11 1.2 Remit — 13
1.3 Structure of report and reading guidance — 14 2 Risk management decisions — 15
2.1 Risk managers’ decisions — 15
2.2 Interpretation of management decisions by the working group — 16 2.2.1 Endpoint of the exposure assessment — 17
3 Crops, cropping systems and crop scenario development — 19 3.1 Crops in soilless systems — 19
3.2 Nitrogen emission — 20
3.3 Derivation of emission scenarios for PPPs — 21
3.3.1 Overview of regional growing systems and management — 22 3.3.2 Crop categories — 23
3.3.3 Scenario establishment — 25
3.4 Typical examples of water flows related to the scenarios — 27 3.5 Conclusions on crop scenarios — 29
4 Selection and parameterisation of the receiving surface water body — 31
4.1 Receiving water bodies — 31 4.2 Water body selection — 32
4.3 Flow velocities in the selected water body — 34
4.4 Further parameterisation of the water body model — 35 4.4.1 Conceptual model — 35
4.4.2 Weir characteristics — 37
4.4.3 Sediment and suspended solid properties — 37 4.4.4 Temperature — 37
4.5 Coupling of greenhouse scenarios to the parameterised ditch — 37 4.6 Conclusions on ditch selection — 37
5 Substance fate models for substrate cultivations — 39 6 The GEM software package — 41
6.1 The package — 41 6.2 User defined input — 41
7 Conclusions and recommendations — 47 7.1 Conclusions — 47
7.2 Recommendations — 47
Glossary and abbreviations — 53
Appendix A. Threshold values for sodium in discharge water — 55
Appendix B. DTG list — 56
Appendix C. Model A, PPP application by drip irrigation — 62 Appendix D. Model B, PPP spray application to crops grown on shielded slabs — 65
Appendix E. Model C, PPP spray application to crop grown in pots in an ebb/flow system — 70
Summary
During the last few decades, more and more crop-growing systems have changed from soil-bound to soilless cultivation in often high-tech
greenhouses. The environmental risk assessment methodology for applications of plant protection products (PPP) to crops in greenhouses has not been updated since the early 1980s and does not account for major potential emission routes such as the discharge of deteriorated recirculation water and discharges from the cleaning of filters. This report describes methodology that can be used to perform surface water
exposure assessments as part of an overall environmental risk
assessment for such systems. The relevant protection goal is the aquatic ecosystem in discharge-receiving ditches. The methodology is intended to cover all soilless greenhouse crops in the Netherlands and the most common irrigation and PPP application techniques.
The proposed methodology uses three models to calculate the
environmental fate and behaviour of PPP in soilless growing systems and in surface water after discharge. The WATERSTREAMS model is used to calculate water flows in the greenhouse, based on climatic conditions outside the greenhouse, crop characteristics such as water requirement and sodium tolerance, crop management decisions and quality of
available water sources. A substance fate model is used to calculate the degradation, plant uptake and distribution of PPPs in the system,
including the concentration in water that is discharged to surface water. Finally, the TOXSWA model is used to calculate concentrations in surface water and sediment, including the endpoints (i.e. peak concentration and time-weighted average concentration), which can be used in risk assessments. The operation of the models is through a graphical user interface, while PPP parameters are stored in a separate database that is also used by other risk assessment tools.
In risk assessment, realistic worst case scenarios are usually used for the calculations. Ideally, the realistic worst case scenario is selected from a probability distribution of relevant scenarios. Unfortunately, however, the information necessary to establish the probability distribution for greenhouse growing systems is lacking. For example, there is no comprehensive data on the water sources used. Therefore, a more pragmatic approach was followed.
Crops grown on substrate in greenhouses were divided into four categories, based on their water requirement, sodium tolerance and growing system. For each category, a water supply and refreshment scenario was established using expert knowledge, taking account of nutrient emission limits set by the Dutch government for the various crops.
The discharge-receiving ditch was selected from a typical greenhouse area for which the hydrological situation is well understood and all necessary information on daily water flow velocities is available.
1
Introduction
1.1 Background
Soilless growing systems are common in greenhouse horticulture in most European countries, although they are not widely used in every country. Greenhouse horticulture has advantages over open field cultivation because the greenhouse protects the crop against adverse environmental conditions (EFSA 2010a, Stanghellini 2009, van der Linden 2009).
The total greenhouse area in the Netherlands is ca. 10,500 ha, of which 6,500 ha consist of soilless systems (Vermeulen PCM 2010). During the last ten years the total area of protected cultivation in the Netherlands has been rather stable, as has the area devoted to vegetables, flowers and pot plants. All fruit vegetables (tomato, cucumber, sweet pepper, eggplant) have changed from soil-bound to soilless cultivation
(3,000 ha). The other (leaf) vegetable crops (including radish and lettuce; combined area approximately 1,000 ha) are still soil-bound. Some flower crops (rose, gerbera, anthurium, orchid; together 1,500 ha) and pot plants (2,000 ha) are grown in soilless systems. The advantages of soilless systems over soil-bound systems are:
• Growth and yield are independent of the soil type of the cultivated area.
• Growth can be better controlled, for example by the use of high-quality water and more efficient fertigation.
• Products are of higher quality, partly as a result of better growth control.
• A pathogen-free start to the cultivation can be achieved more easily as well as the control of root pathogens.
There are disadvantages as well:
• There is a need for high water quality, i.e. water with low content of substances detrimental or not beneficial to the plants,
amongst others because of the risk of dispersal in the system. • It is expensive to install and maintain the necessary equipment
(e.g. fertigation unit, disinfection equipment and filtering systems for recirculation).
• The costs of fertilising are relatively high, because fertilisers of high quality are required in order to ensure good growth conditions.
Often the advantages outweigh the disadvantages. The disadvantage of the potential dispersal of pathogens is overcome by disinfecting the recirculating solution, mostly with heat treatment or UV radiation
treatment, while the accumulation of coarse-grained organic substances is controlled by filtration.
Several forms of soilless cultivation exist. In the context of this report, a distinction is made between cultivations without recirculation of the nutrient solution, also referred to as ‘open’ or ‘run-to-waste’ systems,
and recirculation systems, also referred to as ‘closed systems’ or ‘closed loop systems’. Whereas outside the Netherlands non-recirculating systems are predominant, in the Netherlands, in most cases, recirculating systems are compulsory1. In comparison, recirculating systems are more efficient with respect to the use of water and nutrients, and lower emissions of substances to the environment are expected. Significant potential disadvantages of recirculating systems are the risk of rapid dispersal of (root) pathogens and phytotoxic substances with the recirculating solution and the accumulation of salt and organic substances in the system.
As stated above, recirculating systems are predominant in the Netherlands. Dutch legislation (Besluit Glastuinbouw, LNV 2002)
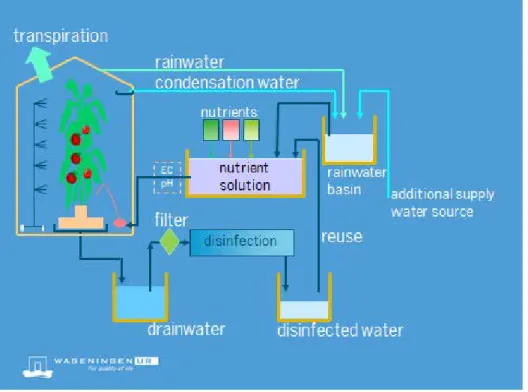
prescribes the use of recirculating systems in soilless cultivations1, with discharge permitted only when sodium concentrations in the recirculating solution exceed crop-specific threshold levels (see Appendix B). It is also compulsory to collect rainwater2 and condensation water and use these as the preferred water sources. In practice, these sources are often mixed or used both at the same time to meet the water demand of the crop. Figure 1-1 gives a schematic overview of the water fluxes in a soilless growing system.
Figure 1-1 Schematised water flows in a greenhouse with a soilless recirculation system. The flows Condensation water and Additional supply may, dependent on local conditions, be directed to the disinfected water reservoir or a
supplementary water storage tank (not shown in the figure).
1 There are some exceptions, such as an exemption for small enterprises and for crops for which recirculation systems are inadequate (Activiteitenbesluit Milieubeheer (Anonymous. 2012. Activiteiten Besluit Milieubeheer. Besluit van 14 september 2012 tot wijziging van het Besluit algemene regels voor inrichtingen milieubeheer.). 2 With some exceptions; see footnote 1.
Although the use of recirculating systems is compulsory in soilless cultivations, the presence of plant protection products (PPPs) in surface water above water quality standards in greenhouse areas suggests that emissions to surface water are underestimated in the current
authorisation process.
In the earlier phases of this project the general characteristics of soilless cultivation in the Netherlands were identified, in terms of both the layout of the systems and management practices (Cuijpers et al. 2008,
Vermeulen T. et al. 2010), and it was concluded that major potential emission routes are not included in the current risk assessment. This report describes a new methodology that takes into account the major emission routes – discharges of deteriorated nutrient solution and filter rinsing water – and predicts the resulting concentrations in surface water. Recently, the legal basis for discharging deteriorated nutrient solution has changed to limits on the total discharge of nutrients
(Activiteitenbesluit Milieubeheer, Anonymous 2012). In order to adhere to this new legal basis, the working group developed water and nutrient management scenarios while retaining the sodium content of the
nutrient solution as the major driving force for discharging deteriorated nutrient solution. The scenarios comply with the nutrient emission limits while respecting the sodium tolerance of the respective crops.
1.2 Remit
The risk assessment methodology for the use of PPPs in greenhouses regarding their potential environmental impact has not changed for the last 30 years. As reported earlier (Cuijpers et al. 2008, Vermeulen T. et al. 2010), the current methods do not reflect agricultural practices in soilless cultivations as they do not account for potential major emission routes to surface water. The Dutch government considered this situation no longer defensible and therefore formed a working group to develop risk assessment methodology for soilless growing systems. The
methodology was to (1) reflect current agricultural practice in
greenhouse horticulture, (2) be in line with the latest knowledge and (3) be easy to incorporate into the authorisation procedure.
The working group on soilless covered crops adopted the following principles for establishing the methodology and scenarios:
• The scenarios and methodology should be developed in close collaboration with the Dutch working group on soil-bound
greenhouse cultivation, especially with regard to the selection of the receiving watercourse.
• The working group should adopt the approaches of the Dutch working group ‘Exposure of Water Organisms’ when applicable. • The developed scenarios should not conflict with EU regulation
1107/2009 (EU 2009).
• The working group should have regular contact with the Dutch Board for the Authorisation of Plant Protection Products and Biocides (Ctgb).
1.3 Structure of report and reading guidance
This report describes the specific methodology that has been developed for performing exposure assessments of PPPs in surface water after use in soilless cultivation in greenhouses in the Netherlands. It also explains the derivation of the scenarios. A similar methodology for soil-bound cultivations in greenhouses is described in Wipfler et al. (2015a). Ideally, the derivation of such scenarios is based on (1) a priori knowledge of growing systems and their management, (2) the characteristics of environmental receptors and (3) broadly accepted, validated models for calculating emissions and resulting concentrations in the environmental receptor in question (see, for example, EFSA 2012a and EFSA 2012b). Appropriate scenarios are then derived by calculating emissions for a large number of situations and substances and selecting relevant ones, taking into account the specific protection goals for the environmental receptors. As basic knowledge of the growing systems and the characteristics of water bodies in greenhouse areas was largely missing, a more pragmatic approach was followed in this study.
Chapter 2 of this report outlines the risk management decisions underlying the procedure and the interpretation of these decisions by the working group. Chapter 3 describes the selection of greenhouse systems and the grouping of the crops grown on soilless systems, as well as water management and agricultural practice in the systems. These practices determine the need to discharge deteriorated nutrient solution and, potentially, PPPs to surface water. Chapter 4 explains the selection and the parameterisation of the ditch into which the
deteriorated nutrient solution is considered to be discharged. The results of the procedures described in Chapters 3 and 4 are input into the models for calculating water flows and substance behaviour in substrate cultivations and, after discharge, in surface water. These models are presented in Chapter 5. The models and scenarios are implemented in the software package GEM (Greenhouse Emission Model). An outline of this package is given in Chapter 6, together with a description of the use of the system and some sample results. Finally, Chapter 7 gives
2
Risk management decisions
2.1 Risk managers’ decisions
The purpose of this report is to establish a specific risk assessment methodology for the exposure of aquatic organisms to plant protection products (PPPs) after their use on substrate (soilless) cultivations in greenhouses in the Netherlands, including the scenarios for which the assessments are performed. The methodology will then be implemented in the authorisation process in the Netherlands in the form of an easy-to-use software package.
In this report, it is understood that risk managers are those at the Ministry of Economic Affairs and the Ministry of Infrastructure and the Environment who are responsible for preparing and implementing legislation with regard to the authorisation of PPPs in the Netherlands. These persons took all risk management decisions that are implemented and will decide later on some open issues, e.g. which concentration (the 50th or the 90th percentile) in surface water to use in the assessment.
The foundation of a robust and efficient environmental risk assessment procedure is a clear specific protection goal. Risk assessors need to know what the risk managers want to protect, where to protect it and over what period (EFSA 2010b). Based on knowledge gained in earlier phases of the project (Cuijpers et al. 2008, Vermeulen T. et al. 2010), the risk managers agreed to base the scenario development on the following principles and boundary conditions:
1) To use a small number of scenarios, covering high and low salt (sodium) tolerance and high and low water requirement.
2) That the population of watercourses should comprise all edge-of-field watercourses. Larger water bodies such as ponds, lakes and rivers should not be included in the population, because they are usually not edge-of–field watercourses.
3) To use a central value of the exposure concentrations in the risk assessment, i.e. a concentration closer to the 50th percentile and
not the realistic worst case (90th percentile), which is normally
used.
4) Not to take PPP removal processes in sewage treatment plants into account.
5) To include a simple option for water treatment in the software package, i.e. the software package should be able to indicate the effect of treatment of water before discharge on the calculated PPP concentrations in the watercourse.
A consideration with respect to the third point is that developments in the area of covered crop production and environmental risk assessment are rapid. Setting strict criteria at this time might unnecessarily restrict further technical and business development and progress in
2.2 Interpretation of management decisions by the working group The boundary condition of a limited number of scenarios requires the categorisation of crops and growing systems. To cover both low and high salt tolerance as well as low and high water requirement, at least four scenarios are required.
In open field risk assessment, the translation of the specific protection goal to scenario selection is usually to take a situation that ranks approximately at the 90th percentile. EFSA (2012a) gives a number of
aspects that should be taken into account when selecting scenarios: 1) The basic unit and the population of these units (usually a
cropping system covering 1 ha).
2) Temporal aspects, i.e. variability in exposure concentrations over time (for example the variability in weather conditions in a particular location).
3) Spatial aspects, i.e. variability in exposure concentrations due to location-dependent properties (for example, available water sources and size and management of discharge-receiving ditches).
4) Substance properties; variability in substance properties may independently or in combination with temporal and spatial aspects lead to different exposure concentrations.
With regard to soilless cultivation in the Netherlands, information about spatial aspects is rather poor. For instance, there are no comprehensive or representative databases on water sources used, discharge strategies or crop management. Therefore, a fully quantitative approach to
scenario selection is impossible. Furthermore, a general policy to reduce emissions of nutrients stepwise has been put forward (Anonymous 2012). Implementation of the general policy causes available information to be outdated rather quickly.
Instead of a fully quantitative approach, a more pragmatic approach was followed. It was decided to categorise crops on the basis of their water demand, dominant growing system and salt tolerance, and to construct, based on expert knowledge of the specific growing systems and taking into account the nutrient emission limits, in-greenhouse scenarios for each category. The aim was to develop scenarios representing realistic worst case situations for each category. Scenarios are based on
discharges into a representative ditch, selected from ditches in one of the larger greenhouse areas in the Netherlands. In the selection, ditch types were weighted according to their occurrence in greenhouse areas. Concentrations of a particular substance in the surface water are then derived by model calculations over an appropriate time series. Specific aspects of the scenarios are given in detail in the following chapters. As the risk managers have not yet decided on the concentration percentile to be used in the risk assessment, this percentile can be set at the start of the calculation procedure to either the 50th or the
90th percentile. The software uses those input values to select the
2.2.1 Endpoint of the exposure assessment
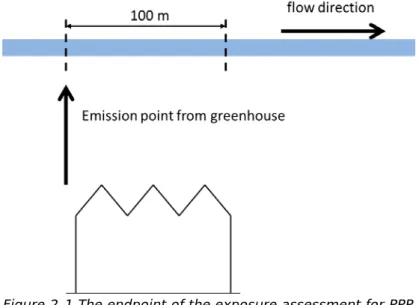
The working group on aquatic effects identified multiple Ecologically Relevant Concentrations (ERC, see Brock et al. 2011). They proposed that the endpoint of the exposure assessment should be either the annual peak concentration or the annual maximum Time Weighted Average (TWA) within one calendar year or part of a calendar year. These two endpoints may lead to different scenarios. Following the working group that developed scenarios for field crops (Tiktak et al. 2012), the working group decided to use the annual peak concentration in water for the water body selection. The scenarios do not take into account the exposure of organisms in sediment. The working group further decided that the assumed endpoint of the exposure assessment should be 100 m of ditch downstream of the greenhouse discharge point (Figure 2-1). The peak concentration is considered to be the maximum average hourly concentration over these 100 m of ditch.
Several systems for purifying water discharged from greenhouses have been studied recently (van Ruijven et al. 2013) and high removal rates have been obtained during the first trials (on average 80% of PPPs were removed). As it is unclear which of the various systems is most likely to be introduced, it was decided to include a purification factor in the model. This factor can be used to calculate the effect of a specific removal rate on the concentrations in surface water. The use of this purification factor in the authorisation procedure is still under discussion at risk manager level. It is envisaged that this factor will be used to estimate the minimum purification required. Removal rates are not taken into account in the scenario selection procedure.
Figure 2-1 The endpoint of the exposure assessment for PPP used on
greenhouse horticulture crops is defined as the annual peak concentration and the TWA over a 100 m length of ditch downstream of the greenhouse discharge point. The discharge is considered to be a point emission.
3
Crops, cropping systems and crop scenario development
In the earlier phase of the working group’s study, sodium concentration in the recirculating nutrient solution was identified as a quantifiable determinant of emissions to surface water (Besluit Glastuinbouw, LNV 2002). Recently, however, the focus of growers’ management has moved to emissions of nutrients (mainly N) to surface water as limits on emissions of these have been set in regulations (Activiteitenbesluit Milieubeheer, Anonymous 2012; Water Framework Directive, EU 2000). In consultation with the relevant risk managers at the ministries, the working group considered it appropriate to develop scenarios that are in line with current growers’ management strategies and regulations. Growers discharge nutrient solution for three reasons: (1) to control sodium concentration, (2) as part of the filter rinsing process and (3) to (arbitrarily) refresh the solution. In order to stay within the limits for nutrient emissions, they have to develop specific water and nutrient management strategies. Expert judgement was applied to quantify both current and likely future strategies. The resulting emission scenarios are described in this chapter.
3.1 Crops in soilless systems
The total greenhouse area in The Netherlands (10,000 ha) is divided between soilless (6,500 ha) and soil-bound (3,500 ha) crops. For most crops grown in greenhouses in the Netherlands, either soilless or soil-bound cultivation is dominant. Here soilless means predominantly growing in all kinds of substrates (e.g. stone wool, coir, peat, perlite), with <5% growing in a nutrient solution without a substrate. From the quantitative information on greenhouse horticulture from 2012
(Vermeulen PCM 2012), the area of soilless crops can be divided as shown in Table 3-1.
Table 3-1 Area of soilless cultivation per group of crops (Vermeulen PCM 2012).
Group Area
(ha) Crops pot plants 2,000 all
vegetables 3,000 tomato, sweet pepper, cucumber, strawberry, aubergine
floriculture 1,500 rose, gerbera, anthurium
In the Netherlands, little diversity is found at the level of growing
systems. The predominant growing systems for specific crops are shown in Table 3-2.
Table 3-2 Cultivation and irrigation system per crop.
Crop Growing system Irrigation system fruit/vegetables substrate – stone wool
or coir drip irrigation roses, gerbera substrate – stone wool
or coir drip irrigation anthurium, cymbidium
(cut flower) substrate – perlite, lava drip irrigation strawberry, small fruit substrate – peat drip irrigation pot plants substrate – peat, clay
or lava granulates ebb/flow starting material (fruit
vegetables, roses) substrate – stone wool or coir ebb/flow
phalaenopsis substrate – bark overhead irrigation lettuce, radish, other
cut flowers, herbs soil-bound overhead irrigation The distinction between drip irrigation, ebb/flow and overhead irrigation is most important for emission flows and registration of PPPs
(Vermeulen T. et al. 2010). The working group developed scenarios for drip irrigation and ebb/flow irrigation, these being the most frequently used irrigation techniques.
3.2 Nitrogen emission
During the last five to ten years it has become clear that the limits on the use nitrogen in soilless cultivation given in the regulation
Gebruiksnormen, Besluit Glastuinbouw (LNV 2002) are not useful in practice as they are not a good indicator of the level of emission of nitrogen to surface water. Therefore, a working group on emission policy (WG Glami) proposed limits on nitrogen emissions from greenhouses with soilless cultivation in the Netherlands. These emission limits have now replaced the use limits of the earlier regulation. Table 3-3 gives the nitrogen emission limits for various soilless crops and their changes over time. The limits for emissions will be reduced further to approach zero emission in 2027, in line with the EU Water Framework Directive (Table 3 in Anonymous 2012).
Table 3-3 Allowed discharge amounts of nitrogen (kg/ha/yr) per crop to achieve almost zero discharge by 2027 (Anonymous 2012).
Category 2012–
2014 2015–2017 After 2017 Crops
1 25 25 25 other vegetables
2 50 33 25 anthurium, bedding plants
3 75 50 38 orchids (cymbidium)
4 100 67 50 tulip, annuals
5 125 83 67 tomato, herbs
6 150 100 75 cucumber, potting plants, starting material floriculture, other flower crops
7 200 133 100 strawberry, aubergine, sweet pepper 8 250 167 125 rose, gerbera, starting material vegetable crops 9 300 200 150 phalaenopsis, other potted orchids 3.3 Derivation of emission scenarios for PPPs
The discharge of water containing PPPs is the main source of PPPs in watercourses near soilless cultivation. Vermeulen T. et al. (2010) identified a number of water emission/discharge flows from soilless growing systems. Typical volumes (in descending order of (average) discharge volume) are:
Discharge flow Volume
(m3/ha/year)
1 recirculation water, based on Na 500–1,000
2 recirculation water, refreshing 500–1,000
3 condensation water – if not re-used c. 1,000
4 filter rinsing water 250–500
5 leakage – 1.5% of water supply c. 150
6 end-of-season discharge (vegetables) 60–80
7 accidents c. 40
8 wash-off from end-of-season clean-up c. 10
9 overspill from rain water basin (after first flush) no information The reuse of condensation water is compulsory in the Netherlands,
making direct emission to surface water due to flow 3 irrelevant.
Condensation water may contain amounts of sprayed PPPs, which enter the system upon reuse and are consequently subject to discharge via other emission routes. Leakage to soil is assumed to result in negligible emission to surface water. Overspill from rainwater basins may lead to the contamination of surface water when collected water contains PPPs (collection of the first flush is compulsory and condensation is
sometimes collected in the rainwater basin). Vermeulen T. et al. (2010) assumed that condensation is collected in the fresh water tank and therefore does not lead to contamination of the water in the rainwater basin. Other contaminations of the rainwater basin are unlikely to be related to the growing system in the greenhouse and are therefore not considered in the assessment procedure for authorisation.
The main emission routes are therefore discharge flows 1, 2 and 4, i.e. the discharge of recirculation water and filter water. Discharge volumes may vary according to crop water need, crop sodium tolerance and crop management conditions. In the exposure assessment, these are
considered the major determinants of emissions.
The formulation of realistic scenarios requires information on growing systems and their management (Section 3.3.1). This information is then used to derive the scenarios (Section 3.3.2).
3.3.1 Overview of regional growing systems and management
Within the Netherlands, an opinion survey was carried out among experts (approximately 20) from research institutes, technical installation companies, water boards and crop consultancies. On the basis of this survey, the following overview of horticultural regions with their typical water supply systems was constructed (Table 3-4).
Table 3-4 Description of typical greenhouse and cultivation characteristics in the different horticultural regions of the Netherlands.
1 2 3 4 5 6 7
Region: Aalsmeer Westland Westland Flevoland Coast Friesland Brabant ZH-islands Oostland C-rivers East-NL Limburg N-Holland Aalsmeer Groningen C-rivers
Oostland Oostland Area (ha): 1,000 1,500 1,000 500 500 500 1,500 Rainwater basin (m3/ha) 500 1,500 2,500 3,000 1,500 4,000 1,000 [Na] (mmol/l) in: rainwater 0.1 0.1 0.1 0.1 0.5 0.1 0.1 reverse osmosis 0.1 0.1 0.1 -- 0.1 -- -- well water 0.3 -- -- -- -- -- 0.3 tap water -- 1.5 1.5 1.5 1.5 -- -- surface water -- -- -- -- -- 1.5 --
discharge water (m3/ha/yr)
tomato 135 135 135 139 135 135 135 rose 145 146 171 268 740 161 163 ficus 79 79 79 79 113 79 79 discharge N (kg/ha/yr) tomato 57 57 57 57 57 57 57 rose 33 33 39 61 168 36 37 ficus 17 17 17 17 17 17 17
The size of the rainwater collection basin and the sodium content in the (additional) water sources were found to affect the level of discharges and emissions to nearby watercourses (Vermeulen T. et al. 2010). Table 3-4 shows that the size of rainwater basins differs per region. Land prices and available space determine growers’ choices, as does the availability of other high-quality water sources. For example, in Brabant
and Limburg there is extensive use of well water (groundwater of good quality), which obviates the need to build large rainwater basins. It also appears that the use of reverse osmosis (RO) water is common in most regions. In general, groundwater is used in the preparation of RO water and the produced quantities of RO water are often enough to
compensate for up to four weeks without rain.
The lower part of Table 3-4 gives estimates of the amounts of discharge water (m3/ha/yr) and the amounts of nitrogen (kg/ha/yr) contained in
it. Values are calculated using the WATERSTREAMS model (Voogt et al. 2012) for typical greenhouse layouts. The calculations assume typical nutrient supply and sodium tolerances of the various crops and emission strategies respecting the target limit values for the period 2015-2017. It appears that discharges do not vary much per region. Exceptional
discharges were found only in the North Sea coast region (region 5). This is due to the higher sodium content in the rainwater in this region. Based on these figures, the working group decided not to distinguish between regions in this respect.
The differences between crops in terms of water discharge volumes and nitrogen emissions are larger than the differences between regions. Differences depend on the tolerance for and uptake of sodium of the crop. On behalf of the LTO growers’ association, van Paassen and Welles (2010) organised a survey among growers (10–30 growers for each crop) to obtain insights into water discharge and nitrogen emission values under current conditions. They found average discharge volumes for tomato, rose and ficus of 335, 1,358 and 484 m3/ha/yr, respectively.
The nitrogen emissions were respectively 110, 219 and 59 kg/ha/yr. Both the discharge volumes and the nitrogen emissions are higher than those calculated and presented in Table 3-4. On the one hand, this can be explained by the values in the table being target values whereas the values reported by van Paassen and Welles 2010 result from practice. On the other hand, it appears that management strategies also play an important role in the emission flows from soilless cultivation. It is expected that management decisions will become more important in practice as growers try to meet the future nitrogen emission limits.
3.3.2 Crop categories
The aim of the scenario development was to derive scenarios that are protective/conservative for the situations they represent. This means that emissions and the resulting concentrations in surface water generated by the derived scenarios are realistic and in line with the percentile set by risk managers, for all crops covered by the relevant scenario.
As stated in the previous paragraph, water flows in the growing system are considered the major determinant of emissions, whereas it is assumed that PPP emissions in general are proportional to the water discharges. Water flows are driven by plant transpiration and water uptake, as well as growers’ choices regarding water supply versus crop water requirement and other management decisions. All influence water discharges and nitrogen emissions to surface water.
Risk managers asked for a small number of scenarios. Therefore, a logical step was to group crops into categories with similar discharges and nitrogen emissions and to choose a representative crop for each category. Initially, a division into two groups was made on the basis of transpiration rates, with the boundary value set at 600 mm. The transpiration rate was used as this is an influential factor in the water supply and consequently the supply of nutrients, the supply and
accumulation of sodium and finally the discharge of nutrients. However, there was not sufficient distinction between two categories as crops in the same category showed substantial differences in emissions (see for example the results for rose and tomato in Table 3-4). Therefore, a further distinction was made to account for differences in the salt tolerance of the crops. A practical distinction level is a sodium tolerance of 4.5 mmol/l (see also Appendix A, which gives the sodium threshold limits above which discharge was permitted). Both category boundaries (a transpiration of 600 mm/yr and a sodium tolerance of 4.5 mmol/l) correspond to growers’ expert knowledge. This results in a group of salt-sensitive and a group of salt-tolerant crops. Table 3-5 gives the
resulting crop categories, important crops in each category (not limiting) and the total area per category.
Table 3-5 Soilless cultivated crop categories based on their transpiration level and salt tolerance.
Transpiration Salt (sodium) tolerance
high (>4.5 mmol/l) low (<4.5 mmol/l) high
(>600 mm/yr) tomato, sweet pepper, cucumber, aubergine, bean, melon
rose, gerbera, anthurium
3,000 ha 800 ha
low
(<600 mm/yr) lettuce, courgette, ficus, starting material vegetables, other
vegetables
strawberry, orchid, phalaenopsis, carnation, amaryllis, bouvardia, iris, starting material flowers
2,000 ha 700 ha
However, a few practical issues prevent adhering to this ordering principle. First, growing systems for the category ‘low transpiration, low salt tolerance’ are highly diverse and some are changing from open to recirculating systems. It is difficult to identify a representative crop and system for this category. Second, it would be not justifiable to treat tomato and sweet pepper, both important crops in terms of acreage and value, in the same way. Because of the substantially higher salt
tolerance of tomato, discharge and emission patterns are different from those in sweet pepper.
Given these considerations, it was decided to develop four scenarios: 1/2 Two scenarios for the category ‘high transpiration, high salt
tolerance’, with tomato and sweet pepper as representative crops, respectively.
3 One scenario for the category ‘low transpiration, high salt tolerance’, with ficus as the representative crop.
4 One scenario for the category ‘low salt tolerance’, with rose as the representative crop.
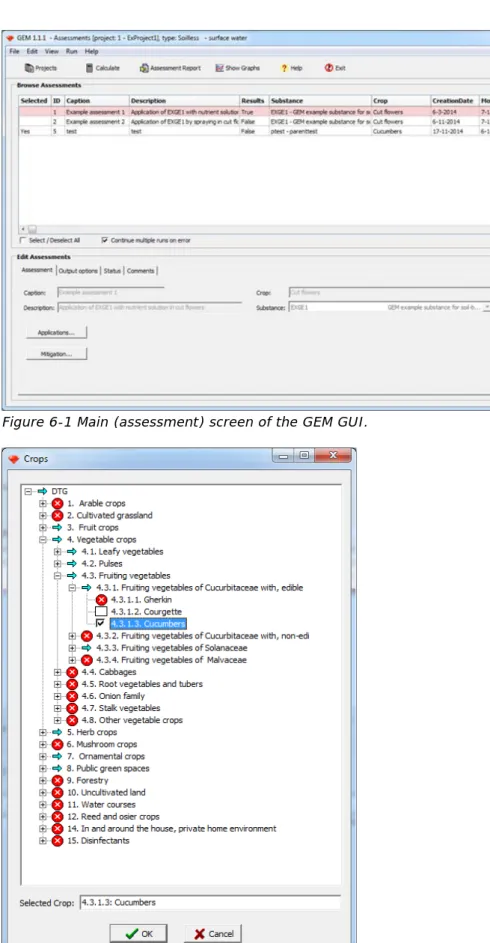
The scenarios are referred to as tomato, sweet pepper, ficus and rose, after the representative crops. Each of the relevant crops from the DTG list (see Appendix B) is assigned to one of the scenarios, on the basis of their transpiration rate and salt tolerance. The relevant scenario is linked to each crop in the software database (see Chapter 6).
Because of the specific growth conditions and PPP applications, the working group discussed the necessity of having one or more dedicated scenarios for nursery crops. In the regulation (Anonymous 2012), nursery crops are in the nutrient-emission categories for vegetables and flowering crops. Based on an analysis of water requirements and water management strategies, the working group considered that it is possible to assign each of the nursery crops to one of the four scenarios
mentioned above. This meant that additional scenarios for nursery crops were not necessary. For a further overview of crops and crop
characteristics see Appendix B.
3.3.3 Scenario establishment
Since soilless growing systems were introduced in the 1980s, the role of sodium has been widely discussed (see amongst others Sonneveld and Voogt 2009). Excessively high levels of sodium damage crops in terms of both quantity and quality. However, certain levels, dependent on the crop, can be tolerated and minimum levels are sometimes required for quality reasons (e.g. for tomato).
Sodium enters the recirculation system with the supply water and with fertilisers. Sodium leaves the recirculation system by crop uptake, discharge of recirculation water and filter rinsing water, and leakage from the system. If the sodium level exceeds the limit value, the grower will discharge the water and replenish with fresh water. However, in horticultural practice there are also other reasons for discharge. Growers may discharge recirculation water in accordance with their irrigation practice (for example always using a mixture of fresh, non-recycled water and recirculated water), undertake a daily flush of the system, and additionally flush when growth is hampered or when irregularities in the nutrient solution are detected. Discharge levels in practice were found to be higher than when calculated according to the physiological rationale of sodium-based management (see Section 3.1). Due to the growing awareness of water quality (with regard to nutrients as well as PPPs) in the Netherlands and political pressure, the practice of
discharging recirculation water is changing towards lower annual discharges and emissions. Table 3-6 gives an overview of the relation between average nitrogen concentration, nitrogen emission norm and maximum volumes of drainwater to be discharged for the four selected crops.
Table 3-6 Relation between nitrate (mmol/l) in drainwater and nitrogen emission norm and amount of discharge (m3/ha/yr).
Tomato Sweet
pepper Rose Ficus NO3 supply (mmol/l) 13.9 16.1 5.6 14.1 NO3 drain (mmol/l) 29.9 22.1 16.2 15.6 N in drain (kg/m3) 0.42 0.31 0.24 0.22 N emission norm (2012–2014), (kg/ha/yr) 125 200 250 150 discharge (m3/ha/yr) 300 650 1,050 700 N emission norm (2015–2017), (kg/ha/yr) 83 133 167 100 discharge (m3/ha/yr) 200 425 700 475
It was decided to base the scenarios on both the need to comply with sodium levels (Table 3-4 and Appendix A) and additional reasons for discharging recirculation water (see above). The latter are translated into water discharge volumes based on expert judgement. In
consultation with risk managers, the scenarios were developed in order to meet the nitrogen emission limits for 2015–2017 (corresponding to the last row of Table 3-6). This means that in the future new scenarios will be required, in order to keep up with the changing emission limits. Analogously to current as well as proposed procedures for open field cultivation, it was decided to account for variability due to weather conditions. A two-step process was used to establish the scenarios. In the first step, calculations were performed for a series of 20 weather years and sodium-based discharge to gain insight into the variability of discharge. Then, in the second step, additional discharges due to crop and system management (e.g. filter rinsing) were added in order to achieve target emission limits (median values).
All the derived scenarios:
• use rainwater with a sodium level of 0.1 mmol/l as the primary water source;
• use RO water with a sodium level 0.1 mmol/l as the first
additional water source and tap water with a sodium level of 1.5 mmol/l as the second additional water source.
Additional characteristics for the four specific crop groups are given in Table 3-7.
Table 3-7 Main characteristics of discharge regimes for the four classes of soilless cultivation water regimes.
Category 1 2 3 4
Associated crop Rose Tomato Sweet
pepper Ficus Crops in this
class gerbera, starting material, vegetables
cucumber,
herbs aubergine, strawberry starting material, floriculture, other flower crops Annual water
demand 8250 m
3/ha 7670 m3/ha 6530 m3/ha 4640 m3/ha
Threshold value
sodium 4 mmol/l 8 mmol/l 8 mmol/l 6 mmol/l
Water supply - plant uptake
ratio 1.5 1.25 1.25 1.5
Recirculation
regime no recirculation in first 8 weeks daily discharge to comply with the sodium threshold no recirculation in first 4 weeks after planting no recirculation in first 8 weeks after planting occasional discharge based on management decision The above choices are the input to the WATERSTREAMS model and
result in four realistic water discharge regimes to be used in the PPP emission and scenario calculations. The weather data were taken from the weather station at Rotterdam airport.
3.4 Typical examples of water flows related to the scenarios
The principles described in the previous paragraphs determine to a large extent the water flows, but the flows are also influenced by fluctuations in weather conditions. Table 3-8 gives typical annual discharge volumes for the four scenarios. For example, 2003 was a year with little rain, and rainwater had to be supplemented by water from a source of lower quality. Consequently, there was more discharge.
Table 3-8 Annual discharge to surface water for the crops rose, sweet pepper, ficus and tomato. The quality of the various water sources was assumed to be the same for the four crops.
Year Annual discharge (m3/ha-1/yr-1)
Rose Sweet
pepper Ficus Tomato
2000 661 388 425 215 2001 663 398 446 220 2002 761 392 440 214 2003 913 729 413 182 2004 611 366 435 207 2005 744 411 440 215 2006 702 477 408 187 Mean 722 452 429 206
Figure 3-1 gives an example of the dynamics of the quantity of fresh water in the rainwater collection basin for a 1 ha nursery. The total basin capacity is 1,500 m3. The basin is full at the start of the year. Due
to consumption and rather low rainfall, especially in March and April, the level in the basin declines to the minimal value of 100 m3. Water from
(Figure 3-2). Occasionally the RO capacity is insufficient and the second additional water source, tap water, is used. Surface water and
groundwater are not used as water sources in this example. Lower water demand later in the season and high precipitation cause the level to go up again and reach capacity.
Figure 3-1 Example of the fresh water stock and its replenishment by rain.
Figure 3-2 Example of water sources used during the growing season. Blue line: rain water; yellow line: reverse osmosis water; red line: tap water.
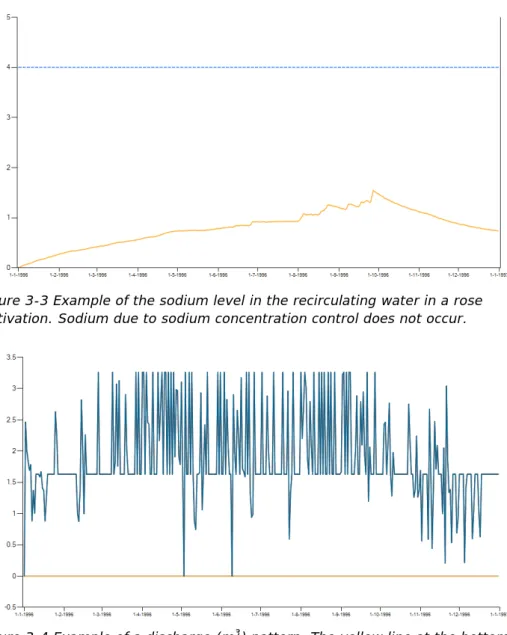
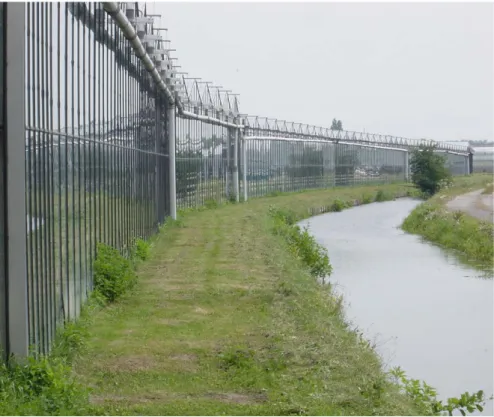
Figure 3-3 gives an example of the rising sodium concentration in the cultivation of roses. In this example, the secondary water source is RO water with a sodium content of 0.1 mmol/l. The sodium concentration does not reach the critical level of 4 mmol/l. Figure 3-4 shows an example of a discharge pattern that results from a strategy aiming at discharging small volumes at a time. There are almost daily discharges due to filter rinsing. Additional discharges of small volumes occur as well. The strategy complies with the nitrogen discharge limit of the crop.
0
100
200
300
0 500 1000 1500 2000 0 50 100 150 200 250 day of year b a s in c o n te n t (m 3 ) p re c ip it a ti o n ( m 3/d )Figure 3-3 Example of the sodium level in the recirculating water in a rose cultivation. Sodium due to sodium concentration control does not occur.
Figure 3-4 Example of a discharge (m3) pattern. The yellow line at the bottom
indicates that no discharge from the drainage tank occurs.
3.5 Conclusions on crop scenarios
Taking the national nutrient emission policy for greenhouses as a boundary condition, it was possible to develop scenarios for water flows in protected soilless growing systems. Essential to the approach were:
• No distinction between regions in the Netherlands;
• Identification of predominant growing systems: substrate systems with drip irrigation and ebb/flow irrigation;
• Selection of reference crops (tomato, sweet pepper, rose and ficus) based on the primary emission factors: transpiration and sodium tolerance;
• Combination of the sodium-based water model
(WATERSTREAMS) for discharge calculations with additional realistic management measures to control crop growth, such as regularly partly refreshing the solution, discharging the solution
during the first few weeks after planting and discharging the solution based on observed growth inhibition;
• Linkage of nitrogen emission limits (in present legislation) to discharge flows: discharge volumes for tomato, sweet pepper, rose and ficus were, respectively, 200, 425, 700 and 475
m3/ha/yr in 2015. These limits were applied to the 50th percentile
year, i.e. discharges will be lower in 50% of the years.
The approach led to four emission scenarios that collectively represent soilless cultivation in the Netherlands. The scenarios provide realistic worst case temporally variable water emission volumes that can be used to calculate PPP emissions to the receiving ditches.
4
Selection and parameterisation of the receiving surface
water body
4.1 Receiving water bodies
Surface water is abundant in the Netherlands. Especially in the western part of the Netherlands, an extensive network of ditches discharges water from the polders via larger water bodies and rivers leading towards the sea.
Figure 4-1 Typical situation in the western part of the Netherlands; the
greenhouses are situated directly next to surface water. Rainwater is collected for use in the growing system in the greenhouse.
The digital topographic map of the Netherlands (TOP10 vector) distinguishes between four categories of watercourses: (i) tertiary watercourses, which are small and/or temporarily dry, (ii) secondary watercourses, having a max. width of 3 m, (iii) primary watercourses, having a width of between 3 and 6 m and (iv) watercourses with a width of between 6 and 12 m. Massop et al. (2006) collected and classified the hydrological characteristics of Dutch watercourses, using the TOP10 vector map as a basis. The collected information included the width of the watercourse, the depth of the watercourse, bottom width, water depth and width at the water surface. The latter two ditch characteristics refer to a wet situation: the recorded water depth is assumed to be exceeded only 10% of the time.
Massop et al. (2006) observed a good correspondence between the geohydrological characteristics of the subsoil and the characteristics of
watercourses. Twenty-two hydrotypes were distinguished, each having distinct geohydrological characteristics (Massop et al. 1997). For each combination of hydrotype and ditch category, they collected ditch characteristics through field inventories and calculated median values and standard deviations. The ensemble of all median ditch properties together generates a standard ditch profile. By coupling the map of hydrotypes and the watercourse categories (TOP10 vector), a spatial distribution of ditch profiles was derived, with the length of watercourses per category for each hydrotype.
The geographical location of horticulture growers was derived from the GIAB CBS geographical information database (Naeff and Smidt 2009). For each grower this database gives the postal address, the greenhouse horticulture area and the crops grown. From this, the area per type of cultivation (soilless or soil-bound) was derived. By combining the spatial distribution of ditch profiles and the geographical location and
characteristics of the growers, a distribution of ditches that potentially receive water from greenhouse horticulture was derived.
In Table 4-1, the area cultivated with soilless crops is shown for the relevant hydrotypes. The hydrotypes Westland C, D and DC cover the largest areas of soilless crop cultivation. These hydrotypes are found mainly in the western part of the Netherlands.
Table 4-1 Area of soilless crops per hydrotype (only the hydrotypes with an area of >30 ha are shown). The names of the hydrotypes are given in Dutch (for explanation see Massop et al. 2006).
Hydrotype Area of soilless crop cultivation (ha) Percentage of total soilless crops Betuwe-komgronden Betuwe-stroomruggronden Dekzand profiel Duinstrook Nuenengroep profiel Open profiel Peeloo profiel Tegelen/Kedichem profiel Westland-C-profiel Westland-D-profiel Westland-DC-profiel Westland-DH-profiel Westland-DHC-profiel Westland-H-profiel Keileem profiel Singraven-beekdalen 108 137 453 498 347 226 68 260 1430 983 932 438 121 250 89 92 2 2 7 8 5 4 1 4 22 15 15 7 2 4 1 1 4.2 Water body selection
The aim of the procedure for selecting the receiving ditch was to select a ditch that could be regarded as representative of greenhouse-discharge-receiving ditches in the Netherlands.
Ditch volume and flow velocities are considered key parameters that explain most of the variation in PPP concentrations after an immission (Westein et al. 1998). Both vary over time, mainly due to weather variability. The lineic volume of a ditch (the volume of water per unit length) is a key determiner of the spatial variability of concentration in ditches. The flow velocity is a key determiner of the temporal variability of ditch concentrations. Other parameters that affect the concentrations in the water are the organic matter content of the sediment and
temperature. As the spatial variability of organic matter content in the sediment in Dutch ditches is unknown, this factor is not considered in the scenario selection. Neither is temperature, which has less effect on PPP concentration than the other factors.
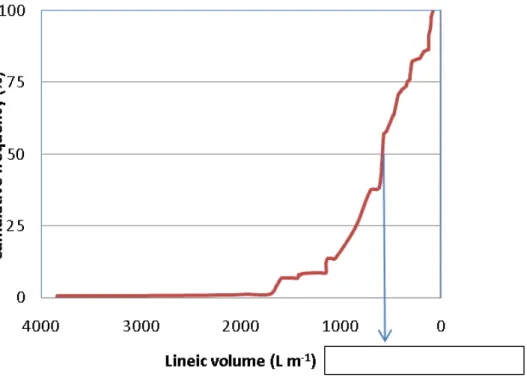
The receiving watercourse was selected by ranking the ditches according to their lineic volume and weighting them according to their abundance. Figure 4-2 shows the cumulative distribution of the ditches that
potentially receive water from greenhouse horticulture, ranked
according to their lineic volume. The 50th percentile (median) ditch has a
lineic volume of 570 L m-1 and refers to the Westland C hydrotype, a
watercourse belonging to category ii. Ditches and streams wider than 6 m (i.e. category iv) are excluded from the population, because they usually do not receive discharge water from greenhouses. Figure 4-3 shows the mean values of the ditch characteristics that belong to a Westland C type, secondary ditch. This ditch type is also used in the parameterisation.
Figure 4-2 Cumulative frequency distribution of all ditches that potentially receive water from soilless greenhouse horticulture cultivation, ranked according to their lineic volume. The 50th percentile has a lineic volume of 570 L m-1.
Figure 4-3 Dimensions of the Westland C ditch, where w is the width of the water surface, h is the water depth, b is the width of the bottom of the ditch, s1
is the side slope (horizontal/vertical), and V is the lineic volume of the water in the ditch.
4.3 Flow velocities in the selected water body
To obtain realistically temporally variable water flow velocities, an existing calibrated hydrodynamic model was used, i.e. the model
(1D/2D SOBEK Rural) of the Oude Campspolder, a polder situated in the Delfland control area between Rotterdam and The Hague. The detailed calibrated hydrodynamic model provided daily water discharges and water depths for 137 watercourse segments within the Oude
Campspolder model for the period 2000–2006. The working group is greatly indebted to the Waterboard of Delfland for providing the model. The velocity distribution of the water bodies within the Oude
Campspolder was assessed and a segment was selected that had the same characteristics as the hydrotype Westland C, while care was taken that the segment velocities were in line with the overall distribution of velocities within the polder. The rationale behind this approach was that the flow velocities within the Oude Campspolder were representative of similar Dutch ‘greenhouse’ ditches.
The methodology followed was that described in Wipfler et al. (2015a). For both the soilless cultivation scenarios and the soil-bound cultivation scenario, the same Westland C ditch was selected and parameterised. Hence, the receiving ditch was the same for all scenarios. See Wipfler et al. (2015a) for a detailed description of the Oude Campspolder
hydrodynamic model as well as for an explanation or the ditch selection procedure.
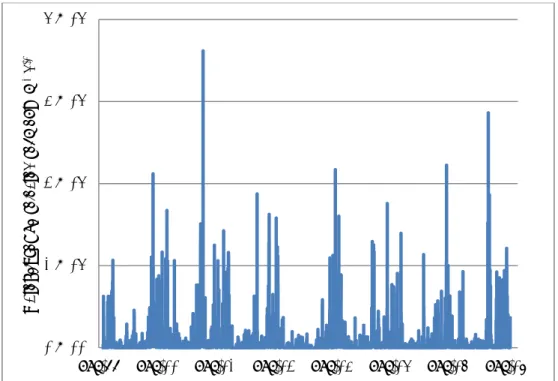
The water fluxes in the selected ditch segment of the Oude Campspolder are shown in Figure 4-4. The available time series is over the
parameterised period, i.e. 1 January 2000 to 31 December 2006. These seven years of daily water fluxes were applied as upper boundary conditions to the simulated ditch.
h s 1 w b w = 2.50m h = 0.26m b = 1.88 m V = 570 L m-1 s 1 (hor/vert) = 1.2
Figure 4-4 Water fluxes of segment 1. These fluxes are used as upper boundary conditions in the simulation.
4.4 Further parameterisation of the water body model
PPP fate in the water body was simulated with the TOXSWA model (TOXic substances in Surface WAters, Adriaanse 1996, Beltman et al. 2014). The model was developed to calculate PPP concentrations in surface water and sediment. TOXSWA considers transport, degradation, the formation of transformation products, sorption to sediment and suspended solids, and volatilisation. The transformation rates cover the combined effect of hydrolysis, photolysis and biodegradation.
Transformation and volatilisation are assumed to be
temperature-dependent. Sorption to sediment and suspended solids is described with the Freundlich equation.
4.4.1 Conceptual model
PPP concentrations are to be calculated in a ditch with a length of 100 m. However, based on experience, we considered a ditch with a length of 400 m to accommodate for a weir 300 m downstream. The
dimensions are constant along the ditch and equal to the Westland C ditch; the dimensions of the ditch are shown in Figure 4-3. The
simulated ditch consists of a water layer and a sediment layer. Exchange between the two layers is only via diffusion.
The (time-varying) external upstream water flux was taken from the Oude Campspolder model and set as an upper boundary condition to the model. No discharge was considered from external fields draining into the ditch except greenhouse discharges. Precipitation and evaporation were not considered by the model. The water leaves the ditch via a weir, located at the lower boundary of the ditch. The bed-slope over the length of the ditch was assumed to be zero, which is consistent with 91% of the slopes observed in the Oude Campspolder. The
non-0,E+00 1,E+04 2,E+04 3,E+04 4,E+04
dec-99 dec-00 dec-01 dec-02 dec-03 dec-04 dec-05 dec-06
w at er fl ux es o f s el ec ted seg m en t ( m 3 d -1)
stationary velocity fluxes within the water body were calculated by solving the water balance equation over the water body. The discharge– water level relationship (Q-h) was approximated by assuming that (dQ(x,t))⁄dx is constant over the length of the ditch, i.e. the water level is constant over the length of the ditch. For further information on the method used see Opheusden et al. 2011.
The applicability of the approximation was assessed by comparing the discharge calculated with the approximation to results obtained with a non-stationary model. The non-stationary model solves the water conservation equation and the momentum conservation equation simultaneously. The assessment revealed that the approximation is sufficient, especially for low flow situations (Wipfler et al. 2015a). The discharge from greenhouses to the ditch was simulated as a point source at the upper boundary of the ditch by adding the discharge volume flux to the upstream water flux of the water layer. Hence, the discharged volumes were supposed to be additional to the ‘Oude Campspolder’ fluxes. The PPP mass that is discharged by the greenhouse was simulated as an incoming mass flux at the upper boundary of the ditch. No other sources of PPP were considered. In TOXSWA, a PPP within the water layer is subject to convective and dispersive transport, volatilisation, degradation, sorption to suspended material, and exchange with the sediment layer via diffusion. The substance mass balance was solved over the first 150 m of the evaluation ditch – 100 m for calculation of the ERC and 50 m to eliminate the boundary effect at the lower boundary resulting from neglecting dispersion.
Exchange with the sediment layer occurs via diffusive transport at the water–sediment interface. The TOXSWA sediment layer has a thickness of 10 cm and is characterised by bulk density, porosity and organic matter content. These parameters were assumed to be constant over the sediment layer, i.e. there is no gradient either along or
perpendicular to the ditch. Within the sediment layer, the PPP concentration may vary along and perpendicular to the ditch due to diffusive transport and adsorption. It was assumed that there is no exchange between sediment and groundwater (Neumann boundary condition).
The number of ha of greenhouses that may discharge into a ditch depends on the greenhouse density and the total length of the ditches that potentially receive discharge from greenhouses. The area of greenhouses and the corresponding ditch length have been studied for six high-density greenhouse areas in the Netherlands. The assessment revealed that for the studied areas there is approximately 100 m of nearby ditch per ha of greenhouses. The working group did not have information regarding crop treatment in the area upstream of a
discharge point. It was assumed that the upstream area of the ditch is untreated and the horticultural area of each grower is 100% treated, i.e. 1 ha of treated crops discharge to the 100 m of evaluation ditch.
4.4.2 Weir characteristics
At the upper boundary of the model, water flows over a weir. Weir properties consist of the weir width and the height of the weir crest. In conformity with FOCUS (2001) and the field crop scenario (Tiktak et al. 2012) the width of the weir was set at 0.5 m. The height of the weir crest has been calibrated such that the lineic volume of 570 L m-1 (see
Section 4.2) is exceeded only for 10% of the time (in line with the general design of ditches in the Netherlands). The calibrated weir crest height for the evaluation ditch was 0.16 m.
4.4.3 Sediment and suspended solid properties
For the sediment and suspended solid properties, the values derived for the evaluation ditch for field crops (Table 4-2) were used. Properties are based on values from available databases. Macrophytes are assumed to be absent. For further details see Tiktak et al. (2012).
Table 4-2 Sediment and suspended solid characteristics.
Characteristic Value
concentration of suspended solids in the water layer 11 g m-3
mass fraction of organic matter in suspended solids 0.090 kg kg-1
sediment layer depth 0.1 m
mass fraction of organic matter in sediment 0.090 kg kg-1
bulk density of the sediment 800 kg m-3
porosity 0.68 m3 m-3
tortuosity 0.56 (-)
4.4.4 Temperature
The TOXSWA model uses monthly averaged values for the water
temperature in the ditch to calculate the effect of temperature on the rate coefficients for volatilisation and transformation of PPP. It was assumed that the temperature in ditch water equals the air temperature. Mean monthly temperatures were calculated on the basis of the daily minimum and maximum air temperatures of the de Bilt weather station provided by the KNMI.
4.5 Coupling of greenhouse scenarios to the parameterised ditch From the hydrodynamic model only seven simulated years of velocity fluxes were available. As a consequence, simulations were done for only seven years. These years were assumed to be sufficient to derive the considered percentile.
4.6 Conclusions on ditch selection
Using the geographical information of the TOP10 map combined with characteristics of water bodies by Massop et al. (2006), a 50th percentile
water body was selected, which is of type Westland C, secondary ditch. The receiving water body had a length of 150 m with a weir
downstream. The incoming (upstream) water flow was taken from a selected segment of the calibrated hydrodynamic model of the Oude Campspolder, situated in the western part of the Netherlands. The TOXSWA surface water fate model was parameterised. The
concentrations in water averaged over 100 m of water body due to discharge from soilless horticulture. The discharge area was set to 1 ha. From the time series of water concentrations the Predicted
Environmental Concentration (PEC) can be derived, being either the 50th