National Institute for Public Health and the Environment
P.O. Box 1 | 3720 BA Bilthoven www.rivm.com
Disease burden and cost-of-illness of
food-related pathogens in the
Netherlands, 2011
RIVM Report 330331007/2013Colophon
© RIVM 2013
Parts of this publication may be reproduced, provided acknowledgement is given to: National Institute for Public Health and the Environment, along with the title and year of publication.
Marie-Josee J. Mangen, UMCU
Martijn Bouwknegt, RIVM
Ingrid H.M. Friesema, RIVM
Laetitia M. Kortbeek, RIVM
Wilfrid van Pelt, RIVM
Arie H. Havelaar, RIVM
Contact:
Arie Havelaar
RIVM/CIb/LZO
arie.havelaar@rivm.nl
This investigation has been performed by order and for the account of the Ministry of VWS, the department of Nutrition, Health protection and Prevention, within the framework of Project 5.2.1
Abstract
Cost-of-illness of food-related pathogens in the Netherlands, 2011
The Ministry of VWS has requested RIVM to present the cost-of-illness caused by fourteen food-related pathogens; this is done annually since 2011. These
pathogens can be transmitted by food, the environment, animals and humans. In 2011, the costs of these 14 pathogens are estimated at 416 million euro. Most diseases are caused by norovirus, Campylobacter bacteria and rotavirus, they also cause the highest costs. The costs per patient are highest for the bacterium Listeria monocytogenes, the protozoan parasite Toxoplasma gondii and hepatitis E-virus, because these cause relatively severe diseases.
Subdivision of costs of foodborne illness
More than 40% of all costs-of-illness can be attributed to food (168 million euro per year). The other costs can be attributed to exposure from humans (28%), the environment (15%) and animals (7%), while 9% were travel-related. The costs of foodborne infection have been specified more in detail. Products of animal origin account for 86 million per year (or 51% of the costs attributed to food) per year. Fish, fruit and vegetables, beverages, grains and other foods account for 8%, 6%, 2% 5% and 14% of the costs attributed to food,
respectively. Human and animal contamination of foods accounts for 14% of the costs attributed to food.
Subdivision of cost types
The researchers have subdivided the costs of the 14 pathogens in three categories. First, there are costs for doctor’s fees, hospitalisations and
medicines, the so-called direct healthcare costs. They account for less than 25% of all costs. Costs paid by patients, such as travel costs to and from the doctor, are called direct non-healthcare costs. These are low. Productivity losses due to work absence of patients and special education as a consequence of neurological disease are called indirect non-healthcare costs. These are substantial and amount up to 75% of the total costs.
Keywords: food-related pathogens, costs, cost-of-illness, direct healthcare costs, indirect non-healthcare costs
Rapport in het kort
Maatschappelijke kosten van via voedsel overdraagbare pathogenen in Nederland in 2011
Op verzoek van het ministerie van VWS onderzoekt het RIVM de
maatschappelijke kosten van 14 ziekteverwekkers; vanaf 2011 wordt dit jaarlijks in kaart gebracht. De infecties die de ziekteverwekkers veroorzaken, kunnen worden overgedragen via voedsel, de mens, het milieu of dieren
(zoönosen). De geschatte kosten van de 14 ziekteverwekkers bedroegen in 2011 416 miljoen euro. De meeste mensen worden ziek van een besmetting met het norovirus, de Campylobacter-bacterie en het rotavirus waardoor deze de hoogste kosten met zich meebrengen. Als naar de kosten per patiënt wordt gekeken, zijn deze het hoogst bij een besmetting door de bacterie Listeria monocytogenes, de parasiet Toxoplasma gondii, en het hepatitis E-virus omdat deze relatief ernstige ziekteverschijnselen veroorzaken.
Onderverdeling kosten van voedselinfecties
Meer dan 40 procent van de totale kosten die de onderzochte ziekteverwekkers met zich meebrengen wordt via voedsel veroorzaakt (168 miljoen euro in 2011). De overige kosten worden toegeschreven aan de overdracht van mens op mens (28 procent), blootstelling via het milieu (15 procent) of via contacten tussen dieren en mensen (7 procent). De resterende 9 procent van de kosten is gerelateerd aan reizen naar het buitenland.
De kosten van voedselinfecties zijn nader gespecificeerd. Ruim de helft
(51 procent oftewel 86 miljoen euro) van de kosten van voedselinfecties worden veroorzaakt door producten van dierlijke oorsprong, zoals vlees, eieren en zuivelproducten. Vis, fruit en groenten, dranken, graanproducten en andere niet-gespecificeerde voedselgroepen veroorzaken respectievelijk 8, 6, 2, 5 en 14 procent van de ziektekosten toegeschreven aan voedsel.
Onderverdeling soorten kosten
De onderzoekers hebben de maatschappelijke kosten van de
14 ziekteverwekkers onderverdeeld in drie categorieën. Ten eerste zijn er de kosten voor consulten aan artsen, ziekenhuisopnamen en medicijnen, de ‘directe medische kosten’. Deze bedragen minder dan 25 procent van alle kosten. Daarnaast bestaan ze uit kosten die door de patiënt zelf worden betaald, zoals reiskosten van en naar de arts (directe niet-medische kosten). Deze zijn laag. Als derde post zijn er de kosten die voortvloeien uit productiviteitsverliezen vanwege werkverzuim van de patiënten en speciaal onderwijs na neurologische aandoeningen (indirecte niet-medische kosten). Deze post is het meest
substantieel en bedraagt bijna 75 procent van de totale kosten
Trefwoorden: voedselgerelateerde ziekte, kosten, ziektekosten, direct medische kosten, indirect niet-medische kosten
Contents
Summary—9Acknowledgment—11
1
Introduction—13
2
Food-related pathogens—15
2.1
General—15
2.2
The pathogens under study—15
3
Incidences estimates for 2011—19
4
Cost-of-illness—23
4.1
General approach—23
4.2
Health outcome specific assumptions—30
4.3
Results—61
4.4
Discussion—71
References—75
Appendices—83
Appendix I-Summary of published European and North-American cost and cost- effectiveness studies—83
Appendix II-Summary of European Cohort studies reporting information on observed health outcomes and/or resource utilizations of congenital toxoplasmosis—89
Summary
Cost-of-illness of food-related pathogens in the Netherlands, 2011
Since 2008, RIVM regularly publishes estimates of the incidence, burden and costs of 14 food-related pathogens on its web pages. Using incident case data from 2011, the total costs-of-illness of fourteen food-related pathogens and associated sequelae were estimated at € 468 million, if undiscounted, and at € 416 million if discounted by 4%. Direct healthcare costs accounted for 24% of the total costs, direct non-healthcare costs for 2% and indirect non-healthcare costs for 74% of the total costs. At the population level norovirus, with € 106 million, had the highest total cost-of-illness, followed by Campylobacter
spp.(€ 76 million) and rotavirus (€ 73 million). However, when considering only direct healthcare costs, then Campylobacter infections would cause the highest costs at the population level with € 27 million, followed by Toxoplasma gondii (€ 20 million) and rotavirus (€ 12.5 million). Cost-of-illness per infected case varied between € 150 for Clostridium perfringens to € 275,000 for perinatal listeriosis.
More than 40% of all costs-of-illness can be attributed to food, in total € 168 million per year. Beef, lamb, pork and poultry meat alone account for 39% of these costs. Foods of animal origin (meat products together with eggs and dairy products) account for € 86 million (or 51% of the costs attributed to food).
Staphylococcus aureus intoxications accounted for the highest share of costs attributed to food (€ 47.1 million), followed by Campylobacter spp.
Acknowledgment
The authors would like to thank Anna Lugnér and Anita Suijkerbuijk for discussing the hepatitis A virus costs. Furthermore, the authors would like to thank Liesbeth Mollema from the RIVM for providing the raw data from the Pienter 2 study on sick leave due to gastroenteritis symptoms, as well as all the people participating in the Pienter 2 study and having filled in the
questionnaires.
Malgosia Verboon-Maciolek and Niek de Wit, both from UMCU Utrecht, provided feedback on congenital toxoplasmosis and IBS respectively.
The authors acknowledge the valuable input of earlier cost-of-illness work by Luqman Tariq, Bart van der Zande and Sylvia Vijgen, as well as the valuable input from all the people involved when setting-up the different outcome trees and incidence estimates. These are in particular Juanita Haagsma, Jeanet Kemmeren, Linda Verhoef and Yvonne van Duynhoven.
1
Introduction
The Dutch Ministry of Health, Welfare and Sports wishes to focus its food safety policy on the most relevant pathogens as a basis for effective and efficient decision making on control, prevention and surveillance of food-related disease. Therefore, the RIVM has been asked to perform a study to establish the priority of pathogenic micro-organisms in food. Disability Adjusted Life Year (DALY) and cost-of-illness (COI) were the two criteria chosen to evaluate the priority of pathogenic micro-organisms.
DALYs are used to measure the burden of illness due to morbidity and mortality related to the pathogens under study by integrating incidence data with indices of severity and duration (for details see Havelaar, Haagsma et al. (2012)). Cost-of-illness studies measure the costs related to the resources used within the healthcare sector (also referred to as direct healthcare costs (DHC)), the resources used by patients and their family (also referred to as direct non-healthcare costs (DNHC)), and productivity losses due to work absence of patients and caregivers and other non-health care costs indirectly related to illness (also referred to as indirect non-healthcare costs (INHC)).
In this report we present in Chapter 2 the models of disease process for the fourteen pathogens and associated sequelae. In Chapter 3 we show the incidence estimates for the year 2011 for the fourteen pathogenic micro-organisms that form the basis for the COI estimates. In Chapter 4 we present and discuss the estimated associated cost-of-illness for these fourteen
pathogenic micro-organisms for the year 2011, describing the applied method and the underlying assumptions.
DALY estimates for the year 2011 are presented in a separate report by Bouwknegt et al. (2013).
2
Food-related pathogens
2.1 General
In order to assess the burden of disease and the cost of illness for the various pathogens under study, the disease outcomes following infection needs to be defined. Therefore, for each pathogen, a separate model of the disease process was designed, resulting in fourteen outcome trees. Each block in an outcome tree (see Figure 1) represents a health outcome with or without further separation of health states (see Box 1). Transition probabilities between all blocks were established. In this study the incidence and pathogen-based approach was used to estimate both the disease burden and the cost-of-illness (ECDC, 2010).
Figure 1: Generalized outcome tree (Source: ECDC, 2010)
Box 1 – Health outcome and health states
For example, the health outcome gastro-enteritis (GE) might be further split into three health states (ECDC, 2011), namely mild GE symptoms (i.e. patients not requiring medical services); moderate GE symptoms (i.e. patients consulting a general practitioner) and severe GE symptoms (i.e. hospitalized patients), all health states of the health outcome GE.
2.2 The pathogens under study
We estimated the costs, similar to Havelaar et al. (2012), for seven pathogens causing infectious gastroenteritis (GE), including three bacteria (thermophilic Campylobacter spp., Shiga-toxin producing Escherichia coli O157 (STEC O157), nontyphoidal Salmonella spp.), two viruses (norovirus and rotavirus) and two protozoa (Cryptosporidium spp., Giardia spp.); three GE toxinproducing bacteria (Bacillus cereus, Clostridium perfringens and Staphylococcus aureus), and four pathogens causing systemic infections (Listeria monocytogenes, hepatitis A virus, hepatitis E virus, Toxoplasma gondii). ‘These pathogens are chosen because of data availability and because preliminary analysis indicates they
Infection Sequela 2 Chronic infection Sequela 1 R Asymptomatic Symptomatic Death Death R R R R Sequela 3 Death R
cause the highest burden of foodborne disease in the Netherlands’ (Havelaar et al., 2012).
Acute gastroenteritis (GE) is in most cases self-limiting within a few days to weeks. For few patients the disease is fatal. Among the pathogens under study, apart from GE, no other illness was assumed to be related to norovirus,
rotavirus, Cryptosporidium spp., Giardia spp., Bacillus cereus toxin, Clostridium perfringens toxin or Staphylococcus aureus toxin infections in humans.
Campylobacter spp., Shiga toxin-producing Echerichia coli O157 (STEC O157) and Salmonella spp. infections however, do result in sequelae. Irritable bowel syndrome (IBS) is the most significant sequela occurring after salmonellosis and campylobacteriosis (Haagsma et al., 2010). Reactive Arthritis (ReA), an acute aseptic arthritis triggered by an infection elsewhere in the body, is a sequela occurring after salmonellosis and campylobacteriosis. Guillain-Barré syndrome (GBS), a neurological disease frequently preceded by an acute infectious illness and affecting at least the motoric, sensory and autonomic nerves supplying the limbs, is a sequela occurring after campylobacteriosis (Mishu et al., 1993; Jacobs et al., 1998; Poropatich et al., 2010). Crohn’s disease and ulcerative colitis, collectively classified as inflammatory bowel disease (IBD), is a chronic intestinal disorder of unknown aetiology and is a sequela occurring after campylobacteriosis and salmonellosis (Helms et al., 2006). Post-diarrheal haemolytic uremic syndrome (HUS) and end stage renal disease (ESRD) are sequelae associated with STEC (Havelaar et al., 2004). In the current study we considered only STEC O157, but other subtypes can become more important in the future. The frequency of other post-infectious complications following GE is low and they were therefore disregarded in the current study.
Symptoms of a hepatitis A virus (HAV) and hepatitis E virus (HEV) infections in young children are often mild flu-like symptoms without icteric symptoms, whereas in adults frequently reported symptoms are jaundice, dark urine, fatigue, loss of appetite, abdominal pain and light-coloured stool lasting for several weeks (Koff, 1992). Post-complications like fulminant hepatitis, which might in very rare cases result in liver transplantation, are rare and therefore not considered (Havelaar et al., 2012) when estimating the disease burden, and are also not considered in current cost estimations.
Listeriosis is potentially life-threatening for risk groups like neonates, elderly (especially with co-morbidity) and patients with impaired cell-mediated immunity. Manifestations of acquired listeriosis are meningitis, septicemia, pneumonia, and gastroenteritis. Infections in previously healthy individuals are usually mild and self-limiting, but for some the disease is fatal. Further, a proportion of non-fatal cases with meningitis will develop neurological sequelae. Infection of pregnant women may lead to abortion or premature labour.
Infection in newborns (so-called perinatal listeriosis) may lead to severe
systemic infection, mainly meningitis with or without sepsis, which may result in death or long-term neurological sequelae (Havelaar et al., 2012).
An infection with Toxoplasma gondii, if ‘acquired’ (i.e. not perinatal), is in most cases asymptomatic and self-limiting (Rorman et al., 2006). Chorioretinitis is the most frequent reported symptom in immune-competent patients infected by Toxoplasma gondii and therefore considered in the current cost estimations (Burnett et al., 1998; Gilbert et al., 2008; Commodaro et al., 2009). Not considered were more severe forms of illness such as encephalitis, as they do occur only rare and mostly in immune-compromised patients (Rorman et al.,
2006). Also not considered were the less severe or aspecific symptoms such as chronic fatigue, malaise and lymphadenopathy.
Vertical transmission of Toxoplasma gondii from a newly infected pregnant woman to her foetus may lead to congenital toxoplasmosis (Rorman et al., 2006). Congenital toxoplasmosis can result either in asymptomatic infections, with or without developing symptoms later in life: mostly chorioretinitis (referred hereafter as post-1-year chorioretinitis) or mild to severe clinical symptoms at birth i.e. chorioretinitis, intracranial calcifications, central nervous system (CNS) abnormalities and hydrocephalus, some of them being fatal (so-called neonatal deaths) (Rorman et al., 2006; Havelaar et al., 2007; Kortbeek et al., 2009; Havelaar et al., 2012). Foetal infection may also result in natural abortion and stillbirth (Rorman et al., 2006) resulting in medical consultations of the affected women.
For each of the fourteen food-related pathogens, disease outcomes in relation to the different pathogen-specific gastroenteritis and pathogen-specific systemic infections respectively, had to be defined. A detailed description of the method and the underlying assumptions for outcome trees and transition probabilities are given in Havelaar et al. (2012).
The disease outcomes considered represent the state-of-the-art in 2011.
However, new scientific knowledge becoming available in the future might result in the reconsideration of the different outcome trees of the pathogens under study, and the inclusion of additional disease outcomes linked to these pathogens.
3
Incidences estimates for 2011
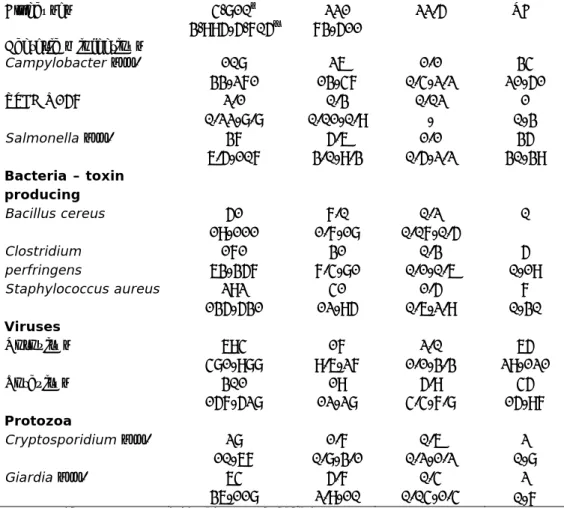
The incident cases for 2011 in the Netherlands as estimated by Bouwknegt et al. (2013) are presented in the following Tables. The underlying methodology is described in Havelaar et al. (2012). These incident cases formed the input for the COI estimations presented in the following chapter. Incident cases of gastroenteritis by pathogen, and of non-gastrointestinal pathogens in the Netherlands are presented in Table 1 and Table 2 respectively, whereas Table 3 presents the incidence of sequelae by pathogen in the Netherlands.
Table 1. Incidence of gastroenteritis by pathogen in the Netherlands, 2011 (Source: Bouwknegt et al., 2013)
Pathogen General population (x 1,000) GP visit (x 1,000) Hospitalised (x 1,000) Fatal cases All causes 4,810† 3,995-5,705‡ 221 73-511 22.5 NA# Bacteria – infectious Campylobacter spp. 108 33-271 26 13-47 1.1 0.4-2.2 34 21-51 STEC O157 2.1 0.22-8.8 0.3 0.01-0.9 0.02 - 1 0-3 Salmonella spp. 37 6.5-107 5.6 3.0-9.3 1.1 0.5-2.2 35 30-39 Bacteria – toxin producing Bacillus cereus 51 19-111 7.0 1.7-18 0.2 0.07-0.5 0 Clostridium perfringens 171 63-357 31 7.4-81 0.3 0.1-0.6 5 0-19 Staphylococcus aureus 292 135-531 41 12-95 1.5 0.6-2.9 7 0-30 Viruses Norovirus 694 481-988 17 9.6-27 2.0 1.1-3.3 65 29-121 Rotavirus 301 157-528 19 12-28 5.9 4.4-7.8 45 15-97 Protozoa Cryptosporidium spp. 28 10-67 1.7 0.8-3.1 0.6 0.2-1.2 2 0-8 Giardia spp. 64 36-118 5.7 2.9-10 0.4 0.04-1.4 2 0-7
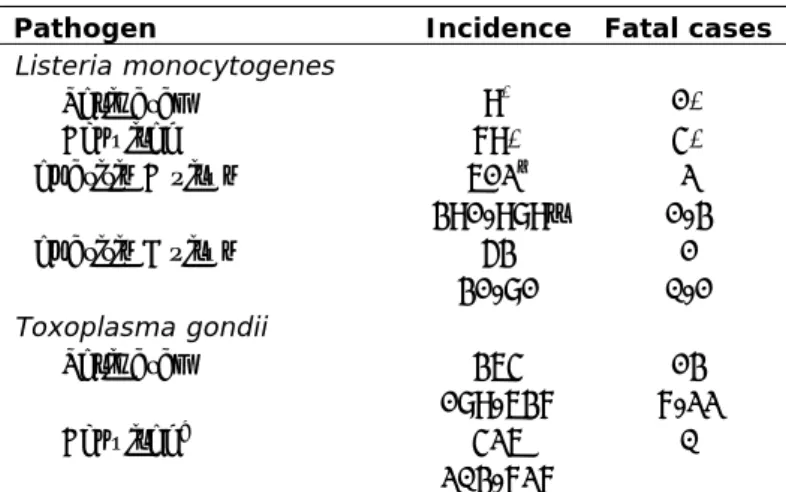
Table 2. Incidence of non-gastroenteritis pathogens in the Netherlands, 2011 (Source: Bouwknegt et al., 2013)
Pathogen Incidence Fatal cases
Listeria monocytogenes Perinatal 9* 1* Acquired 79* 4* Hepatitis A virus 612† 391-989‡ 2 1-3 Hepatitis E virus 53 31-81 1 0-1 Toxoplasma gondii Perinatal 364 189-637 13 7-22 Acquired^ 426 203-727 0
Note: * No uncertainty because cases were acquired through active surveillance; †mean; ‡
2.5-97.5 percentile; ^ Chorioretinitis only.
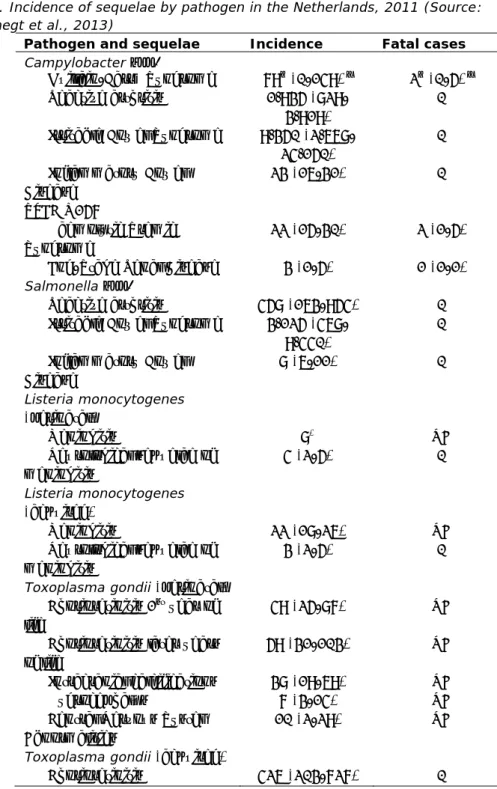
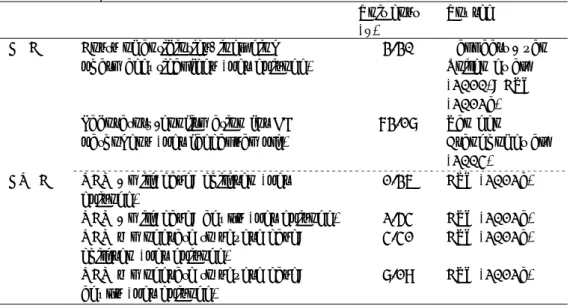
Table 3. Incidence of sequelae by pathogen in the Netherlands, 2011 (Source: Bouwknegt et al., 2013)
Pathogen and sequelae Incidence Fatal cases
Campylobacter spp.
Guillain-Barré Syndrome 79† (0-149) ‡ 2† (0-5) ‡ Reactive arthritis 1,935
(829-3,919)
0 Irritable Bowel Syndrome 9,350
(2,668-24,150) 0 Inflammatory Bowel Disease 23 (16-31) 0 STEC O157 Haemolytic Uremic Syndrome 22 (15-30) 2 (1-5) End-Stage Renal Disease 3 (1-5) 1 (1-1) Salmonella spp. Reactive arthritis 458 (163-954) 0 Irritable Bowel Syndrome 3,125
(468-9,440) 0 Inflammatory Bowel Disease 8 (6-11) 0 Listeria monocytogenes (perinatal) Meningitis 8* NA Neurological sequelae of meningitis 4 (2-5) 0 Listeria monocytogenes (acquired) Meningitis 22 (18-26) NA Neurological sequelae of meningitis 3 (2-5) 0
Toxoplasma gondii (perinatal) Chorioretinitis 1st year of life
49 (25-87) NA Chorioretinitis later years
of life
59 (31-103) NA Intracranial calcifications 38 (19-69) NA Hydrocephalus 7 (3-14) NA Central Nervous System
Abnormalities
10 (2-29) NA Toxoplasma gondii (acquired)
Chorioretinitis 426 (203-727) 0
Note: †mean; ‡ 2.5-97.5 percentile; * No uncertainty because cases were acquired through
4
Cost-of-illness
4.1 General approach
Cost-of-illness studies measure the costs related to the resources used within the healthcare sector (also referred to as direct healthcare costs (DHC)), the resources used by patients and their family (also referred to as direct non-healthcare costs (DNHC)), and productivity losses due to work absence of patients and caregivers and other non-health care costs indirectly related to illness (also referred to as indirect non-healthcare costs (INHC)) (Hakkaart - van Roijen et al., 2010). Apart from those three categories, no other costs were considered in the current study.
In the current study we estimated the COI for the year 2011, using both the third payer (i.e. DHC) and the societal perspective (i.e. DHC, DNHC and INHC). Unit cost prices, where necessary, were updated to 2011 using the consumer price index of Statistics Netherlands (Statistics Netherlands, 2012).
In accordance with the Dutch guidelines for health economic evaluations (Hakkaart - van Roijen et al., 2010), this study did not consider indirect
healthcare costs. Indirect healthcare costs would comprise the future savings in healthcare costs in the life years lost due to premature death.
Costs in future years were discounted with a rate of 4%1, according to Dutch guidelines (Hakkaart - van Roijen et al., 2010).
4.1.1 Direct healthcare costs (DHC)
The DHC category included valuation for medical services such as general practice (GP) consultations, specialists consultations, hospitalization, drugs, rehabilitation and other medical services. DHC costs were estimated for each pathogen separately, the total direct healthcare costs were estimated by accumulating the costs for the different medical services for all illnesses
including sequelae resulting from an infection and for all disease severity states related to this pathogen.
For each health outcome/health state (l) of that specific disease and for each specific medical service, the direct healthcare costs related to a specific pathogen were estimated by multiplying the number of cases requiring
healthcare service (m) by the required healthcare service units per case (p) and by the costs per healthcare service unit (mc). All three factors may be age-dependent with a from 0 until amax.
The formula for direct healthcare costs for a specific pathogen for health outcomes/health states l and for healthcare service i are in basic notation:
1 Discounting is multiplying a cost-estimate by a discount rate to calculate its present value (the 'discounted value'). It is the opposite of ‘putting money in a bank account’ where interest rates are used in determining how an investment will grow on a monthly or yearly basis. For example, € 1,000 on a savings account at an annual interest rate of 10 percent will increase in five years total to € 1,610.51. Conversely, the present value of € 1,610.51 realized after five years of investment is € 1,000 when discounted at an annual rate of 10 percent.
4.1.2 Direct non-healthcare costs (DHC)
Direct non-healthcare care costs are costs paid by the patients themselves. They are therefore also sometimes referred to as ´patient costs´. Travel costs of patients, costs for additional diapers, informal care and out-of-pocket costs for over-the-counter medication and other co-payments by patients are some examples of direct non-healthcare (DNHC) costs. DNHC costs were estimated for each pathogen separately. For each health outcome/health state (l) of a specific pathogen and for each specific non-healthcare service (j), DNHC costs related to a specific pathogen were estimated by multiplying the number of cases requiring non-healthcare service (r) by the required non-healthcare service units per case (q) and by the costs per non-healthcare service unit (rc). All three factors may be age-dependent a.
The formula for DNHC costs for a specific pathogen for health outcomes,
respectively health states l and for non-healthcare service j are in basic notation:
4.1.3 Indirect non-healthcare costs (INHC)
Indirect non-healthcare costs (INHC) are mainly production losses for the society due to disease, but costs for special education as a consequence of disease (e.g. disabled children as a consequence to a perinatal listeriosis infection) are another example of INHC costs and, where applicable, therefore considered in the current study.
Production losses were considered if patients were absent from work due to illness or if caregivers were absent from work in order to take care of a sick patient. Based on the Dutch economic guidelines (Hakkaart - van Roijen et al., 2010), production losses due to absenteeism were considered for both paid and unpaid work. Unpaid work would be for example grandparents taking care of their grandchildren, but also other charity work. Production losses could be the consequences of:
temporary absence from work;
permanent or long-term disability; and
premature mortality.If information was available, we considered for paid work all three categories using the friction cost method. In this method, production losses are only considered for the period needed to replace a sick, invalid or dead worker, the so-called ‘friction period’ (Koopmanschap and Van Ineveld, 1992;
Koopmanschap et al., 1995). This method takes into account the economic processes that ensure a sick, invalid or dead person can and will be replaced after a period of adaptation (Koopmanschap and Van Ineveld, 1992). The duration of the friction period depends on the situation of the labour market. A high unemployment rate generally allows fast replacement, whereas in the case of a low unemployment rate, on average more time is needed to find someone in the labour market that could fill the position. We assumed for 2011 a friction
period of 23 weeks, similar to the one reported for 2009 by Hakkaart - van Roijen et al., 2010.
For each health outcome/health state (l) of that specific disease and for each specific indirect non-healthcare service (k), INHC costs were estimated by multiplying the number of cases requiring indirect non-healthcare service (s) by the required indirect non-healthcare service units per case (u) and by the costs per indirect non-healthcare service unit (v). All three factors may be age-dependent (a).
The formula for INHC costs are in basic notation:
4.1.4 General
In order to calculate the COI for the different health outcomes, data on the number of cases per age-group, the resources used, the volumes for use of resources and the actual economic cost price of each of these resource units were necessary. We needed the information per age group, because of
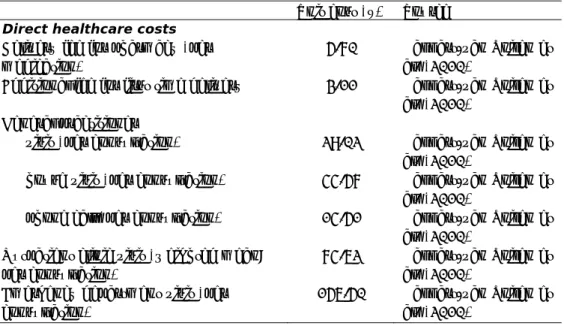
differences in resources use (e.g. sickness leave) and type of costs (e.g. hospital costs; production loss) by age. Dutch prices were used where available and are summarized in Table 4. Disease-specific costs are listed in the following sections. Some general assumptions were made for travelling and sickness leave of
patients and caregiver, and are summarized in section 4.1.4.1. These assumptions were used if there were no disease-specific details available. Disease-specific details on assumptions made for the different cost categories are given in the following chapters.
For IBD, IBS, HUS and ESRD, the associated costs were derived from Dutch studies (Goettsch et al., 2004; Tariq et al., 2011; Van der Valk et al., 2012 )and where necessary indexed to the year 2011.
Table 4. Unit costs in 2011 €
Unit cost (€) Source
Direct healthcare costs
Delivery fee for pharmacy (per medication)
5.70 Hakkart-van Roijen et al. (2010)
Additional fee for first time delivery 3.11 Hakkart-van Roijen et al. (2010)
General practitioner
visit (per consultation) 29.02 Hakkart-van Roijen et al. (2010)
house visit (per consultation) 44.57 Hakkart-van Roijen et al. (2010)
phone call (per consultation) 14.51 Hakkart-van Roijen et al. (2010)
Outpatient clinic visit (weighted mean; per consultation)
74.62 Hakkart-van Roijen et al. (2010)
Emergency department visit (per consultation)
156.50 Hakkart-van Roijen et al. (2010)
Table 4. Unit costs in 2011 € (suite)
Unit cost (€) Source
Direct healthcare costs (suite)
Hospital admission adults (weighted
mean, per day) 473.65
Hakkart-van Roijen et al. (2010)
Hospital admission children (weighted mean, per day)
615.75a Hakkart-van Roijen et al. (2010)
Intensive care unit (per day) 2,262.55 Hakkart-van Roijen et al. (2010)
Revalidation – inpatient (per day) 352.39 Hakkart-van Roijen et al. (2010)
Revalidation (per hour) 114.01 Hakkart-van Roijen et al. (2010)
Physiotherapy (per visit / per 0.5 hour) 37.31 Hakkart-van Roijen et al. (2010)
Mentally and physically disabled institutional care (per day)
246.67 Hakkart-van Roijen et al. (2010)
Elderly nursing home (per day) 246.67 Hakkart-van Roijen et al. (2010)
Transport by ambulance to hospital – urgent (per trip)
522.37 Hakkart-van Roijen et al. (2010)
Transport by ambulance to e.g.
revalidation centre / nursing home (per trip)
251.85 Hakkart-van Roijen et al. (2010)
Direct non-healthcare costs
Car/public transport (per km) 0.21 Hakkart-van Roijen et al. (2010)
Parking fees (per visit) 3.11 Hakkart-van Roijen et al. (2010)
Indirect non-healthcare costs
Additional cost for special education
…for primary school & kindergarten … …(per student/year)
17,400 Ministerie van Onderwijs Cultuur en Wetenschap
(2011a,b)
…for secondary school (per
…student/year)
22,158 Ministerie van Onderwijs Cultuur en Wetenschap
(2011a,b) Productivity loss (PL) due to work absence from unpaid work
for work absence from unpaid work
… (per hour)
12.96 Hakkart-van Roijen et al. (2010)
Productivity loss due to work absence from paid work for average working person (per …
.…hour)
31.11 Hakkart-van Roijen et al. (2010)
for average working woman (per
.…hour)
26.88 Hakkart-van Roijen et al. (2010)
for average working parenting
.…caregiver (per hour)
27.20b Hakkart-van Roijen et al. (2010)
Table 4. Unit costs in 2011 € (suite)
Unit cost (€) Source Productivity loss due to work absence from paid work
for working person between 15-19
.…years (per hour)
9.61 Hakkart-van Roijen et al. (2010)
for working person between 20-24
.…years (per hour)
18.15 Hakkart-van Roijen et al. (2010)
for working person between 25-29
.…years (per hour)
24.80 Hakkart-van Roijen et al. (2010)
for working person between 30-34
.…years (per hour)
29.85 Hakkart-van Roijen et al. (2010)
for working person between 35-39
.…years (per hour)
33.43 Hakkart-van Roijen et al. (2010)
for working person between 40-44
.…years (per hour)
35.16 Hakkart-van Roijen et al. (2010)
for working person between 45-49
.…years (per hour)
36.14 Hakkart-van Roijen et al. (2010)
for working person between 50-54
.…years (per hour)
36.91 Hakkart-van Roijen et al. (2010)
for working person between 55-59
.…years (per hour)
37.70 Hakkart-van Roijen et al. (2010)
for working person between 60-64
.…years (per hour)
37.74 Hakkart-van Roijen et al. (2010)
Productivity loss for a fatal case
between 15-19 years (per death) 1,211c Hakkart-van Roijen et al. (2010)
between 20-24 years (per death) 6,461c Hakkart-van Roijen et al. (2010)
between 25-29 years (per death) 13,381c Hakkart-van Roijen et al. (2010)
between 30-34 years (per death) 17,019c Hakkart-van Roijen et al. (2010)
between 35-39 years (per death) 18,315c Hakkart-van Roijen et al. (2010)
between 40-44 years (per death) 19,018c Hakkart-van Roijen et al. (2010)
between 45-49 years (per death) 19,715c Hakkart-van Roijen et al. (2010)
between 50-54 years (per death) 18,659c Hakkart-van Roijen et al. (2010)
between 55-59 years (per death) 16,697c Hakkart-van Roijen et al. (2010)
between 60-64 years (per death) 8,458c Hakkart-van Roijen et al. (2010)
Notes:
a) Children receive more intensive care than adults. We therefore assumed the costs for children are about 1.3 times higher than for adults, based on Hoogendoorn et al. (2004).
b) Apart from single father households, we assumed in all other households the mother is the primary caregiver. According to Statistics Netherlands (2012) there were in 2011 about 2.9% single father households, 12.9% single mother
households and 84.4% two-parent households (Mol, 2008; Statistics Netherlands, 2012).
c) Productivity losses for fatal cases were estimated assuming a friction period of 23 weeks (Hakkart-van Roijen et al., 2010). Furthermore, productivity losses were based on average working hours as reported by Statistics Netherlands (2012) in the corresponding age-group, but corrected by 18% for bank holidays, vacation, schooling etc. (Hakkaart - van Roijen et al., 2010) and corrected for the
proportion of the non-working population in the specific age-group. Productivity losses were corrected for the proportion not working in the corresponding age-group (Statistics Netherlands, 2012).
4.1.4.1 General assumptions 4.1.4.1.1 Travel costs
Information on travelling to and from healthcare providers is scarce, and
assumptions had to be made. We assumed, similar to Mangen et al. (2005), that no additional travelling was required in order to buy over-the-counter medicines. Medicines on prescription were assumed to be bought in a pharmacy on the way back from the GP (no additional travel costs). Travel costs were only considered when visiting a doctor, a healer, a physiotherapist or equivalent, when having an outpatient consultation and when being hospitalized. Based on Friesema et al., 2012 we assumed 77% and 97% of the persons younger than 15 years and 15 years and older respectively, would use either a car or public transport when visiting a GP, a healer or a physiotherapist. In the case of hospitalization 97% of persons younger than 15 years were assumed to be transported to the hospital by using either a car or public transport (Friesema et al., 2012). For patients older than 15 years we assumed 100% would be transported to the hospital by using either a car or public transport. When travelling by car or public transport, we assumed half of the patients would have taken a car and the other half would have used public transport. For the costs calculations we used average distances as reported in Hakkaart - van Roijen et al. (2010) and the unit cost prices as listed in Table 4.
4.1.4.1.2 Productivity losses due to absenteeism from paid work
Productivity losses from paid work of patients were, if not otherwise stated, valued using standard tariffs, according to the corresponding age-classes (see Table 4). We further assumed a productivity loss of € 27.20 per hour for caregivers of children and of € 31.11 per hour for caregivers of adults, who would be absent from paid work in order to take care of a sick child/adult patient. For unpaid work we assumed for all age-classes a productivity loss of € 12.96, for both patients and caregivers.
Sickness leave of patients
Information on duration of sickness leave of patients from paid work was not always available and assumptions had to be made. In the absence of disease-specific information, we assumed that per week of illness (being either duration of symptoms or duration of hospitalization), an average person between 15 and 64 years would be on average absent for 23,5 hours per week2. Additionally, we assumed an outpatient visit, a consultation with a GP or with a therapist or
2 In 2011 74.9% of the Dutch population between 15 and 64 years had a paid job, and those with paid jobs worked on average 31.4 hours per week (Statistics Netherlands, 2012). For any average person between 15 and 64 years this corresponds to 23.5 hours/week.
healer would cause an average person between 15 and 64 years to be absent for on average 4.7, 2.4 and 1.2 hours per session respectively3.
Sickness leave of caregivers
There was also not always information available on duration of sickness leave from paid work of caregivers for a sick person; assumptions had to be made. For the absence of caregivers from a paid job, we assumed per week of
illness/hospitalization, caregivers of children from 0 to 4 years would be on average absent for 16.4 hours per week4. But according to the findings from the Pienter 2 study (Mollema et al., 2009), parents of children 5 years and older stay away from work for shorter periods than parents with younger children having similar symptoms (see Table 7 in section 4.2.1.3). This holds at least for mild to moderate health outcomes. We therefore assumed for health outcomes with mild and moderate symptoms that the average sickness leaves of
caregivers for children 5 years and older would be equal to 50% of the sickness leave of caregivers for children 0 to 4 years with similar symptoms. For
hospitalized children no age-distinction was made. We assumed a work absence of caregivers of 16.4 hours per week of hospitalization. Additionally, we
assumed an outpatient visit, a consultation with a GP or with a therapist or healer would result in a 3.28, 1.64 and 0.82 hour work absence of caregivers per session, respectively5.
For patients 65 years and older, we assumed zero work loss of caregivers in the case of mild to moderate symptoms, similar to the findings for GE patients (see section 4.2.1.3). But for severely affected and hospitalized patients we assumed, based on Friesema et al. (2012), a caregiver on average would be absent from paid work for 0.4 hours per hospitalization stay.
4.1.5 Uncertainty
Data necessary for the quantitative estimates of incident cases and the costs are often limited and/or absent, which leads to some degree of uncertainty.
Total uncertainty was therefore broken down into variability and uncertainty. Variability is defined as ‘the inherent heterogeneity of a system’, e.g. variations in the duration of the hospital stay of different patients. Uncertainty is usually defined as ‘a lack of perfect knowledge about a factor in the model that represents the system’ (Vose, 2001). Both uncertainty and variability can be expressed in a statistical distribution function, but require a different strategy to account for in the analysis.
3 Assuming an outpatient visit, a consultation with a GP or with a therapist or healer would result in a 8, 4 and 2 hour work absence per session respectively, as they generally take place between Monday to Friday during regular working hours. But these hours are reduced to correct for the proportion of persons not working, about 25% (Statistics Netherlands, 2012), and the fact that since an average working week in the Netherlands is 31.4 hours (less than a 40-hour week) (Statistics Netherlands, 2012), then some of these consultations might have taken place outside working hours.
4 Assuming that, except for single-father households, it would be always the mother who is the primary caregiver and would stay at home to take care of a sick child. In 2011 76% of the primary-caregiver would have paid work and those with a paid job worked on average 21.7 hours (Statistics Netherlands, 2012). For an average caregiver this corresponds to 16.4 hours/week.
5 Assuming an outpatient visit, a consultation of a GP and of a therapist or healer would result in a 8, 4 and 2 hour work absence of caregivers per session respectively, as they generally take place between Monday to Friday during regular working hours. But correcting these hours for the proportion of caregivers not working, about 24% (Statistics Netherlands, 2012) and the fact that an average working week of a caregiver in the Netherlands is with 21.7 hours less than a 40-hour week (Statistics Netherlands, 2012), is why some of these consultations might have taken place outside working hours.
Variability cannot be reduced and is also less important from a decision making point of view and was therefore not modelled in the present study. Variable factors were represented by arithmetic means.
However, with the availability of more information on a system, the uncertainty might be reduced. For example the incidence of illness is not known but is estimated from observational data on a sample of the population. The larger the sample, the smaller the uncertainty in the incidence estimate. In the current analysis three kinds of uncertainty were distinguished:
• statistical uncertainty, due to small sample sizes;
• systematic uncertainty, due to the use of data which are not fully representative for the Dutch situation;
• uncertainty due to lack of data and the use of data from expert opinions. Statistical uncertainty was analysed by representing uncertain parameters with an appropriate frequency distribution, followed by Monte Carlo simulation to estimate predictive intervals, as was done in the current study in particular for incident cases. Results presented are the mean, and the 95% credible intervals resulting from the stochastic simulations. Uncertainty is evaluated by Monte Carlo simulation (Analytica Professional 4.4.1, Lumina Decision Systems, Los Gatos, CA, USA; 10,000 iterations).
Scenario analysis is used to represent uncertainty due to lack of data and systematic uncertainty.
4.2 Health outcome specific assumptions
4.2.1 Gastroenteritis (GE) 4.2.1.1 Direct healthcare costs
Consultation with a GP in the Netherlands might occur either by phone, by a GP practice visit or by a house call from the GP to the patient. GP telephone consultations with the doctors’ assistant were not included as consultations in the estimates of incident GE cases visiting a GP (De Wit et al., 2001b). We therefore assume per GE case visiting a GP additionally 0.97 telephone consultations would occur (De Wit et al., 2001b). A GP consultation itself is in 90% of cases a GP practice visit and in 10% of cases it would be a house call from the GP to the patient (De Wit et al., 2001b).
For hospitalized GE patients, the number of GP consultations during regular hours, GP consultations in weekends/evening hours, outpatient clinic visits and emergency department visits is slightly higher than for GE patients not requiring hospitalization and was assumed to be 1.3, 0.7, 0.4 and 0.1 for persons
< 18 years, and 1.7, 0.3, 1.4 and 0.3 for persons ≥ 18 years respectively (Friesema et al., 2012).
For some patients consulting their GP, a faecal sample is submitted for laboratory testing in order to determine the etiologic agent. Doorduyn et al. (2011) reported that in 18% of all GE cases visiting a GP a faecal sample is taken. Based on Haagsma et al. (2012) we assumed a faecal sample is taken in 25% of bacteria or toxin–producing pathogens triggered GE cases visiting a GP and in 10% of virus or protozoa triggered GE cases visiting a GP. In case of hospitalization we assumed that in 100% of the cases a faecal sample would be submitted for laboratory testing (Friesema et al., 2012). Assuming that in general testing for 6 pathogens would be conducted (Van den Brandhof et al., 2004) the costs for testing would be € 73.18 (see Table 5).
About 27% of patients visiting a GP are assumed to get a prescription for antibiotics (Doorduyn et al., 2011), resulting in estimated costs of € 3.30 per episode visiting a GP (CVZ, 2012a), see Table 5.
The duration of hospitalization depends on the aetiology of the GE pathogen as well as on the age of the patient. But pathogen-specific hospitalization duration and/or age-dependent hospitalization duration are seldom reported. In the GEops study, a Dutch prospectively followed cohort of hospitalized GE cases, age-dependent hospitalization duration was reported. After correction for readmission, the age-dependent hospitalization duration was 2.82 days, 9.88 days and 12.28 days for GE patients younger than 18 years, GE patients between 18-64 years and elderly GE patients (≥ 65 years) respectively
(Friesema et al., 2012). This is in line with Ruzante et al. (2011) who reported that for hospitalized campylobacteriosis, salmonellosis, and norovirus cases the duration of hospitalization in days increased with age.
For bacterial GE we based our assumptions on hospitalization duration for campylobacteriosis, salmonellosis and STEC O157 on the GEops study, taking into consideration the age of the hospitalized patient (see Table 6).
Table 5. GE-specific DHC and DNHC costs in 2011
Unit cost
(€)
Source DHC Costs of antibiotics, including
pharmaceutical fees (per episode)
3.30 Hakkaart - van Roijen et al. (2010); CVZ (2012a) Laboratory-confirmation for GE
pathogens (per faecal sample)
73.18 Van den Brandhof et al. (2004)
DNHC OCM - mild case; children (per episode)
1.36 CVZ (2012a) OCM - mild case; adults (per episode) 2.54 CVZ (2012a) OCM – moderate to severe case;
children (per episode)
4.41 CVZ (2012a) OCM – moderate to severe case;
adults (per episode)
8.19 CVZ (2012a)
Illness from the toxin-producing pathogens, especially Clostridium perfringens toxin results in longer hospitalizations, whereas for Bacillus cereus and
Staphylococcus aureus the reported hospitalization stay is far lower than for any other hospitalized GE case. We therefore assume, based on Adak et al. (2002; 2005), an average duration of 2.59 days and 1.20 days for hospitalization due to Bacillus cereus and Staphylococcus aureus respectively (see Table 6). For Clostridium perfringens toxin the hospitalization duration was based on the GEops findings (see Table 6), which is more in line with the reported 14.8 days by Adak et al. (2002; 2005), although that might be a slight underestimation of the true duration of a hospitalization stay for Clostridium perfringens toxin cases.
The assumed hospitalization duration for rotavirus and norovirus was also based on the GEops study (see Table 6). In the GEops study most GE cases in children were associated with rotavirus. But also a larger proportion of the adult GE cases (> 20%) found in the GEops study were due to rotavirus. However, it has
to be noted that the 2.9 days of hospitalization (or 2.6 days if no readmission is included) for children is far lower than the 4 days found by De Wit et al. (2001a) or other European studies which report 3.8 days to 4.2 days for hospitalized rotavirus cases in children (Lynch et al., 2001; Gil et al., 2004). For norovirus Ruzante et al. (2011) found a mean stay of 17 days (median age was 72 years), whereas Adak et al. (2002; 2005) found an average duration of 3.9 days. The 17 days are higher than the mean stay for hospitalized adult GE cases in the GEops study (10.8 days). Therefore the hospital stay for norovirus patients might be underestimated, in particular for elderly patients when using the GEops study. But given the fact other studies do report far lower days in hospital than Ruzante et al. (2011), we prefer to base our estimates on the GEops study. The observed hospitalization duration from the GEops study is also used for giardiasis cases and cryptosporidiosis cases (see Table 6). In the previous estimates, Vijgen et al. (2007) assumed 8 days for cryptosporidiosis cases based on Corso et al. (2003), who reported 5 days for cryptosporidiosis without
underlying condition; 7 days for cryptosporidiosis with underlying condition others than AIDS and 16 days for cryptosporidiosis with AIDS, and overall 8 days. Collier et al. (2012) found 5.9 days. In contrast for giardiasis, Vijgen et al. (2007) assumed 4 days based on Lengerich et al. (1994), who reported a median duration of 4 days (0-32 days). Adak et al. (2002; 2005) found 3.7 days and Collier et al. (2012) 4.1 days. This is lower than found for an average GE case in the GEops study. Nevertheless did we assume the GEops study here also, as there is no reason why it should be different than for other GE-pathogens.
According to the GEops study we assumed about 1%, 19% and 71% of GE patients younger than 18 years, GE patients between 18-64 years and elderly GE patients (≥ 65 years) respectively, would be transported to hospital by ambulance (Friesema et al., 2012).
In the GEops study approximately 5.9% of the elderly GE patients (≥ 65 years) was transferred from hospital into a nursing home for some 60 days before returning home (Friesema et al., 2012). This is in line with Ruzante et al. (2011) who reported that about 5% of all salmonellosis and campylobacteriosis cases, 1% of all EHEC cases and 8% of all norovirus cases were sent home with support service; less than 6.5% of salmonellosis and campylobacteriosis cases, 11% of EHEC cases and 18% of norovirus cases were transferred to another institution (i.e. long-term care facility, another facility providing in-patient hospital care or another type of institution). We therefore assumed in the current study approximately 5.9% (modelled as Beta (1,16)-distribution) of non-fatal and elderly (≥ 65 years) hospitalized GE patients would be admitted to a nursing home for an average of 60 days (Friesema et al., 2012).
We assume fatal cases would incur the same DHC costs as non-fatal GE cases, with one exception: the costs for being admitted to a nursing home. We assumed fatal cases would have died before being admitted to a nursing home.
Table 6. Assumed hospitalization duration for the different GE-pathogens Hospitalization duration (in days) Source 0-15 years 15-64 years ≥65 years Bacteria – infectious
Campylobacter spp. 2.82 9.88 12.28 Friesema et al. (2012)
STEC O157 2.82 9.88 12.28 Friesema et al. (2012)
Salmonella spp. 2.82 9.88 12.28 Friesema et al. (2012)
Bacteria – toxin producing
Bacillus cereus 2.59 2.59 2.59 Adak et al. (2002; 2005)
Clostridium perfringens 2.82 9.88 12.28 Friesema et al. (2012)
Staphylococcus aureus 1.20 1.20 1.20 Adak et al. (2002; 2005)
Viruses
Norovirus 2.82 9.88 12.28 Friesema et al. (2012)
Rotavirus 2.82 9.88 12.28 Friesema et al. (2012)
Protozoa
Cryptosporidium spp. 2.82 9.88 12.28 Friesema et al. (2012)
Giardia spp. 2.82 9.88 12.28 Friesema et al. (2012)
4.2.1.2 Direct non-healthcare costs
Over-the counter medication (OCM) such as anti-diarrheal drugs, ORS and painkillers are often used by patients with GE, independent of hospitalization, consulting with a GP or requiring no medical service. OCM costs are paid by the patients and therefore considered as category DNHC. We assumed, based on the SENSOR study (De Wit et al., 2001b; Van den Brandhof et al., 2004), that of mild GE cases (i.e. patients not requiring medical services) 31% would use anti-diarrheal drugs, 5% would use ORS and 5% would use painkillers. For moderate cases (i.e. patients requiring only doctor visits) and severe cases (i.e.
hospitalized patients) we assumed the corresponding values would be 59%, 33% and 5% respectively. Using Dutch unit prices(CVZ, 2012a) OCM costs per episode in 2011 were estimated at € 1.36 for children and € 2.54 for adults for mild GE cases, and at € 4.41 for children and € 8.19 for adults for moderate to severe GE cases, see Table 5. We do know small children painkillers are rarely used. On the other hand, ORS and anti-diarrhoea application might be more common for small children than found in the SENSOR study. Therefore, the presented average drug costs are only an approximation of the potential daily drug costs.
Travel costs were only considered when visiting a GP and when being hospitalized (see section 4.1.4.1.1). Based on Friesema et al. (2012) we
years respectively would use either a car or public transport when visiting a GP. In the case of hospitalization 97% of persons younger than 18 years would be transported to the hospital by car or public transport; this applies for 72% of the persons older than 18 years (Friesema et al. 2012). When travelling by car or public transport we assumed, by lack of information, half of the patients would have taken a car and the other half would have used public transport. For the costs calculations we used average distances as reported in Hakkaart - Van Roijen et al. (2010); the unit prices are listed in Table 4.
If babies and small children do have GE, the daily use of diapers is increasing. We estimated, following the assumptions made by Kemmeren et al. (2006) that the costs for additional diapers for children younger than 5 years would be € 3.57, € 7.13 and € 7.61 for mild, moderate and severe GE cases respectively. No information was available on informal care, for example time costs of a neighbour taking care of a sick child. Therefore the costs for informal care were not considered in this study.
We assume fatal cases would incur the same DNHC costs as non-fatal cases until their death.
4.2.1.3 Indirect non-healthcare costs
Information about the duration of work loss (both paid and unpaid) for hospitalized cases and/or their caregivers was based on the GEops study (see Table 7). Whereas for non-hospitalized GE cases, we analysed data collected during the Pienter 2 study (Mollema et al. 2009; Van der Klis et al., 2009). Cases who reported having GE symptoms in the previous month (at least 3 bowel movements in 24 hours and/or at least 3 episodes of vomiting in 24 hours) were asked: if they had visited a GP for their symptoms; if they themselves and/or a caregiver were absent from work, both paid and unpaid work and for how many hours. Results are summarized in Table 7, distinguishing between GE cases visiting a GP or not. It seemed the obtained answers were strongly biased and in particular GE patients with long duration of symptoms had filled in the questionnaire. We therefore opt for the median when estimating costs.
Table 7. Assumed sick leave from paid and unpaid work for mild, moderate and severe GE cases
No GP visita GP visit a Hospitalizedb
Sick leave of patients & caregivers from paid work (in hours/episode)
GE cases: 0 – 4 years 2.50 7.47 26.4 b GE cases: 5 – 14 years 0.63 0.50 26.4 b GE cases: 15 – 64 years 10.04 19.72 26.4 b
GE cases: ≥ 65 years 0 0 0.4
Sick leave of patients & caregivers from unpaid work (in hours/episode) GE cases: 0 – 4 years 0.19 1.73 2.4 b GE cases: 5 – 14 years 0.27 0.27 c 2.4 b GE cases: 15 – 64 years 0.47 0.47 c 1.6 b
GE cases: ≥ 65 years 0 0 0.4
a) The median is reported. Results are based on questions collected during the Pienter 2 study (Mollema et al., 2009; Van der Klis et al., 2009).
b) Averages as reported in the GEops study by Friesema et al. (2012). In the GEops study data were collected for persons younger than 18 years (in the current study we applied these results to the 0-14 years old) and for persons between 18-64 years (in the current study we applied these results to the 15-18-64 years old). c) There were not enough data available to allow an assumption for GE cases
visiting a GP. We therefore assume sick leave from unpaid work for 5-14 years and for 15-64 years would be the same independent of a GP visit.
In concordance with the Dutch guidelines the estimate of work loss in case of death is based on the friction cost methods (see details in section 4.1.3). Productivity losses due to sickness leave from paid work are only estimated for patients in the working life years, which is, in the Netherlands, every person between 15 and 64 years as defined by Statistics Netherlands.
Productivity losses from paid work of patients were valued using a standard tariff, according to the corresponding age-classes (see Table 4). We further assumed a productivity loss of € 27.20 for caregivers of children and of € 31.11 for caregivers of adults who would be absent from paid work in order to take care of a sick child/adult patient. For unpaid work we assumed for all age-classes a productivity loss of € 12.96, for both patients and caregivers. 4.2.1.4 Scenario analysis
There is evidence from Dutch and international studies (Ruzante et al., 2011; Friesema et al., 2012) that in particular elderly GE patients are at risk of being transferred from hospital into a nursing home before returning home. However, information on the duration of stay was scarce. In our baseline we assumed an average stay in a nursing home of 60 days, only this assumption was based on one single case (Friesema et al., 2012). We therefore conducted scenario analyses by multiplying the duration of the nursing stay by 50% (Scenario analysis: GE: shorter stay in nursing home) and 150% (Scenario analysis: GE: longer stay in nursing home) respectively.
4.2.2 Hepatitis A and E virus 4.2.2.1 Direct healthcare costs
No medication costs were considered for HAV and HEV due to the non-availability of data.
Consultation with a GP, who is the gatekeeper to any further medical services in the Netherlands, might occur either by phone, by a GP practice visit or by a
house call from the GP to the patient. For HAV cases we assumed there would be 2.3 and 3.7 GP visits (Beutels et al., 2008; Suijkerbuijk et al., 2012) for non-hospitalized HAV cases and for non-hospitalized HAV cases respectively. The same assumptions were made for HEV cases.
Based on Suijkerbuijk et al. (2012) we assumed laboratory testing occurs for 21.6% of the patients consulting a GP and not being hospitalized, whereas we assumed 100% of all hospitalized HAV cases (Suijkerbuijk et al., 2012) were tested. The same assumptions were made for HEV cases. The cost for laboratory-confirmation was assumed to be € 35.34 per case tested (Suijkerbuijk et al., 2012), see Table 8.
The hospitalization duration of HAV patients is age-dependent. Based on Dutch hospitalization data the average duration for HAV patients was assumed to be 4.55 days, 5.27 days and 11.83 days for patients <18 years, patients from 18-64 years and patients ≥ 65 years respectively (Suijkerbuijk et al., 2012).
Turner et al. (2010) report a median duration of 9 days for HEV patients. Borgen et al. (2008), a Dutch study, reported a median duration of 8 days. This is longer than what is observed for HAV. We therefore based our assumptions on Borgen et al. (2008) and in the absence of a mean assumed hospitalized HEV cases are admitted for 8 days.
In the case of being hospitalized for hepatitis an abdominal echo is standard procedure (Suijkerbuijk et al., 2012).
There was no information available on the use of ambulance transport to the hospital when admitted with HAV or HEV. By omitting these costs we have underestimated these costs, but only slightly as most patients are children or young adults, a population, at least for GE, known to rarely use ambulance transportation when admitted to hospital (Friesema et al., 2012).
We assumed fatal cases would incur the same DHC costs as non-fatal cases. Table 8. Hepatitis-specific DHC costs in 2011
Unit cost (€) Source Laboratory-confirmation (per case
tested)
35.34 Suijkerbuijk et al. (2012) Echo abdominal (per case) 89.34 Suijkerbuijk et al. (2012) 4.2.2.2 Direct non-healthcare costs
Travel costs to the GP and to the hospital were the only DNHC considered, applying the assumptions described in section 4.1.4.1.1.
We assume fatal cases would incur the same DNHC costs as non-fatal severe cases until their death.
4.2.2.3 Indirect non-healthcare costs
The duration of sickness leave of patients for absence from paid work was based on the duration of illness, assuming a patient would be absent for 23,5 hours per week of illness (see section 4.1.4.1.2). The duration of sickness leave for
caregivers of children from 0 to 4 years was based on the duration of illness, assuming caregivers would be absent for 16.4 hours per week of illness (see section 4.1.4.1.2). For children between 5 and 14 years with mild to moderate HAV/HEV symptoms we assumed the average sickness leaves of their caregivers
would be equal to 50% of the sickness leave of caregivers of children 0 to 4 years with similar symptoms.
The duration of illness for HAV was assumed to be 14 days for mild (i.e. no GP visit), 14 days for moderate (i.e. GP visit only) and 30 days for severe (i.e. hospitalized) HAV cases (Haagsma et al., 2009). The duration of illness for HEV was assumed to be respectively 14 days, 25.5 days and 42.8 days for mild, moderate and severe HEV cases (Borgen et al., 2008; Haagsma et al., 2009). In concordance with the Dutch guidelines the estimate of work loss in case of death is based on the friction cost methods.
For patients 65 years and older we assumed, similar to GE, that only in case of hospitalization a caregiver would be absent from paid work for a total of 0.4 hours per episode (Friesema et al., 2012).
Productivity losses from paid work of patients were valued using standard tariffs, according to the corresponding age-classes (see Table 4). Productivity losses from paid work for caregivers were valued, assuming a productivity loss of € 27.20 for caregivers of sick children and of € 31.11 for caregivers of sick adults.
4.2.3 Inflammatory bowel disease (IBD) 4.2.3.1 Direct healthcare costs
IBD patients are either in remission, inflammation or require an operation, depending on which phase of the disease they are experiencing. IBD is not fatal but cannot be cured. Consequently, IBD costs occur throughout the whole life starting at disease onset and persisting until death.
In the current study we use average annual costs of IBD patients as a proxy for estimating life-long IBD costs. Annual IBD costs were based on a newly available Dutch study by Van der Valk et al. (2012), assuming 70% of Campylobacter- and Salmonella-associated IBD cases would be ulcerative colitis (UC) cases and the remaining 30% would be Crohn’s Disease (CD) cases (Mangen et al. (2004; 2005). Van der Valk et al. (2012) collected information on DHC, DNHC and INHC from 1,315 Crohn’s disease (CD) patients and from 937 ulcerative colitis (UC) patients from seven university hospitals and seven general hospitals for the year 2011 using a web-based questionnaire. They reported no significant difference in costs of patients from university hospitals and of patients from general hospitals (Van der Valk et al., 2012). As cost items were derived from a three-month follow-up questionnaire we multiplied the costs by four to get an annual cost estimate. Costs are summarized in Table 9.
Further we assumed that in the first year additional diagnostics would be
required for getting the diagnosis of IBD, in total € 854.03 (Mangen et al., 2004; 2005) resulting in first year diagnostic costs of € 986.33.
Table 9. IBD-specific DHC costs in 2011 CD €/case/year UC €/case/ye ar IBD €/case/ye ar Annual diagnostic costs (Van der Valk et
al., 2012)
162.40 119.40 132.30 Additional diagnostic costs in 1st year to
get diagnosis (Mangen et al., 2004; 2005)
854.03 854.03 854.03
Medication costs (Van der Valk et al., 2012)
4,581.32 2,379.56 3,040.09 Gastroenterologist and other medical
specialist consultations, including GP visits (Van der Valk et al., 2012)
456.48 273.52 328.41
Costs for hospitalization incl. surgery (Van der Valk et al., 2012)
1,300.60 587.20 801.22
4.2.3.2 Direct non-healthcare costs
Travel costs and other out-of-pocket costs were, according to Van der Valk et al.(2012), € 300/year for CD cases and € 228/year for UC patients or € 249.60 for an average IBD case per year.
4.2.3.3 Indirect non-healthcare costs
Based on the information provided by Van der Valk et al. (2012) we estimated IBD patients between 15 - 64 years would be on average 34.09 hours per year absent from paid work. Caregivers of IBD patients would be absent for
2.042 hours per year from paid work. Further we assumed IBD patients
themselves or their caregivers would be absent from unpaid work for on average of 0.885 hours per year (Van der Valk et al., 2012 ).
Productivity losses from paid work of patients were valued using a standard tariff according to the corresponding age-classes (see Table 4). Further we assumed a productivity loss of € 27.20 for caregivers of children and of € 31.11 for caregivers of adults, who would be absent from paid work in order to take care of an IBD patient. For unpaid work we assumed for all age-classes a productivity loss of € 12.96, for both patients and caregivers.
4.2.4 Irritable bowel syndrome (IBS)
IBS stands for a group of functional bowel disorders. Abdominal discomfort or pain associated with a change of bowel habits and features of disordered defecation characterize this health outcome. Besides these symptoms IBS patients suffer, more than healthy individuals, from symptoms like nausea, headache, backache, anxiety, sleep disturbances and tiredness (Donker et al., 1999). However, the aetiology of IBS is still largely unclear and pathogenic mechanisms are only partly understood.
4.2.4.1 Direct healthcare costs
About 20% to 75% of IBS patients, depending on the studies and the countries concerned, seek professional care (Le Pen et al., 2004).
For example, Le Pen et al.(2004) reported 61% of IBS patients identified via a survey conducted in the French general population in 2000, had used at least one type of medicine for their disorder during the previous 4 weeks. This was