National Institute for Public Health and the Environment
P.O. Box 1 | 3720 BA Bilthoven www.rivm.com
Environmental risk limits for
octamethylcyclotetrasiloxane in water
A proposal for water quality standards in accordance with the Water Framework DirectiveRIVM Letter report 601714020/2012
C.E. Smit | C.J.A.M. Posthuma-Doodeman | E.M.J. Verbruggen
Colophon
© RIVM 2012
Parts of this publication may be reproduced, provided acknowledgement is given to the 'National Institute for Public Health and the Environment', along with the title and year of publication.
Els Smit
Connie Posthuma-Doodeman
Eric Verbruggen
Contact:
Els Smit
Expertise Centre for Substances
els.smit@rivm.nl
This investigation has been performed by order and for the account of Ministry of Infrastructure and Environment, within the framework of project "Chemical aspects of WFD"
Abstract
Environmental Risk Limits for octamethylcyclotetrasiloxane
A proposal for water quality standards in accordance with the Water Framework Directive
RIVM has derived environmental risk limits for octamethylcyclotetrasiloxane (D4) in water. D4 is used as an intermediate in the chemical industry, in cosmetics, skin- and hair-care products, and cleaning products. The compound is listed in Dutch legislation on monitoring and quality objectives in the context of the Water Framework Directive (WFD). The current water quality standard for D4 has to be updated according to the WFD-methodology. The ERLs derived in this report are advisory values that serve as a scientific background for the Dutch Steering Committee for Substances, which is responsible for setting those standards.
Food chain accumulation
Long-term exposure to D4 affects growth and reproduction of water organisms. The compound also accumulates from water into fish and predators. The proposed standard for long-term exposure (0.19 microgram per liter) therefore also considers exposure of humans and/or predatory birds and mammals via consumption of fish.
Improved analytics needed
It is hard to accurately measure concentrations of D4 in water. The compound strongly binds to organic matter, and is volatile as well. The use of D4 in personal care products poses a risk for accidental contamination of samples by the staff during collection and handling of samples. In addition, siloxane-like materials are sometimes applied in analytical equipment, thereby interfering with the analysis. Improved analytical methods are needed for compliance check.
Keywords:
Water Framework Directive; octamethylcyclotetrasiloxane; OMCTS; D4; water quality standards
Rapport in het kort
Milieurisicogrenzen voor octamethylcyclotetrasiloxaan
Een voorstel voor waterkwaliteitsnormen volgens de Kaderrichtlijn Water Het RIVM heeft in opdracht van het ministerie van Infrastructuur en Milieu (I&M), milieurisicogrenzen in water bepaald voor octamethylcyclotetrasiloxaan (meestal aangeduid als D4). Deze stof wordt gebruikt in de chemische industrie, in cosmetica, huid- en haarverzorgingsproducten en in schoonmaakmiddelen. De stof is opgenomen in de Regeling Monitoring Kaderrichtlijn water, waarin staat aan welke eisen oppervlaktewater in Nederland moet voldoen. De huidige norm voor D4 is niet afgeleid volgens de meest recente methodiek, daarom moeten nieuwe waterkwaliteitsnormen worden vastgesteld. De Stuurgroep Stoffen stelt deze nieuwe normen vast op basis van de wetenschappelijke advieswaarden in dit rapport.
Stapeling in de voedselketen onderzocht
D4 heeft bij langdurige blootstelling effecten op de groei en voortplanting van waterorganismen. Vanuit het water komt de stof ook terecht in vissen en dieren die ‘hoger’ in de voedselketen zitten. Daarom houdt de voorgestelde norm voor langdurige blootstelling (0,19 microgram per liter) rekening met de mate waarin mensen en/of vogels en zoogdieren aan de stof worden blootgesteld via het eten van vis.
Analyseprobleem
Het is lastig om D4 nauwkeurig te meten in water. De stof bindt sterk aan organische stof in het water en verdampt tegelijkertijd snel uit water. Omdat D4 in zoveel producten voor persoonlijke verzorging zit, is er bovendien een risico dat de degenen die met de monsters werken per ongeluk het monster in aanraking brengen met de stof. Daarnaast kunnen de resultaten worden beïnvloed, omdat onderdelen van de meetapparatuur soms soortgelijke stoffen bevatten. Om de voorgestelde norm te kunnen aantonen, zou de
analysetechniek daarom moeten worden verbeterd. Trefwoorden:
Kaderrichtlijn water; octamethylcyclotetrasiloxaan; OMCTS; D4; waterkwaliteitsnormen
Contents
Summary—9
1 Introduction—11
1.1 Project framework—11
1.2 Current standards for D4—12
1.3 Methodology—12
1.4 Status of the results—14
2 Substance properties, fate and bioaccumulation—15
2.1 Identity and use—15
2.2 Physico-chemical properties—15
2.3 Behaviour in the environment—16
2.4 Environmental distribution—16
2.5 Bioconcentration and biomagnification—17
3 Human toxicology, ecotoxicity and derivation of ERLs for water—25
3.1 Human toxicology—25
3.2 Ecotoxicity data—25
3.3 Treatment of freshwater and saltwater toxicity data—26 3.4 Derivation of the MPCfw and MPCsw—26
3.5 MPCdw, hh – surface water for abstraction of drinking water—28
3.6 Derivation of the MACfw, eco and MACsw, eco—28
3.7 Derivation of the NCfw and NCsw—28
3.8 Derivation of the SRCfw, eco and SRCsw, eco—28
4 Discussion and conclusions—29
List of abbreviations—35
Appendix 1. Bioconcentration and biomagnification—37 Appendix 2. Human toxicology—41
Summary
In this report, RIVM presents environmental risk limits (ERL) for
octamethylcyclotetrasiloxane (D4) in water. D4 is used as an intermediate in the production of silicone polymers and synthetic amorphous silica, but is also widely used in personal care products (e.g. cosmetic products and skin- and hair-care products), and in household products (e.g. cleaning products). The compound has received worldwide attention because of its suspected persistence and potential to bioaccumulate. The current water quality standard for chronic exposure is 0.5 µg/L. This value dates back to before 2004 and does not take into account the potential risks of secondary poisoning and exposure of humans via consumption of fish. A maximum acceptable level for peak exposure, which is also required according to the WFD, is not available.
Using data from international risk assessment reports, hazard evaluations, and additional information obtained from research reports and the open literature, ERLs for D4 in water have been derived that can be used to set updated water quality standards. The methods used are in accordance with the methodology of WFD and INS (International and National environmental quality standards for Substances in the Netherlands).
Five types of ERL are considered, each representing a different protection aim. The Maximum Permissible Concentration (MPC). The MPC represents the
concentration that protects man and environment from adverse effects due to chronic exposure. The MPC covers three routes: direct exposure of aquatic organisms, secondary poisoning of predatory birds and mammals, and exposure of humans via fish consumption.
The Maximum Acceptable Concentration for ecosystems (MACeco). The
MACeco is the concentration that protects aquatic ecosystems from
adverse effects of short-term concentration peaks.
The Negligible Concentration (NC). The NC is calculated by applying an additional factor of 100 to the MPC and represents the concentration at which protection of ecosystems is fully safeguarded. In the Dutch policy on substances, the NC is used to define a safety margin that takes combination toxicity into account.
The Serious Risk Concentration for ecosystems (SRCeco). This is the
concentration at which serious ecotoxicological risks might occur in aquatic ecosystems.
The Maximum Permissible Concentration in water for drinking water abstraction (MPCdw, hh). The MPCdw, hh represents the concentration at
which surface water can be used for production of drinking water without further treatment.
Where applicable, ERLs are derived for freshwater and saltwater. An overview of the newly derived ERLs is presented in Table 1. The MPC and MACeco are
equivalent to the long-term and short-term water quality standards that are indicated as QSeco and MAC-QS in the WFD-guidance. Not enough data were
available to derive the MACeco for peak exposure. This ERL is probably not
relevant for D4, since direct ecotoxicity to water organisms due to short-term concentrations peaks is most likely low. Monitoring data are not available.
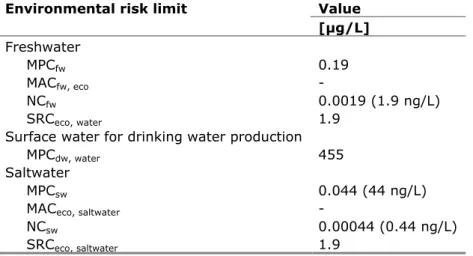
Table 1. Environmental risk limits for octamethylcyclotetrasiloxane in water
Environmental risk limit Value
[μg/L] Freshwater MPCfw 0.19 MACfw, eco - NCfw 0.0019 (1.9 ng/L) SRCeco, water 1.9
Surface water for drinking water production
MPCdw, water 455
Saltwater
MPCsw 0.044 (44 ng/L)
MACeco, saltwater -
NCsw 0.00044 (0.44 ng/L)
1
Introduction
1.1 Project framework
In this report, environmental risk limits (ERLs) for surfacewater are derived for octamethylcyclotetrasiloxane (OMCTS), commonly referred to as D4. D4 is considered as a specific pollutant for the Netherlands under the Water Framework Directive (WFD). The compound is listed in the Dutch decree on WFD-monitoring (Regeling monitoring Kaderrichtlijn water [1]). The aim of this report is to present updated risk limits that can be used to set water quality standards in accordance with the WFD. The derivation of the ERLs is performed in the context of the project Chemical aspects of the Water Framework Directive, which is closely related to the project INS (International and national
environmental quality standards for substances in the Netherlands). The following ERLs are considered:
- Maximum Permissible Concentration (MPC) – defined in [2,3] as the standard based on scientific data which indicates the concentration in an environmental compartment for which:
1 no effect to be rated as negative is to be expected for ecosystems;
2a no effect to be rated as negative is to be expected for humans (for non-carcinogenic substances);
2b for humans no more than a probability of 10-6 per year of death
can be calculated (for carcinogenic substances). Within the scope of the Water Framework Directive (WFD), a probability of 10-6 on a life-time basis is used.
The MPC for water should not result in risks due to secondary poisoning and/or risks for human health aspects. These aspects are therefore also addressed in the MPC derivation. Separate MPC-values are derived for the freshwater and saltwater environment.
- Negligible Concentration (NC) – the concentration in fresh- and saltwater at which effects to ecosystems are expected to be negligible and functional properties of ecosystems are safeguarded fully. It defines a safety margin which should exclude combination toxicity. The NC is derived by dividing the MPC by a factor of 100.
- Maximum Acceptable Concentration (MACeco) for aquatic ecosystems – the
concentration protecting aquatic ecosystems from effects due to short-term exposure or concentration peaks. The MACeco is derived for
freshwater and saltwater ecosystems.
- Serious Risk Concentration for ecosystems (SRCeco) – the concentration in
water at which possibly serious ecotoxicological effects are to be expected. The SRCeco is valid for the freshwater and saltwater compartment.
- Maximum Permissible Concentration for surface water that is used for drinking water abstraction (MPCdw, hh). This is the concentration in surface
water that meets the requirements for use of surface water for drinking water production. The MPCdw, hh specifically refers to locations that are
The quality standards in the context of the WFD refer to the absence of any impact on community structure of aquatic ecosystems. Hence, not the potential to recover after transient exposure, but long-term undisturbed function is the protection objective under the WFD. Recovery in a test situation, after a limited exposure time, is therefore not included in the derivation of the MPC and MAC.
1.2 Current standards for D4
The current MPCwater is 0.5 µg/L [4]. It dates back to 1999 when the
WFD-methodology was not yet adopted, and does not take into account the potential risks of secondary poisoning and exposure of humans via consumption of fish.
1.3 Methodology
The methodology for risk limit derivation in the Netherlands is described in detail in the guidance document [5], which is further referred to as the INS-Guidance. The INS-guidance is based on the Technical Guidance Document (TGD), issued by the European Commission and developed in support of the risk assessment of new notified chemical substances, existing substances and biocides [6] and on the former manual for the derivation of water quality standards under the WFD [7]. The European technical guidance for the derivation of environmental quality standards in the context of the WFD has been revised recently [8]. Therefore, the terminology is harmonised as much as possible and the new guidance is followed in the case it deviates from the INS-guidance. This applies to the MPC for surface waters intended for the abstraction of drinking water (MPCdw, hh, see section 3.5). In the INS-guidance, this is one of
the MPCs from which the lowest value should be selected as the general MPCwater
(see section 3.1.6 and 3.1.7 of the INS-Guidance). According to the new
guidance, the MPCdw, hh is not taken into account for the derivation of the general
MPCwater, but specifically refers to locations that are used for drinking water
abstraction. Another difference is that according to the new WFD-guidance, derived ERLs refer to dissolved concentrations in water, instead of total.
1.3.1 Data sources
Risk assessment reports have been published by the UK Environment Agency [9] and Environment Canada/Health Canada [10]. These risk assessment reports were used as the primary source of information with respect to ecotoxicological data on D4, and also contain the studies that were included in the previous Dutch ERL-derivation of 1999 [4]. The reliability scores assigned in the UK risk assessment report were taken over, in case of doubt the original reference was checked where possible. The dossier on D4 submitted under REACH was consulted via the ECHA website with respect to the ecotoxicological data (www.echa.europe.eu; see also section 3.4.1). In addition, an on-line literature search was performed via SCOPUS, available via http://www.scopus.com/. The search profile is given in Appendix 1.
D4 was discussed by the former EU PBT Working Group on a number of occasions. As a result of these discussions the substance was included in Regulation (EC) No. 465/2008 of 28th May 2008, which required industry to
conduct an environmental monitoring programme and submit the results by November 2009. Information from the draft factsheet for the evaluation of D4 was included in the present report [11]. The results were submitted to ECHA in November 2010 which concluded that the criteria were met, but the dossier has not been published yet (pers. comm. Daniel Merckel, UK Environment Agency). An Expert Panel Workshop, sponsored by the Global Silicones Council, was held on October 6, 2009 in Toronto, Canada, to advance the scientific understanding of the behaviour of cyclic volatile methylsiloxane (cVMS) materials in the
environment [12]. In June 2010, a workshop for European Union member states was organised by the European Silicones Centre [13]. Specific issues addressed at these workshops were related to persistence, bioaccumulation, environmental toxicity, and the potential for significant adverse effects that may result through release of cVMS materials. The workshops had international participation and included experts from academia, government, and industry. The material presented at these workshops was consulted for the present assessment. The Scientific Committee on Consumer Products and the Scientific Committee on Consumer Safety both advised the European Commission with an opinion on D4 [14,15]. These opinions were included in the human toxicological assessment (see 2.6 and Appendix 3).
1.3.2 Data evaluation
The studies that are used for ERL derivation are summarised in data-tables in the Appendices to this report. These tables contain information on species characteristics, test conditions and endpoints. The reliability of the ecotoxicity studies is designated using the following reliability indices based on [16]:
Ri 1: Reliable without restriction
’Studies or data … generated according to generally valid and/or internationally accepted testing guidelines (preferably performed according to GLP) or in which the test parameters documented are based on a specific (national) testing guideline … or in which all parameters described are closely related/comparable to a guideline method.’
Ri 2: Reliable with restrictions
’Studies or data … (mostly not performed according to GLP), in which the test parameters documented do not totally comply with the specific testing guideline, but are sufficient to accept the data or in which investigations are described which cannot be subsumed under a testing guideline, but which are nevertheless well documented and scientifically acceptable.’
Ri 3: Not reliable
’Studies or data … in which there are interferences between the measuring system and the test substance or in which organisms/test systems were used which are not relevant in relation to the exposure (e.g., unphysiologic pathways of application) or which were carried out or generated according to a method which is not acceptable, the documentation of which is not sufficient for an assessment and which is not convincing for an expert judgment.’
Ri 4: Not assignable
’Studies or data … which do not give sufficient experimental details and which are only listed in short abstracts or secondary literature (books, reviews, etc.).’
Citations
In case of (self-)citations, the original (or first cited) value is considered for further assessment, and an asterisk is added to the Ri of the endpoint that is cited.
1.4 Status of the results
The results presented in this report have been discussed by the members of the scientific advisory group for the INS-project (WK-INS). It should be noted that the ERLs in this report are scientifically derived values, based on
(eco)toxicological, fate and physico-chemical data. They serve as advisory values for the Dutch Steering Committee for Substances, which is appointed to set the Environmental Quality Standards (EQSs). ERLs should thus be
considered as advisory values that do not have an official status until approved by the responsible authorities.
2
Substance properties, fate and bioaccumulation
2.1 Identity and use
Information on the identity of D4 is presented in Table 2. The main use of D4 is as an intermediate in the production of other chemicals (silicone polymers and synthetic amorphous silica), in personal care products (e.g. cosmetic products and skin- and hair-care products), and in household products (e.g. cleaning products).
Table 2 Substance identification
Name octamethylcyclotetrasiloxane
Chemical name
octamethylcyclotetrasiloxane
Other names D4, OMCTS, cyclic dimethylsiloxane tetramer, cyclotetrasiloxane, octamethyl- CAS number 556-67-2 EC number 209-136-7 Molecular formula C8H24O4Si4
Molar mass 296.62 g/mol
Structural formula
SMILES code C[Si]1(C)O[Si](C)(C)O[Si](C)(C)O[Si](C)(C)O1
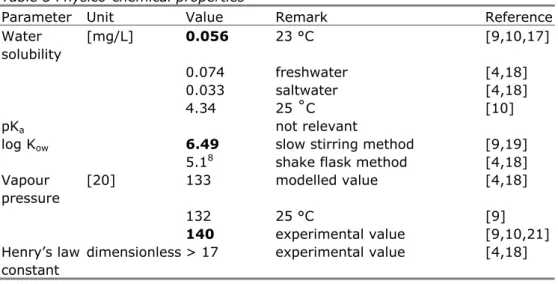
2.2 Physico-chemical properties
Phyisico-chemical characteristics are given in Table 3. The bold values are used for further calculations, in line with the UK risk assessment [9].
Table 3 Physico-chemical properties
Parameter Unit Value Remark Reference
Water solubility [mg/L] 0.056 23 °C [9,10,17] 0.074 freshwater [4,18] 0.033 saltwater [4,18] 4.34 25 ˚C [10] pKa not relevant
log Kow 6.49 slow stirring method [9,19]
5.18 shake flask method [4,18]
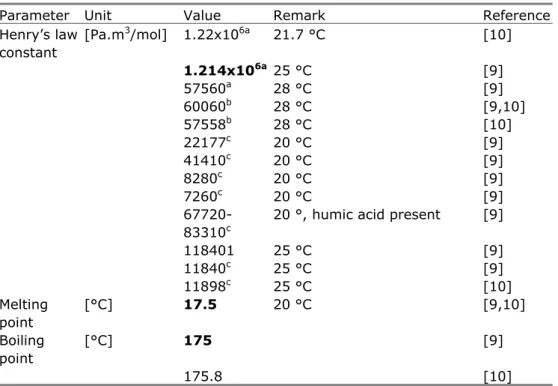
Vapour pressure [20] 133 modelled value [4,18] 132 25 °C [9] 140 experimental value [9,10,21] Henry’s law constant
Parameter Unit Value Remark Reference Henry’s law constant [Pa.m3/mol] 1.22x10⁶a 21.7 °C [10] 1.214x10⁶a 25 °C [9] 57560a 28 °C [9] 60060b 28 °C [9,10] 57558b 28 °C [10] 22177c 20 °C [9] 41410c 20 °C [9] 8280c 20 °C [9] 7260c 20 °C [9]
67720-83310c 20 °, humic acid present [9]
118401 25 °C [9] 11840c 25 °C [9] 11898c 25 °C [10] Melting point [°C] 17.5 20 °C [9,10] Boiling point [°C] 175 [9] 175.8 [10]
a: calculated from dimensionless air/water partitioning coefficient, data from [22,23]
b: idem, data from [24] c: idem, data from [25]
2.3 Behaviour in the environment
Selected environmental properties of D4 are given in Table 4.
Table 4 Selected environmental properties of octamethylcyclotetrasiloxane
Parameter Name/Unit Value Remark Reference
log Koc log [L/kg] 4.2 [9,10] Hydrolysis half-life DT50 [d] 16.7 d pH 7, 12 °C [9] 2.9 d pH 8, 9 °C, marine [9] 2.9-6 d pH 7, 25 °C [26] 0.04 – 45 d pH 6 – 9, 5-25 °C [10,27-29] Photolysis half-life DT50 [d] - Biodegradation in water/sediment systems DT50 [d] 49 – 588 d half-life neutral pH, 5 - 25° C [10] 2.4 Environmental distribution
D4 may be emitted to the environment from industrial processes. These releases are expected to be to the atmosphere and wastewater. Releases of D4 to air and wastewater will also occur during use of personal care products. It is estimated that 92% of D4 used in personal care products enters the atmosphere (Allen et al. 1997, cited in [10]).
Environmental distribution was modeled using the level III fugacity model included in EpiSuiteTM 4.1 [20], using the following input: log Kow of 6.49 and
the Henry’s law constant of 1.22 x 10⁶ Pa.m3/mol (12 atm.m3/mol), vapour
pressure 140 Pa (1.05 mm Hg), water solubility 0.056 mg/L, melting point 17.5 °C and boiling point 175 °C. Calculations were performed assuming that a
total amount of 1000 kg was emitted either 100% to air, water or soil. The results are summarised in Table 5.
Table 5 Calculated distribution according to level III fugacity model in EpiSuite 4.1 [20]
Substance released to Percentage partitioning into
air watera soil sediment
air (1000 kg/h; 100%) 100 0.000324 0.0163 0.000235
water (1000 kg/h; 100%) 8.82 52.8 0.00144 38.3
soil (1000 kg/h; 100%) 89.6 0.00196 10.4 0.00142
a: refers to total water including suspended matter
Similar results were obtained in the Environment Canada/Health Canada screening assessment when using another model. When released to air, 100% remained in air, full emission to water resulted in 13.6% partitioning into air, 72.2% to water and 14.2% to sediment, while after emission to soil 88.5% partitioned into air and 11.5% remained in soil [10].
Using the same input values, calculations with SimpleTreat as implemented in EUSES 2.1.1 [30] show that the majority of the releases to wastewater will be emitted to air (42.6%) and sludge (53.8%) during sewage treatment. However, calculations show that still 3.5% will be emitted to the effluent. About 90% of this will remain bound to suspended matter, 10% is dissolved.
From these calculations, it is apparent that water, air and sediment are the major receiving compartments of D4. The predicted proportion remaining in water after emissions to water is relatively high, 52.8 and 72.2% depending on the model used. This is somewhat unexpected in view of the very high volatility and relatively high sorption capacity. Direct emissions to the water phase are probably only relevant upon recreational use, e.g. personal care products
applied to the skin that are “washed off” during swimming. However, after waste water discharge, D4 will most likely be bound to suspended matter. In the summary dossier of the EU PBT working group [11] it is stated that although a short persistence in water is predicted (owing to rapid hydrolysis and
volatilisation), the models also predict that a significant fraction of D4 will distribute to the sediment phase and the persistence of D4 in the sediment may be much longer than found in the water column, depending on factors such as temperature, pH, sediment burial rate, etc. It can thus be argued that sediment and air are the most important receiving compartment, and that in the water phase D4 will be bound to suspended matter. This may be a reason to consider the derivation of ERLs based on suspended matter and/or sediment. With respect to the latter it should be noted that the log Koc of 4.2 is higher than the trigger for derivation of sediment-based quality standards according to the WFD-guidance. However, suspended matter and sediment are not monitored on a regular basis in the Netherlands and there is no direct policy need for deriving those standards.
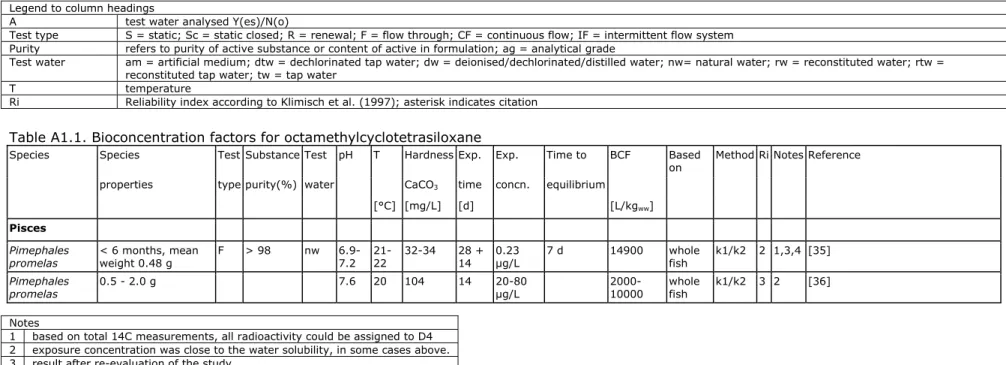
2.5 Bioconcentration and biomagnification
In the Canadian risk assessment [10] it is concluded that D4 may have a high potential to accumulate in aquatic organisms, since the empirical
bioconcentration factor (BCF), and the modelled bioaccumulation factor (BAF) are above 5000. BCF-values for fish are 12400 and 13400 L/kg, and the modelled BAF is 467735 L/kg. However, it is stated that data from a biomagnification study in fish and a biota-sediment accumulation study in
invertebrates suggest that the bioaccumulation potential of D4 may be lower, possibly due to reduced bioavailability. Considering that there is conflicting evidence, it is stated that while D4 has the potential to accumulate in biota, it is not possible to conclude that D4 meets the criterion for bioaccumulation as set out in the Canadian regulations [10]. In the risk assessment performed by the UK Environment Agency [9], a BCF for fish of 12400 L/kg is used, in
combination with a BMF of 4.6 derived from a feeding study with fish [31]. This BMF is used as BMF1 for predatory fish, and also included as BMF2 for
top-predators in the marine aquatic food chain. The UK risk assessment thus deviates from the Canadian with respect to the assessment of the
bioaccumulation potential. Recently, trophic magnification studies have become available [32-34] which contain valuable information on the potential food chain transfer of D4 in fresh- and saltwater environments.
For the present assessment, the available studies on bioconcentration and biomagnification of D4 have been evaluated. This section presents the main findings, detailed information is presented in Appendix 2.
2.5.1 Bioconcentration studies
The most reliable study was performed with fathead minnows (Pimephales
promelas) in a totally enclosed flow-through system without headspace [35]. A
preliminary study with an uptake phase of 6 days and a depuration phase of 14 days, and a definitive study with 28 days uptake and 14 days depuration were performed. The calculations of the authors were based on the residues in fish from day 7 to day 28 of the uptake phase in the definitive study. However, the concentration in fish still increases and is 31% higher at day 28 than at day 7. Further, the average water concentration of 0.23 µg/L during this time period could not be reproduced from the reported data. The data from this study were reanalysed with a kinetic model, using all data from the preliminary and
definitive experiment and accounting for the variable water concentrations in the uptake phase. This results in an uptake rate constant of 1166 L/kg.d and a depuration rate constant of 0.0613/d, resulting in a BCF of 19000 L/kg. Normalised to a fish containing 5% lipids, the best BCF that could be deduced from this study is 14900 L/kg.
A second bioconcentration study which was also performed with fathead
minnows [36] was not considered reliable. Reported concentrations were higher than the aqueous solubility, and toxicity cannot be ruled out at these high concentrations. From the tabulated concentrations in water and fish, a steady-state BCF in the range of 2000 to 10000 L/kg would be derived. However, the data presented in the figures do not follow a first-order kinetic model very well, especially not the data from the depuration phase.
In a dietary feeding study, rainbow trout (Oncorhynchus mykiss) were fed trout chow spiked with D4 at 3% of their body weight per day [9]. The uptake phase lasted 35 days, the depuration phase 42 days. In this study, the trout showed an extremely fast growth, and the lipid content also increased during the study. This severely complicated the interpretation of the test results. Kinetic behaviour would be expected that is deviating from simple first-order kinetics. However, such a deviation from first-order kinetics is not observed in the test. If the data from a dietary bioaccumulation study are evaluated in a way as mentioned in the REACH-guidance [37], only the data from the depuration phase should be taken into account. The depuration rate constant is calculated from the data and the uptake rate is calculated from the weight of the fish. The weight of the fish and the lipid content midway the depuration phase can be estimated from the
presented data using exponential growth rates and exponential association of the lipid content. Using the resulting weight and the lipid content, kinetic
modelling results in a BCF of 21600 L/kg, which is normalized to 5% lipids equal to 14400 L/kg. This value is similar to the value derived above for fathead minnows. If the same kinetics would be applied to calculate the BMF, the calculated BMF is 0.93. The lipid normalized BMF would then be 1.8.
2.5.2 Biomagnification studies
2.5.2.1 Lake Pepin
In the benthic food web of the Lake Pepin, Minnesota, USA, cyclic volatile methylsiloxane (cVMS) and fish were sampled in September 2007 and invertebrates and sediment were sampled in May 2008 [34]. Lake Pepin is a flood-plain lake downstream of the highly densely inhabited area of Minneapolis and St Paul. Emissions of cVMS to this system are likely the results of emission from effluents of sewage treatment plants (STPs). Sediment, midge larvae (Chironomus sp.), burrowing mayfly (Hexagenia sp.), river carpsucker (Carpiodes cyrinus), white sucker (Catostomus commersoni), silver redhorse (Moxostoma anisurum), shorthead redhorse (Moxostoma macrolepidotum), bluegill sunfish (Lepomis macrochirus), smallmouth bass (Micropterus
dolomieu), largemouth bass (Micropterus salmoides), black crappie (Pomoxis nigromaculatus), gizzard shad (young of the year and adult) (Dorosoma cepedianum), common carp (Cyprinus carpio), emerald shiner (Notropis atherinoides), white bass (Morone chrysops), walleye (Stizostedion vitreum),
and freshwater drum (Aplodinotus grunniens) were sampled. Stable carbon isotopes ratios (δ13C) were correlated with stable nitrogen isotopes ratios (δ15N)
indicating a single source of carbon at the bottom of the food chain, with no specific separate food chain. Trophic level was determined from stable nitrogen isotopes ratios (δ15N), and ranged from 2.0 to 3.8. The Trophic Magnification
Factor (TMF) was 0.31 if all species were included as individual data points. If species were first aggregated in trophic guilds (detritivores, planktivores, omnivores, invertivores, carnivores, and piscivores) the TMF was only 0.24. In the ecosystem of Lake Pepin, the transfer of cVMS from aquatic species (invertebrates and fish) to mink was examined [38]. One female and three male minks were captured in the area of the lake. From the examination of the stomach content it appeared that the mink fed on terrestrial species as well. However, the lipid normalized concentration of cVMS in the minks was below the limit of detection and was much lower than the concentration in aquatic species. It was therefore concluded that cVMS do not accumulate in the mink. For air-breathing organisms like mammals and birds this can be explained from the relatively low octanol-air partition coefficient.
2.5.2.2 Oslofjord
In the benthipelagic food web of the Inner and Outer Oslofjord, Norway, samples were taken in October-November 2008 [32]. The Oslofjord is situated in a densely populated area. Emissions of cVMS to this system are likely the results of emission from effluents of STPs. Sediment, blue mussels (Mytilus edulis), worms, jellyfish, net plankton, two other mussel species, Atlantic herring (Clupea harengus), northern shrimp (Pandalus borealis), European plaice (Pleuronectes platessa), coalfish (Pollachius virens), Norway pout (Trisopterus
esmarkii), European hake (Merluccius merluccius), haddock (Melanogrammus aeglefinus), European whiting (Melangius merlangus), long rough dab
(Hippoglossoides platessoides), Vahl’s eelpout (Lycodes vahlii), North Atlantic pollock (Pollachius pollachius), poor cod (Trisopterus minutus), and Atlantic cod
(Gadus morhua) were sampled in the inner Oslofjord area. Blue mussels,
Atlantic herring, European hake, European whiting, Vahl’s eelpout, North Atlantic pollock, and poor cod were not caught in the outer Oslofjord area, but in
addition sea urchin (Brissopsis lyrifera), common sole (Solea vulgaris), and starry skate (Amblyraja radiata) were sampled in this area. The authors of the study only analysed the data for the benthic food chain. Furthermore, the choices made by the authors with respect to the division of the species in a pelagic and benthic food chain does not strictly follow the stable carbon isotope ratio ranking (for details see Appendix 2). The data on stable carbon isotopes ratios (δ13C) were re-analysed, and species were ranked on the basis of average
stable carbon isotope ratios of both inner and outer Oslofjord. Species having a δ13C lower than that of long rough dab were assigned to the pelagic food chain.
Being a flat fish, this species might be better assigned to the benthic based food web. The δ13C value of the long rough dab is just below that of Arctic cod, which
forms the top of the food chain. With this reassignment of the species to the benthic and pelagic based food webs, the benthic based food chain for the inner Oslofjord contains nine (groups of) species (worms, two mussel species other than blue mussels, Northern shrimp, European plaice, poor cod, Vahl’s eelpout, long rough dab, and Arctic cod), while the pelagic based food web contains 10 (groups of) species (blue mussel, zooplankton (netplankton and jellyfish), Atlantic herring, coalfish, Norway pout, European hake, North Atlantic pollock, European whiting and haddock). The TMFs that can be calculated for the benthic based food chain, the pelagic based food chain, and the whole ecosystem are 0.60, 3.27, and 1.66, respectively. None of the slopes is significantly different from zero, but the slope for the pelagic based food web is close to significant (P=0.07; 95% CI: -0.1371 to 2.504), leaving the 90% confidence interval of the TMF to vary from 0.87 to 12.2.
The benthic based food chain for the outer Oslofjord contains 10 (groups of) species (sea urchin, worms, two mussel species other than blue mussels, Northern shrimp, European plaice, common sole, starry skate, long rough dab, and Arctic cod), while the pelagic based food web contains five (groups of) species: zooplankton (netplankton and jellyfish), coalfish, Norway pout, and haddock. The TMFs that can be calculated for the benthic based food chain, the pelagic based food chain, and the whole ecosystem are rather similar as for the inner Oslofjord and are 0.83, 2.21, and 1.37, respectively. However, none of the slopes is significant.
2.5.2.3 Lake Opeongo
In October 2007, cVMS (D4, D5, D6) were monitored in the pelagic food web of the oligotrophic Lake Opeongo, Ontario, Canada [33]. Lake Opeongo is an oligotrophic lake in a remote area. It was selected because it was believed to receive cVMS only by atmospheric deposition due to the absence of effluent of sewage treatment plants. Sediment, zooplankton, yellow perch (Perca
flavescens), cisco (Coreogonus artedi), and lake trout (Salvelinus namycush)
were sampled. Trophic levels of the fish were based on stable isotopes and were 3.0 for cisco (assigned value in absence of data for lower trophic level), 3.1 for yellow perch and 3.7 for lake trout. The method detection level1 of D4 ranged from 0.47 µg/kgww for yellow perch to 0.90 µg/kgww for sediment, and analysis
was especially hampered due to background concentrations in blank samples. For both zooplankton and sediment, measured concentrations were below the
1 Defined by the authors as “the minimum level of target analyte in a specified matrix that can be measured
limit of detection (LOD2) and the method detection level (0.89 and 0.90 µg/kg
ww
for zooplankton and sediment, respectively), and were calculated from the LOD and sample mass. Indicative concentrations in zooplankton were reported as 0.43±0.04 µg/kgww, corresponding to 10.9±1.1 µg/kglw on lipid weight basis.
Concentrations in sediment were 0.37±0.05 µg/kgww.
For fish, concentrations were quantifiable and were 1.24±0.07 µg/kgww for cisco,
0.87±0.06 µg/kgww for yellow perch, and 3.77±0.57 µg/kgww for lake trout.
Based on lipid weight, these concentrations are 25.6±1.4 µg/kglw for cisco,
21.0±1.4 µg/kglw for yellow perch, and 48.7±7.4 µg/kglw for lake trout.
The results are heavily criticized in the study because of the analytical issues and the sampling procedure. Nevertheless, the results indicate that the highest levels are found for the predatory lake trout, lower levels for forage fish cisco and yellow perch, and lower and undetectable levels for zooplankton. This suggests that some biomagnification occurs in this pelagic food web. A reliable TMF cannot be estimated from these results. However, a value above 2 seems plausible, based on the results described above. With the concentration for zooplankton fixed at the detection limit, the TMF would be 2.34. If the concentration for zooplankton would be taken as half the detection limit, the TMF increases to 3.63. With only the values for the three species of fish, the TMF would be 2.97, which is just in between the two former values. Corrected for trophic level, the BMF based on lipid weight is 2.5 from cisco to lake trout, and 4.1 from yellow perch to lake trout.
The site was selected because the lake is remote and has no direct input from sewage treatment plants and so on. It is suggested that the fact that cVMS were still detected is due to the fact that the lake is a popular location for canoeing and camping, and the use of personal care products during recreational activities might be a significant source of cVMS. This is put forward as a reason not to use the results as proof for the fact that atmospheric deposition is a source of D4 [33]. However, the source of D4 does not necessarily invalidate the results. Lake Opeongo differs in two aspects from the other two study areas. First, in this lake emission of cVMS is to directly water, either due to atmospheric deposition or due to recreational use. In the other two systems, cVMS enter the environment mostly via the effluents sewage treatment plants, strongly
adsorbed to suspended particles. As such, emission of these substances can be considered to be to sediment. Second, at least for the species for which stable isotopes were analyzed, the carbon isotopes indicate that the species in oligotrophic Lake Opeongo belong to the same pelagic food chain (based on similar stable carbon isotope ratios δ13C). In both the inner and outer Oslofjord
there was a distinction between the benthic and pelagic food chain as indicated by the stable carbon isotopes. Both food chains merged at the top of the food chain. In Lake Pepin there was a strong correlation between trophic level and carbon source, i.e. the lower trophic levels were strongly related with the sediment while the higher trophic levels had a more pelagic food source.
2.5.2.4 Humber estuary
In another publication, the bioacccumulation of cVMS was examined in the Humber estuary [39], where common ragworm and (Hediste diversicolor) and flounder (Pleuronectes flesus) were analysed. The results are presented as so-called multimedia bioaccumulation factors. However, because water
concentrations were estimated by equilibrium partitioning and not measured, the used calculation method is more or less proportional to the calculation of 2 Defined by the authors as “the minimum level of target analyte that can be measured and reported with 99%
Biota to Sediment Accumulation Factors (BSAF). Nevertheless, the results showed that bioaccumulation of D4 in both common ragworm and flounder was high in comparison with PCBs [39].
2.5.3 Selection of the final BCF and BMF
2.5.3.1 BCF
A re-evaluation of the BCF study selected as most reliable yielded a BCF value normalized to 5% lipids of 14900 L/kg. This value is proposed as final BCF value. The BCF value calculated from a dietary study was almost similar (14400 L/kg), but carries quite some uncertainty due to the strong growth of the juvenile rainbow trout used in the test. In the key study with immature fathead minnows with a length of 3.5 cm, this effect is deemed less important than for juvenile rainbow trout.
2.5.3.2 BMF
The biomagnification potential of D4 is complicated. In benthic food chains, D4 does not biomagnify, as shown by the results for Lake Pepin and the Oslofjord. However, this could possibly be the result of a deviation from thermodynamic equilibrium between sediment and water for those systems that receive the substance adhered to suspended particles from a sewage treatment plant. In food chains that originate from the pelagic environment, a different picture is obtained, as shown for the pelagic part of the food chain in the Oslofjord and for Lake Opeongo.
In food chains, in which the benthic and pelagic food chains are not uncoupled, sediment appears to be the major source of cVMS into the food chain. The cVMS have extreme physicochemical behaviour. For these systems where cVMS are emitted adsorbed to suspended particles, water concentrations are probably far from thermodynamic equilibrium due to rapid volatilisation. This may explain the results obtained in Lake Pepin, where a decrease in concentrations was observed from the lower trophic levels for which cVMS are taken up from the sediment to higher trophic levels that have no direct contact with the sediment, but are able to depurate in the relatively clean water phase.
From the pelagic part of the food chains in the inner and outer Oslofjord, biomagnification seems to occur. A re-evaluation of the data leads to
approximate TMF values of 3.27 and 2.21. An assessment of the data for Lake Opeongo leads to an approximate TMF value of 3.0. The average value for the TMF is then 2.8. A significant biomagnification potential was also observed in the dietary laboratory bioaccumulation study. Although the study is complicated by the fast growth of the juvenile fish, a lipid normalized BMF of at least 1.8 could be derived. Given the fact that exposure in that study was only via the food and not via the water phase, a value of 2.8 could be estimated for combined food and water exposure. Therefore, the laboratory study underpins the observations from the field studies and a final value of 2.8 is selected as BMF1. Together with
the selected BCF this gives a bioaccumulation factor (BAF) of 42000 L/kg. For the saltwater compartment an additional biomagnification step (BMF2) is
introduced in the WFD-methodology to account for the longer food chain in the marine environment. However, D4 appears not to bioaccumulate in mink [38]. Because of the low octanol-air partition coefficient of D4, accumulation in air-breathing animals such as birds and mammals seems unlikely. This is further confirmed by the fact that D4 was not detected above the limit of quantification of 5 µg/kgww in marine mammals (seal blubber, dolphins, porpoise), nor in
seabird eggs either (herring gull, fulmar, black guillemot) [9]. It is considered justified to assume that no additional biomagnification will occur in mammals and birds, and therefore, the value for BMF2 is set to 1.
For the choice of the BMF it is important to consider whether a quality standard in sediment or in water has to be derived. For a quality standard in water, the quality standard should be expressed relative to the clean water phase. From water towards the higher trophic levels there is a significant biomagnification. However, from sediment towards the higher trophic levels there is no
biomagnification. For those systems where the discharge of STP-effluents is the most likely source of D4, preference might be given to quality standards based on sediment concentrations. In that case, a BSAF value would be sufficient to calculate the standards in sediment.
3
Human toxicology, ecotoxicity and derivation of ERLs for
water
3.1 Human toxicology
According to the harmonised classification and labelling under Annex VI of the CLP-regulation (1272/2008/EC), the following classification are assigned to D4 [26]: H361f (reprotoxic Cat. 2; “suspected of damaging fertility”), and H413 (aquatic chronic Cat. 4; “may cause long lasting harmful effects to aquatic life”). According to the triggers in the WFD-guidance, the MPCwater, hh food should be
derived. The evaluation of human toxicological data on D4 is included in Appendix 2. Based on the information from several (inter)national evaluations [4,9,10,14,15], an oral risk limit of 0.13 mg/kgbw.d was derived. In the REACH
dossier, the oral Derived No Effect Level (DNEL) for the general population referring to systemic effects after long-term exposure is 19 mg/kgbw.d [26].
Further information on the derivation of this value is not presented in the public part of the REACH dossier.
3.2 Ecotoxicity data
Detailed aquatic toxicity data for D4 are tabulated in Appendix 3. The available selected acute and chronic ecotoxicity data for fresh water organisms are summarised in Tables 6 and 7. D4 has a low solubility in water and a high Henry’s constant. Therefore, special attention was paid to the test
concentrations used, and only studies which were performed in closed test systems and/or of which the endpoint is based on measured concentrations, are considered reliable. In a number of studies, no effect was observed at the highest concentration tested. The resulting >-values cannot be used for ERL-derivation, but are included in the table below to demonstrate that that particular taxon/species has been tested and did not show an effect.
Table 6 Aggregated data for toxicity of D4: freshwater species
Chronic Acute Taxon/species EC10/NOEC [mg/L] Taxon/species L/EC50 [mg/L] crustacean crustacean
Daphnia magna 0.0079 Daphnia magna > 0.015
insecta
Chironomus tentans ≥ 0.015
pisces pisces
Oncorhynchus mykiss 0.0044a Oncorhynchus mykiss > 0.022
a: NOEC from 14-days prolonged acute test with small fish, an ELS test with the same species did not result in an effect up to the same concentration
Table 7 Aggregated data for toxicity of D4: marine species Chronic Acute Taxon/species EC10/NOEC [mg/L] Taxon/species L/EC50 [mg/L] crustacean Americamysis bahia > 0.0091 pisces Cyprinodon variegatus > 0.0063
3.3 Treatment of freshwater and saltwater toxicity data
There are no indications that the sensitivity of marine organisms differs from that of freshwater species. However, the only acute data for marine species refer to studies in which no effect was observed at the highest concentration and cannot be used for ERL-derivation.
3.4 Derivation of the MPCfw and MPCsw
3.4.1 MPCfw, eco and MPCsw, eco– ecotoxicity data
In the absence of valid data for algae, the base set is not complete. Due to the physicochemical properties of D4, performing a valid algae test would raise technical difficulties. In the risk assessment of the UK Environment Agency [9], QSAR-estimates have been used to fill this data gap. Depending on the QSAR used, the reported estimated 72–96 hour EC50 for algae is between 5.7 µg/L and
0.27 mg/L, respectively. The lower value was obtained using the QSAR from the TGD [6], in the original publication [40] can be seen that the log Kow range of
this QSAR is 2.19 to 4.05. Both reported log Kow-values of D4 are well outside of
this range making the QSAR endpoint unreliable. The higher value was obtained using the EPI (v3.12) software (ECOSAR version 0.99). An estimated chronic value for algae of 0.16 mg/L was also reported [9] as generated using this version of the program. These values are however based on the relatively low log Kow of 5.09 as estimated by the program. The log Kow range of the QSARs in
the 0.99 version of ECOSAR are unknown, but the upper cut-off is probably 6.4 as mentioned in the Canadian assessment [10] for ECOSAR version 0.99f. In that assessment, an acute EC50 for algae of 0.015 mg/L is given, obtained with
ECOSAR version 0.99g of 2004, using the log Kow of 6.49. The QSAR-results are
not used for risk assessment in the Canadian report [10].
When the values are recalculated, using the QSARs for neutral organics of ECOSAR 1.00 as included in Epiweb 4.1 [20], a 96-h EC50 of 0.094 mg/L and
chronic value (ChV) of 0.076 mg/L are predicted for algae when using the experimental log Kow of 6.49. Both values are above the highest reported water
solubility. For acute endpoints, it is noted in the program that if the log Kow is
above 6.4 or if the compound is solid and the EC50 exceeds the water solubility
by a factor of 10, no effects for algae are predicted at saturation level. For chronic endpoints, the same applies for log Kow values above 8.0. This would
indicate that no acute effects on algae are to be expected, but for chronic exposure effects cannot be excluded. The equation used to estimate chronic toxicity for algae is: log ChV (mmol/L) = -0.5547 log Kow + 0.0061, the ChV refers to the MATC, i.e. the geometric mean of LOEC and NOEC and is given in millimoles per liter (mM/L). The QSAR is based on a total of 51 data, with r2 =
0.7187 and the maximum log Kow is 8.0.
In line with the risk assessment of the UK Environment Agency [9], it is concluded that although there is uncertainty over the actual algal NOEC, the available QSAR estimates for algae suggest that algae should not be significantly more sensitive to D4 than fish and invertebrates.
The lowest NOEC is obtained from a 14-days test with Oncorhynchus mykiss. In this test, no mortalities occurred in any treatment group until day seven
(96-hours LC50 > 0.022 µg/L), but treatment-related mortalities were observed
by day 14. Around 80% mortality occurred in the fish exposed to 22 μg/L, with 75 and 20% mortality at 12 and 6.9 μg/L. No mortality occurred at exposure concentrations of 2.9 and 4.4 μg/L. The 14-days LC50 was 0.01 mg/L. In the risk
assessment of the UK Environment Agency [9], it is mentioned that the results were confirmed in further (unpublished) studies with fish of <1.0 g, whereas studies with larger rainbow trout (mean weight 4.3 g) and fathead minnows (Pimephales promelas, mean weight 1.7 g) showed no toxicity at levels up to the solubility limit of D4 in the test medium. Reference is made to another unpublished study in which larger rainbow trout (mean weight 2.2 g) were used. In this test, D4 was injected directly into the influent water of the test system to give a concentration of 39 μg/L), very little toxicity was observed over 14 days of exposure. Finally, an early life test with O. mykiss resulting in a NOEC of ≥ 0.0044 mg/L. In the Canadian risk assessment [10], an assessment factor of 50 is applied to the 14-days LC50 of 0.01 mg/L for O. mykiss, resulting in a PNEC
of 0.002 mg/L. In the UK assessment, an assessment factor of 10 is applied to the NOEC for O. mykiss of 0.0044 mg/L, leading to a PNEC of 0.44 µg/L. The same value is presented in the REACH-dossier [26]. Although there is some remaining uncertainty with respect to the sensitivity of algae, this approach is considered justified since the QSAR predictions confirm that algae are not a particular sensitive group. The MPCfw, eco is derived by putting an assessment
factor of 10 to the NOEC of 0.0044 mg/L, resulting in an MPCfw, eco of 0.44 μg/L.
The MPCsw, eco is derived on the basis of the same dataset. An additional
assessment factor of 10 is applied since no data are available for specific marine taxa. The MPCsw, eco is 0.044 μg/L.
3.4.2 MPCsp, water and MPCsp, saltwater – secondary poisoning
Since the BCF value is 14900 L/kg, the criterion of BCF ≥ 100 L/kg is fulfilled and the MPC via secondary poisoning is derived. Detailed toxicity data for birds and mammals are not available. Therefore, the NOAEL for D4 that is used for the human toxicological threshold limit is also used in the derivation of the MPCfw, secpois and MPCsw, secpois. The NOAEL is 25 mg/kgbw.d for effects on the liver
after repeated oral exposure. The equivalent concentration in food, which is denoted as MPCbiota, secpois, fw is calculated as 500 mg/kgfd, using the conversion
factor of 20 for rats older than six weeks. Combining this value with the BCF for water of 14900 L/kg, and the BMF1 of 2.8 (see section 2.5.3), the MPCfw, secpois is
500 / (14900 x 2.8) = 0.0120 mg/L = 12 µg/L.
For derivation of the MPCbiota, secpois, sw and MPCsw, secpois, an additional
biomagnification step is introduced (BMF2) to account for the longer food chain
in the marine environment. As explained in section 2.5.3.2, the BMF2 is set to 1.
Therefore, the MPCsw, secpois is also 12 µg/L.
3.4.3 MPCwater, hh food – human exposure
Using the TLhh of 0.13 mg/kgbw/d (see section 3.1), a body weight of 70 kg and
a daily fish consumption of 115 g, the MPCbiota, hh food is calculated as
0.1 x 0.13 x 70 / 0.115 = 7.9 mg/kgfd.
Combining this value with the BCF for water of 14900 L/kg, and the BMF1 of 2.8
(see section 2.5.3), the MPCwater, hh food is calculated as
7.9 / (14900 x 2.8) = 0.00019 = 0.19 µg/L.
The MPChh food, water is valid for both the freshwater and the marine compartment
3.4.4 Selection of the MPCfw and MPCsw
The lowest of the three routes – direct ecotoxicity, secondary poisoning and human exposure via fish – is selected as the final MPC. For freshwater, human exposure via fish consumption is the critical route. For saltwater, direct ecotoxicity determines the final value. The MPCfw is 0.19 µg/L, the MPCsw is
0.044 µg/L. Both values are expressed as dissolved concentrations in water.
3.5 MPCdw, hh – surface water for abstraction of drinking water
No EU DW standard (DWD 98/83/EC) or WHO standard is available for D4. A provisional drinking water standard is derived using the TLhh of
0.13 mg/kgbw d, assuming a body weight of 70 kg and a drinking water intake of
2 L per day, and a maximum contribution of drinking water to the TLhh of 10%.
The resulting preliminary MPCdw,hh is calculated as (0.1 x 0.13 x 70) / 2 =
0.455 mg/L = 455 µg/L.
3.6 Derivation of the MACfw, eco and MACsw, eco
Only one acute endpoint is available, the other data are unbound L/EC50-values.
It is not possible to derive a MACfw, eco and MACsw, eco. 3.7 Derivation of the NCfw and NCsw
The NCfw and NCsw are derived as 1/100 of the respective MPC-values. The NCfw
is 0.0019 µg/L (1.9 ng/L), the NCsw is 0.00044 µg/L (0.44 ng/L). 3.8 Derivation of the SRCfw, eco and SRCsw, eco
There is one valid L/EC50, and two long-term NOECs of two required trophic levels. The LC50 divided by 10 is 0.0019 mg/L, the geometric mean of the NOECs is 0.0060 mg/L. The SRCfw, eco and SRCsw, eco are set to the lowest of
4
Discussion and conclusions
Based on the available information, environmental risk limits (ERLs) for octamethylcyclotetrasiloxane (D4) in freshwater and saltwater were derived according to the methodology of the WFD and INS. D4 does not display acute toxicity at the maximum water solubility. Mortality was observed in a 14-days test with small fish, but no effects were seen in a test with larger fish, nor in an early life stage test. Although there is some remaining uncertainty with respect to the sensitivity of algae, the use of an assessment factor of 10 was considered justified since QSAR predictions confirm that algae are not a particular sensitive group. Special attention was paid to the evaluation of bioconcentration,
bioaccumulation and biomagnification. From the available studies a BMF1 of 2.8
was derived, the BMF2 was set to 1. These values were used to derive risk limits
for secondary poisoning and for human exposure via consumption of fish. This latter route is the most critical for freshwater. For the saltwater compartment, direct ecotoxicity determines the MPC. An overview of the derived ERLs is presented in the table below. ERLs that are equivalent to water quality standards required under the WFD are indicated in bold.
Table 8 Environmental risk limits for octamethylcyclotetrasiloxane in water
Environmental risk limit Value
[μg/L] Freshwater MPCfw, eco 0.44 MPCfw, secpois 12 MPCwater, hh food 0.19 MPCfw 0.19 MACfw, eco - NCfw 0.0019 (1.9 ng/L) SRCeco, water 1.9
Surface water for drinking water production
MPCdw, water 455 Saltwater MPCsw, eco 0.044 MPCsw, secpois 12 MPCwater, hh food 0.19 MPCsw 0.044 (44 ng/L)
MACeco, saltwater -
NCsw 0.00044 (0.44 ng/L)
SRCeco, saltwater 1.9
There are no monitoring data of D4 in Dutch surface waters. In the UK risk assessment [9], monitoring data are presented based on [41]. Measured concentrations of D4 in influents of industrial waste water treatment plants (sampling in 2001) ranged from 0.9 to 6.4 mg/L, effluent concentrations were between 0.5 and 16 µg/L. Samples taken downstream contained <0.02 to 1.2 µg/L. Reported concentrations of D4 in influents of European municipal sewage treatment plants sampled in 2000 range from 0.23 to 4.2 µg/L, effluent concentrations are <0.1 to 0.31 µg/L. In the Canadian risk assessment [10], influent concentrations of <0.3 to 24 µg/L are reported, reported effluent concentrations range from 0.06 to 2.9 µg/L (samples taken in 2005). D4 was not detected in surface water in a Swedish study performed in 2004 [42], but
relatively few water samples were included and it is unclear if the sampling locations were situated in areas where D4 was used at that time [9].
In the Netherlands, there is at least one production site of siloxanes at Bergen op Zoom and there is widespread use of siloxanes (pers. comm. Rob Berbee, Waterdienst). Based on the information presented above, it cannot be excluded that the proposed ERL for long-term exposure (0.19 µg/L) will be exceeded, at least in the vicinity of industrial sites. The absence of monitoring data for Dutch surface waters is due to analytical problems. According to information from the Waterdienst, the limit of detection of the current analytical method, in which siloxanes are analysed by gas chromatography, is not adequate. The main cause is that similar materials are applied in the GC-columns, and interfere with the analysis. This is also noted in the UK risk assessment [9], where the column coatings, sealing material and breakdown of septa are mentioned as potential sources of contamination. Another issue is the potential for sample
contamination due to the widespread use of D4 in personal care products. To reach adequate detection limits, a rigorous quality control is needed, and responses in laboratory blanks should always be reported [9,32-34]. It is
advised to improve the analytical techniques, and/or to investigate other options for monitoring.
References
Reference list includes references used in Appendix 1 and 3.
1. VROM, VenW, LNV. 2010. Regeling monitoring kaderrichtlijn water. Staatscourant 5615.
2. VROM. 2004. (Inter)nationale Normen Stoffen. Den Haag, the Netherlands. Ministerie van VROM.
3. INS. 1999. Setting integrated environmental quality standards for substances in the Netherlands. Environmental quality standards for soil, water and air. January 1999 (updated version of original document December 1997). Den Haag, the Netherlands. Interdepartmental Working Party on Setting Integrated Environmental Quality Standards for Substances.
4. Van de Plassche EJ, Van den Hoop MAGT, Posthumus R, Crommentuijn T. 1999. Risk limits for boron, silver, titanium, tellurium, uranium and organosilicon compounds in the framework of EU Directive 76/464/EEC. Bilthoven, The Netherlands. National Institute of Public Health and the Environment (RIVM).
5. Van Vlaardingen PLA, Verbruggen EMJ. 2007. Guidance for the derivation of environmental risk limits within the framework of "International and national environmental quality standards for substances in the Netherlands" (INS). Bilthoven, The Netherlands. National Institute of Public Health and the Environment (RIVM). 6. EC. 2003. Technical Guidance Document on risk assessment in support
of Commission Directive 93/67/EEC on risk assessment for new notified substances, Commission Regulation (EC) No 1488/94 on risk assessment for existing substances and Directive 98/8/EC of the European
Parliament and of the Council concerning the placing of biocidal products on the market. Ispra, Italy. European Commission Joint Research Centre.
7. Lepper P. 2005. Manual on the Methodological Framework to Derive Environmental Quality Standards for Priority Substances in accordance with Article 16 of the Water Framework Directive (2000/60/EC). Schmallenberg, Germany. Fraunhofer-Institute Molecular Biology and Applied Ecology.
8. EC. 2011. Technical guidance for deriving environmental quality
standards. Common Implementation Strategy for the Water Framework Directive (2000/60/EC). Guidance Document No. 27. Brussels. European Communities.
9. Brooke DN, Crookes MJ, Gray D, Robertson S. 2009. Environmental Risk Assessment Report: octamethylcyclotetrasiloxane, 181. Bristol, United Kingdom. Environment Agency. Report nr. SCHO0309BPQZ-E-P. 10. EC/HC. 2008. Screening Assessment for the Challenge
octamethylcyclotetrasiloxane (D4). Environment Canada, Health Canada. 11. EU PBT Working Group. 2010. Identification of PBT and vPvB substance.
Results of evaluation of PBT/vPbB properties. Draft for discussion. 12. Global Silicones Council. 2009. cVMS Expert Panel Workshop Summary.
October 6, 2009, Crowne Plaza Airport Hotel, 33 Carlson Court, Toronto ON, M9W 6H5.
13. Centre Européen des Silicones. 2010. EU Member States Siloxanes Workshop, June 10-11, 2010, European Chemical Agency, Annankatu 18 00120 Helsinki, Finland.
14. EC. 2005. Opinion on Octamethylcyclotetrasiloxane (D4) Cyclomethicone (INCI name). Adopted by the SCCP during the 6th plenary meeting of 13 December 2005. Brussels, Belgium. Scientific Committee on Consumer Products. Report nr. SCCP/0893/05.
15. EC. 2010. Opinion on Cyclomethicone Octamethylcyclotetrasiloxane (Cyclotetrasiloxane, D4) and Decamethylcyclopentasiloxane
(Cyclopentasiloxane, D5). Adopted at the 7th plenary meeting of 22 June 2010. Brussels, Belgium. Scientific Committee on Consumer Safety. Report nr. SCCS/1241/10.
16. Klimisch HJ, Andreae M, Tillman U. 1997. A systematic approach for evaluating the quality of experimental toxicological and ecotoxicological data. Reg Toxicol Pharmacol 25, 1-5.
17. Varaprath S, Frye CL, Hamelink J. 1996. Aqueous solubility of
permethylsiloxanes (silicones). Environmental Toxicology and Chemistry 15, 1263–1265.
18. Hobson JF, Silberhorn EM. 1995. Octamethylcyclotetrasiloxane (OMCTS), a case study: Summary and aquatic risk assessment. Environmental Toxicology and Chemistry, 14, 1667–1673.
19. Kozerski GS, H. 2007. Determination of the 1-octanol/water partition coefficient of octamethylcyclotetrasiloxane (D4) by the slow stirring method using gas chromatography and mass spectrometry 2007. SEHSC.
20. US EPA. 2000-2008. EpiSuite 4.1. United States Environmental Protection Agency,
http://www.epa.gov/oppt/exposure/pubs/episuite.htm.
21. Flaningham OL. 1986. Vapour pressures of poly(dimethylsiloxane) oligomers. Journal of Chemical and Engineering Data 31, 266–272. 22. Xu S, Kozerski G, Powell D. 2007. Estimation of Air/Water and
Octanol/Water Partition Coefficients for Dodecamethylcyclohexasiloxane at Room Temperature. Auburg, MI, United States.
23. Xu S, Kropscott G. 2007. Simultaneous determination of partition coefficients for octamethylcyclotetrasiloxane and
decamethylcyclopentasiloxane.: Dow Corning.
24. Kochetkov A, Smith JS, Ravikrishna R, Valsaraj T, Thibodeaux LJ. 2001. Air–water partition constants for volatile methyl siloxanes. . Environ Toxicol Chem 20, 2184-2188.
25. Hamelink JL, Simon PB, Silberhorn EM. 1996. Henry’s law constant, volatilization rate, and aquatic half-life of octamethylcyclotetrasiloxane. . Environ Sci Technol 30, 1946-1952.
26. ECHA. 2012. http://echa.europa.eu/.
27. Bidleman TF. 2008. Review of the Dow-Corning Health & Environmental Sciences Technical Reports: "Hydrolysis of Octamethylcyclopentasiloxane (D4)" and "Hydrolysis of Decamethylcyclopentasiloxane (D5)".
Environment Canada, Centre for Atmospheric Research Experiments (Egbert, ON.).
28. Durham J. 2005. Hydrolysis of octamethylcyclotetrasiloxane (D4). Silicones Environment HaSC.
29. Kozerski G. 2008. SEHSC response to Dr. Bidleman’s review on hydrolysis studies of D4 and D5. Dow Corning Corporation.
30. EC. 2012. European Union System for the Evaluation of Substances 2.1.1 (EUSES 2.1.2). Prepared for the European Chemicals Bureau by the National Institute of Public Health and the Environment (RIVM). Bilthoven, the Netherlands. European Commission.
31. Dow Corning. 2007. 14C-Octamethylcyclotetrasiloxane (14C-D4): Dietary bioaccumulation in the Rainbow Trout (Oncorhynchus mykiss) under flow-through test conditions. Health and Environmental Sciences. 32. Powell DE. 2010. Bioaccumulation and trophic transfer of cyclic volatile
methylsiloxane (cVMS) material in the aquatic marine food webs of the Inner and Outer Oslofjord, Norway, 1-40. Auburn, MI, US. Report nr. HES Study No 11060-108,
http://www.epa.gov/oppt/tsca8e/pubs/8ehq/2010/feb10/8ehq_0210_17 834a.pdf.
33. Powell DE. 2010. Preliminary assessment of cyclic volatile methylsiloxane (cVMS) materials in surface sediment, cores,
zooplankton, and fish of Lake Opeongo, Ontario, Canada 1-40. Auburn, MI, US. Dow Corning Corporation. Report nr. HES Study No. 10806-108, http://www.epa.gov/oppt/tsca8e/pubs/8ehq/2010/feb10/8ehq_0210_17 834a.pdf.
34. Powell DE, Woodburn KB. 2009. Trophic dilution of cyclic volatile methylsiloxane (cVMS) materials in a temperate freshwater lake, 1-61. Auburn, MI, US. Dow Corning Corporation. Report nr. HES Study No 10771-108,
http://www.epa.gov/oppt/tsca8e/pubs/8ehq/2010/feb10/8ehq_0210_17 834a.pdf.
35. Fackler PH, Dionne E, Hartley DA, Hamelink JL. 1995. Bioconcentration by fish of a highly volatile silicone compound in a totally enclosed aquatic exposure system. Environ Toxicol Chem 14, 1649-1656. 36. Annelin RB, Frye CL. 1989. The piscine bioconcentration characteristics
of cyclic and linear oligomeric permethylsiloxanes. Sci Total Environ 83, 1-11.
37. ECHA. 2008. Guidance on information requirements and chemical safety assessment Chapter R.7c: Endpoint specific guidance. Helsinki, Finland. European Chemicals Agency,
http://echa.europa.eu/documents/10162/17224/information_requireme nts_r7c_en.pdf.
38. Woodburn KB, Durham JA. 2009. Analysis of volatile cyclic
methylsiloxanes (cVMS) in fat, muscle, and liver tissue of American mink (Mustela vison) obtained from Lake Pepin, Minnesota, USA, 1-26.
Auburn, MI, US. Dow Corning Corporation,
http://www.epa.gov/oppt/tsca8e/pubs/8ehq/2010/feb10/8ehq_0210_17 834a.pdf.
39. Kierkegaard A, Van Egmond R, McLachlan MS. 2011. Cyclic volatile methylsiloxane bioaccumulation in flounder and ragworm in the Humber estuary. Environ Sci Technol 45, 5936-5942.
40. Van Leeuwen CJ, Van der Zandt PTJ, Aldenberg T, Verhaar HJM,
Hermens JLM. 1992. Application of QSARs, extrapolation and equilibrium partitioning in aquatic effects assessment. I. Narcotic industrial
pollutants. Environ Toxicol Chem 11, 267-282.
41. Boehmer T, Gerhards R. 2003. Octamethylcyclotetrasiloxane (D4), a compilation of environmental data. Report for Centre Européen des Silicones. Essen. Degussa Goldschmidt AG.
42. Kaj L, Andersson J, Palm Cousins A, Remberger M, Brorström-Lundén E, Cato I. 2005. Results from the Swedish National Screening Programme 2004. Subreport 4: Siloxanes. Stockholm, Sweden. Swedish
Environmental Research Institute. Report nr. IVL B 1643.
43. Firmin R, Frye CL, Raum ALJ. 1984. The environmental impact of organosilicon compounds on the aquatic biosphere, Proceedings of the
Environment. G Persoone, E Jaspers, C Clause (Eds). Bredene, Belgium. State Univ. Ghent and Inst. Mar. Scient. Res.
44. Sousa JV, McNamara PC, Putt AE, Machado MW, Surprenant DC, Hamelink JL, Kent DJ, Silberhorn EM, Hobson JF. 1995. Effects of octamethylcyclotetrasiloxane (OMCTS) on freshwater and marine organisms. Environmental Toxicology & Chemistry 14(10), 9. 45. Kent DJ, McNamara PC, Putt AE, Hobson JF, Silberhorn EM. 1994.
Octamethylcyclotetrasiloxane in aquatic sediments: toxicity and risk assessment. Ecotoxicol Environ Saf 29, 372-389.