Contact: Dr D. de Zwart
Laboratory for Ecological Risk Assessment (LER) e-mail: d.de.zwart@rivm.nl
RIVM report 607880006/2006
Environmental effect indicators for priority pollutants
D. de Zwart, H.A. den Hollander, L. Geelen (RU, Nijmegen). M.A.J. Huijbregts (RU, Nijmegen)
In the context of the projects M/607880 and M/607010, ‘Chemical Substance Dispersion’, this study was performed at the expense of the Netherlands Ministry of Housing, Spatial Planning and the Environment, Directorate-General for Environmental Protection, Directorate for Chemicals, Waste and Radiation.
RIVM, PO Box 1, 3720 BA Bilthoven, the Netherlands, telephone: +31-30-274 91 11; fax: +31-30-274 29 71
Rapport in het kort
Milieueffectindicatoren voor prioritaire stoffen
Dit rapport beschrijft een methode die de effecten schat van Nederlandse emissies van prioritaire stoffen op de volksgezondheid en ecosystemen. Prioritaire stoffen vormen een dusdanig gevaar voor het milieu, dat met voorrang emissiereducerende maatregelen zijn getroffen om dat gevaar te
verminderen. De methode berekent zogenaamde MilieuEffectIndicatoren (MEI) en is ontwikkeld om te toetsen of de doelstellingen van het Nederlandse milieubeleid gehaald zijn.
De eerste milieueffectindicator, de MEIECO, schat het verlies van soorten organismen in het
Nederlandse oppervlaktewater als gevolg van emissies van prioritaire stoffen. Uit een toetsing blijkt dat het effect van prioritaire stoffen op de soortensamenstelling in de periode 1990-2003 ongeveer is gehalveerd. Op basis van de Nederlandse emissies wordt het verlies van soorten in 1990 geschat op 3,2% en in 2003 op 1,8%. De MEIECO wordt berekend op basis van geschatte blootstelling, de
gevoeligheid van soorten voor bepaalde stoffen en de giftigheid van bepaalde stofmengsels.
De tweede milieueffectindicator, de MEIVGZ, schat het effect van emissies van prioritaire stoffen op de
volksgezondheid. Uit een analyse van de situatie in Nederland blijkt dat de impact van de prioritaire stoffen op de volksgezondheid met ongeveer eenderde is afgenomen. Het effect wordt uitgedrukt in het verlies aan DALY’s (Disability Adjusted Life Years), ofwel het aantal gezonde levensjaren dat een populatie verliest door ziekten of voortijdig overlijden. Het effect van de Nederlandse emissies wordt geschat op een verlies van 59.000 DALY in 1990 en 42.000 DALY in 2003. De MEIVGZ wordt
berekend op basis van geschatte blootstelling, de ziekteverwekkende eigenschappen van bepaalde stoffen en epidemiologische gegevens.
Abstract
Environmental effect indicators for priority pollutants
Here a method is described for estimating public health and ecosystem effects due to the emission of priority pollutants in the Netherlands. Priority pollutants are subject to measures of emission reduction because of their immediate threat to the environment. The method proposed calculates so-called environmental effect indicators (MEI in Dutch) and is designed to test the effectiveness of the environmental policy in the Netherlands.
The first indicator, for ecological environmental effect (MEIECO), estimates the impact of priority
pollutant emissions on the relative loss of species from surface waters in the Netherlands. Evaluation of historical data reveals the impact of priority pollutants on the composition of aquatic species was to have approximately halved between 1990 and 2003. When considering only the impact of emissions originating from the Netherlands, the loss of species was estimated at 3.2% in 1990 and 1.8% in 2003. The calculation of the MEIECO is based on estimated exposure, pollutant-specific species-sensitivity
distributions and considerations on mixture toxicity.
The second indicator, the public health effect indicator (MEIVGZ), estimates the impact of priority
pollutant emissions on the health of the Dutch population. Evaluation of historical data reveals an impact reduction of approximately one-third of the priority pollutants on public health in the
Netherlands between 1990 and 2003. The impact is expressed as the loss of Disability Adjusted Life Years (DALY), which is the population loss of healthy life years due to disease and untimely death. If we consider only the emissions originating from the Netherlands, the health impact is estimated at a loss of 59,000 DALY in 1990 and 41,000 DALY in 2003. The calculation of the MEIVGZ is based on
estimated exposure, the pathogenic properties of priority pollutants and epidemiological considerations.
Contents
Samenvatting Summary
1. Introduction 11
2. MEI definition: outline and choices 13
2.1 Exposure modeling 13
2.2 MEI for ecosystem effects 14
2.2.1 Species sensitivity distributions 14
2.2.2 Mixture toxicity evaluation 15
2.2.3 MEIECO based on msPAF evaluation 16
2.3 MEI for public health effects 16
2.3.1 Options for integrated health measures 16
2.3.2 MEIVGZ based on DALY evaluation 18
3. Technical description of data and methods 21
3.1 Available emission data 21
3.2 Calculation of environmental concentrations from emission data 22
3.2.1 SimpleBox model 22
3.2.2 OPS model 24
3.2.3 LOTOS/EUROS model 24
3.3 Available data on measured concentrations 25
3.3.1 Water 25
3.3.2 Air 25
3.4 Calculation procedure for MEIECO 25
3.4.1 SSD and mixture toxicity 25
3.4.2 MEIECO based on species loss 26
3.4.3 Separation of MEIECO for Dutch emissions 26
3.5 Calculation procedure for MEIVGZ 26
3.5.1 MEIVGZ and DALY formulae 26
3.5.2 Data selection 28
4. Results and discussion 31
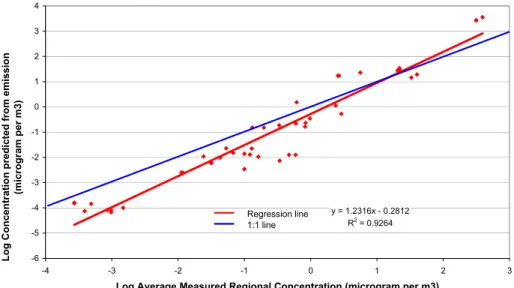
4.1 Validation of predicted concentrations 31
4.1.1 Water 31
4.1.2 Air 33
4.1.3 Conclusions on the use of modelled concentrations 34
4.2 MEIECO evaluation and trends 34
4.2.1 Ecosystem exposure to priority pollutants in water 34
4.2.2 Assessment of ecological risk 35
4.3 MEIVGZ evaluation and trends 37
4.3.1 Human exposure to priority pollutants in ambient air 37
4.3.2 Assessment of human health risk 38
5. Evaluation of uncertainties and MEI 41
6. Conclusions 43
6.1 Design of MEI indicators 43
6.2 Trends in the MEI evaluation 43
Literature 45 Annex 1 49 Annex 2 51 Annex 3 54 Annex 4 56 Annex 5 59 Annex 6 63
Samenvatting
Dit rapport beschrijft methoden waarmee twee afzonderlijke Milieu Effect Indicatoren (MEI) voor Nederlandse emissies van prioritaire stoffen kunnen worden berekend. De methoden schatten de gemiddelde effecten die in Nederland respectievelijk worden verwacht op de volksgezondheid (MEIVGZ) en op de biodiversiteit in ecosystemen (MEIECO). De
milieueffectindicatoren vormen de derde schakel in een stelsel van milieubeleidsindicatoren, waarmee eerst het behalen van emissiedoelstellingen wordt afgemeten aan de Milieu Druk Indicator (MDI) en op de tweede plaats het behalen van milieukwaliteitsdoelstellingen in termen van concentraties wordt afgemeten aan de Milieu Kwaliteits Indicator (MKI). De neergaande trends in de MEI-evaluatie wijzen erop dat het Nederlands milieubeleid ten aanzien van emissiereducerende maatregelen van prioritaire stoffen in de periode tussen 1990 en 2003 belangrijke successen heeft geboekt.
MEIECO
De MEIECO schat het gemiddelde relatieve verlies van soorten in Nederlandse
oppervlaktewateren als gevolg van Nederlandse emissies van 48 prioritaire stoffen waarvoor op dit moment emissiegegevens beschikbaar zijn. De MEIECO is beperkt tot de effecten op
waterorganismen omdat voor bodem-, land- en luchtsoorten niet voldoende
gevoeligheidsgegevens bekend zijn. Echter, door de aard van de concentratieberekeningen zijn overeenkomstige effecten te verwachten in de milieucompartimenten water, waterbodem, droge bodem en lucht. De MEIECO is berekend met behulp van de gevoeligheidsverdeling van
soorten (Species Sensitivity Distribution – SSD) op basis van de mediaan acuut dodelijke concentraties (EC50). Door de onzekerheden in de SSD-methode en de analyse via de
ruimtelijk gemiddelde blootstelling dient de MEIECO niet gebruikt worden als een absolute
maat voor het werkelijke verlies aan soorten. De methode kan echter wel gebruikt worden als relatieve indicator bij prioriteitstelling en beleidsevaluaties. Het effect van prioritaire stoffen op de soortensamenstelling is in de periode tussen 1990 en 2003 ongeveer gehalveerd. Op basis van alleen de Nederlandse emissies wordt het verlies van soorten in 1990 geschat op 3,2% en in 2003 op 1,8%. Wanneer ook de Europese emissies bij de berekeningen worden betrokken neemt het geschatte verlies van soorten toe tot 4,1%in 1990 en 2,2% in 2003. Hiermee zijn de Nederlandse emissies verantwoordelijk te stellen voor ongeveer 75% van de geschatte effecten. De geschatte effecten worden in gelijke mate veroorzaakt door de emissies van koper en PAK’s, en in mindere mate door de emissies van zink. De sterkste daling vindt plaats in de periode tussen 1995 en 2002. Er moet worden opgemerkt dat de hier
gepresenteerde evaluatie slechts een klein deel van de potentieel aanwezige stoffen betreft. Verwacht wordt dat een uitbreiding van het aantal stoffen waarvoor emissiegegevens beschikbaar zijn slechts zal resulteren in een marginale toename van de geschatte effecten. MEIVGZ
De MEIVGZ drukt het effect van emissies van prioritaire stoffen op de volksgezondheid uit in
de maat ‘Disability Adjusted Life Years’ (DALY), ofwel het verlies aan gezondheid gewogen levensjaren voor de gehele Nederlandse populatie. De DALY weegt de mate van ongemak die wordt veroorzaakt door een aandoening, de duur van de aandoening en een eventueel te vroeg overlijden. Alhoewel de opname van milieucontaminanten op talrijke manieren plaats kan vinden (lucht, voedsel, drinkwater, huidcontact, etcetra) is de berekening van de MEIVGZ
blootstellingsroute. Deze keuze is gemaakt om nauwelijks te modelleren verschillen in locatie van voedselherkomst, voedselkeuze en drinkwaterbehandeling uit te sluiten. De MEIVGZ is,
door gebrek aan beschikbare data, slechts voor 11 carcinogene stoffen en voor Particulair Materiaal met een diameter tot 10 micrometer (fijn stof - PM10) en ozon berekend. Door de
grote onzekerheden in de DALY-methode en de analyse via de ruimtelijk gemiddelde
blootstelling dient de MEIVGZ niet gebruikt worden als een absolute maat voor het werkelijke
verlies aan gewogen levensjaren. De methode kan echter wel gebruikt worden als relatieve indicator bij prioriteitstelling en beleidsevaluaties. De geschatte impact op de
volksgezondheid van de set van stoffen is in de periode tussen 1990 en 2003 met 31% afgenomen. De belangrijkste veroorzaker van gezondheidseffecten is de emissie van PM10
met een effect dat wordt geschat op verlies van 86000 DALY in 2003, als de emissies in Europa en in Nederland worden samengenomen. Het effect van Nederlandse emissies wordt geschat op een verlies van 59000 tot 42000 DALY. Het aandeel van de set van carcinogene stoffen en van ozon is met een verlies van slechts 143 tot 55 DALY relatief verwaarloosbaar. Ook voor de MEIVGZ wordt verwacht dat een uitbreiding van het aantal stoffen waarvoor
emissies naar het buitenmilieu en gezondheidsschade bekend zijn slechts aanleiding zal geven tot een marginale toename van de geschatte effecten op de volksgezondheid.
Summary
This report describes newly developed methods to quantify two separate environmental effect indicators (MEI) for emissions of priority pollutants in the Netherlands. The methods estimate the average effects that are expected to occur on public health (MEIVGZ) and on biodiversity
in ecosystems (MEIECO), respectively. The MEI indicators are the third in a series of
environmental policy indicators, where firstly the environmental pressure indicator (MDI) quantifies whether the emission reduction objectives are met, and where secondly the environmental quality indicator (MKI) verifies whether environmental quality standards are met.
The down-going trends in the MEI evaluations indicate that environmental policy in the Netherlands with respect to emission reduction of priority pollutants was rather successful in the period between 1990 and 2003.
MEIECO
The MEIECO estimates the average relative loss of species from surface waters in the
Netherlands as a consequence of the emissions of 48 priority pollutants for which emission data were available, The MEIECO is limited to the effects on freshwater organisms, because
the sensitivity patterns for soil, sediment and air exposed organisms are not sufficiently known. However, due to the fact that the predicted concentrations in different compartments are based on steady state equilibrium partitioning, the ecological effects in different
compartments are expected to be about equal. The MEIECO is evaluated using Species
Sensitivity Distributions (SSD) based on acute median lethal concentrations (EC50). The results of the MEIECO calculation should not be interpreted as an absolute loss of species,
because of the spatial average of the exposure and the large uncertianties in the SSD-method. However, the results may be useful as an indicator in a comparative sense. Over the past 10 years, the impact on the loss of species diminished by approximately 50%. Restricted to the modeled effects caused by emissions in the Netherlands only, the loss of species is estimated to be 3.2% in 1990 and 1.8% in 2003. Including the European emissions, the estimated effects increase to 4.1% and 2.2%, respectively. The emissions in the Netherlands are considered responsible for approximately 75% of the overall effects in aquatic
ecosystems. Both for isolated emissions in the Netherlands as well as the overall European emissions and for all years, the effects are mainly attributed to the emissions of copper and PAH, and to a lesser extent by the emissions of zinc. The presented evaluation is only concerned with a limited number of the toxicants that are potentially entering the
environment. However, even if the number of toxicants for which emission data are available is considerably extended beyond the hard-core priority pollutants that now take part in the evaluation, it is not expected that the MEIECO would increase more than marginally.
MEIVGZ
The MEIVGZ expresses the public health effects as ‘Disability Adjusted Life Years’ (DALY),
or in other words the loss of health weighted life years for the entire population of the Netherlands. The DALY weights the amount of discomfort caused by a disease, the duration of a disease and the life years lost by untimely death. Public exposure to environmental contaminants may be accomplished by a variety of exposure routes. The calculation of the MEIVGZ is solely based on the inhalation of the Netherlands median quality of the outside air.
food habits and drinking water preparation processes. Due to a lack of data, the MEIVGZ is
calculated for the combined action of 11 carcinogenic compounds, ozone and fine particulate matter. The results of the MEIVGZ calculation should not be interpreted as the absolute loss of
life years, because of the spatial average of the exposure and the large uncertainties in the DALY method. However, the results may be useful as an indicator in a comparative sense. Over the years 1990 to 2003, the public health impact of the combined set of included substance emissions decreased with 31%. The major proportion of effects is modeled to be caused by the emissions of PM10 in Europe and the Netherlands together (loss of
86000 DALY in 2003). Restricted to the isolated emissions in the Netherlands the modeled effects diminish to approximately 50% of that (loss of 59000 to 42000 DALY). The health risk contribution caused by the emissions of the set of carcinogenic compounds and ozone (loss of 143 to 55 DALY) is relatively negligible compared to the health risk of PM10. Also
for the MEIVGZ only a marginal increase is expected with an extension of the number of
1.
Introduction
Environmental policy in the Netherlands has a thematic approach. Themes recognized are: • Climate change
• Acidification • Eutrophication
• Toxic and hazardous substances • Contaminated land
• Waste disposal • Disturbance
• Groundwater depletion.
With the preparation, formulation and implementation of environmental policy, the question has risen what type of indicators we need to demonstrate the effectivity of the measures taken. To answer this question for the problem of exposure to toxicants and hazardous substances, the Directorate General for Environmental Protection from the Netherlands Ministry of Housing, Spatial Planning and the Environment identified the need to formulate a series of policy indicators to reveal progress with respect to a variety of policy targets set:
• Emission reduction targets formulated for priority pollutants require an environmental pressure indicator (Milieu Druk Indicator - MDI) to reveal whether the reductions in actual emissions meet these targets. The MDI, developed in 1999 (Van de Bovekamp et al., 1999), is considered to be the most important indicator, because it directly relates to the primary policy objective of emission reduction.
• Environmental quality standards formulated for priority pollutants require an environmental quality indicator (Milieu Kwaliteits Indicator - MKI) that verifies whether the actual concentrations measured in the environment meet these standards. The MKI, developed in 2000 (Sterkenburg et al., 2000), is considered an indicator to refine the evaluation with respect to environmental quality objectives.
• The environmental effect indicator (Milieu Effect Indicator – MEI) quantifies the effects that actually may occur in the exposed ecosystems and on public health. As such, the MEI is considered a less influential indicator that may become obsolete when the primary policy targets are about to be met.
In the present report the MEI is formulated for the effects on the ecosystem (MEIECO) and the
effects on public health (MEIVGZ) separately.
The goals of this study are:
1) to design and formulate methods to derive both MEI indicators,
2) to illustrate the method with real examples, evaluating the estimated effects of emission of priority pollutants for the years 1990, 1995, 2002 and 2003, and
3) to evaluate the effectivity of environmental policy in the Netherlands, with respect to the measures taken for reduction of priority pollutant emissions.
2.
MEI definition: outline and choices
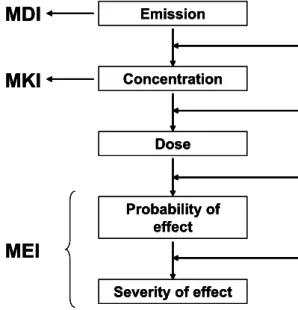
Derivation of any effect indicator requires a number of steps as depicted in Figure 1.
Emission Concentration Dose Probability of effect Severity of effect Fate Exposure Potency Damage MEI MDI MKI Emission Concentration Dose Probability of effect Severity of effect Fate Exposure Potency Damage MEI MDI MKI Emission Concentration Dose Probability of effect Severity of effect Fate Exposure Potency Damage MEI MDI MKI
Figure 1 Illustrative outline of stages for the calculation of characterization factors for both human health and ecosystem effects (after Krewitt et al., 2002)
Exposure to substances in the environment may lead to effects. The impact of a substance depends on fate, exposure, the likelihood of an effect and the consequences of an effect. The likelihood of an effect is described by the toxicological potency (a quantitative measure related to the dose–response of a substance, such as the relative risk in a cohort study or an aquatic toxicity test conducted in a laboratory). The consequences of an effect can be described as toxicological severity (a measure or description, qualitative or quantitative, of the effect incurred, such as bladder cancer, skin irritation, the reproduction success or mortality observed in a test species).
In the following subchapters an overview is given of options for the different modeling steps that have to be taken to derive environmental effect indicators.
2.1
Exposure modeling
Effects of environmental contamination are generally caused by concentrations of
contaminants in the environment. Due to limited availability of measured concentrations for a wide variety of priority pollutants, it was decided to base the MEI on environmental
concentrations predicted from emission data. Using emission data as the primary input to the analysis allows us to separate the influence of the emissions in the Netherlands from the influence of the emissions abroad. This may be a valuable asset for the evaluation of the MEI for the effectivity of the Dutch environmental policy. Substances are emitted in the
environment and spread throughout the environment where people and the ecosystem are exposed to them. The first step in the process of MEI estimation converts emissions in the
Netherlands and in the rest of Europe to national median environmental concentrations in different compartments. The concentration of the substances in various media and exposure to these substances in the various media can be estimated with fate, transport and exposure modelling.
2.2
MEI for ecosystem effects
Due to limited availability of toxicity values for soil and air exposure to toxicants, the MEI for the ecosystem (MEIECO) is restricted to quantify the effects that may occur in a generic
community of freshwater organisms. The concentration predictions performed by the exposure modeling are based on principles of equilibrium partitioning (EP). If it is assumed that both water and soil organisms are mainly exposed through the water phase, EP theory dictates that the exposure of water and sediment organisms is about equal. From the limited amount of data available, it can not be concluded that soil organisms have a sensitivity pattern that is grossly different from that of water organisms. Under these assumptions, the MEIECO
based on soil exposure will be similar to the MEIECO based on aquatic exposure. For
ecotoxicity in water, the emissions and concentrations of Ozone and PM10 are not considered
influential.
Given the estimates of ambient concentrations, the calculation of the MEIECO is based on
pollutant-specific species-sensitivity distributions and considerations on mixture toxicity.
2.2.1 Species sensitivity distributions
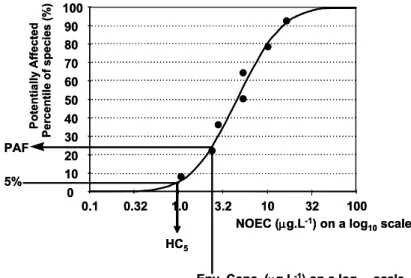
Analyzing the results of the world’s resources on laboratory derived toxicity observations learnt that species differ in their sensitivity towards a single chemical (Hoekstra et al., 1994; Notenboom et al., 1995; Vaal et al., 1997a; Vaal et al., 1997b; Vaal et al., 2000). This may be due to differences in life history, physiology, morphology and behavior. Without attempting to explain the cause of variability in species sensitivity, this recognition led to attempts to describe the variation with statistical distribution functions, thereby putting the concept of Species Sensitivity Distribution (SSD) into existence (Stephan et al., 1985; Van Straalen and Denneman, 1989; Posthuma et al., 2002). The basic assumption of the SSD concept is that the sensitivities of a set of species can be described by some kind of statistical distribution. Usually a parametric distribution function is applied, such as the triangular (e.g. Stephan, 1985), normal (e.g. Wagner and Løkke, 1991) or logistic distribution (e.g. Van Straalen and Denneman, 1989). Non-parametric methods are used as well (e.g. Jagoe and Newman, 1997). The available ecotoxicological data are seen as a sample from this distribution and are used to estimate the moment parameters of the SSD. The moments of the statistical distribution are used to calculate a concentration that is expected to be safe for most species of interest (e.g., the HC5, see Figure 2), which in turn can be used to set a regulatory Environmental Quality
Criterion. A more recent application is the use of SSDs in Ecological Risk Assessment of contaminated ecosystems. Since their introduction, the importance of SSDs in ecotoxicity evaluations has steadily grown until they are now used world wide. Intensive discussions have taken place on principles, statistics, assumptions, data limitations, and applications (e.g. Forbes and Forbes, 1993; Hopkin, 1993; Smith and Cairns, 1993; Chapman et al., 1998; Posthuma et al., 2002). So far, the SSD method is the only significant basis to predict toxic risks for a multitude of toxicants on natural ecosystems with multiple species, including the assessment of mixture risks.
The process of calculating toxic risk, or the Potentially Affected Fraction of species (PAF) from an SSD is depicted in Figure 2.
0 10 20 30 40 50 60 70 80 90 100 0.1 0.32 1.0 3.2 10 32 100 NOEC (μg.L-1) on a log 10scale PAF
Env. Conc. (μg.L-1) on a log 10 scale P o ten tially Affected Per c en tile of sp ec ie s ( % ) 5% HC5 0 10 20 30 40 50 60 70 80 90 100 0.1 0.32 1.0 3.2 10 32 100 NOEC (μg.L-1) on a log 10scale PAF
Env. Conc. (μg.L-1) on a log 10 scale P o ten tially Affected Per c en tile of sp ec ie s ( % ) 5% HC5
Figure 2 Exemplary cumulative distribution function of species sensitivity fitted (curve) to observed chronic toxicity values (NOEC; dots). The arrows indicate the inference of a Potentially Affected Fraction of species (PAF-value) and the HC5.
2.2.2 Mixture toxicity evaluation
Methods to assess the joint action of components in a mixture of toxicants are largely based on the conceptual groundwork laid by Bliss (1939), and are mathematical rather than
biological in nature. Plackett and Hewlett (1952) expanded Bliss’s scheme with the possible types of interactions that can occur between chemical components of mixtures (Table 1). Table 1 The four possible types of joint action for mixtures as defined by Plackett and Hewlett (1952).
Similar Joint Action Dissimilar Joint Action Non-Interactive Simple similar action (concentration addition) Independent joint action (response addition) Interactive Complex similar action Dependent joint action
For the non-interactive or independent types of joint action it is assumed that the chemicals in the mixture do not affect the toxicity of one another. Two different models are available, depending on the Toxic Modes of Action (TMoA) of the chemicals in the mixture. The modeling approach commonly known as Concentration Addition (CA) relates to Simple Similar Action (SSA), and concerns mixtures of chemicals with the same TMoA. The modeling approach called Response Addition (RA) is related to Independent Joint Action (IJA) and is used to predict the combined effect of toxicants with dissimilar TMoA. No models other than empirical observations are available for the prediction of interactive joint action (either for similar or dissimilar TMoA), where the constituents of the mixture influence each other in the expression of their toxicity.
For calculating the combined added toxic risk of the evaluated priority pollutants as the MEIECO, a mixed model is used where the combined toxicity of groups of substances with the
same TMoA is first evaluated with the CA model, producing a multiple substance concentration additive Potentially Affected Fraction of species for a single TMoA (msPAFTMoA). After this first step the risk contributions of groups of compounds with
different TMoA are combined according to the RA model, to produce a msPAFOverall. The
procedures used are detailed in De Zwart and Posthuma (2005).
2.2.3 MEI
ECObased on msPAF evaluation
For the MEIECO, the ecosystem effects in relation to a calculated concentrations in surface
water result in effects will be quantified as the msPAF based on acute LC50 exceedance. This
measure is considered an estimate of the proportion of species lost from the aquatic ecosystem (Posthuma and De Zwart, 2006).
Interpretation of the MEIECO
Because of the uncertainties, it should be noted that the MEIECO should be used as a relative
measure for policy evaluation and priority setting only, and not as an absolute quantification of ecosystem effects.
2.3
MEI for public health effects
Human exposure to substances in the environment may lead to health effects. The human population can be exposed to substances in the environment via three different routes of exposure: the inhalation route, the oral route and, to a lesser extend, the dermal route. The focus in this study is on the direct route of exposure for priority air pollutants by inhalation of ambient air. Exposure to priority air pollutants via the oral or dermal route is not within the scope of this study because of modeling difficulties related to unpredictable regional differences in food preferences, human behavior and drinking water treatment.
2.3.1 Options for integrated health measures
Mortality rates, morbidity, healthy life expectancy, attributable burden of disease measures, and monetary valuation are common health measures as pointed out by Knol and Staatsen (2005). All methods have several associated difficulties, such as imprecision of the population exposure assessment; uncertain shapes of the exposure-response curves for the low environmental exposure levels; insufficient (quality of) epidemiological data;
extrapolation from animal to man or from occupational to the general population;
generalization of exposure-response relations from locally collected data for use on regional, national or global scale; combined effects in complex mixtures, etcetera.
It should be noted that comparing public health problems, whether in terms of discomfort, monetary implications or some other measure, should never be the only criterion on which to base policy. Other important factors not captured in these methods include for example solidarity and equity, and certain social impacts. However, the measures can provide valuable information as part of the whole decision making process. The following description of integrated health measures is based on Knol and Staatsen (2005).
Mortality and morbidity figures
The annual mortality risk or the number of deaths related to a certain (environment-related) disease can be compared with this risk or number in another region or country, or with data from another period in time. A serious disadvantage is that non-fatal health outcomes are not incorporated in the calculations. For non-fatal health outcomes, morbidity numbers (i.e. prevalence or incidence rates based on hospital admissions or doctor visits) can be used to evaluate a (population) health state. The mortality and morbidity rates are easy to
comprehend and because everyone is treated equal, there don’t seem to be ethical questions attached. But the fact that everyone is treated equal can also be considered a drawback,
because the death of young and healthy people is getting the same weight as the death of elderly or ill people. Furthermore, there is no indication of the severity of diseases. In addition, both mortality and morbidity figures are difficult to attribute to their exact causes.
Therefore, mortality and morbidity figures only reveal part of a public health problem and are not very useful for complex policy questions related to environmental health.
Healthy life expectancy
Using mortality tables, the total average life expectancy can be calculated for different age groups in a population. This measure is especially useful to review the generic health state in a country for the long term.
However, healthy life expectancy does not give insight into specific health effects, effects of specific policy interventions, or trends in certain subgroups.
Monetary valuation
Another approach to health impact assessment is monetary valuation. In this measure, money is used as a unit to express health loss or gain, thereby facilitating the comparison of policy costs and benefits. It can help policy makers in allocating limited (health care) resources and setting priorities. There are different approaches to monetary valuation:
The cost of illness (COI) approach estimates the material costs related to mortality and morbidity. Costs for the whole society are included and it considers loss of income,
productivity and medical costs. Immaterial costs, such as impact of disability (pain, fear) or decrease in quality of life, are not included. Therefore, this could lead to an underestimation of the health costs. Furthermore, individual preferences are not considered.
The willingness to pay (WTP) approach measures how much money one would be willing to pay for improvement of a certain health state or for a reduction in health risk. The willingness
to accept (WTA) approach measures how much money one wants to receive to accept an
increased risk. WTP and WTA can be estimated by observing the individual’s behavior and expenditures on related goods (revealed preference). For example, the extra amount of money people are willing to pay for safer or healthier products (e.g. cars with air bags), or the extra salary they accept for compensation of a risky occupation (De Hollander, 2004).
Another similar method is contingent valuation (CV), in which people are asked directly how much money they would be willing to pay (under hypothetical circumstances) for obtaining a certain benefit (e.g. clean air or good health). Advantages of these approaches are that the values represent individual preferences and include certain indefinable costs (e.g. pain, quality of life). The values also appear to be fairly stable in Western countries (De Hollander, 2004). A disadvantage is that the values are restricted to individual costs. Social costs are not incorporated. The reliability of the answers obtained in contingent valuation studies can be discussed, as people are spending ‘hypothetical’ money for ‘hypothetical’ health benefits. In addition, willingness-to-pay values have shown to be dependent on income.
Results of monetary valuation of health problems provide policy makers with crude estimations of the costs and benefits associated with certain policy decisions.
However, expressing health in terms of money is complicated and many uncertainties are involved.
Attributable burden of disease
Health impact assessments can also be executed by calculating the attributable burden of disease. The burden of disease attributable to an (environmental) factor can be expressed in QALYs and DALYs. Quality Adjusted Life Years, QALY, combines both the quality and
quantity elements of health in one indicator. Essentially, time spent in ill health (measured in years) is multiplied by a weight measuring the relative (un)desirability of the illness state. Thereby a number is obtained which represents the equivalent number of expected life years in full health. QALYs are commonly used for cost-utility analysis and to appraise different forms of health care. To do that, QALYs combine life years gained as a result of these health interventions/health care programs with a judgment about the quality of these gained life years.
Disability Adjusted Life Years, DALY, also combines information on quality and quantity of life in one indicator. However, contrary to QALYs, DALYs give an indication of the
(potential) number of healthy life years lost due to premature mortality or morbidity. The DALYs are estimated for particular diseases, instead of a health state. Morbidity is weighted for the severity of the disorder. The concept was first introduced by Murray and Lopez (1996) as part of the Global Burden of Disease study, which was launched by the World Bank. Since then, the World Health Organization has endorsed the procedure, and the DALY approach has been used in various studies on a global, national and regional level.
With QALY, the focus is on assessing individual preference for different non-fatal health outcomes that might result from a specific intervention, whereas the DALY was developed primarily to compare relative burdens among different diseases and among different populations (Morrow and Bryant, 1995).
DALYs are suitable for analyzing particular disorders or specific factors that influence health.
Problems associated with the DALY approach include the difficulty of estimating the duration of the effects (which have hardly been studied) and the severity of a disease; and allowing for combined effects in the same individual (first you have symptoms, then you go to a hospital and then you may die). Therefore, there are still many disadvantages involved in these kinds of calculations, since very complex information has to be reduced to one single value.
The results should therefore be handled with care, but can be very useful with proper explanation and clear description of the uncertainties involved.
2.3.2 MEI
VGZbased on DALY evaluation
For the MEIVGZ, the health effects in relation to a calculated concentrations in ambient air will
be quantified as the population loss of healthy life years expressed in DALYs. Health effects from air pollution comprize de development of different carcinoma, aggravation of asthma, and even premature mortality. This depends on the extent of exposure and the substances to which people are exposed. Because of the divergence in magnitude, duration and severity of these health effects, the DALY method that converts all effects to a comparable unit can be very useful for the interpretation and comparison of different (environmental) health
problems. This is especially useful for evaluating and comparing different policy options and assessing cost effectiveness of mitigating measures or prevention.
Interpretation of the MEIVGZ
Experience with integrated health measures in environmental health decision-making is limited to the use of monetary cost estimates of health impacts, the Years of Life Lost (YLL) due to mortality and the total amount of healthy life lost expressed in Disability Adjusted Life Years (DALYs). The MEIVGZ will be expressed in terms of the integrated health measure
DALY. Because of the uncertainties, it should be noted that the MEIVGZ should be used as a
relative measure for policy evaluation and priority setting only, and not as an absolute quantification of the health burden.
3.
Technical description of data and methods
3.1
Available emission data
For a limited set of the priority pollutants specified in the Netherlands, total emission data for the Netherlands were available for the years 1990, 1995, 2002 and 2003. For these years, the emissions of single chemicals and groups of chemicals (summary emissions) to air, water and soil were separately quantified (Alkemade et al., 2006). Summary emission data are available for groups of compounds that are identified as: Chlorobenzenes, Poly Chlorinated Biphenyls (PCB), Phenols, Polycyclic Aromatic Hydrocarbons (PAH), Chlorophenols, Poly Chlorinated Dioxins and Dibenzufuranes (PCDB), and Phtalate esters. For most emissions of
contaminants specified as a summary emissions, the total emission for the group was attributed to each of the individual chemicals belonging to that group of chemicals. After calculation of the environmental concentrations and the estimation of risk, the worst case mixture was considered to be fully represented by the single compound with the highest calculated risk (see Annex 4). Another approach was chosen for the emission of the
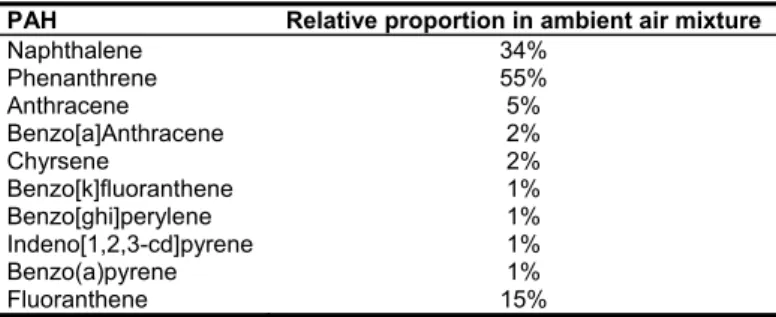
unspecified group of PAH compounds The emissions of 10 individual PAH substances were divided based on the distribution of measured air concentrations in the Netherlands
(Buijsman, 1999). This was done because all individual PAH compounds contributed considerably to the overall MEIECO. The average distribution of individual PAH constituents
measured in air is given in Table 2, where for Benzo(a)pyrene and Fluoranthene separate emission estimates are available.
The group of phtalate esters was considered to be solely composed of Di-(2-ethylhexyl) phthalate, because this compound constitutes approximately 80% of all phtalate esters used (personal communication J. Struijs, RIVM, LER). The different approaches for the treatment of emission data for groups of pollutants is summarized in Table 3.
Table 2 Average relative proportion of 10 individual PAH compounds in air in the Netherlands.
PAH Relative proportion in ambient air mixture
Naphthalene 34% Phenanthrene 55% Anthracene 5% Benzo[a]Anthracene 2% Chyrsene 2% Benzo[k]fluoranthene 1% Benzo[ghi]perylene 1% Indeno[1,2,3-cd]pyrene 1% Benzo(a)pyrene 1% Fluoranthene 15%
Table 3 Different methods of representation for grouped pollutant emissions.
Group of pollutants Method of representation Compound selected Chlorobenzenes Entire group emission attributed to compound with highest risk (PAF) 1,2-Dichlorobenzene Poly Chlorinated Biphenyls (PCB) Entire group emission attributed to compound with highest risk (PAF) PCB-153
Phenols Phenol is only compound in database Phenol Polycyclic Aromatic Hydrocarbons
(PAH) All divided according to measured concentration in air 10 different PAH compounds Chlorophenols Entire group emission attributed to compound with highest risk (PAF) 2,3,4,6-Tetrachlorophenol Poly Chlorinated Dioxins and
Dibenzufuranes (PCDB) Entire group emission attributed to compound with highest risk (PAF) 2,3,4,7,8-Pentachlorodibenzofurane Phtalate esters Entire group emission attributed to compound that constitutes approx. 80% of phtalate use Di-(2-ethylhexyl) phthalate
The emission data that are used for SimpleBox modeling (see paragraph 3.2.1) are summarized in Annex 1, where the summary emissions for the groups of compound are separated by bold horizontal lines. These data are derived from Alkemade et al. (2006). The spatially explicit (gridcell) emissions in the Netherlands and in Europe of primary and secondary particulate matter up to 10 micrometers in size (PM10, NOx, SOx, NH3) and
compounds that act in the formation of ozone (Non-Methane Volatile Organic Compounds (NMVOC) and NOx) were obtained from ‘The Netherlands Environmental Assessment
Agency’ (MNP). The emission files for NMVOC, NOx, SOx and NH3 reflect the 2003 EMEP
‘expert emissions’ (http://webdab.emep.int/). The PM10-file contains the 1995 CEPMEIP
(Co-ordinated European Programme on Particulate Matter Emission Inventories, Projections and Guidance) data.
3.2
Calculation of environmental concentrations from
emission data
Three models were used for the calculation of environmental concentrations in surface water and air from priority pollutant emission data.
1. For well defined organic and inorganic contaminants that are emitted as single compounds or mixtures, the model SimpleBox 3.23 is used to calculated the steady state environmental concentrations in water and air.
2. For the generation and distribution of fine particulate material in air from emissions of PM10 and the presence of NOx, SOx and NH3, the spatial-explicit linear model OPS is
used. PM10 concentrations are calculated for 1990, 1995 and 2003.
3. For the generation and distribution of ozone in air from the emission of NMVOC and NOx the spatial explicit non-linear model LOTOS-EUROS is used. For reasons of
feasibility, the change of the ozone concentration as a result of a hypothetical 100% reduction of respectively NMVOC and NOx has been calculated for the year 2000
only.
3.2.1 SimpleBox model
SimpleBox was created as a research tool in environmental risk assessment. SimpleBox (Brandes et al., 1996) is implemented in the regulatory EU model EUSES (Vermeire et al., 1997) that is used for risk assessment of new and existing chemicals. Dedicated SimpleBox applications have been used for the derivation of integrated environmental quality criteria for air, water, and soil in the Netherlands. Spreadsheet versions of SimpleBox are used for multi media chemical fate modeling by scientists at universities and research institutes in various countries. SimpleBox predicts equilibrium exposure concentrations in various environmental media, assuming steady-state concentrations that result from a long term constant emission. SimpleBox is a multimedia mass balance model of the so-called Mackay type. It represents the environment as a series of well-mixed boxes of air, water, sediment, soil, and vegetation (compartments). Calculations start with user-specified emission fluxes into the compartments (obtained from paragraph 3.1). Intermedia mass transfer fluxes and degradation fluxes are calculated by the model on the basis of user-specified mass transfer coefficients and
degradation rate constants. The model performs a simultaneous mass balance calculation for all the compartments, and produces steady-state concentrations in the compartments as output. SimpleBox defines three partially nested spatial scales: a regional and continental scale nested in a temperate northern hemisphere scale, plus tropical and arctic northern
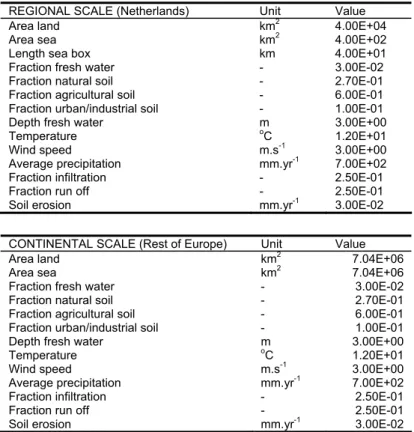
hemisphere scales. Applicability is limited to environmental situations where spatial differences in concentrations within compartments or boxes are negligible or unimportant. The model is fully described in publicly available RIVM-reports (Van de Meent, 1993; Brandes et al., 1996; Bakker et al., 2003). Advantages and limitations of multimedia fate models are described and evaluated in a SETAC publication (Cowan et al., 1995). The SimpleBox model was defined to represent the Netherlands on the regional scale. In order to account for emissions in the remaining part of Europe, 1/3 of the Dutch emissions per unit area were assumed to be emitted in the rest of Europe on the continental scale (personal communication D. van de Meent). Both the dimensions of the regional scale (Netherlands) and the continental scale (rest of Europe) are given in Table 4.
Table 4 Modeling dimensions of the SimpleBox model applied to calculate the concentrations in water and air in the Netherlands.
REGIONAL SCALE (Netherlands) Unit Value
Area land km2 4.00E+04
Area sea km2 4.00E+02
Length sea box km 4.00E+01 Fraction fresh water - 3.00E-02 Fraction natural soil - 2.70E-01 Fraction agricultural soil - 6.00E-01 Fraction urban/industrial soil - 1.00E-01 Depth fresh water m 3.00E+00
Temperature oC 1.20E+01
Wind speed m.s-1 3.00E+00 Average precipitation mm.yr-1 7.00E+02 Fraction infiltration - 2.50E-01 Fraction run off - 2.50E-01 Soil erosion mm.yr-1 3.00E-02 CONTINENTAL SCALE (Rest of Europe) Unit Value
Area land km2 7.04E+06
Area sea km2 7.04E+06
Fraction fresh water - 3.00E-02 Fraction natural soil - 2.70E-01 Fraction agricultural soil - 6.00E-01 Fraction urban/industrial soil - 1.00E-01 Depth fresh water m 3.00E+00
Temperature oC 1.20E+01
Wind speed m.s-1 3.00E+00 Average precipitation mm.yr-1 7.00E+02 Fraction infiltration - 2.50E-01 Fraction run off - 2.50E-01 Soil erosion mm.yr-1 3.00E-02
In order to calculate the steady state concentrations in the Netherlands for the different priority pollutants, the model requires estimates of physico-chemical compound properties. The model also requires degradation constants and ecotoxicity data for the ecological risk calculation. Estimated values for these types of input data are given in Annexes 2 and 3, respectively.
To single out the contribution of the emissions in the Netherlands to the environmental concentrations in water and air in the Netherlands, two SimpleBox calculations have been conducted:
1. The concentrations in the Netherlands are calculated as a result of the emissions both in Europe and in the Netherlands.
2. The concentrations in the Netherlands are calculated as a result of the emissions in Europe only.
This approach allows for a separation of the added effects of the emissions in the Netherlands in a later stage of the MEI calculations.
3.2.2 OPS model
For the purpose of the PM10 modeling OPS-Pro 4.1, the latest version of the Operational
Priority Substances (OPS) model was used. OPS is a model that simulates the atmospheric process sequence of emission, dispersion, transport, chemical conversion and finally deposition. The model is originally designed to calculate the deposition of acidifying compounds for the Netherlands as a whole using a high spatial resolution. The model is, however, set up as a universal framework supporting the modeling of other pollutants such as fine particles and persistent organic pollutants (Van Jaarsveld, 2004).
From the emissions, the concentrations of the secondary components nitrate, sulphate, and ammonium were modeled. The 1990 and 2003 PM10-results were obtained by multiplying the
model results (1995) by a conversion factor that reflects the difference in emission quantity per country and sector between 1995 and the years of interest. The typical concentration of the various PM10 species in the Netherlands was reflected by a weighted concentration
average over the Dutch grid cells. Weights of the grids are based on population density numbers.
Similar to the SimpleBox calculation, the OPS model has been run twice with different input emissions (1 - Europe including the Netherlands, and 2 – Europe without the Netherlands) in order to estimate the PM10 concentrations that would result from the emissions in the
Netherlands only.
3.2.3 LOTOS/EUROS model
The regional chemistry transport model LOTOS-EUROS was used to calculate ozone formation in air due to emissions of NOx and NMVOC (Schaap et al., 2005; Schaap et al.,
2006). LOTOS-EUROS is a combination of the models LOng Term Ozone Simulation
(LOTOS) and EURopean Operational Smog (EUROS) and is used to calculate dispersion and chemical transformation of air pollutants in the lower troposphere over Europe. It extends in vertical direction to about 3.5 km above sea level, following the dynamic mixing layer approach. LOTOS-EUROS is a dynamic model and the main prognostic equation is the continuity equation that describes the change in time of the concentration of a component as a result of transport and diffusion, chemistry, dry and wet deposition, emission and
entrainment. Europe was divided in 25x25 km grids. To calculate ozone over Europe a gas phase chemistry scheme is used, describing photochemistry. Meteorological data of 1997 were used and emission data of the year 2000.
For reasons of feasibility, the change of the ozone concentration as a result of a reduction of respectively NMVOC and NOx has been calculated for the year 2000 only. We calculated the
pollutant-specific influence on O3 by reducing the emissions in the Netherlands of
respectively NOx and NMVOC with a hypothetical 100%. To get an indication of the
presumed non-linearity in the concentration-emission relationship of O3 and respectively NOx
and NMVOC, we investigated whether 4 times a 25% reduction of emissions gives the same change in O3 concentrations as a 100% emission reduction.
Similar to the SimpleBox and the OPS calculations, the LOTOS-EUROS estimates required multiple model runs with variable emissions in the Netherlands and constant emissions in the rest of Europe.
3.3
Available data on measured concentrations
3.3.1 Water
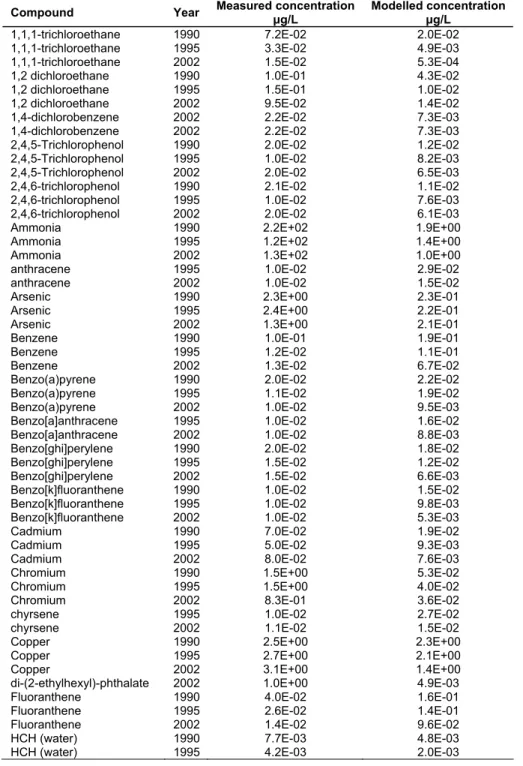
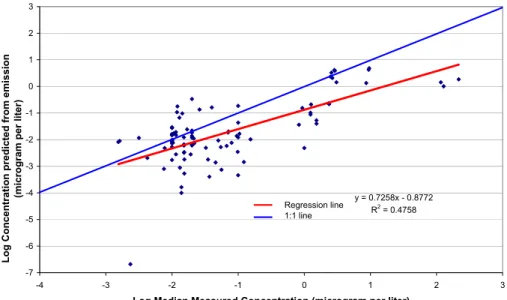
From the WaterStat application of the Netherlands Ministry of Transport, Public Works and Water Management available on the internet (http://www.waterstat.nl/), the median
concentrations of the substances for which emission data were available were retrieved for all available fresh water stations in the Netherlands for the years 1990, 1995 and 2002. A nation-wide median concentration was calculated per year by taking the geometrical average over the stations. To validate the modelled water concentrations, the median measured water concentrations were statistically compared to the water concentrations predicted from emissions in the Netherlands in combination with the emissions estimated for Europe.
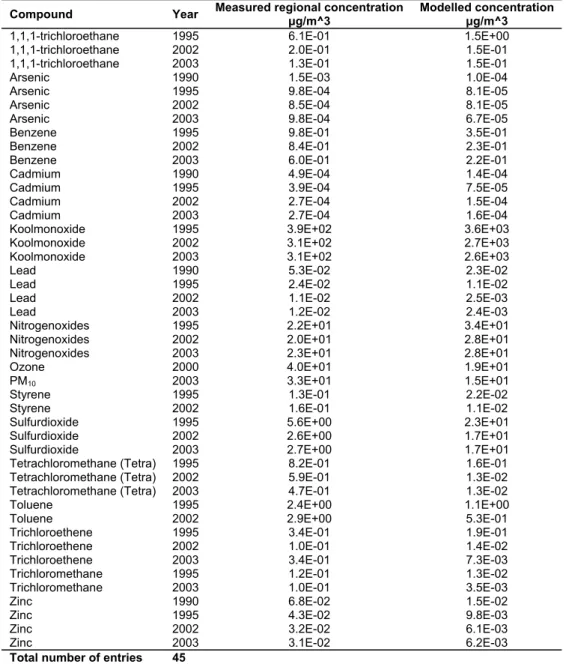
3.3.2 Air
Measured air concentration data for the years 1990, 1995, 2002 and 2003 were likewise retrieved from the website of the National Air Quality Monitoring Network (Landelijk Meetnet Luchtkwaliteit - LML) (http://www.lml.rivm.nl/data_val/index.html) operated by RIVM. To validate the modelled air concentrations, the average measured air concentrations of emitted substances were also statistically compared with the air concentrations predicted from the emissions in the Netherlands in combination with the emissions estimated for Europe.
3.4
Calculation procedure for MEI
ECOThe procedure to derive MEIECO boils down to the following.
3.4.1 SSD and mixture toxicity
For the MEIECO the risk of individual priority pollutants is calculated with the log-normal
SSD. The log-normal SSD curve is fully characterized by the mu (μ), or log transformed toxicity endpoint concentrations averaged over species and the sigma (σ), or the standard deviation of the same data. Both moments of the log-normal SSD for the selected priority pollutants based on chronic No Observed Effect Concentrations (NOEC) are given in Annex 3.
For each of the priority pollutant(i) concentrations (Concentrationi) in the Netherlands
surface waters, calculated by SimpleBox, the exposure concentration is recalculated to Hazard Units by dividing this concentration by the exponentiated μi value:
10
i i i ion Concentrat HU = μThe HUi values are added for substances with corresponding TMoAi and corresponding slope
(σi):
∑
= i i TmoA HU HUThe log-normal CA model gives the toxic risk for mixture constituents with the same TMoA by applying the Microsoft Excel function:
(
)
(
log HU ,0, ,1)
NORMDIST
msPAF 10 TMoA
The combination effect for compounds with different modes of action is calculated analogous to the probability of two non-excluding processes (Hewlett and Plackett, 1979). For the present use in SSDs, it is assumed that sensitivities are uncorrelated in RA. For more than two chemicals or groups of chemicals with different TMoA, this leads to:
) msPAF 1 ( 1 msPAF TMoA TMoA Overall = −
∏
−3.4.2 MEI
ECObased on species loss
Generally, ecosystem risk is conservatively expressed as the proportion of species for which the chronic NOEC is exceeded. The exceedance of no effect concentrations is not a straight-forward indication for the loss of species. The loss of species is generally corresponding to concentrations that are an order of magnitude higher. As has been demonstrated in Posthuma and De Zwart (2006), the actual loss of species is more closely related to the SSD risk calculation based on acute median lethal concentrations (LC50). Therefore, the final MEIECO
calculations are founded on LC50 SSD curves that are right shifted from the NOEC based
curves by a factor of 10 (log 10 = 1, μacute LC50 = μchronic NOEC + 1) on the concentration axis
(De Zwart, 2002).
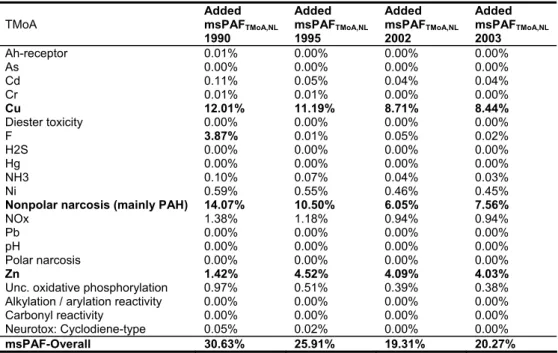
3.4.3 Separation of MEI
ECOfor Dutch emissions
The previous toxic risk calculations for freshwater organisms produce two sets of toxic risk estimates in the Netherlands for the emissions of Europe alone and the combined emissions of Europe and the Netherlands. The risk estimates for individual TMoA (msPAFTMoA) of these
two sets are called msPAFTMoA, Eur-NL and msPAFTMoA, Eur+NL. The risk of individual TMoA
added by the Dutch emissions (Added msPAFTMoA,NL) is defined as (Klepper et al., 1999):
(
TMoA,Eur NL TMoA,Eur NL) (
TMoA,Eur NL)
NL ,
TMoA msPAF msPAF / msPAF
msPAF
Added = + − − 1− −
The Added msPAFTMoA,NL values for different TMoA are again combined to form the MEIECO
according to: ) msPAF Added ( MEI TMoA NL , TMoA eco =1−
∏
1−With this calculation, the MEIECO expresses the proportion of species that is exposed to a
concentration higher than the endpoint effect level as a result of the combined emissions in the Netherlands only. Due to the emissions in Europe, the actual proportion of species suffering effects will be higher.
3.5
Calculation procedure for MEI
VGZ3.5.1 MEI
VGZand DALY formulae
The public health indicator for priority air pollutants MEIVGZ is calculated as follows:
∑∑
× = x e e e x VGZ AB DALY MEI ,MEIVGZ: Indicator for Human Health Effects due to emission of all substances evaluated
(years lost per year of exposure).
ABx,e: Population Attributable Burden of getting disease type e due to exposure to a
substance x (per year of exposure).
Attributable burden of disease
The attributable burden of disease can be calculated based on relative risks for PM10 and
ozone and based on unit risk factors for carcinogenic substances. PM10 and ozone
The attributable burden of disease is calculated based on relative risks for PM10 and ozone as
follows (based on Knol and Staatsen, 2005; De Hollander et al., 1999):
pop e inc e x x e x e e x F F N RR RR AB ⎟⎟× × × ⎠ ⎞ ⎜ ⎜ ⎝ ⎛ − = ' exp, , , , ' , , 1
(
)
(
, 1)
1 ' ,x = xe − × x + e RR C RRABx,e: Population Attributable Burden of getting disease type e due to exposure to a
substance x per year of exposure (per year of exposure). Finc,e: Incidence Fraction of the population for disease type e (-).
Fexp,x,e: Fraction of the population exposed to substance x and that can get disease type e
(-).
Npop: Number of persons living in the Netherlands (-).
RR’x,e: Adjusted Relative Risk to get disease type e after exposure to substance x (per
year of exposure).
RRx,e: Relative Risk to get disease type e after exposure to substance x (per µg/m3 per
year of exposure).
Cx: Concentration of substance x (mg/m3).
Carcinogenic substances
The attributable burden of disease is calculated based on unit risk factors of carcinogenic substances as follows: pop e x x x e x C F N ALE UR AB , = × × exp, , ×
ABx,e: Population Attributable Burden of getting disease type e due to exposure to a
substance x per year of exposure (per year of exposure).
URx: Unit Risk factor of substance x: cancer risk estimate for lifetime exposure to a
concentration of 1 µg/m3 of substance x (m3/μg). ALE: Average Life Expectancy (year)
Cx: Concentration of substance x (μg/m3).
Fexp,x,e: Fraction of the population exposed to substance x and that can get disease type e
(-).
Npop: the number of persons living in the Netherlands (-).
DALYs
The health burden, expressed in DALYs is calculated as follows (Murray and Lopez, 1996):
∑
+ = e e e e YLL YLD DALY e e e D w YLD = ×DALYe: Disability Adjusted Life Years, lost due to getting disease type e (years).
YLDe: Years of life disabled due to disease type e per incidence case (years).
YLLe: Years of life lost due to disease type e per incidence case (years).
De: Duration of disease type e (years).
3.5.2 Data selection
Evaluation over time
The impact of emissions of air pollutants is evaluated for the years 1990, 1995, 2002 and 2003. Next to the modelled air concentrations, other parameters are also of influence on the quantification of indicator MEIVGZ. To rule out these influences, typical values have been set
for all parameters other than emission:
The exposed population is the Dutch population. The population number alters over time and consequently will the number of people affected and the MEIVGZ. To rule out
the influence of the alterations in population number, it is set to a typical value of 15 864 000, the population number for the year 2000 (CBS, 2006).
The fraction of the population exposed is set to 1, assuming exposure of the total population to the concentrations in the air.
The incidence fraction is the fraction of the population that develops a specific
disease. The incidence fractions alter over time and consequently will the MEIVGZ. To
rule out the influence of the alterations in incidence fractions, they are set to the values for the year 2000 based on Knol and Staatsen (2005), see Table 5.
The duration and severity of a disease dependent on the treatments and with advancing medical science the weighting factors for severity and the duration may differ per year. Therefore the values of Knol and Staatsen (2005) and De Hollander et al. (1999) are used, see Table 5 and Table 6.
The average life expectancy has increased over time. To rule out the influence of increased life expectancy, the average life expectancy is set to 80 years.
Chemical selection
In 1988 a list of 50 priority substances is drawn up in the first National Environmental Policy Plan. The substances on this list implied a risk for the public and/or environmental health. In 2004 this list was supplemented with 162 substances. The list of priority substances is the starting point of this study. For a limited set of the priority pollutants specified in the Netherlands, emission data were available for the years 1990, 1995, 2002 and 2003 (Annex 1). For these years, the emissions of single chemicals and pollutant groups to air, water and soil were separately quantified (Alkemade et al., 2006).
For only a very limited set of priority substances there is data available on emissions as well as on potency as well as on health burden.
Data on potency of pollutants
For a very limited set of priority substances there was epidemiological data available on relative risks and unit risk factors.
PM10 and ozone
We used epidemiological data on relative risks for air pollutants PM10 and ozone as given by
Knol and Staatsen (2005). They investigated the effects of PM10 and ozone on the health of
the Dutch population. PM10 can be regarded as an indicator of a more complex mixture of
urban air pollutants. For the effects of short-term PM10 exposure, health effects taken into
account include mortality (total and subdivided in cardiovascular and respiratory mortality, including Chronic Obstructive Pulmonary Diseases (COPD), and hospital admissions for cardiovascular and respiratory disease (total and separately for COPD and asthma). Time spent outside the hospital while still suffering from the disease or disability is not included in our DALY outcomes due to lack of data. For long-term PM10 exposure, they analyzed total
mortality. The health effects of short-term ozone exposure that they considered are mortality (total and subdivided in cardiovascular mortality). The contribution of other health effects of exposure to ozone, like hospital admission for cardiovascular disease, respiratory disease, COPD and asthma was not statistically significant and therefore not considered here. We considered health effects from primary PM10, secondary aerosols NH4+, NO3- and SO4
2-and secondary ozone. The secondary aerosols are formed from emissions of NH3, NOx and
SO2. Ozone is formed from emissions of NOx and NMVOC.
The incidence fractions on hospital admission for 2000 are based on Knol and Staatsen (2005). The incidence fractions on mortality for 2000 are based on statistics from CBS (2006). The incidence fractions and relative risks are listed in Table 5.
Carcinogenic substances
For carcinogenic substances we used unit risk factors. The unit risk estimate for an air pollutant is defined as ‘the additional lifetime cancer risk occurring in a hypothetical population in which all individuals are exposed continuously from birth throughout their lifetimes to a concentration of 1 μg/m3 of the agent in the air they breathe’ (WHO, 2001). The unit risk factors are used from the Air Quality Guidelines for Europe 2000 of the World Health Organization (2001) or the IRIS database of the USEPA (2006). If both databases reported different air unit risk factors for the same agent, preference was given to the WHO unit risk factors. The available unit risk factors for priority substances used are listed in Table 6.
For chromium the unit risk factor is available for hexavalent chromium, whereas the air concentrations are calculated for total chromium. Mennen et al. (1998) measured chromium concentrations at a regional site in Bilthoven in the Netherlands. They found that the ratio of Cr VI to total Cr did not exceed 8% and the average value was at most 5%, which they state is probably an overestimate. These results agree with the theoretical predictions of Seigneur and Constantinou (1996). Therefore to estimate the MEIVGZ for chromium, we assumed a ratio of
Cr VI to total Cr of 5%.
Selection of critical endpoints
For every substance we selected one critical endpoint, although substances may cause a variety of disease. If no human endpoint was mentioned with the unit risk factor, we chose the corresponding endpoint of the animal studies. It is obvious that the list of endpoints is not comprehensive, and it might be criticized that it reflects what is quantifiable rather than what is relevant for decision making. Although this is true in principal, we strongly believe that the underlying epidemiological studies have addressed health endpoints that are of direct social concern. So, we suggest as a pragmatic approach to assume that the list of morbidity
endpoints is incomplete, but provides a reasonable approximation of the most important effects known today which are of direct social concern (as listed by Krewitt et al., 2002). Data on health burden
We used data on weighting factors for the Netherlands on severity and duration for air
pollutants PM10 and ozone as given by Knol and Staatsen (2005). For that exercise, they used
the weighting factors as used by the Department of Public Health Status and Forecasting (RIVM, 2004), the background report for the Public Health Status and Forecast 1997 (Melse and Kramers, 1998), and the Global Burden of Disease study (Murray and Lopez, 1996). If severity weights were not available from the abovementioned sources they used weights from De Hollander et al. (1999). We used data on weighting factors for the Netherlands on severity and duration for carcinogenic substances as given by De Hollander et al. (1999). When there is no data on the weighting factors for a substance but it causes the same disease type as other
substances, we used the same weighting factors for severity and duration. For chloroform and formaldehyde there were no data available on weighting factors neither for bladder cancer nor for nose and throat cancer in the Netherlands. Therefore we used weighting factors for the Established Market Economies (EME) from the Global Burden of Disease study (Murray and Lopez, 1996). The weighting factors are presented in Table 5 and Table 6.
Table 5 Health outcomes, relative risks, incidence fractions and weighting factors for PM10 and ozone (Knol and Staatsen, 2005)
Substance CAS-nr. Health outcome Relative risk per mg/m3 (95%CI) Incidence fraction YLL D w
PM10 - Total mortality long term 1.0043 (1.0026 – 1.0061) 8.9E-03 10 Total mortality
short term
1.00036
(1.00025 – 1.00046) 8.9E-03 0.25 Respiratory disease mortality
(short term)
1.00114
(1.00084 – 1.00157) 9.3E-04 0.25 Cardiovascular disease
mortality (short term)
1.00025
(1.00009 – 1.00041) 3.1E-03 0.25 COPD mortality (short term) 1.00106 (1.00062 – 1.00150) 4.2E-04 0.25 Hospital admission: respiratory 1.00047 (1.00025 – 1.00067) 3.1E-03 0.038 0.64 Hospital admission:
cardiovascular
1.00032
(1.00019 – 1.00044) 5.3E-03 0.038 0.71 Hospital admission: COPD 1.00084 (1.00053 – 1.00115) 1.3E-03 0.038 0.53 Ozone 10028-15-6 Mortality (total) 1.00026 (1.00016 – 1.00038) 8.9E-03 0.25
Cardiovascular disease
mortality (short term) 1.00021 (1.00002 – 1.00040) 3.1E-03 0.25
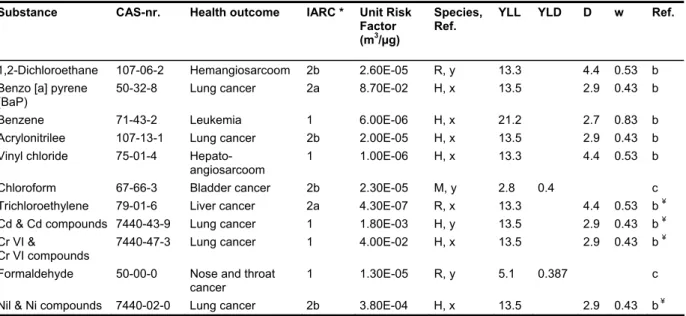
Table 6 Health outcomes, IARC Classifications, unit risk factors and weighting factors for carcinogenic substances
Substance CAS-nr. Health outcome IARC * Unit Risk Factor (m3/µg)
Species, Ref.
YLL YLD D w Ref.
1,2-Dichloroethane 107-06-2 Hemangiosarcoom 2b 2.60E-05 R, y 13.3 4.4 0.53 b Benzo [a] pyrene
(BaP) 50-32-8 Lung cancer 2a 8.70E-02 H, x 13.5 2.9 0.43 b
Benzene 71-43-2 Leukemia 1 6.00E-06 H, x 21.2 2.7 0.83 b Acrylonitrilee 107-13-1 Lung cancer 2b 2.00E-05 H, x 13.5 2.9 0.43 b Vinyl chloride 75-01-4
Hepato-angiosarcoom
1 1.00E-06 H, x 13.3 4.4 0.53 b Chloroform 67-66-3 Bladder cancer 2b 2.30E-05 M, y 2.8 0.4 c Trichloroethylene 79-01-6 Liver cancer 2a 4.30E-07 R, x 13.3 4.4 0.53 b ¥
Cd & Cd compounds 7440-43-9 Lung cancer 1 1.80E-03 H, y 13.5 2.9 0.43 b ¥ Cr VI &
Cr VI compounds
7440-47-3 Lung cancer 1 4.00E-02 H, x 13.5 2.9 0.43 b ¥ Formaldehyde 50-00-0 Nose and throat
cancer
1 1.30E-05 R, y 5.1 0.387 c Nil & Ni compounds 7440-02-0 Lung cancer 2b 3.80E-04 H, x 13.5 2.9 0.43 b ¥
* IARC classification: group 1: carcinogenic to humans; group 2a: probably carcinogenic to humans; group 2b: possibly carcinogenic to humans; H=human; R=rat; M=mouse; x) Air Quality Guidelines (WHO, 2001); y) IRIS- database ;. a) Knol and Staatsen, (2005); b) De Hollander et al., (1999); c) Murray and Lopez, (1996), for EME; ¥ Adopted from other substance with same disease type.