Survey analysis of microbial
contamination of fresh produce
and ready-to-eat mixed salads
Report 330371002/2008RIVM Report 330371002/2008
Survey analysis of microbial contamination of fresh
produce and ready-to-eat salads, and the associated risk
to consumers in the Netherlands
A. Pielaat, Laboratory for Zoonoses and Environmental Microbiology L.M. Wijnands, Laboratory for Zoonoses and Environmental Microbiology I. Fitz-James, Food and Consumer Product Safety Authority, region South F.M. van Leusden, Laboratory for Zoonoses and Environmental Microbiology Contact:
A. Pielaat
Laboratory for Zoonoses and Environmental Microbiology annemarie.pielaat@rivm.nl
This investigation has been performed by order and for the account of Food and Consumer Product Safety Authority, within the framework of programme 9, knowledge question 2.6 B
© RIVM 2008
Parts of this publication may be reproduced, provided acknowledgement is given to the 'National Institute for Public Health and the Environment', along with the title and year of publication.
Abstract
Survey analysis of the microbial contamination of fresh produce and ready to-eat mixed salads and the associated relative risk to consumers in the Netherlands
The risk of ready-to-eat mixed salads in Dutch supermarkets being contaminated with the bacteria Campylobacter, Salmonella, Escherichia (E.) coli O 157 and Listeria monocytogenes is slight, less than 0.26 percent. It has been estimated that approximately 22 persons fall ill each year from Campylobacter infection following consumption of these products. This is a fraction of the number of people who fall ill from Campylobacter following the consumption of poultry (about 12,000 per year).
This information has been revealed in a survey conducted by the National Institute for Public Health and the Environment (RIVM) and the Food and Consumer Product Safety Authority (VWA). In this survey, the risk for contamination in the whole production chain of these mixed salads was studied. The ingredients for these mixed salad products were produced mainly in the Netherlands.
The survey included 4,180 samples. The unprocessed produce and ready-to-eat mixed salads were examined for the presence (qualitative and quantitative) of the above-mentioned pathogens at fixed places in the production chain. In addition, the risk of illness from eating these products was calculated. On this point, the main uncertainty relates to a lack of dose response data – in other words, what is the number of bacteria needed before people actually become ill?
Key words:
Rapport in het kort
Analyse van onderzoek naar de microbiële besmetting van onbewerkte groente en kant en klare gemengde salades, en de daarmee samenhangende risico’s voor de Nederlandse consument De kans dat voorverpakte gemengde salades uit Nederlandse supermarkten de bacterie Campylobacter, Salmonella, E. coli O157 of Listeria monocytogenes bevatten is gering (minder dan 0,26 procent). Geschat is dat per jaar circa 22 mensen ziek worden door Campylobacter na het eten van deze
producten. Dit is een fractie van het geschatte aantal mensen die ziek worden van Campylobacter nadat zij kip hebben gegeten (circa 12000 per jaar).
Dit blijkt uit onderzoek van het RIVM en de Voedsel en Waren Autoriteit (VWA). Hierin is de kans onderzocht dat deze salades in de gehele productieketen van deze groenten tot het moment dat ze worden geconsumeerd met deze bacteriën besmet raken. De ingrediënten van deze salades zijn hoofdzakelijk in Nederland geteeld en verwerkt.
Het onderzoek omvat 4180 monsters. Op bepaalde plaatsen in de productieketen is gekeken naar de mate waarin ziekteverwekkende micro-organismen in de producten en grondstoffen voorkomen.
Daarnaast is gekeken naar de kans om ziek te worden door deze producten te eten. De belangrijkste bron van onzekerheid hierbij blijft de vraag bij hoeveel bacteriën een mens ziek wordt.
Trefwoorden:
Contents
Summary 6
1 Introduction 7
2 Sample design 9
2.1 Sampling sites in the production chain 9
2.2 Selected produce / product combinations 9
2.3 Number of samples 10
2.4 The sampling process 13
3 Sample analysis 14
4 Results 16
4.1 Prevalence estimation 16
4.2 Microbiological Risk Assessment 19
4.2.1 Application of the sQMRA Tool 23
5 Conclusions and discussion 29
Acknowledgement 32 References 33
Summary
A survey was performed from October 2006 till October 2007 to get insight in the microbial
contamination of fresh produce for raw consumption in the Netherlands. From a tracing and tracking perspective it was decided to sample both the produce (separate raw vegetables) and products (ready-to-eat mixed salads) from two large vegetable processing companies in the Netherlands. Produce (n = 1900) was sampled at the distribution hall of these companies from where any (positive) sample could be traced back to a specific Dutch, or EU, primary production site. Products were sampled at two sites further down the production chain for tracking purposes (i.e. in following the dynamics of microbes throughout the chain), namely at the packing stage in the processing companies (n = 780) on the same day as the produce was sampled to assess the effect of “food handling”, and, in the retail (n = 1500) to assess any further distribution effects. The pathogens of concern were Campylobacter spp., Salmonella spp., E. coli O157 and Listeria monocytogenes.
In raw produce Campylobacter spp. were detected in three samples, Salmonella spp. in six samples, E. coli O157 in one sample and Listeria monocytogenes also in one sample. The pathogens of concern were not detected in any of the samples taken at the packing stage in the processing companies. At retail level one sample was found positive for Salmonella spp.
Positive samples were further quantified following Most Probable Number (MPN) in order to obtain an initial public health estimate. That is: the MPN for Campylobacter spp. was in the range of 0.025 –
0.096 colony forming units (cfu) g-1, Salmonella spp. was found in the range of 0.019 - >0.281 cfu g-1,
E. coli O157 was estimated at 0.052 cfu g-1 and Listeria monocytogenes at 250 cfu g-1.
A sQMRA model was used to calculated the point estimate for the number of ill people associated with the pathogens of concern in mixed salads.
Assuming that washing and diluting through mixing of produce has an effect on the contamination
levels (reduction-factor 86 %) the point estimates are as follows: for Campylobacter spp. 22 per year-1
1 Introduction
In the last decades outbreaks with pathogenic micro organisms on raw produce (e.g. E. coli O157:H7 in
spinach and Salmonella spp. in tomatoes) (Anonymous 2005, 2006, 2008; Bowen et al. 2006; Burke
2008; Cooley et al. 2007; Greene et al. 2008; Johnston et al. 2006; Johnston et al. 2005; Manuel et al. 2000; Naimi et al. 2003; Nuorti et al. 2004; Scavia et al. 2008; Sewell and Farber 2001; Sivapalasingam et al. 2004) have increased the interest to characterize the microbiological hazards associated with fresh fruits and vegetables. A literature review in the EU provides, however, no clear data regarding food borne infections related to fresh produce. Moreover, reports are not standardized between countries for commodity-specific outbreak investigations (Anonymous 2007a). Both the Rapid Alert System for Food and Feed (RASFF) of the EU (Anonymous 2007b) and the CDC in the USA (Bean et al. 1996) report approximately 4 % of reported food infections to be attributable to vegetables. General figures show that the consumption of raw vegetables does not pose an increased microbiological health risk based on epidemiological data from the EU and the USA. Furthermore, the probability of an outbreak due to the consumption of raw vegetables is comparable with other product groups such as eggs, milk products and shell en shellfish. However, when relating the incidence of outbreaks to the number of food infections involved, vegetables become the second most important commodity, after “Meat and Meat Products”, for severity of microbiological infections. The hazard is enclosed in those cases where an outbreak does occur as then many patients are involved. The current increase in the production of ready-to-eat foods can further increase the potential risk even though reported prevalences are low. A literature review on surveys related with these food commodities revealed prevalences of pathogens in the range of 0-4.5 %
(Jansen and In ‘t Veld 2002; Jansen et al. 2002; Erickson and Doyle 2007;Park and Sanders 1992).
The following simple calculation reveals the potential microbial risk involved in relation to the large production of ready-to-eat-foods (specifically, mixed salads containing at least two lettuce varieties) for the Dutch situation.
# packages in retail Prevalence in %
Per month 30 ·106 1 0.1 0.01
# Contaminated samples 30 ·104 30 ·103 30 ·102
# possible infections* 30 ·101 30 3
* assumption: 1 colony forming unit (cfu) per package results in 1 patient : 1000 packages
Recently reported outbreaks, a lack of instant effective intervention strategies together with increasing production figures resulted in a framework for the study presented in this paper. That is, a survey for ready-to-eat salads in order to get insight in:
1. microbial contamination sources;
2. the dynamics of pathogenic micro-organisms throughout the production chain; 3. the relative public health risk; and
The pathogens of concern were Campylobacter spp., Listeria monocytogenes, Salmonella spp., and E. coli O157. This selection was based on literature review on the occurrence of pathogenic micro-organisms on fresh produce (Long et al. 2002) and their biological characteristics (e.g. contamination via soil, survival and growth at low temperatures). As for the traceability aspect of the study, vegetables from known primary production sites being packed into labeled ready-to-eat mixed salads were the primary produce/product combination of concern.
2 Sample design
To meet the specific goals of this project, namely, traceability of contamination sources and the possibility of tracking a contamination event up to human exposure, this study required a process directed sampling approach. Hereto, a profound sampling plan was developed considering the relevant steps in the production chain of ready-to-eat salads, space and time effects, specific produce and product selection, and number of samples to be analysed. The sample plan is explained in the following
subsections.
2.1 Sampling sites in the production chain
The supply chain of fresh produce in the Netherlands is highly diverse and ranges from individual farmers producing for specific green groceries through large contract producers for the retail up until intercommunity trade and import. From a tracing and tracking perspective it was decided to sample both the produce (separate raw vegetables) and products (ready-to-eat mixed salads) from two large vegetable processing companies in the Netherlands. Produce was sampled at the distribution hall of these
companies from where any (positive) sample could be traced back to a specific Dutch, or EU, primary production site. Products were sampled at two sites further down the production chain for tracking purposes (i.e. in following the dynamics of microbes throughout the chain). That is, at the packing stage in the processing companies on the same day as the produce was sampled (to assess the effect of “food handling”), and, in the retail (to assess any further distribution effects). Retail samples were obtained from supermarkets directly related to the processing companies. These supermarkets were sampled over five regions, in the area surrounding the five departments of the Dutch Food and Consumer Product Safety Authority (VWA), in the Netherlands.
2.2 Selected produce / product combinations
The decision to focus sampling on leafy raw vegetables and pre-packed, ready-to-eat, mixed salads in the cutting plant is based on the following reasons:
1. Leafy greens form the major part of pre-packed, ready-to-eat, mixed salads.
2. The contamination level of the raw produce and the effects of processing can both be measured in the cutting plants.
3. Packed products are completely traceable in the Dutch produce processing chain; 4. The production of ready-to-eat mixed salads is increasing.
As the variety in supply of these salads is substantial it would be an impossible task to sample the whole range of salads and still come to accurate prevalence estimates (see also section 2.3). As a consequence, a subset of products was selected for sampling based on their potential to contain hazardous microbes. These were the mixed salads, i.e. salads containing at least two leafy produce. Again, the number of
mixed salads was too large to optimize the trade-off between laboratory (analysis) capacities and accurate prevalence estimates. A further selection was then based on the sales volumes of the
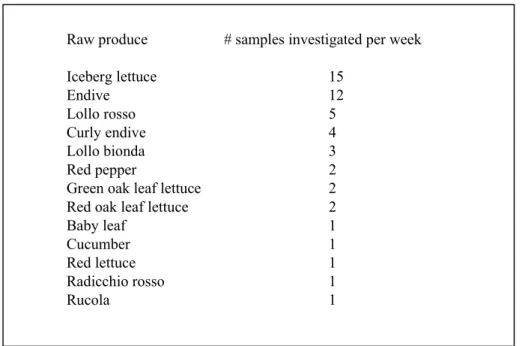
companies. This narrowed the sampling strategy down to twelve carefully selected products from two Dutch processing companies, like oak leaf lettuce mélange, mixed iceberg lettuce, Italian salad, et cetera. Products were sampled proportional to production numbers. Also produce was sampled proportional to production numbers and the distribution of produce in the selected products. Specific vegetables were selected for sampling accounting for a) contaminated produce samples found in earlier studies and b) the amount of specific produce types being distribution over the twelve selected products. This resulted in thirteen vegetable types being sampled at the entrance hall of the companies (Table 1). Table 1 Numbers (50 per week) and variety (13) of raw produce selected for sampling at the entrance hall
over two Dutch processing companies
This approach accounted for a direct tracing link between product contamination at the retail level, the processing companies, possible effect of food handling and primary production. Actual sample sizes will be further specified in the next section.
2.3 Number of samples
The number of samples to be taken in studies where the prevalence is considered to be low is often a trade-off between time/money aspects and the accuracy of the resulting prevalence estimates.
Preliminary literature search revealed the prevalence range from 0 to 4.5 % (Jansen and In ‘t Veld 2002;
Raw produce # samples investigated per week
Iceberg lettuce 15 Endive 12 Lollo rosso 5 Curly endive 4 Lollo bionda 3 Red pepper 2
Green oak leaf lettuce 2
Red oak leaf lettuce 2
Baby leaf 1
Cucumber 1
Red lettuce 1
Radicchio rosso 1
Jansen et al. 2002; Erickson and Doyle 2007; Park and Sanders 1992). This presumed prevalence range, together with the capacities for sample analysis at the participating laboratories formed the basis to decide on the amount of samples to be taken during this one year trial. Ultimate decisions were based on this trade-off between “work load” and “accuracy of estimates” which could be quantified using the methodology as described in Evers (2001). The basic principle here is to consider a Binomial process describing the number of positive samples (“successes”) using a known number of samples (n) and prevalence (d). The properties of this process can be used to calculate the number of samples to be tested negative to assess an upper prevalence level with some confidence (p). This is useful information to answer the question “What will new insights in a prevalence estimate contribute to existing
information”. Assuming a ‘worst case scenario’ in which all samples are tested negative, the question is then: How many samples should be taken (and subsequently tested negative) in order to make sure (with a reasonable confidence level) that the upper level of the prevalence estimate will be below the 4.5 %
already known from literature (Jansen and In ‘t Veld 2002; Park and Sanders 1992). The equation is:
)
1
log(
)
1
log(
10 10d
p
n
−
−
=
, (Eq. 1)where both p and d have values between 0 and 1.
0
200
400
600
800
0.70 0.75 0.80 0.85 0.90 0.95p
n
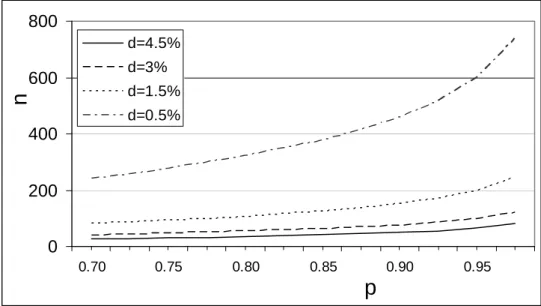
d=4.5% d=3% d=1.5% d=0.5%Figure 1 Number of consecutive samples to be tested negative, n, in order to assess the upper prevalence level, d, with confidence p.
Figure 1 illustrates the number of samples to be tested negative for a pathogen according to Equation 1 in order to assess an upper level for the prevalence with some confidence. This figure illustrates, for example, that 600 samples need to be tested negative in order to assess a prevalence level between 0 - 0.5 % with 95 % confidence.
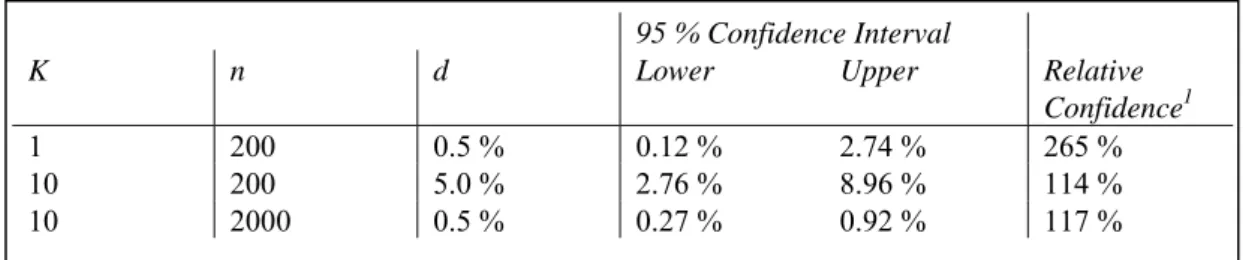
A point estimate for the prevalence can be assessed if a positive sample is found during the predefined sampling period. Again, the Binomial distribution forms the basis for this estimate, whereas the uncertainty about d, due to sampling variability, can be assessed with a Beta distribution (Vose 2000). Table 2 illustrates how both the prevalence (d) and the number of positive samples (k) affect the choice for a sample size (n). The total number of samples is determined by the presumed prevalence. That is, in order to be able to estimate a prevalence of 0.5 % one should, at least, collect 200 samples, because one positive sample would then result in this 0.5 % point estimate for the prevalence. However, the accuracy of this estimate is determined by the number of positive samples from the total number collected. Table 2 also shows that the relative confidence interval (representing the accuracy) decreases from 265 % to 117 % as the number of positive samples increases from 1 to 10 for a constant d.
Table 2 Sampling size (n) affected by the presumed prevalence (d) and the accuracy of the point estimate for d when positive samples (k) are found.
1 Relative Confidence is
d
|
Upper
-d
|
d
|
Lower
-d
|
+
Considering:1. a presumed prevalence in the range of 0-4.5 %, 2. the accuracy of a resulting prevalence estimate, 3. laboratory capacity and
4. budget capacity,
resulted in the following initial sampling plan: at least 1900 raw produce samples at the entrance hall of two processing companies, 780 product samples at the end of the processing chain in the companies and 1500 product samples in the retail. This would, at least, result in the following prevalence estimates:
95 % Confidence Interval
K n d Lower Upper Relative
Confidence1
1 200 0.5 % 0.12 % 2.74 % 265 %
10 200 5.0 % 2.76 % 8.96 % 114 %
Sample Number Prevalence estimate with 95 % confidence (interval) k = 0 k = 1 Raw produce 1900 ≤ 0.16 % 0.10 % (0.013, 0.29) Product at company 780 ≤ 0.38 % 0.26 % (0.031, 0.71) Product in retail 1500 ≤ 0.20 % 0.13 % (0.016, 0.37)
This survey will result in useful information in the light of obtaining new insights in the microbial contamination of fresh produce in addition to current knowledge.
2.4 The sampling process
Samples at the processing companies were taken evenly spread over one year from October 2006 through to October 2007, in order to reveal possible seasonality influences on contamination levels. The sampling consisted of a three-weekly cycle with sampling on Mondays and Wednesdays and the analysis starting on Tuesdays and Thursdays. In total, 50 raw produce samples were collected at the two processing companies in each sampling week (see Table 1 for numbers per produce).
Raw produce samples were randomly selected from incoming trays at the processing companies, packed in separate bags by the responsible quality manager and stored at 4 ºC. Subsequently, a certified courier delivered the samples at RIVM on Monday and Wednesday evening where the samples were stored overnight in the fridge (4 ºC) to be prepared for analysis early the following day.
The same procedure was followed for the products being sampled at the end of the processing line (22 samples over 12 different products per week) and investigated at one of the 5 VWA departments. In addition, product sampling in the supermarkets from two retail branches was done on a monthly basis as this fitted the regular sampling protocols of the VWA. Each of the 5 departments was to collect 25 samples (over 13 different products) at supermarkets in their region with a direct link to the
processing companies.
This finally resulted in a total of 1950 produce, 858 product samples from the processing companies and 1500 retail samples to be investigated over a one year period.
3 Sample analysis
A preliminary public health risk estimate was to be assessed through the quantification of contamination levels with a Most Probable Number (MPN) approach in addition to prevalence estimates of
Campylobacter spp., Salmonella spp., and E. coli O157. This study required a modified MPN method to keep a manageable amount of sample analysis. The chosen method was related to 1) portion size at consumption, 2) the lab capacity (both in storage space and labour time) and 3) the ability to come to an improved risk estimate over current knowledge from earlier studies. This resulted in a MPN method using the following matrix:
Source material (g) Replicate 1 Replicate 2
25 + / - + / -
2.5 + / - + / -
A different approach was used to assess the occurrence of Listeria monocytogenes in raw produce. This decision stemmed from the height of the infectious dose and food safety standard for Listeria
monocytogenes (count < 100 colony forming units (CFU)) in the Netherlands. Hereto, 10 g of sample was mixed with 90 ml of BPW. Subsequently, 1 ml and 0.1 ml of the mixture was plated in duplicate, grown and cfu’s counted. A detailed description of the sample analysis is presented below.
All materials used to process the samples, e.g. mixing bowls of the food processor, knives and chopping boards were decontaminated before each use to prevent (cross)contamination. The vegetables were preprocessed in accordance with the methods used by the production companies. In brief, before mincing and homogenization in a Braun K-650 Combimax food processor the following actions were taken with the various produces. From the lettuce heads and endive heads the stems were cut off and discarded, and the outer leaves were removed and discarded. Red peppers were sliced in half, and the seeds and membranes were removed. From the cucumbers the ends were cut, iceberg lettuce heads and radicchio rosso heads were cut in half and the stalk and the outer leaves were removed. Rucola and baby greens were minced and homogenized without preparation. After mincing and homogenization the produce samples were examined for the presence of Salmonella species, Campylobacter species and Escherichia coli O157. An enumeration method was used to assess the presence of Listeria
monocytogenes. Methods, as described below, were based on the following international standards: ISO 6579 (Salmonella spp.), ISO 10272 (Campylobacter spp.), ISO 16654 (Escherichia coli O157) and ISO 11290-2 (Listeria monocytogens).
For Salmonella, 225 ml and 22.5 ml Buffered Peptone Water (BPW) were inoculated in duplicate with 25 g and 2,5 g of the homogenized sample, respectively, and incubated at 37 °C for 18-20 hours. Subsequently, Modified Semi solid Rappaport Vassiliadis (MSRV) plates were inoculated with 100 μl BPW culture divided over three drops and incubated at 41.5 °C for 2 x 24 hours. Plates were evaluated after 24 and 48 hours, and if suspected for Salmonella spp. Brilliant Green Agar (BGA) was inoculated and incubated at 37 °C for 24 hours. MSRV was regarded negative if after 2 x 24 hours of incubation no
suspected colonies had developed. Biochemical confirmation was done with Triple Sugar Iron (TSI) agar, Urea (UA) agar and L-Lysine Decarboxylase medium (LDC). Confirmed isolates were serotyped. For Campylobacter, 225 ml and 22.5 ml Bolton Broth with laked horse blood were inoculated in duplicate with 25 g and 2.5 g of the homogenized samples, respectively, and incubated at 41.5 °C for
48 hours in a microaerophilic atmosphere (10 % O2). Subsequently, a sample from the Bolton Broth
culture was plated out on Charcoal Cefoperazone Deoxycholate Agar (CCDA) plates and incubated for another 48 hours in a microaerophilic atmosphere. Suspected colonies were tested for their microscopic appearance (motile cork-screw like microorganisms) and oxidase reaction. Further determination was done with a Campylobacter Test kit (Oxoid, Basingstoke, UK) according to the manufacturer’s instructions.
Escherichia coli O157 was examined by means of an immuno magnetic separation test. For this purpose 225 ml and 22.5 ml of modified Tryptone Soya Broth containing Novobiocin (mTSB+Nov) was inoculated in duplicate with 25 g and 2.5 g homogenized sample, respectively, and incubated at 41.5 °C for 22 hours. Subsequently, 1 ml of mTSB+Nov culture was used for separation and concentration with Dynabeads anti-E. coli O157 test kit (Dynal Biotech ASA, Oslo Norway) according to the
manufacturer’s instructions. Cefixime Tellurite Sorbitol MacConkey (CT-SMAC) agar plates were used for detection. Presumptive colonies were confirmed with eosine methylene blue agar plates and
Wellcolex E.coli O157 latex test (Remel Europe Ltd, Kent UK).
An enumeration method was used for Listeria monocytogenes. Hereto, 90 ml of BPW was inoculated with 10 g of homogenized sample and left at room temperature for resuscitation for one hour.
Subsequently, 1.0 and 0.1 ml were plated out in duplicate on respectively 14 cm and 9 cm agar plates of Agar Listeria according to Ottaviani & Agosti (ALOA) and incubated for 48 hours at 37 °C. Confirmation of the suspected colonies was done by means of a heamolysis test, a katalase reaction, motility test at 25 °C and the fermentation of L-Rhamnose and D-Xylose. From the number of counted and confirmed colonies the cfu/ml was calculated.
Unless stated otherwise all materials were from Biotrading, Mijdrecht, the Netherlands.
Ready to eat products, collected at the end of the lines at the production companies and at retail level were minced and homogenized without further pre-treatment, and investigated as described.
Salmonella spp. were serotyped by the Laboratory for Infectious Diseases and Perinatal Screening of the RIVM.
4 Results
4.1 Prevalence estimation
Tables 3 and 4 show the net realization of numbers of investigated samples with accompanying
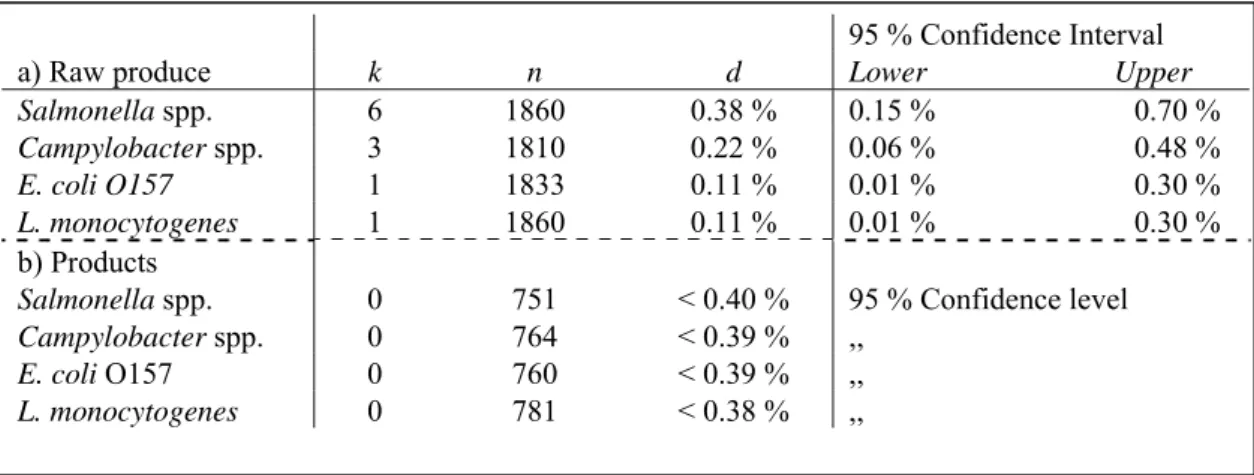
prevalence estimates for the separate microbes on total produce and product level. Net realizations differ from the indicated numbers at the end of section 2.4 due to occasionally missing produce/product samples, failed analysis, et cetera. The results for the samples from the processing companies are shown in Table 3, the results for the retail samples in Table 4. As no micro organisms were detected in the products from the processing companies (see Table 3) only an upper prevalence level could be determined (in this case, the 95 % confidence upper prevalence level was below 0.40 % for all pathogens). The prevalence point estimate for the micro organisms in raw produce varied from 0.11 % for L. monocytogenes and E. coli O157 to 0.38 % for Salmonella spp. Only one retail sample was found positive (Table 4), which resulted in a Salmonella spp. prevalence point estimate of 0.17 % and an upper prevalence level estimate of 0.26 % for the other pathogens (with 95 % confidence).
Table 3 Results of the sample analysis from the processing companies for a) total raw produce and b) total products. Where, k is the number of positive samples, n is the total number of samples analysed per pathogen/produce or product combination, d is the prevalence point estimate. In those cases where k > 0, the last two columns represent the Lower (2.5 %) and Upper (97.5 %) bound of the 95 % Confidence Interval around d. In those cases where k=0, d gives the upper bound of the prevalence estimate with 95 % confidence.
95 % Confidence Interval
a) Raw produce k n d Lower Upper
Salmonella spp. 6 1860 0.38 % 0.15 % 0.70 % Campylobacter spp. 3 1810 0.22 % 0.06 % 0.48 % E. coli O157 1 1833 0.11 % 0.01 % 0.30 % L. monocytogenes 1 1860 0.11 % 0.01 % 0.30 % b) Products Salmonella spp. 0 751 < 0.40 % Campylobacter spp. 0 764 < 0.39 % E. coli O157 0 760 < 0.39 % L. monocytogenes 0 781 < 0.38 % 95 % Confidence level ,, ,, ,,
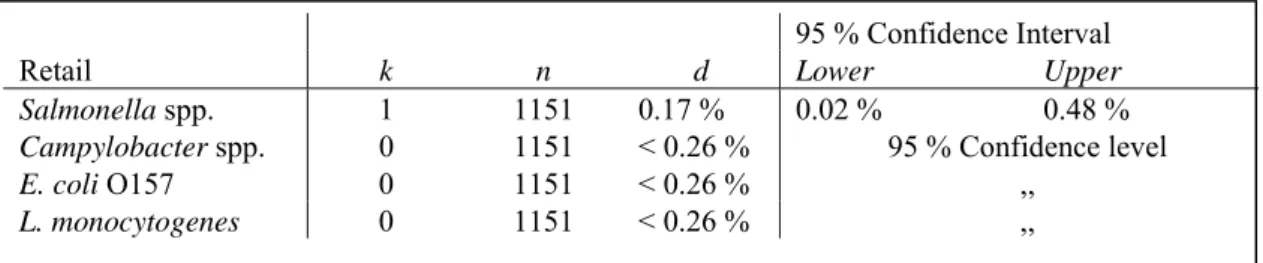
Table 4 Results of the product sample analysis from retail. Where, k is the number of positive samples, n is the total number of samples analysed per pathogen/product combination, d is the prevalence point estimate. In those cases where k > 0, the last two columns represent the Lower (2.5 %) and
Upper (97.5 %) bound of the 95 % Confidence Interval about d. In those cases where k=0, d gives
the upper bound of the prevalence estimate with 95 % confidence.
Table 5 shows the prevalence estimates of the separate microbes according to the produce they were associated with. Endive appeared to be the most susceptible raw produce, as Salmonella spp. was detected in three heads, Campylobacter spp. in two heads and E. coli O157 in one head.
Table 5 Prevalence estimates for the separate microbes on produce level. Where, k is the number of positive samples, n is the total number of samples analysed per pathogen/produce combination, d is the prevalence point estimate. The last two columns represent the Lower (2.5 %) and Upper (97.5 %) bound of the 95 % Confidence Interval about d.
95 % Confidence Interval
Retail k n d Lower Upper
Salmonella spp. 1 1151 0.17 % 0.02 % 0.48 %
Campylobacter spp. 0 1151 < 0.26 % 95 % Confidence level
E. coli O157 0 1151 < 0.26 % ,,
L. monocytogenes 0 1151 < 0.26 % ,,
95 % Confidence Interval
Microbe / Produce k n d Lower Upper
Salmonella spp. Endive 3 370 1.10 % 0.29 % 2.30 % Cucumber 1 37 5.10 % 0.64 % 13.8 % Iceberg lettuce 2 565 0.53 % 0.11 % 1.27 % Campylobacter spp. Endive 2 360 0.83 % 0.17 % 2.00 %
Oak tree lettuce green 1 72 2.70 % 0.33 % 7.40 %
E. coli O157
Endive 1 370 0.54 % 0.06 % 1.50 %
L. monocytogenes
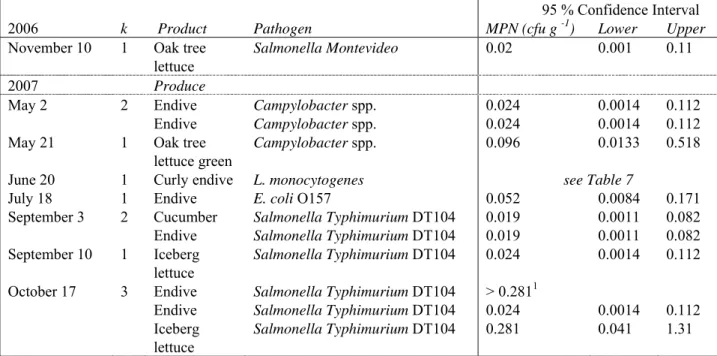
Table 6 shows further results, i.e. serotyping and concentration estimates of the positive samples as found throughout the sampling period. All Salmonella types found in raw produce appeared to be S. Typhimurium DT104 strains. Further discrimination is still under investigation.
Table 6 Time during survey, number of positive (k) products/produce with a further serotype specification and concentration estimates (MPN) together with Lower (2.5 %) and Upper (97.5 %) values of the 95 % Confidence Interval about the MPN for the positive samples as found throughout the sampling period.
95 % Confidence Interval
2006 k Product Pathogen MPN (cfu g -1) Lower Upper
November 10 1 Oak tree
lettuce
Salmonella Montevideo 0.02 0.001 0.11
2007 Produce
May 2 2 Endive Campylobacter spp. 0.024 0.0014 0.112
Endive Campylobacter spp. 0.024 0.0014 0.112
May 21 1 Oak tree
lettuce green
Campylobacter spp. 0.096 0.0133 0.518
June 20 1 Curly endive L. monocytogenes see Table 7
July 18 1 Endive E. coli O157 0.052 0.0084 0.171
September 3 2 Cucumber Salmonella Typhimurium DT104 0.019 0.0011 0.082
Endive Salmonella Typhimurium DT104 0.019 0.0011 0.082
September 10 1 Iceberg
lettuce
Salmonella Typhimurium DT104 0.024 0.0014 0.112
October 17 3 Endive Salmonella Typhimurium DT104 > 0.2811
Endive Salmonella Typhimurium DT104 0.024 0.0014 0.112
Iceberg
lettuce
Salmonella Typhimurium DT104 0.281 0.041 1.31
1
In this case only a lower limit could be estimated since all dilutions and replicates of the MPN were tested positive.
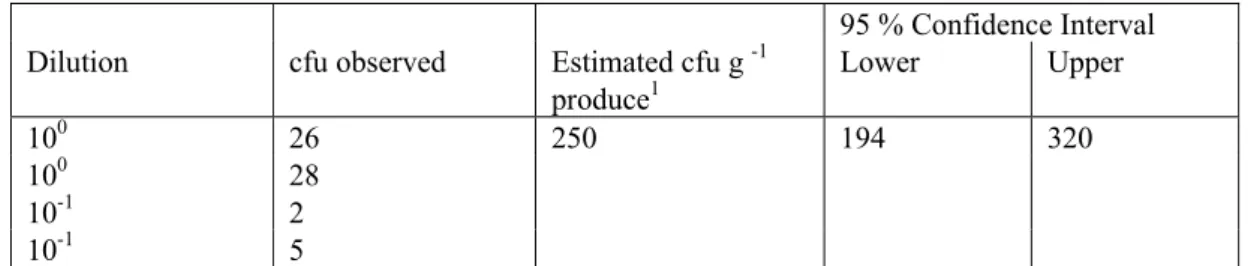
The result of the quantitative assessment for L. monocytogenes (i.e for a curly endive sample in which the microorganism was detected) is presented in Table 7. The concentration of L. monocytogenes could be calculated based on the number of colonies on the 14 and 9 cm ALOA plates.
Table 7 Result of the analysis (cfu’s observed) on 10 g frisee fine for L. monocytogenes (left hand side). The contamination level point estimate together with the Lower (2.5 %) and Upper (97.5 %) values of the 95 % Confidence Interval about the point estimate are given in the right hand side of the table.
95 % Confidence Interval
Dilution cfu observed Estimated cfu g -1
produce1 Lower Upper 100 26 250 194 320 100 28 10-1 2 10-1 5 1
This estimate is calculated following a Bayesian approach using a Uniform Prior and Poisson Likelihood distribution (Vose 2000)
4.2 Microbiological Risk Assessment
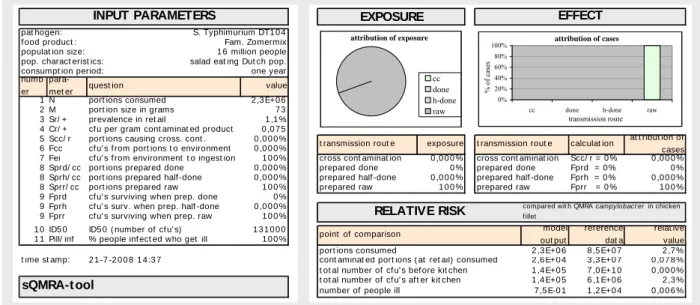
This section will reveal insight in the production chain processes of “ready to eat” mixed salads and its microbial dynamics up until human consumption inclusive. An initial point estimate of the potential microbial risk involved in the consumption of “ready to eat” mixed salads is calculated using a “swift Quantitative Microbiological Risk Assessment” (sQMRA) Tool developed by Evers and Chardon (2008b, 2008a). The sQMRA Tool involves several calculation procedures which result in a relative risk point estimate. This risk refers to the number of people in a predefined population becoming ill on a yearly basis relative to the number stemming from Campylobacter in poultry as result of a quantitative risk assessment (including variability) performed during the CARMA project (Nauta et al. 2005). We refer to the paper of Evers and Chardon (submitted) for a full Tool description. Here, only the output sheet of the tool will be explained where appropriate for our purposes. That is, applying this Tool will give insight in the number of variables and uncertain parameters in the chain under study. Scenario analysis will give insight in the need for a full quantitative chain approach risk assessment concerning these pathogen/product combinations.
The tool shows the pathogen matrix combination and the population at risk in the left hand corner at the top (Figure 2). Further relevant model input parameters are to be filled out in the left hand column at the bottom. General parameters apply to the behavior of the population at risk, such as consumption and preparation properties. Specific pathogen characteristics are to be filled out, in this case using the survey results. Further parameters concern cross-contamination and pathogen survival events during preparation that refer to both the population hygiene standards and pathogen/matrix characteristics. Sub-procedures give point estimates for contamination figures throughout the food chain, such as contamination at retail and human exposure levels, to ultimately come to a relative risk point estimate.
t
pat hogen: S. Typhimurium DT1 0 4 f ood product : Fam. Zomermix populat ion size: 1 6 million people pop. charact erist ics: salad eat ing Dut ch pop. consumpt ion period: one year 1 N port ions consumed 2 ,3 E+0 6 2 M port ion size in grams 7 3 3 Sr/ + prevalence in ret ail 1 ,1 % 4 Cr/ + cf u per gram cont aminat ed product 0 ,0 7 5 5 Scc/ r port ions causing cross. cont . 0 ,0 0 0 % 6 Fcc cf u' s f rom port ions t o environment 0 ,0 0 0 %
7 Fei cf u' s f rom environment t o ingest ion 1 0 0 % cross cont aminat ion 0 ,0 0 0 % cross cont aminat ion Scc/ r = 0 % cc 0 ,0 0 0 % 8 Sprd/ cc port ions prepared done 0 ,0 0 0 % prepared done 0 % prepared done Fprd = 0 % do 0 % 8 Sprh/ cc port ions prepared half -done 0 ,0 0 0 % prepared half -done 0 ,0 0 0 % prepared half -done Fprh = 0 % h- 0 ,0 0 0 % 8 Sprr/ cc port ions prepared raw 1 0 0 % prepared raw 1 0 0 % prepared raw Fprr = 0 % ra 1 0 0 % 9 Fprd cf u' s surviving when prep. done 0 %
9 Fprh cf u' s surv. when prep. half -done 0 ,0 0 0 % 9 Fprr cf u' s surviving when prep. raw 1 0 0 % 1 0 ID5 0 ID5 0 ( number of cf u' s) 1 3 1 0 0 0 1 1 Pill/ inf % people inf ect ed who get ill 1 0 0 %
port ions consumed 2 ,3 E+0 6 8 ,5 E+0 7 2 ,7 % t ime st amp: cont aminat ed port ions ( at ret ail) consumed 2 ,6 E+0 4 3 ,3 E+0 7 0 ,0 7 8 % t ot al number of cf u' s bef ore kit chen 1 ,4 E+0 5 7 ,0 E+1 0 0 ,0 0 0 % t ot al number of cf u' s af t er kit chen 1 ,4 E+0 5 6 ,1 E+0 6 2 ,3 % number of people ill 7 ,5 E-0 1 1 ,2 E+0 4 0 ,0 0 6 % value
para-met er
EXPOSURE
t ransmission rout e at t ribut ion of cases numb
er
model out put
point of comparison relat ive value calculat ion
t ransmission rout e exposure quest ion
sQMRA-t ool
EFFECT
RELATIVE RISK compared wit h QMRA campylobact er in chicken f illet INPUT PARAMETERS ref erence dat a 2 1 -7 -2 0 0 8 1 4 :3 7 attribution of exposure cc done h-done raw attribution of cases 0% 20% 40% 60% 80% 100%
cc done h-done raw
transmission route % o f cas es
Figure 2 Overview of the sQMRA Tool giving a relative risk estimate (0.006 %) and a point estimate of < 1 cases per year for the Dutch population being exposed (relative value of 2.3 % and an exposure level of 1.4E+05 cfu y-1) to Salmonella Typhimurium DT104 in “Family Summermix”.
The relative risk is calculated using the reference data: estimates on campylobacteriosis from chicken filet (Nauta et al., 2005, 2007)). The effect of produce washing on the contamination level of the product has not been incorporated in this figure.
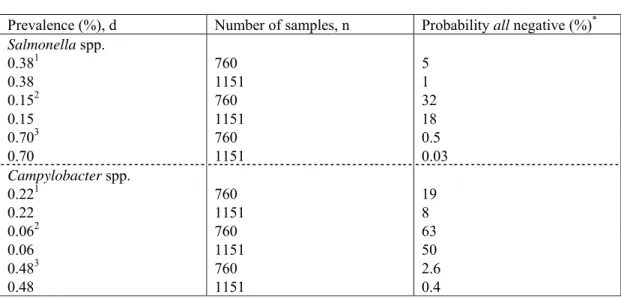
The data filled out here relate to the risk assessment concerning ready-to-eat raw mixed salads. Scenario’s represent the relative microbial risk from products associated with contaminated produce as found during the survey. An important factor in the conversion of contaminated produce to cfu per gram contaminated product (parameter no. 4 in the Tool, Figure 2) is the effect of washing before different produce are merged into a mixed salad. The low number of products found positive for microbial contamination (only one sample positive for Salmonella in the retail (Table 4) could indeed indicate a food handling effect, i.e. reducing contamination levels, mainly due to washing. In addition, dilution of the concentration occurs as only mixed salads were tested, i.e salads containing ≥ 2 produce. Still, one should account for the fact that only a limited number of samples was tested and this one positive sample might be a consequence of the product sample numbers. This reasoning can be tested with a probability calculation (see footnote in Table 8), i.e. what would be the probability of testing all samples negative if the prevalence through the chain would stay constant (so, if a washing and dilution effect from produce up to a mixed salad package could be ignored). Table 8 shows the probability that all products (i.e. ~760 samples at the end of the production chain and 1151 samples in the retail) are found negative, given the prevalence estimates as found in the produce (when no food handling effect was to be assumed).
Table 8 Probability of finding all product samples negative (both at the end of the processing chain, n~760, and at retail, n=1151), given the boundary of the prevalence estimates as a result of the produce survey (Table 3a).
Prevalence (%), d Number of samples, n Probability all negative (%)*
Salmonella spp. 0.381 760 5 0.38 1151 1 0.152 760 32 0.15 1151 18 0.703 760 0.5 0.70 1151 0.03 Campylobacter spp. 0.221 760 19 0.22 1151 8 0.062 760 63 0.06 1151 50 0.483 760 2.6 0.48 1151 0.4 1,2, 3
Refer respectively to the point estimate for the mean and lower and upper bound of the 95 % confidence interval about the mean (Table 3a)
*
Calculated following (1-d)n
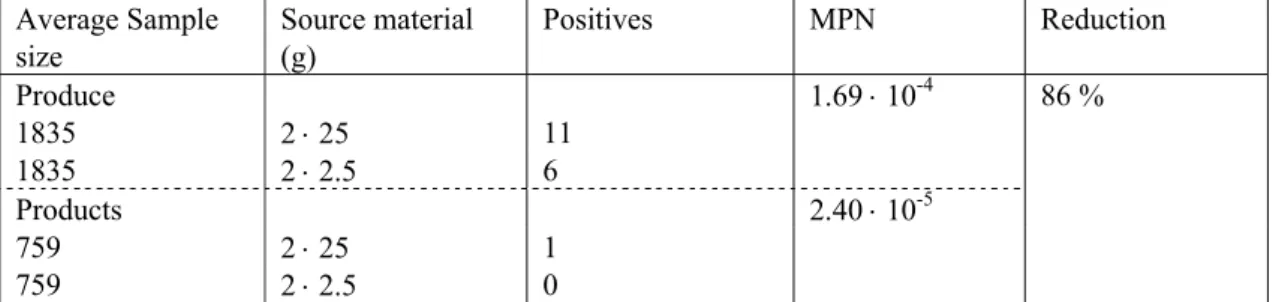
The small probabilities of finding only negative product samples given a constant prevalence as shown in Table 8 indicate a likely reduction of pathogenic contamination during processing. The reduction factor can be estimated from the results on microbial contamination levels in the survey, comparing the MPN estimates for the produce with those of the products.
As the input for the sQMRA Tool is solely based on point estimates, the washing factor was initially calculated using the MPN point estimates from the survey results. Hereto, all presence/absence results of the produce were combined and an MPN was estimated to come to an average MPN for the produce. The same was done for the lab results of all products under study. Subsequently, the overall MPN point estimate for produce compared to the products was used to calculate this factor. In this we assume that the reduction factor is microbe independent. The results are shown in Table 9.
Table 9 Input values to calculate the effect of produce washing and dilution through mixing on product contamination. Average Sample size Source material (g) Positives MPN Reduction Produce 1.69 ⋅ 10-4 86 % 1835 2 ⋅ 25 11 1835 2 ⋅ 2.5 6 Products 2.40 ⋅ 10-5 759 2 ⋅ 25 1 759 2 ⋅ 2.5 0
4.2.1 Application of the sQMRA Tool
Figure 2 shows an overview of the input and output variables of the sQMRA tool. The first scenario
analysis will be explained in detail below and represents the case in which the relative risk (y-1) for the
Dutch population exposed to Salmonella Typhimurium DT104 from the consumption of a mixed salad “Family Summermix” is assessed. All subsequent calculations will be based on the following procedure. Model output (Figure 2) shows that, in this case, the relative risk (0.006 %), i.e. the number of human salmonellosis cases from the consumption of “Family Summermix” salad is neglectable compared to the reference data (the point estimate from the QMRA on the number of human Campylobacteriosis cases from the consumption of poultry, 1.2E+04). Note that Figure 2 shows the output in the case where the effect of washing (point 8b in the Tool procedure, see above) has yet not been incorporated.
The sQMRA tool has successively been used to obtain a microbial (relative) point risk estimate for human due to the consumption of mixed salads (with and without inclusion of the wash step reduction factor). Hereto, the quantified pathogen/produce combinations (i.e the results of the sample analysis in Tables 5 and 6) were translated into prevalence and concentration estimates in the products according to the scheme above.
Outputs of the sQMRA tool are presented in Tables 10, 10a, 11 and 11a for Salmonella, Campylobacter, E. coli O157 and L. monocytogenes without (Tables 10 and 11) and with (Tables 10a and 11a) the effect of produce washing on ultimate product contamination levels. Tables 10 and 10a show the results of the Tool output for the exposure assessments and Tables 11 and 11a show the results when, additionally, a dose response relationship has been applied. Both figures on (relative) exposure and human cases have been presented here since little or no information exists on the dose response relationships for the pathogen/matrix combinations in this study. Initial dose response information used in these calculations stem from Berk (2008) for Salmonella Typhimurium DT104, from Teunis et al. (1996) for
Campylobacter, from Teunis et al. (2008, 2004) for E. coli O157 and from McLauchlin et al. (2004) and Rocourt et al. (2003) for L. monocytogenes. As of the uncertainty of the dose response relationships, the sensitivity of model output to different ID50 input values has been evaluated. In addition, both results without and with the effect of produce washing on product contamination levels have been presented. The reduction factor results from the preliminary point estimate (Table 9) and should be refined before definite conclusions can be drawn from its implementation. The application of an uncertainty
distribution about this point estimate would have to show variable washing effects.
Tables 10 and 10a show that, in general, average exposure levels to Salmonella, Campylobacter and E. coli O157 from the consumption of the mixed salads under study are low compared to the exposure levels to Campylobacter in chicken filet. Exposure to L. monocytogenes, however, largely exceeds the reference data.
Tables 11 and 11a show that, under the applied model assumptions, the risk on salmonellosis from the products under study is generally small. A change in the ID50 value to 1.0E+04 as used by Chardon and Evers (2006), for example, would increase the response figures approximately by a factor 10. The
“number of people ill” (from Variegated lettuce mix 3) would then increase to >40 or >6 y-1 (with
Initial calculations to obtain the input parameters for the sQMRA tool consist of: 1. Specify the pathogen under study (here, Salmonella Typhimurium DT104) 2. Define the mixed salad product under study (here, “Family Summermix”)
3. Describe the population under study (here, the potential “Family Summermix” consuming Dutch population of 16 million people and its exposure over a one year period)
4. Define the ingredients and their division over the product (here, Iceberg lettuce (70 %), carrots (3 %), white cabbage (7 %), red lettuce (2 %))
5. Define the weight of the product (here, 400 g)
6. Calculate the number of portions produced per year from the production figures (here, 2.3E+06)
a. That is, the average weight of all products under study is 220 g. Assuming, on average, 3 persons eat from one mixed salad then the average portion size is 73 g.
b. Production figures are assumed to be equal to consumption figures.
7. Estimate the prevalence for the separate microbes in the product under study (The “Family Summermix” contains Iceberg lettuce which was found positive for Salmonella Typhimurium DT104 as shown in Table 6. More specifically, 1 of the 185 Iceberg lettuce heads in the cutting company that produces this mixed salad was found positive (Table 6, October 17). This results in a prevalence point estimate of 1.1% of the “Family Summermix” to be contaminated with Salmonella.
8. Estimate the concentration of the pathogen in the product under study.
a. In this case, the MPN estimate resulted in 0.281 cfu g-1 Iceberg lettuce (Table 6). Yet, the
produce Iceberg lettuce is the ingredient for 4 products under study from this processing company. Once the cut Iceberg lettuce is well mixed and subsequently equally divided over the 4 products one can assume that the number of microbes will be spread accordingly. In reality, however, some products contain more Iceberg lettuce than others and, therefore, the number of microbes was divided proportionally to the amount of this produce in the separate products. This resulted in a point estimate for the concentration of Salmonella Typhimurium DT104 in the
“Family Summermix” salad to be 0.075 cfu g-1.
b. The possible effect of a further dilution of the concentration due to washing of the produce on the resulting risk estimate has been incorporated in running 2 scenario’s: I. without a reduction factor, i.e. a constant contamination level throughout the chain as calculated under 8a. II. with a reduction facter, i.e. the contamination level reduces to 0.14 ⋅ [conc. on produce]. (here,
parameter no. 4 in Figure 2 then becomes 0.0105 cfu g-1).
9. As mixed salads are assumed to be consumed raw, no further handling effects have to be considered as input for the tool and the final estimates concern the dose-response parameters.
10. The ID50 value (i.e. the number of Salmonella to be ingested upon which 50 % of the exposed people will become infected) for Salmonella Typhimurium DT104 is assumed to be 1.31E+5 (this is an average value calculated from Berk (2008)).
reduction factor) and its relative risk would become >0.32 or >0.04 % (with reduction factor), values not shown.
Although absolute illness point estimates for Campylobacter are somewhat higher compared to Salmonella, still the values relative to Campylobacter in chicken filet are low. The same reasoning is true for E. coli O157 and L. monocytogenes. Yet, recall that a difference in the ID50 value would change the risk linearly in this part of the dose response curve. So, for example, when an ID50 value of 1.0E+04 would be applied for L. monocytogenes, values would change to 2.1E+04 (relative risk 168 %) or 3.2E+03 (relative risk 26 %) (without and with application of the reduction factor respectively, values not shown).
ble 10 Su mmary of t he sQMR A to ol exp osu re sc en ario ’s ap pl ied t o all pro duc ts tha t co nt ain at l east on e of the p rod uce fo und po si tive for the m icrob es u nder s tud y. Ef fe ct of pro duc e washi ng has no t be en incl ud ed he re . T he “ Total” n umb ers und er th e hor izo ntal lin e in dicate the po int estimates for huma n ex po su re (cfu ’s ) to t he se pa rate teste d micro bes o
ver all pro
duc ts . Th e “To tal” n um bers to th e righ t o f the vertical line p re se nt the s ame figu res for th e se pa rate pro duc ts o ve r all the mi crob es tested. th og en Sal m o n el la sp p. C a m p yl obact er s pp. E. col i O 157 L. mo no cyto g enes T otal rod uc t E xp os ur e (cf u y -1 ) Re l. r isk (% ) Ex pos ure (cf u y -1 ) Re l. r isk (% ) Ex pos ur e (cf u y -1 ) Re l. risk (% ) Expo su re (c fu y -1 ) Re l. r isk (% ) Ex pos ure (cf u y -1 ) ari eg at ed lett uc e m ix 1 * (B on te slam ix 1 * ) 3.9E +0 4 0.6 34 7. 6E +0 4 1. 2 1.1 E +0 5 1. 8 ari eg at ed lett uc e m ix 2 * (Bo nt e slam ix 2 *) 4.9E +0 4 0.8 03 ari eg at ed lett uc e m ix 3 * (Bo nt e slam ix 3 * ) ≥5.8E + 05 9.5 ≥8. 5E + 05 m il y Su m m er m ix (F am il ie Zo m er m ix ) 1.4E +0 5 2.3 1. 4E +0 5 tch raw ve get ab les (H ol lan dse rau w ko st ) 5.1E +0 3 0.0 83 5. 1E +0 3 eb erg lett uc e f ri see m ix (I Jsb er gsla f rise em ix) 1.4E +0 5 2.3 1. 4E +0 5 la d di sh (S aladescho tel ) 9.6E +0 4 1.6 9. 6E +0 4 amb ’s le tt uc e mi x (Veld slam ix) 2.9E +0 4 0.4 79 2. 9E +0 4 ak le af le tt uc e bl end (E ikenb lad slam elan ge) 1. 2E +0 5 2. 0 1. 2E +0 5 ak le af le tt uc e bl end (r et ai l) en bl ad sla m el an ge (re ta il)) 6.9E +0 2 0.0 11 6. 9E +0 2 xe d I ceb erg lett uce (G em engd e i jsb er gs la ) 2.4E +0 4 0.3 86 2. 4E +0 4 eb erg lett uc e f ri see m ix (I Jsb er gsla f rise em ix) 1.4E +0 4 0.2 31 3 .4E +0 8 553 9 3. 4E +0 8 al ia n s ala d (Ital iaanse s alad e) 4. 3E +0 5 7. 1 4. 3E +0 5 co nom y s iz e m ixe d le tt uc e (V oo rd eel ver pa kki ng ge m eng de s ala de ) 1.9E +0 4 0.3 04 1. 9E +0 4 otal ≥1.1E + 06 6. 3E +0 5 1.1 E +0 5 3. 4E +0 8 ≥3. 4E + 08 V ari eg at ed let tu ce mi x (B on te sla m ix ) 1, 2 a nd 3 refer t o s Q M R A ou tpu t f or th e 3 di ffere nt c onc en tr at io ns in it ia lly f ou nd o n th e pr od uc e ( i.e . 1. E nd iv e w ith 0. 01 9, 0 .02 4 an d >0 .2 81 cf u g -1 re sp ec ti vely )
Summ ary o f t he sQMR A to ol ex posu re sce na rio ’s app lied to a ll prod ucts that c on ta in at l east one o f the p rodu ce fo und pos itive fo r the m icro bes u nder s tud y. Eff ect of prod uc e washi ng has b een in clu ded he re (8 6 % , Table 9). Th e “To tal” n umb er s u nder the ho rizon ta l l ine in dicat e the p oint es tima tes fo r hum an expos ure (c fu’s) to t he sep ar ate teste d mi crobe s ove r all produ cts. T he “ Total” num ber s to the right of th e ve rtical line presen t th e same fig
ures for the
separ ate pr od uc ts ove r all the microb es te st ed. en Salmo n ella sp p. Ca mpyl ob act er sp p. E. c o li O157 L. m o noc yt o g en es To ta l t Ex po su re (c fu y -1 ) Rel . ri sk (%) E xposur e (c fu y -1 ) Re l. r is k (%) E xposur e (c fu y -1 ) Re l. r is k (%) Ex posur e (c fu y -1 ) Re l. r is k (%) Ex po su re (c fu y -1 ) ted le tt uc e m ix 1 * (Bo nte sla m ix 1 *) 5. 4E+ 03 0 .08 9 1. 1E + 04 0. 175 1. 5E + 04 0. 246 ted le tt uc e m ix 2 * (Bo nte sla m ix 2 *) 6. 9E+ 03 0. 11 2 ≥1. 2E+ 05 ted le tt uc e m ix 3 * (Bo nte sla m ix 3 * ) ≥8. 1E+ 04 1. 3 mm er mi x (Fa m ili e Z om er m ix) 2. 0E+ 04 0. 32 2 2. 0E+ 04 ve ge tabl es (H ollan dse rauwk ost ) 7. 1E+ 02 0. 01 2 7. 1E+ 02 et tu ce f ri se e m ix (I Jsb er gsla fri seem ix) 1. 9E+ 04 0. 31 6 1. 9E+ 04 h (S al ad es ch ot el ) 1. 3E+ 04 0. 22 1. 3E+ 04 tt uc e mi x (Ve ldsla m ix) 4. 1E+ 03 0. 06 7 4. 1E+ 03 ettu ce ble nd (E ik en bl ad sl am el an ge ) 1. 7E + 04 0. 275 1. 7E+ 04 ettu ce ble nd (r et ai l) ik en bl ad sl am el an ge ( ret ai l) ) 9. 6E+ 01 0. 00 2 9. 6E+ 01 ce be rg le tt uce (G em en gd e i js ber gs la ) 3. 3E+ 03 0. 05 4 3. 3E+ 03 et tu ce f ri se e m ix (I Jsb er gsla fri seem ix) 2. 0E+ 03 0 .03 2 4. 7E + 07 775 4. 7E+ 07 ala d (I ta lia an se s ala de ) 6. 1E + 04 0. 994 6. 1E+ 04 y s iz e m ix ed l et tu ce ee lv er p. g em eng de s al ade ) 2. 6E+ 03 0. 04 3 2. 6E+ 03 ≥1. 6E+ 05 8. 9E + 04 1. 5E + 04 4. 7E + 07 ed let tu ce m ix ( B on te sla m ix) 1 , 2 a nd 3 r efer to sQ M R A ou tpu t f or t he 3 di ff er en t c onc en tr at io ns in iti all y f ou nd on th e e (i .e . 1. E nd iv e w ith 0 .01 9, 0 .02 4 a nd >0 .2 81 cf u g -1 r esp ec ti vely)
Summary of t he sQMR A tool r es ponse sc ena rio ’s appli ed t o all prod ucts that con tain at l east on e of the pr oduce fo und pos itiv e for the m icrobes under s tudy. Effect of produc e washi ng
has not been i
ncluded here. Th e “Total” nu mbers un der the horizont al lin e indic ate the p oint estimates for th e num ber of p eople ill from th e separa te tes ted microbes over all pr oduct s. Th e “Total” n umbers t o the ri ght of the ve rtical line p resent the same figu res for th e sepa rate pr oducts ove r all the mi cr obe s tested. Furt her more, the as sumed ID50 val ues and F ill va lues have been indi cated. No te tha t a change in t he ID50 o r P ill /inf wil l result i n a l inear ch ang e of th e risk in this linear part of t he do se-r esp on se curve . th og en Sal m o n el la spp . Ca mpyl ob ac te r spp . E. col i O157 L. m onocyt o g enes Tot al duc t Il l ( y -1 ) Re l. ri sk (% ) Il l ( y -1 ) Re l. ri sk (% ) Il l ( y -1 ) Rel . ris k (%) Il l ( y -1 ) Rel . ris k (%) Il l ( y -1 ) ar ieg at ed le tt uc e mi x 1 * (Bo nte sla m ix 1 *) 0 0 .002 1. 9E + 01 0. 157 7. 4E + 02 6. 0 ar ieg at ed le tt uc e mi x 2 * (Bo nte sla m ix 2 *) 0 0. 002 ar ieg at ed le tt uc e mi x 3 * (Bo nte sla m ix 3 *) ≥3 > 0. 025 ≥7. 6E + 01 m il y Su m m er m ix (Fam ili e Z om er m ix ) 1 0. 006 1 tc h raw ve ge tab le s (Holland se rauwk os t) 0 0 0 eb er g l et tu ce f ri se e m ix (I Js be rg sl a fr is ee m ix) 1 0. 006 1 la d di sh (S al ad es ch ot el ) 1 0. 004 1 amb ’s le tt uc e mi x (V el ds la m ix) 0 0. 001 0 ak le af le tt uce bl end (Ei ke nb la dsla m el an ge ) 3. 1E + 01 0. 248 3 .1E + 01 ak le af le tt uce bl end ( re ta il ) (Ei ke nb lad sl am el an ge (r et ail )) 0 0 0 xe d I ce be rg le tt uce (Gem en gd e i js be rg sl a) 0 0. 001 0 eb er g l et tu ce f ri se e m ix (I Js be rg sl a fr is ee m ix) 0 0 .001 2. 3E+ 03 19 2. 3E + 03 s alad (I ta li aa ns e s alad e) 1. 1E + 02 0. 896 1 .1E + 02 cono m y s iz e m ix ed le ttu ce ord ee lv er pa kk in g g em en gd e sa lad e) 0 0. 001 0 otal ≥6 > 0. 004 1. 6E + 02 0. 100 7. 4E + 02 0. 461 2. 3E+ 03 1. 461 ≥3 .2E + 03 50 1. 31E + 05 897 100 1. 00E+ 05 ll /inf 100 % 33 % 100 % 100 % ri ega ted let tu ce m ix ( B on te s lam ix ) 1, 2 a nd 3 refer t o s Q M R A ou tp ut fo r th e 3 di ffere nt c on ce nt rat io ns in iti al ly fou nd on th e pr od uc e (i .e . 1. E nd iv e w ith 0 .01 9, 0 .0 24 an d >0 .2 81 c fu g -1 r espe ctiv el y)
Summary of t he sQMR A tool r es ponse sc ena rio’s appli ed t o all produ cts th at contain at l ea st on e of the pr oduce fo und pos itiv e for the m icrobes under s tudy. Effect of produc e washi ng has been inclu ded here (86 % , Table 9). The “Total” n umbe rs under the horizonta l line in dicate th e poin t esti m at es for th e nu mber of people ill from the s epar ate test ed micr obes ove r a ll pr oducts . Th e “Total” numbe rs to the ri ght of the ve rtica l li ne pr esent th e sa me fi gu res f or th e separate prod ucts over all the microb es test ed . Furth ermor e, the assumed ID50 valu es and Fill values have b ee n indicate d. N ote that a cha nge in th e ID 50 or Pil l/i nf wi ll r esult in a li near change of the risk in thi s line ar part of the dose-re sponse curve. og en Sal m o n el la sp p. C a m p ylob act er sp p. E. col i O157 L. m onocyt o g enes Tot al t Il l ( y -1 ) Re l. ri sk (% ) Il l ( y -1 ) Re l. ri sk (% ) Il l ( y -1 ) Rel . ris k (%) Il l ( y -1 ) Rel . ris k (%) Il l ( y -1 ) at ed le tt uc e mi x 1 * (Bo nte sla m ix 1 *) 0 0 3 0. 022 1. 0E + 02 0. 843 at ed le tt uc e mi x 2 * (Bo nte sla m ix 2 *) 0 0 at ed le tt uc e mi x 3 * (Bo nte sla m ix 3 *) ≥0 ≥0 .003 ≥1. 0E + 02 y Su m m er m ix (Fam ili e Z om er m ix ) 0 0. 001 0 ve ge tab le s (Holland se rauwk os t) 0 0 0 g l et tu ce f ri se e m ix (I Js be rg sl a fr is ee m ix) 0 0. 001 0 sh (S al ad es ch ot el ) 0 0. 001 0 ’s le tt uc e mi x (V el ds la m ix) 0 0 0 af le tt uce bl end (Ei ke nb la dsla m el an ge ) 4 0. 035 4 af le tt uce bl end ( re ta il ) (Ei ke nb lad sl am el an ge (r et ail )) 0 0 0 d I ce be rg le tt uce (Gem en gd e i js be rg sl a) 0 0 0 g l et tu ce f ri se e m ix (I Js be rg sl a fr is ee m ix) 0 0 3. 3E+ 02 2. 7 3. 3E + 02 s alad (I ta li aa ns e s alad e) 1. 5E + 01 0. 125 1 .5E + 01 m y s iz e m ix ed le ttu ce ee lv er pa kk in g g em en gd e sa lad e) 0 0 0 ≥0 ≥0 2. 2E + 01 0. 014 1. 0E + 02 0. 065 3. 3E+ 02 0. 208 31E + 05 897 100 1. 00E+ 05 100 % 33 % 100 % 100 % ga te d l ett uce m ix ( B on te sl am ix ) 1, 2 an d 3 re fe r to s Q MRA o ut put f or the 3 d if fe re nt c on ce ntr atio ns in it ia ll y fo un d o n th e uc e (i .e . 1. E nd iv e w ith 0 .01 9, 0 .0 24 an d >0 .2 81 c fu g -1 r espe ctiv el y)
5 Conclusions and discussion
Output of the sQMRA tool for general microbial exposure levels from mixed salads in the Netherlands
is in the range of 1E+05 to (≥) 1E+06 y-1 (and 1E+04 to 1E+05 y-1 when including the produce washing
and dilution through mixing reduction-factor of 86 %) for Salmonella spp., Campylobacter spp. and E. coli O157. The exposure risk point estimate for L. monocytogenes turned out to be considerably
higher, i.e. 1E+08 (and 1E+07) y-1 without (and with) using the reduction factor. The individual (per
pathogen/mixed salad combination) exposure risk point estimates are, except for L. monocytogenes in “iceberg lettuce frisee mix” and Salmonella spp. in “variegated lettuce mix”, all below 10 % compared to the risk estimate for Campylobacter spp. in chicken filet. The relative exposure level risk point estimate for L. monocytogenes in “iceberg lettuce frisee mix” is > 5000 % (and > 700 % including the reduction factor) compared to the reference data.
The point estimate for the number of ill people associated with microbes in mixed salads, assuming
washing of produce has no effect on the contamination levels, is for Salmonella spp. ≥ 6 y-1, for
Campylobacter spp. 160 y-1, for E. coli O157 740 y-1 and for L. monocytogenes 2300 y-1. If the point
estimate for the washing and dilution through mixing step reduction-factor (86 %) is applied then the
number of cases become ≥ 0 y-1 for Salmonella spp., 22 y-1 for Campylobacter spp., 100 y-1 for
E. coli O157 and 330 y-1 for L. monocytogenes. Still, the individual (per pathogen/mixed salad
combination) risk point estimates are all below 20 % compared to the risk estimate for Campylobacter spp. in chicken filet.
In calculating a relative risk estimate using the sQMRA tool one should be aware that the input parameters only reflect point estimates of the variables and uncertain parameters. The tool does not account for variability of the process parameters and microbial dynamics nor for uncertainty in the prevalence and concentration estimates.
Important sources of variability and uncertainty for a quantitative microbial risk estimate from the consumption of raw salads turned out to be:
Variability:
1. the division of produce over products;
2. product production figures;
3. human consumption patters (i.e. portion size, fraction consumed in relation to what is
produced);
4. dilution of the pathogen concentration on the produce due to the and mixing step in the cutting
companies;
5. pathogen prevalence;
6. pathogen concentration;
Uncertainty:
1. contribution of the large cutting companies to the total production/consumption figures of
mixed salads;
2. dilution of the pathogen concentration on the produce due to the washing step in the cutting
companies;
3. reduction of the pathogen concentration per mixed salad bag with respect to the separate
produce concentration due to mixing;
4. pathogen prevalence estimates from a survey;
5. pathogen concentration estimates from a survey;
6. dose response relation in the Dutch population for the separate pathogen/matrix combinations.
A further model assumption is that pathogens are homogeneously spread over the produce.
A full quantitative microbial risk assessment will quantify the variability and uncertainty that underlie the risk estimate for exposure to pathogens from the consumption of mixed salads. Such a full risk assessment would reveal the risk as a probability density distribution reflecting natural population variability. With that, such a distribution would show the possibility of extreme exposure values and human cases of illness (i.e. the tails of the distributions having a low probability of occurrence). Including uncertainty distributions for the parameter estimates in a full QMRA will increase insight in the tails of the distribution even more. And, it is often the tail of these distributions that determine the risk (Nauta and Havelaar 2008; Rosenquist et al. 2003; Rieu et al. 2007). Including variability and uncertainty distributions in a full QMRA would enable us to get insight in the current reasoning
concerning the likeliness of relating recent outbreak data, e.g. Friesema et al. (in preparation), to current survey results. In other words, could the results of this survey, with generally low prevalence and concentration estimates, result in an outbreak or are outbreaks associated with microbial contamination of raw produce more likely to stem from incidentally high point contaminations?
The drawback of the potential of increasing insight in the human risk when composing a full QMRA is still in the lack of data, particularly in the dose response relationship for these pathogen/mixed salad combinations.
Data gaps for the dose response relationship will also in a full QMRA still form a large source of uncertainty.
Dose-response models are part of a RA and used in translating exposure assessment data into a risk on infection. Information on dose-response processes, however, is scarce and the little data available is mostly derived from non-representative human volunteer studies or from studies using an animal system. In these studies, usually laboratory adapted strains are used, cultured under conditions different from those found in food products. More and more information becomes available showing that the behaviour of micro-organisms grown under laboratory conditions strongly differs from that of bacteria present in food products (De Jong et al. 2008; Wijnands et al. accepted). This was found both for the level of heat resistance and for the ability of food borne pathogens to survive the human stomach. Recently, the behaviour of Campylobacter on the surface of chicken meat was found to differ significantly from the behaviour in broth upon heating (De Jong et al. 2008). In a recent Salmonella outbreak, cheeses produced from raw milk were found to be the vehicle of Salmonella. The level of contamination of these cheeses appeared to be as low as 4 cfu’s of Salmonella per kilo. Moreover, the
microorganism was very unevenly distributed in the cheese, indicating that the matrix and the
distribution of a microorganism in a matrix do play important roles. What role do food products play in the dose response relationship? Do storage conditions affect the virulence? These are questions that need to be answered in order to build more process based dose response models which can then be used in QMRA.
Acknowledgement
We gratefully acknowledge Ellen Delfgou-van Asch, Marieke Mensink, Alice van der Meij-Florijn and our colleagues from the five VWA departments and the two processing companies for their contribution to a year round produce and product sample collection and analysis. In addition, we would like to thank Rob de Jonge (RIVM), Paul In ‘t Veld (VWA) and Jan van Kooij (VWA) and the QA managers from the processing companies for helpful discussions during the set up and implementation of the survey. We are grateful to Eric Evers (RIVM) for discussing the application of the sQMRA tool.