National Institute for Public Health and the Environment
P.O. Box 1 | 3720 BA Bilthoven www.rivm.com
Disease burden of food-related
pathogens in the Netherlands, 2011
RIVM letter report 330331006/2013
Colofon
© RIVM 2013
Parts of this publication may be reproduced, provided acknowledgement is given to the 'National Institute for Public Health and the Environment', along with the title and year of publication.
Martijn Bouwknegt
Ingrid H.M. Friesema
Wilfrid van Pelt
Arie H. Havelaar
Contact:
Arie Havelaar
RIVM/CIb/LZO
arie.havelaar@rivm.nl
This investigation has been performed by order and for the account of Ministery of Public Health, welfare and Sports, within the framework of Programma 5
Abstract
Disease burden of food-related pathogens in the Netherlands, 2011
The Ministry of VWS has requested RIVM to present an annual update on the number of illnesses caused by 14 enteric pathogens. These pathogens can be transmitted by food, the environment, animals and humans. The number of persons who are ill and who die from the infections is expressed in DALYs (Disability Adjusted Life Years), a measure of the disease burden in the population. The total disease burden caused by the 14 pathogens decreased from 14,900 DALY in 2010 to 13,900 DALY in 2011. The share of foodborne transmission in this burden decreased from 6,440 to 6,230 DALY.
The decrease in disease burden was a result of a decrease in the incidence of disease by Salmonella spp., rotavirus, norovirus and hepatitis A virus.
Furthermore, fewer persons died from an infection with Listeria monocytogenes compared to 2010. The number of perinatal listeriosis cases has doubled, increasing the burden of perinatal listeriosis by 50% compared to 2010 to 156 DALY per year in 2011. The incidence of campylobacteriosis continued to
increase in 2011. Furthermore, an overall increasing trend in norovirus incidence was observed in the period 2001-2011, despite the decrease in 2011 compared to 2010. No explanation for the trends is available.
This research results in more insight in the true incidence of foodborne diseases and the associated disease burden. The Dutch Food and Consumer Product Safety Authority (NVWA) and Regional Health Services register and investigate outbreaks of foodborne disease in the Netherlands. However, the majority of foodborne diseases is not reported.
Keywords:
Rapport in het kort
Ziektelast van via voedsel overdraagbare pathogenen in Nederland in 2011
Op verzoek van het ministerie van VWS onderzoekt het RIVM jaarlijks hoeveel mensen ziek worden van 14 darmpathogenen. Deze infecties kunnen worden overgedragen via voedsel, het milieu, dieren en de mens. Het aantal mensen dat ziek wordt van een infectie of eraan overlijdt, wordt uitgedrukt in DALY’s
(Disability Adjusted Life Year); een maat voor gezondheidsverlies onder de bevolking. De ziektelast die door de 14 darminfecties in totaal werd veroorzaakt daalde van 14.900 DALY in 2010 naar 13.900 DALY in 2011. Het deel van deze ziektelast dat alleen via voedsel werd overgedragen, daalde van 6.440 tot 6.230 DALY.
De daling in de ziektelast via voedsel komt doordat er ten opzichte van 2010 minder mensen ziek zijn geworden van een infectie met de Salmonella spp., het rotavirus, het norovirus en het hepatitis A-virus. Daarnaast zijn er minder mensen overleden als gevolg van een infectie met Listeria monocytogenes. Het aantal baby’s met een Listeria infectie is wel gestegen in 2011, waardoor de bijbehorende ziektelast met 50% steeg tot 156 DALY. Het aantal infecties met de Campylobacter-bacterie bleef ook in 2011 stijgen. Daarnaast is over de periode 2001-2011 een toenemende trend gezien in het aantal mensen dat ziek wordt van het norovirus, ondanks de daling in 2011 ten opzichte van 2010. Een verklaring voor de trends is niet voorhanden.
De resultaten van dit onderzoek bieden handvaten om meer zicht te krijgen op het daadwerkelijke aantal voedselinfecties dat mensen jaarlijks oplopen en de ziektelast die daardoor wordt veroorzaakt. De Nederlandse Voedsel- en Warenautoriteit (NVWA) en GGD’en registeren en onderzoeken in Nederland uitbraken van voedselinfecties en -vergiftigingen. Het merendeel van de infecties wordt echter niet gemeld.
Trefwoorden:
Contents
Summary—6 1 Introduction—7 2 Methods—8 2.1 Trend information—8 2.2 Model corrections—8 2.3 Disease burden—9 3 Results—10 3.1 Trend information—10 3.2 Disease incidence—103.3 Disease burden by pathogen—11 3.4 Attribution—11
4 Discussion—12
Summary
Since 2008, RIVM regularly publishes estimates of the incidence, burden and costs of 14 enteric pathogens on its web pages. In this report, trend information from epidemiological surveillance and demographic information is used to update the information to the year 2011. Compared to 2010, the incidence of campylobacteriosis increased by 2% and the incidence of salmonellosis decreased by 13%. The incidence of gastroenteritis by rotavirus decreased by 49% and by norovirus with 12% (based on all hospitalisations for viral
gastroenteritis). For norovirus a generally increasing trend in incidence was nevertheless observed in the period 2001-2011. The incidence of acquired listeriosis was similar to 2010 with 79 cases. The incidence of perinatel listeriosis increased from 4 to 9 cases. There were 4 fatal cases of acquired listeriosis, considerably less than in 2010 (13). The incidence of STEC O157 increased by 25% compared to 2010. The incidence of hepatitis A decreased by 52% to a comparable level as in 2009. Trends in cryptosporidiosis and giardiasis were extrapolated from surveillance data up to 2007. No trend information was available for bacterial toxins and toxoplasmosis.
Because of the generally lower incidence, there was also a decrease in the burden of all pathogens except for campylobacteriosis and perinatal listeriosis. Perinatal listeriosis was the disease outcome with the highest individual burden among all pathogens. The total burden of the 14 pathogens decreased with 7% from 14,900 to 13,900 DALY. The burden of foodborne disease decreased with 3% from 6,440 to 6,230 DALY. The largest decrease (12%) in the attribution of DALYs was estimated for human-human transmitted and travel related disease (related to strong decreases in virus incidences). Among food pathways, all estimated DALYs decreased compared to 2010, with the largest decrease (7%) for dairy, for (shell-)fish and for other foods. The highest burden was attributed to pork followed by poultry and beef/mutton. Foods of animal origin caused 43% of all cases, but 66% of the burden due to food, indicating that the pathogens associated with these foods tend to cause more severe infections than
pathogens associated with other foods.
The changes in incidence and burden as presented in this report need to be interpreted with care due to limitations in the available trend information for specific pathogens. The observed decreases in 2011 compared to 2010 are within the range of observed disease incidence in the previous decennium except for campylobacteriosis and norovirus cases. No explanation for the increasing trends for Campylobacter and norovirus is available.
1
Introduction
Since 2008, RIVM regularly publishes estimates of the incidence, burden and costs of food-related disease on its web pages in the “Nationaal Kompas Volksgezondheid”1. The estimates of the disease burden are expressed in
Disability Adjusted Life Years. The methodology for these estimates is described in detail in peer-reviewed paper (1). Data in that paper referred to the year 2009, and an update based on data for the year 2010 has been presented (2). In this report, trend information from epidemiological surveillance and
demographic information was used to update the information to the year 2011.
1
2
Methods
2.1 Trend information
Data on the size and age distribution of the Dutch population, as well as mortality risks and the number of live births and stillbirths were obtained from Statistics Netherlands2.
Trend information on the incidence of gastro-enteritis (GE) by pathogen in the general population and consulting the general practitioner was obtained from the following sources (partly also presented in (3)):
Thermophilic Campylobacter spp.: laboratory surveillance;
Shiga-toxin producing Escherichia coli O157 (STEC O157): active surveillance; Non-typhoidal Salmonella spp.: laboratory surveillance;
Norovirus: hospitalisation for viral gastro-enteritis (ICD code 86); Rotavirus: laboratory surveillance;
Perinatal and acquired listeriosis: active surveillance; Hepatitis-A: OSIRIS (mandatory notifications);
Cryptosporidium spp.: a stable incidence since 2003 was assumed, based on
laboratory surveillance data from 2001 to 2007;
Giardia spp.: a continuing decrease with the rate observed between 2001 and
2007 was assumed;
No trend information was available for the GE toxin-producing bacteria (Bacillus
cereus, Clostridium perfringens and Staphylococcus aureus), hepatitis-E and
toxoplasmosis.
Trends in hospitalizations for gastro-enteritis as primary cause (ICD codes 20-93; 558.9) were obtained from the National Medical Register up until 2010. For 2011 these data were obtained from Dutch Hospital Data (DHD). Data for 2006-2010 were extracted from the DHD database to ascertain that the change in data source did not affect the estimated number of hospitalizations. Estimates were indeed similar (data not shown).
Age-specific excess mortality risks from campylobacteriosis and salmonellosis were assumed constant. Fatalities due to STEC O157 were from active surveillance. Age-specific case fatality ratios for norovirus and rotavirus,
originally obtained from German surveillance data, and for protozoan pathogens, originally obtained from the international literature, were assumed constant.
2.2 Model corrections
Three coding errors in the 2009 model were corrected, all three relating to acquired listeriosis. The probability of meningitis for 2009 was corrected from 39% to 30%. Including 2010 data did not change this estimate. A correction for comorbidity in fatal cases of acquired listeriosis by reducing the statistical life expectancy by 50% had not been implemented and is now included in the model. The proportion of children under 18 years among cases hospitalised for gastroenteritis was changed from 18 to 38% in 2009, this was 35% in 2010. Furthermore, the percentages of attribution of cases and DALYs to pathways and foods were more refined by including one more decimal.
2.3 Disease burden
Disease burden calculations were not changed; hence all differences in results will reflect the impact of trends in the underlying information on demographics and pathogen incidence.
3
Results
3.1 Trend information
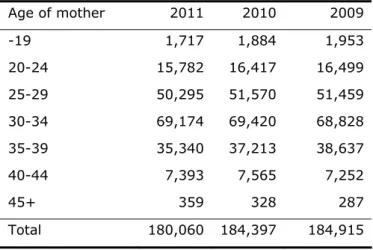
The number of inhabitants in the Netherlands slightly increased from 16.6 million in 2010 to 16.7 million in 2011 (Table 1). There was a slight decrease in the number of persons below 18 years of age. Survival tables for 2010 were not available from Statline at the time of finalizing the model calculations for this report (01 November 2012). The number of live births decreased from 184,400 in 2009 to 180,060 in 2011 (Table 2). The age of mothers was fairly similar in the two years with a decrease in the number of births from mothers in all age classes. The number of stillbirths (24 weeks or more gestational age) in 2011 was 620, somewhat lower than 648 in 2010. The number of hospitalizations for gastroenteritis decreased with 6% from 23,871 to 22,500.
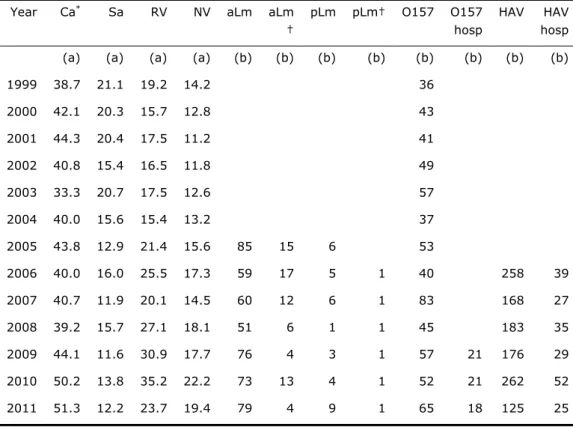
Trend information for specific pathogens is presented in Table 3. A summary of trends (in comparison with 2010) is discussed below:
The incidence of campylobacteriosis (laboratory confirmed cases)
increased by 2% from 50.2 to 51.3 cases per 100,000 inhabitants; there is a significantly increasing 5-year trend (p=0.02) since 2007 with an annual increase of 5%.
The incidence of salmonellosis (laboratory confirmed cases) decreased by 13% from 13.8 to 12.2 per 100,000 inhabitants; nevertheless there is no significant 5-year trend (p=0.84) since 2007.
The incidence of gastroenteritis by rotavirus (laboratory confirmed cases) decreased by 49% from 35.2 to 23.7 cases per 100,000 inhabitants; there is no significant trend (p=0.50) since 2007.
The incidence of hospitalizations for viral gastroenteritis (a proxy for the incidence of gastroenteritis by norovirus) decreased by 12% from 22.2 to 19.4 cases per 100,000 inhabitants; however, there is an increasing trend (p<0.001) since 2001 with an average increase of 0.97 cases per 100,000 inhabitants per year or 6% per year.
The incidence of acquired listeriosis (active surveillance) was 79 cases, similar to previous years. There were 4 fatalities, considerably less than the exceptionally high number of 13 fatal cases in 2010. The statistical life expectancy of fatal cases was 13.8 years; in the DALY model half of this life expectancy is used for calculating years of life lost to correct for
comorbidity. Including new data from 2011, the probability of developing meningitis as a consequence of acquired listeriosis was updated to 28% (95% confidence interval 25-36%).
The incidence of perinatal listeriosis (active surveillance) was 9 cases with 1 fatality. There were also 2 abortions before gestational age of 24 weeks. These are not included in the DALY estimations. The number of perinatal cases was higher than in previous years, while the mortality was the same.
The incidence of diseases caused by STEC O157 (active surveillance) was 65 with 18 hospitalizations. The number of STEC cases was higher than in most previous years, but the number of hospitalised cases was similar. There were no fatal cases (2 in 2010).
The incidence of hepatitis A (notified cases) decreased to 125, with 25 hospitalizations; both lower than in the years 2006-2010.
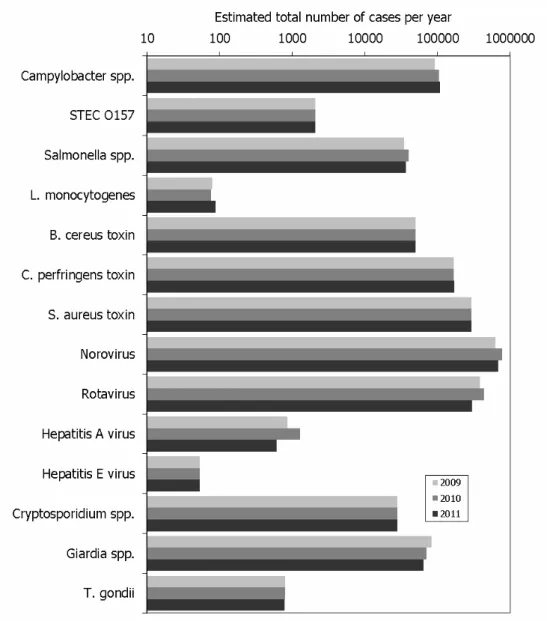
3.2 Disease incidence
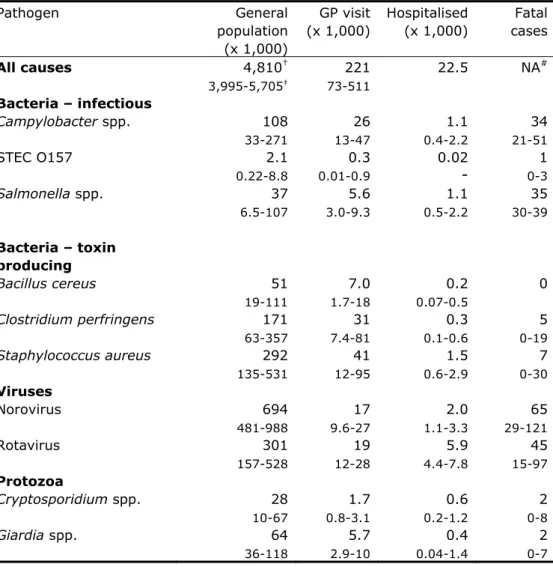
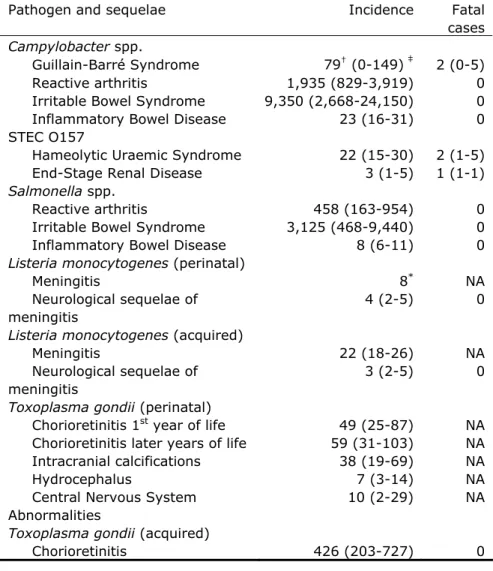
The incidence of gastroenteritis by pathogen, of non-gastrointestinal pathogens and sequelae by pathogen in 2011 is presented in Tables 4-6, and Figure 1. There were increases in the incidence of campylobacteriosis, listeriosis and STEC
O157 at all levels of the surveillance pyramid while the incidence of salmonellosis, giardiasis, and viral infections except of hepatitis E-virus decreased in comparison to 2010. The estimated incidence for the latter viral infection and the remaining pathogens was unchanged as no trend information was available. The estimated total number of cases by the 14 pathogens
decreased from 1,990,000 to 1,750,000 and was comparable to the estimate for 2009. In comparison with 2010, there were considerably more sequelae due to listeriosis (12 in 2011 vs. 4 in 2010).
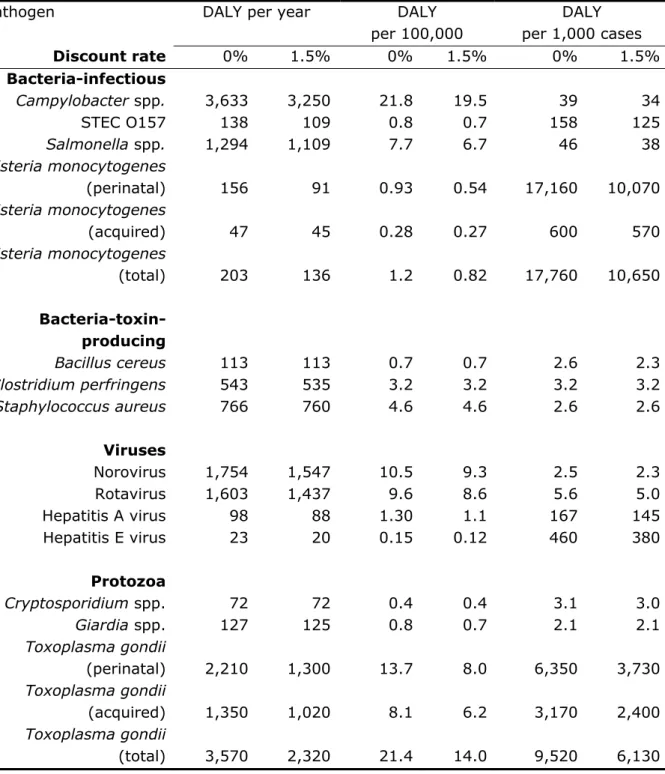
3.3 Disease burden by pathogen
The burden by pathogen is presented in Table 7 and Figures 1-2. In general, estimates for 2011 were lower than for 2010, except for campylobacteriosis, acquired toxoplasmosis and perinatal listeriosis. The largest relative difference with 2010 was observed for acquired listeriosis and hepatitis A-virus, the latter with about 50% decrease in burden. Due to the high number of perinatal listeriosis cases, its burden increased considerably (from 108 to 156 DALY), resulting in a corresponding increase in the burden per 1,000 cases. Perinatal listeriosis was the disease outcome with the highest individual burden among all pathogens (27.2 DALY per case). The total burden of the 14 pathogens
decreased with 7% from 14,900 to 13,900 DALY. The standardized burden (per 100,000) decreased in parallel with the total burden. Overall there were small changes in the individual burden with the exception of listeriosis, which decreased from 28,680 to 17,760 DALY per 1,000 cases, mainly due to fewer fatal cases.
3.4 Attribution
Attribution results are presented in Tables 8-9. The burden of foodborne disease decreased with 3% from 6,440 to 6,230 DALY. The largest decrease was
estimated for human-human transmitted and travel related disease, decreasing with about 12% to 2,400 and 1,300 DALY, respectively (related to the strong decreases in virus incidence). Among food pathways, all estimated DALYs decreased compared to 2010, with the largest decrease (7%) for dairy, for (shell-)fish and for other foods. The highest burden was attributed to pork (21%) followed by poultry (18%) and beef/mutton (15%). Foods from animal origin caused 43% of all cases but 66% of the burden due to food, indicating that the pathogens associated with these foods tend to cause more severe infections than pathogens associated with other foods.
4
Discussion
The disease burden of 14 enteric pathogens decreased by 1,000 DALY from 14,900 DALY in 2010 to 13,900 DALY in 2011. The share of foodborne
transmission in this burden decreased from 6,440 to 6,230 DALY. The decrease was a result of a decrease in the incidence of cases by Salmonella spp.,
norovirus, rotavirus and hepatitis A virus and an decrease in fatal cases by
Listeria monocytogenes. Of two of these (Salmonella spp., and rotavirus), trend
data are based on laboratory surveillance, for hepatitis A virus on disease notification. The observed decreases in these disease incidences in 2011
compared to 2010 are within the range of those in the previous decennium. The incidence of campylobacteriosis continued to increase in 2011 and was
approximately 25% higher than in the previous decennium (see Table 3). No explanation for this increase is available. For norovirus, no direct trend information is available, and therefore this is estimated from trends in
hospitalisation for viral gastroenteritis, which includes also rotaviruses. Hence the trend in norovirus incidence may be overestimated. The incidence of listeriosis was lower than in 2010, and similar to levels before 2010. The total listeriosis burden decreased in comparison to 2010, with a 50% increase in the burden for perinatal listeriosis and a 56% decrease in acquired listeriosis due to fewer fatalities. There is no trend information available on bacterial toxins and toxoplasmosis while trends for Cryptosporidium spp. and Giardia spp. are extrapolated from trends until 2007, when systematic surveillance was discontinued. Attribution data used in this report are based on an expert elicitation study, conducted in 2006 (Havelaar et al., 2008). No time-trends in the expert estimates are available. As a consequence, the changes in incidence and burden as presented in this report need to be interpreted with care.
Acknowledgement
The authors thank Margaret Wilson (Risk Science International, Ottawa, Canada) for support in developing the stochastic simulation model.
References
1. Havelaar AH, Haagsma JA, Mangen MJ, Kemmeren JM, Verhoef LP, Vijgen SM, et al. Disease burden of foodborne pathogens in the Netherlands, 2009. Int J Food Microbiol. 2012 Jun 1;156(3):231-8.
2. Havelaar AH, Friesema IHM, Van Pelt W. Disease burden of food related pathogens in the Netherlands, 2010. Bilthoven, the Netherlands: National Institute for Public Health and the Environment, 2012 Contract No.: 330331004/2012.
3. Aalten M, de Jong A ,Stenvers O, Braks M, Friesema I, Maassen K, van Pelt W, Schimmer B, Geenen P. State of zoonotic diseases 2010. Bilthoven, the Netherlands: National Institute for Public Health and the Environment, 2011. Report no.
330291007.
Table 1. Population in the Netherlands by age group, 2009-11
Age group 2011 2010 2009 0 184,007 184,586 184,408 1-4 739,099 740,295 747,148 5-11 1,394,007 1,405,533 1,405,232 12-17 1,184,970 1,184,064 1,191,453 18-64 10,558,770 10,522,183 10,485,731 65+ 2,594,946 2,538,328 2,471,815 Total 16,655,799 16,574,989 16,485,787Table 2. Live births by age of mothers in the Netherlands, 2009-11
Age of mother 2011 2010 2009 -19 1,717 1,884 1,953 20-24 15,782 16,417 16,499 25-29 50,295 51,570 51,459 30-34 69,174 69,420 68,828 35-39 35,340 37,213 38,637 40-44 7,393 7,565 7,252 45+ 359 328 287 Total 180,060 184,397 184,915
Table 3. Trends in incidence of food-related pathogens, 1999-2011
Year Ca* Sa RV NV aLm aLm †
pLm pLm† O157 O157 hosp
HAV HAV hosp (a) (a) (a) (a) (b) (b) (b) (b) (b) (b) (b) (b)
1999 38.7 21.1 19.2 14.2 36 2000 42.1 20.3 15.7 12.8 43 2001 44.3 20.4 17.5 11.2 41 2002 40.8 15.4 16.5 11.8 49 2003 33.3 20.7 17.5 12.6 57 2004 40.0 15.6 15.4 13.2 37 2005 43.8 12.9 21.4 15.6 85 15 6 53 2006 40.0 16.0 25.5 17.3 59 17 5 1 40 258 39 2007 40.7 11.9 20.1 14.5 60 12 6 1 83 168 27 2008 39.2 15.7 27.1 18.1 51 6 1 1 45 183 35 2009 44.1 11.6 30.9 17.7 76 4 3 1 57 21 176 29 2010 50.2 13.8 35.2 22.2 73 13 4 1 52 21 262 52 2011 51.3 12.2 23.7 19.4 79 4 9 1 65 18 125 25
Data sources: see text
*
Ca: Campylobacter spp.; Sa: Salmonella spp., RV: rotavirus, NV:
norovirus; aLm: acquired listeriosis, pLm: perinatal listeriosis, †: fatal
cases; O157: STEC O157; HAV: hepatitis A-virus; hosp: hospitalized.
(a) per 100,000 inhabitants
Table 4. Incidence of gastroenteritis by pathogen in the Netherlands,
2011 (population 16.7 million)
Pathogen General population (x 1,000) GP visit (x 1,000) Hospitalised (x 1,000) Fatal cases All causes 4,810† 3,995-5,705‡ 221 73-511 22.5 NA# Bacteria – infectious Campylobacter spp. 108 33-271 26 13-47 1.1 0.4-2.2 34 21-51 STEC O157 2.1 0.22-8.8 0.3 0.01-0.9 0.02-
0-31 Salmonella spp. 37 6.5-107 5.6 3.0-9.3 1.1 0.5-2.2 35 30-39 Bacteria – toxin producing Bacillus cereus 51 19-111 7.0 1.7-18 0.2 0.07-0.5 0 Clostridium perfringens 171 63-357 31 7.4-81 0.3 0.1-0.6 5 0-19 Staphylococcus aureus 292 135-531 41 12-95 1.5 0.6-2.9 7 0-30 Viruses Norovirus 694 481-988 17 9.6-27 2.0 1.1-3.3 65 29-121 Rotavirus 301 157-528 19 12-28 5.9 4.4-7.8 45 15-97 Protozoa Cryptosporidium spp. 28 10-67 1.7 0.8-3.1 0.6 0.2-1.2 2 0-8 Giardia spp. 64 36-118 5.7 2.9-10 0.4 0.04-1.4 2 0-7 †mean
‡2.5-97.5 percentile
#not available
Table 5. Incidence of non-gastrointestinal pathogens in the Netherlands,
2011
Pathogen Incidence Fatal cases
Listeria monocytogenes Perinatal 9* 1 Acquired 79 4 Hepatitis A virus 612† 391-989‡ 2 1-3 Hepatitis E virus 53 31-81 1 0-1 Toxoplasma gondii Perinatal 364 189-637 13 7-22 Acquired^ 426 203-727 0
*
No uncertainty because Listeria cases were acquired through active
surveillance
†
mean
‡
2.5-97.5 percentile
^Chorioretinitis only
Table 6. Incidence of sequelae by pathogen in the Netherlands, 2011
†
mean
‡
2.5-97.5 percentile
*
No uncertainty because cases were acquired through active
surveillance
NA: Not applicable (fatal cases reported in Table 2)
Pathogen and sequelae Incidence Fatal cases
Campylobacter spp.
Guillain-Barré Syndrome 79† (0-149) ‡ 2 (0-5) Reactive arthritis 1,935 (829-3,919) 0 Irritable Bowel Syndrome 9,350 (2,668-24,150) 0 Inflammatory Bowel Disease 23 (16-31) 0 STEC O157
Hameolytic Uraemic Syndrome 22 (15-30) 2 (1-5) End-Stage Renal Disease 3 (1-5) 1 (1-1)
Salmonella spp.
Reactive arthritis 458 (163-954) 0 Irritable Bowel Syndrome 3,125 (468-9,440) 0 Inflammatory Bowel Disease 8 (6-11) 0
Listeria monocytogenes (perinatal)
Meningitis 8* NA
Neurological sequelae of meningitis
4 (2-5) 0
Listeria monocytogenes (acquired)
Meningitis 22 (18-26) NA
Neurological sequelae of meningitis
3 (2-5) 0
Toxoplasma gondii (perinatal)
Chorioretinitis 1st year of life 49 (25-87) NA Chorioretinitis later years of life 59 (31-103) NA Intracranial calcifications 38 (19-69) NA
Hydrocephalus 7 (3-14) NA
Central Nervous System Abnormalities
10 (2-29) NA
Toxoplasma gondii (acquired)
Table 7. Overall disease burden, disease burden per 100.000 inhabitants
and mean disease burden per case of illness in the Netherlands, 2011
Pathogen
DALY per year
DALY
per 100,000
DALY
per 1,000 cases
Discount rate
0%
1.5%
0%
1.5% 0%
1.5%
Bacteria-infectious
Campylobacter spp.
3,633
3,250
21.8
19.5 39 34
STEC O157
138
109
0.8
0.7 158 125
Salmonella spp.
1,294
1,109
7.7
6.7 46 38
Listeria monocytogenes
(perinatal) 156
91
0.93
0.54 17,160 10,070
Listeria monocytogenes
(acquired) 47
45
0.28
0.27 600 570
Listeria monocytogenes
(total)
203
136
1.2
0.82 17,760 10,650
Bacteria-toxin-producing
Bacillus cereus
113
113
0.7
0.7 2.6 2.3
Clostridium perfringens
543
535
3.2
3.2 3.2 3.2
Staphylococcus aureus
766
760
4.6
4.6 2.6 2.6
Viruses
Norovirus 1,754
1,547
10.5
9.3 2.5 2.3
Rotavirus 1,603
1,437
9.6
8.6 5.6 5.0
Hepatitis A virus
98
88
1.30
1.1 167 145
Hepatitis E virus
23
20
0.15
0.12 460 380
Protozoa
Cryptosporidium spp.
72
72
0.4
0.4 3.1 3.0
Giardia spp.
127
125
0.8
0.7 2.1 2.1
Toxoplasma gondii
(perinatal) 2,210
1,300
13.7
8.0 6,350 3,730
Toxoplasma gondii
(acquired) 1,350
1,020
8.1
6.2 3,170 2,400
Toxoplasma gondii
(total)
3,570
2,320
21.4
14.0 9,520 6,130
Transmission
pathway
Food Environment
Human
Animal
Travel Total
*
Incidence
(x 1000)
689
† 315-1,325‡215
120-380612
377-96489
45-169143
79-2611,750
936-3,100Fatal cases
74
42-13836
19-6370
30-13617
10-2723
13-40219
114-404Disease burden
(DALY per year,
not discounted)
6,230
3, 400-11,3002,870
1,730-4,7702,430
1,320-4,2401,130
650-2,0801,280
740-2,33013,940
7,840-24,700Disease burden
(DALY per year,
discounted)
5,150
2,650-9,7702,260
1,320-3,862,140
1,180-3,740990
540-1,8701,110
610-2,05012,650
6,300-21,300 †mean
‡2.5-97.5 percentile
Food group
Beef/
mutton
Pork Poultry
Eggs
Dairy
shellfish
Fish/
Fruit/
veg.
Bever-
ages
Cereals
Other
foods
Human/an
imal
Total
Incidence
(x 1000)
107
† 41-223‡46
19-8963
24-13823
9-4856
25-11057
30-10342
20-7816
8-3042
19-77122
55-239116
67-193689
316-1,330Fatal cases
8.6
4.5-198.9
5.7-1512
8.3-195.4
4.2-7.35.3
3.3-106.3
3.4-125.5
2.9-101.8
1.1-3.33.0
1.5-5.85.0
2.0-1312
5.4-2374
42-138Disease burden
(DALY per year,
not discounted)
956
503-1,7701320
804-2,0501,130
637-2,130256
133-512449
249-853401
223-732386
215-68099
52-200186
81-364464
190-970586
319-1,0606,230
3,410-11,320Disease burden
(DALY per year,
discounted)
768
370-1,500927
564-1,540999
548-1,510224
108-475392
199-757343
181-641314
169-58090
44-186162
72-343426
168-923505
265-9245,140
2,650-9,780 †mean
‡2.5-97.5 percentile
Figure 1. Comparison of incidence of food-related pathogens in 2009 through 2011
Figure 2. Comparison of disease burden of food-related pathogens in 2009 through 2011
Annex. Detailed results Summary of results
Pathogen
Incidence
(per year)
Deaths (per
year)
Disease burden
(DALY)
Campylobacter spp.
107,670 34.4
3,633
STEC O157
2,128
4.0
138
L. monocytogenes
88 5.0 203
Salmonella spp.
37,055
34.7
1,294
B. cereus toxin
50,554
0.0
113
C. perfringens toxin
170,587
4.6
543
S. aureus toxin
291,919
7.2
766
Hepatitis-A virus
609
1.9
98
Hepatitis-E virus
53
0.6
23
Norovirus 694,383
65.4
1,754
Rotavirus 300,902
45.1
1,603
Cryptosporidium spp.
28,216 1.7
72
Giardia spp.
64,284 1.8
127
Toxoplasma gondii
790 12.8 3,573
Totaal
1,749,238 219
13,940
Main pathway
Food Environment Human Animal Travel TotalIncidence (per year) 689,447 215,121 89,273612,474 142,923 1,749,238
Deaths (per year) 74 36 70 17 23 219
Disease burden (DALY) 6,231 2,871 2,427 1,131 1,280 13,940
Disease burden (DALY, discounted) 5,155 2,262 2,137 990 1,112 11,656
Attribution of incidence by pathogen to main pathways
Pathogen
Food Environment Human Animal Travel TotalCampylobacter 45,222 22,180 6,783 20,565 12,920 107,670 STEC O157 855 367 218 438 250 2,128 L. monocytogenes 60 6 5 5 12 88 Salmonella 20,279 4,756 3,429 3,392 5,199 37,055 B. cereus toxine 45,183 552 602 552 3,665 50,554 C. perfringens toxine 154,309 3,730 3,561 3,561 5,426 170,587 S. aureus toxine 254,479 10,530 9,360 6,435 11,115 291,919 Hepatitis-A virus 67 68 111 - 363 609 Hepatitis-E virus 7 13 4 6 23 53 Norovirus 117,692 98,307 34,615383,538 60,231 694,383 Rotavirus 39,117 51,153 9,027174,825 26,780 300,902 C. parvum 3,380 7,809 7,724 3,778 5,525 28,216 G. lamblia 8,356 15,364 22,307 6,879 11,378 64,284 T. gondii 441 286 7 20 36 790 Total 689,447 215,121 89,273612,474 142,923 1,749,238
Pathogen
Food Environment Human Animal Travel Totaal Campylobacter 14.4 7.1 2.2 6.6 4.1 34.4 STEC O157 1.6 0.7 0.4 0.8 0.5 4.0 L. monocytogenes 3.4 0.3 0.3 0.3 0.7 5.0 Salmonella 19.0 4.5 3.2 3.2 4.9 34.7 B. cereus toxine 0.0 0.0 0.0 0.0 0.0 0.0 C. perfringens toxine 4.1 0.1 0.1 0.1 0.1 4.6 S. aureus toxine 6.3 0.3 0.2 0.2 0.3 7.2 Hepatitis-A virus 0.2 0.2 0.4 0.0 1.1 1.9 Hepatitis-E virus 0.1 0.2 0.0 0.1 0.3 0.6 Norovirus 11.1 9.3 36.1 3.3 5.7 65.4 Rotavirus 5.9 7.7 26.2 1.4 4.0 45.1 C. parvum 0.2 0.5 0.5 0.2 0.3 1.7 G. lamblia 0.2 0.4 0.6 0.2 0.3 1.8 T. gondii 7.2 4.6 0.1 0.3 0.6 12.8 Total 73.7 35.7 70.3 16.5 22.9 219.1Pathogen
Food Environment Human Animal Travel Total Campylobacter 1,526 748 229 694 436 3,633 STEC O157 56 24 14 28 16 138 L. monocytogenes 140 14 11 11 27 203 Salmonella 708 166 120 118 182 1,294 B. cereus toxine 102 1 1 1 8 113 C. perfringens toxine 492 12 11 11 17 543 S. aureus toxine 667 28 25 17 29 766 Hepatitis-A virus 9 11 18 0.01 60 98 Hepatitis-E virus 2 6 2 3 10 23 Norovirus 298 248 969 87 152 1,754 Rotavirus 209 272 931 48 143 1,603 C. parvum 8 20 20 10 14 72 G. lamblia 17 30 44 14 22 127 T. gondii 1,997 1,291 32 89 164 3,573 Total 6,231 2,871 2,427 1,131 1,280 13,940Food group
Beef &
Lamb Pork Poultry Eggs Dairy
Fish &
shellfish Produce Beverages Grains
Other foods
Humans &
animals Total
Incidence (per year) 107,290 45,943 62,724 22,597 55,790 57,397 41,778 16,378 122,065 115,75541,732 689,447
Deaths (per year) 9 9 12 5 5 6 6 2 3 5 12 74
Disease burden (DALY) 956 1,315 1,133 256 449 401 386 99 186 464 586 6,231
Pathogen
Beef & Lamb Pork Poultry Eggs DairyFish &
shellfish Produce Beverages Grains
Other foods Humans & animals Total Campylobacter 1,854 2,306 1,40224,374 4,025 3,166 2,397 769 1,040 1,492 2,397 45,221 STEC O157 377 55 26 18 63 25 61 31 25 30 144 855 L. monocytogenes 7 6 4 2 15 11 5 2 4 3 3 62 Salmonella 2,555 2,900 3,001 4,502 1,338 831 1,278 629 872 1,217 1,156 20,279 B. cereus toxine 3,253 1,581 723 1,627 2,621 904 904 768 7,636 1,08424,082 45,183 C. perfringens toxine 73,759 12,962 4,32110,956 6,327 10,64710,030 3,858 4,012 5,55511,882 154,309 S. aureus toxine 19,086 20,613 8,39819,849 14,76037,408 5,090 4,581 75,32519,086 30,283 254,478 Hepatitis-A virus - - - - - 8 9 3 3 2 42 67 Hepatitis-E virus - 5 - - - - 1 - - - 1 7 Norovirus 3,766 3,648 3,413 2,236 2,354 8,59218,242 3,648 6,120 5,885 117,69259,788 Rotavirus - 1,095 - - 665 7,589 9,310 1,721 2,934 1,760 39,11714,043 C. parvum 886 149 98 91 311 737 700 101 - 101 206 3,380 G. lamblia 1,646 401 259 - 643 1,078 2,758 267 - 276 1,028 8,356 T. gondii 101 222 21 - 20 16 26 - - 10 25 441 Total 107,290 45,943 22,59762,724 55,790 57,397 41,778 16,378 122,065 115,75541,732 689,447
Pathogen
Beef & Lamb Pork Poultry Eggs DairyFish &
shellfish Produce Beverages Grains
Other foods Humans & animals Total Campylobacter 0.6 0.7 7.8 0.4 1.3 1.0 0.8 0.2 0.3 0.5 0.8 14.4 STEC O157 0.7 0.1 0.0 0.0 0.1 0.0 0.1 0.1 0.0 0.1 0.3 1.6 L. monocytogenes 0.4 0.3 0.2 0.1 0.9 0.6 0.3 0.1 0.2 0.2 0.2 3.4 Salmonella 2.4 2.7 2.8 4.2 1.3 0.8 1.2 0.6 0.8 1.1 1.1 19.0 B. cereus toxine 0.0 0.0 0.0 0.0 0.0 0.0 0.0 0.0 0.0 0.0 0.0 0.0 C. perfringens toxine 2.0 0.3 0.3 0.1 0.2 0.3 0.3 0.1 0.1 0.3 0.1 4.1 S. aureus toxine 0.5 0.5 0.5 0.2 0.9 0.4 0.1 0.1 0.5 1.9 0.7 6.3 Hepatitis-A virus 0.0 0.0 0.0 0.0 0.0 0.0 0.0 0.0 0.0 0.0 0.1 0.2 Hepatitis-E virus 0.0 0.1 0.0 0.0 0.0 0.0 0.0 0.0 0.0 0.0 0.0 0.1 Norovirus 0.4 0.3 0.3 0.2 0.2 1.7 0.8 0.3 0.6 0.6 5.6 11.1 Rotavirus 0.0 0.2 0.0 0.0 0.1 1.1 1.4 0.3 0.4 0.3 2.1 5.9 C. parvum 0.1 0.0 0.0 0.0 0.0 0.0 0.0 0.0 0.0 0.0 0.0 0.2 G. lamblia 0.0 0.0 0.0 0.0 0.0 0.0 0.1 0.0 0.0 0.0 0.0 0.2 T. gondii 1.6 3.6 0.3 0.0 0.3 0.3 0.4 0.0 0.0 0.2 0.4 7.2 Total 8.6 8.9 12.3 5.4 5.3 6.3 5.5 1.8 3.0 5.0 11.5 73.7
Pathogen
Beef & Lamb Pork Poultry Eggs DairyFish &
shellfish Produce Beverages Grains
Other foods Humans & animals Total Campylobacter 63 78 822 47 136 107 81 26 35 50 81 1,526 STEC O157 24 4 2 1 4 2 4 2 2 2 9 56 L. monocytogenes 16 13 9 5 34 25 11 4 8 8 7 140 Salmonella 89 101 105 157 47 29 45 22 30 43 40 708 B. cereus toxine 7 4 2 4 6 2 2 2 17 54 2 102 C. perfringens toxine 235 41 35 14 20 32 34 12 13 38 18 492 S. aureus toxine 50 54 52 22 98 39 13 12 50 198 79 667 Hepatitis-A virus - - - - - 1 1 - - - 7 9 Hepatitis-E virus - 2 - - - - - - - - - 2 Norovirus 10 9 9 6 6 46 22 9 15 15 151 298 Rotavirus - 6 - - 4 40 50 9 16 9 75 209 C. parvum 2 - - - 1 2 2 - - - 1 8 G. lamblia 3 1 1 - 1 2 5 1 - 1 2 17 T. gondii 457 1,002 96 - 92 74 116 - - 46 114 1,997 Total 956 1,315 1,133 256 449 401 386 99 186 464 586 6,231
National Institute for Public Health and the Environment
P.O. Box 1 | 3720 BA Bilthoven www.rivm.com