Campylobacteriosis and sequelae in the Netherlands
Estimating the disease burden and the cost-of-illness
M.J.J. Mangen1,2, A.H. Havelaar3, G.A. de Wit2
1 Wageningen University and Research Centre, Agricultural
Economics Research Institute, P.O. Box 29703, 2502 LS, Den Haag.
2 National Institute for Public Health and the Environment,
Centre for Prevention and Health Services Research, P.O. Box 1, 3720 BA Bilthoven
3 National Institute for Public Health and the Environment,
Microbiologal Laboratory for Health Protection, P.O. Box 1,
This investigation has been performed by order and for the account of the Ministry of Public Health, Welfare and Sports and the Ministry of Agriculture, Nature and Food Quality, within the framework of project V/250911, CARMA: Campylobacter Risk Management and
Abstract
Campylobacteriosis and sequelae in the Netherlands - Estimating the disease burden and the cost-of-illness
Each year, approximately 80,000 persons per year (range 30,000 – 160,000) are estimated to experience symptoms of acute gastro-enteritis as a consequence of infection with
Campylobacter bacteria. On average 18,000 patients consult a general practitioner and 500 patients are hospitalised; for some 30 cases the disease could be fatal. Additionally, each year some 1400 cases of reactive arthritis, 60 cases of Guillain-Barré syndrome and 10 cases of inflammatory bowel disease are associated with a previous Campylobacter infection. The disease burden and the cost-of-illness of Campylobacter infections and sequelae were estimated using a stochastic simulation model. Disease burden was expressed in Disability Adjusted Life Years (DALYs), the sum of years of life lost and years lived with disability, weighted for the severity of disease. Considered in the cost-of-illness were direct health-care costs (e.g. doctors’ consultations, hospitalisation, rehabilitation), direct non-health-care costs (e.g. travel costs of patients, co-payments by patients) and indirect non-health-care costs (productivity losses), using cost estimates for the year 2000. The disease burden associated with Campylobacter infections was estimated at 1200 DALYs per year, with a 90%
uncertainty interval of between 900 and 1600 DALYs per year. The costs-of-illness were estimated to total € 21 million per year with a 90% confidence interval of between € 11 million and € 36 million per year. Hence, Campylobacter infections pose an important public health problem for the Netherlands and incur substantial costs.
Preface
This report is part of the CARMA (Campylobacter Risk Management and Assessment) project. The CARMA project is mainly focused on two key questions:
1) What are the most important routes by which the Dutch population is exposed to Campylobacter and can the contribution of these routes is quantified?
2) Which (sets of) measures can be taken to reduce the exposure to Campylobacter, what is their expected efficiency and societal support?
For the Netherlands, chicken meat was defined to be a major route of human Campylobacter infections - but not the only one. Therefore within the CARMA project it was decided to focus in first instance on the chicken meat production chain. Next to a risk assessment an economic evaluation is needed in order to answer the second key question. Within the CARMA project an economic evaluation of different interventions in the chicken meat chain to reduce human Campylobacter infections will take place in the form of a cost-effectiveness analysis. The costs of the intervention applied in the chicken meat chain will be related to ‘reduced’ burden of disease and ‘reduced’ costs of illness. This will result in a cost-effectiveness ratio that should express the relative efficiency of several policy options to reduce the number of Campylobacter infections. As a first step in such an economic evaluation, the disease burden and the cost-of-illness associated with Campylobacter infections and sequelae is estimated in this research report.
More information on the CARMA project can be found at the website www.rivm.nl/carma.
The authors would like to acknowledge a number of different people for their contributions to this study. There is, first of all, Rob Bernsen from the Jeroen Bosch Hospital in
s’Hertogenbosch; some of the members of the Department of Neurology at the Erasmus Medical Centre Rotterdam, especially Pieter van Doorn, Marcel Garssen, Bart Jacobs and Rinske van Koningsveld; and there is Marten Postma from the University of Groningen, all from the Netherlands. Further we would like to thank Margrit Ebinger from the University of Ulm, Germany, Timo Hannu from the Helsinki University Central Hospital, Finland, and Morten Helms and Henning Locht, both from the Statens Serum Institute, Denmark, for their contributions. And last but not least, we would like to thank our colleagues from the National Institute of Public Health and Environment for their various contributions to this study, mainly Winette van den Brandhof, Yvonne van Duijnhoven, Wilfrid van Pelt and Matty de Wit from the Centre for Infectious Disease Epidemiology, Peter Teunis from the Centre for Information and Technology and Methodology and Nancy Hoeymans from Centre for Public Health Forecasting.
Contents
Samenvatting...6
Executive summary...7
Methodological approach...7
Summarising the main results ...8
Estimated incidences of Campylobacter infections and associated sequelae... 8
Estimated disease burden due to Campylobacter infections and sequelae ... 9
Estimated cost-of-illness due to Campylobacter infections and sequelae ... 10
Sensitivity analysis... 13
Discussion of study results ... 13
1 Introduction...15
1.1 Background and objective ... 15
1.2 Outline of the report... 16
2 Conceptual approach ...17
2.1 Estimating annual incidences ...17
2.2 Estimating annual disease burden and cost-of-illness...18
2.2.1 Annual disease burden (DALYs)... 18
2.2.2 Cost-of-illness... 19
2.3 General modelling approach ... 21
2.4 Presentation of results ... 22
3 Campylobacter-associated gastro-enteritis cases...25
3.1 Background information... 25
3.2 Estimating annual incidence of Campylobacter-associated GE cases ... 25
3.2.1 Community-based cohort study ... 26
3.2.2 GP-based research ... 27
3.2.3 Laboratory-based surveillance systems ... 27
3.3 Estimating disease burden due to Campylobacter-associated GE cases ... 29
3.3.1 Duration of illness... 30
3.3.2 Disability weights ... 31
3.4 Estimating cost-of-illness due to Campylobacter-associated GE cases...31
3.4.1 Direct health care costs ... 31
3.4.2 Direct non-health care costs... 32
3.4.3 Indirect non-health care costs ... 33
3.5 Results... 34
3.5.1 Estimated annual incidence of campylobacteriosis cases ... 34
3.5.2 Estimated disease burden due to Campylobacter-associated GE cases ... 35
3.5.3 Estimated cost-of-illness due to Campylobacter-associated GE cases ... 37
3.5.4 Sensitivity analysis ... 39
3.6 Discussion ... 40
4 Campylobacter-associated reactive arthritis cases...43
4.1 Background information... 43
4.1.1 General background information ... 43
4.1.2 Genetic predisposition for ReA?... 43
4.2 Estimating annual incidence of Campylobacter-associated ReA cases ... 44
4.3 Estimating disease burden due to Campylobacter-associated ReA cases...46
4.3.1 Symptom length... 46
4.3.2 Symptom severity and quality of life... 47
4.4 Estimating cost-of-illness due to Campylobacter-associated ReA cases... 48
4.5 Results... 49
4.5.1 Estimated annual incidence of Campylobacter-associated ReA cases... 49
4.5.2 Estimated disease burden due to Campylobacter-associated ReA cases ... 50
4.5.3 Estimated cost-of-illness due to Campylobacter-associated ReA cases ... 51
4.5.4 Sensitivity analysis ... 52
5 Campylobacter-associated Guillain Barré syndrome cases ...57
5.1 Background information... 57
5.2 Estimating annual incidence of Campylobacter-associated GBS cases... 58
5.3 Estimating disease burden due to Campylobacter-associated GBS cases ... 60
5.3.1 Duration of illness... 60
5.3.2 Disability weights ... 61
5.4 Estimating cost-of-illness due to Campylobacter-associated GBS cases ...62
5.4.1 Direct health care costs ... 62
5.4.2 Direct non-health care costs... 69
5.4.3 Indirect non-health care costs ... 70
5.5 Results... 71
5.5.1 Estimated annual incidence of Campylobacter-associated GBS cases ... 71
5.5.2 Estimated disease burden due to Campylobacter-associated GBS cases ... 72
5.5.3 Estimated cost-of-illness due to Campylobacter-associated GBS cases ... 74
5.5.4 Sensitivity analysis ... 76
5.6 Discussion ... 76
6 Campylobacter-associated inflammatory bowel disease cases ...79
6.1 Background information... 79
6.2 Estimating annual incidence of Campylobacter-associated IBD cases...79
6.3 Estimating disease burden due to Campylobacter associated IBD cases ... 80
6.3.1 Symptom length and symptom severity... 80
6.3.2 Disability weights ... 80
6.4 Estimating cost-of-illness due to Campylobacter-associated IBD cases ... 81
6.4.1 Diagnostic costs and other related costs ... 81
6.4.2 Direct health care costs ... 82
6.4.3 Direct non-health care costs... 85
6.4.4 Indirect non-health care costs ... 86
6.5 Results... 87
6.5.1 Estimated annual incidence of Campylobacter-associated IBD cases ... 87
6.5.2 Estimated disease burden due to Campylobacter-associated IBD cases... 87
6.5.3 Estimated cost-of-illness due to Campylobacter-associated IBD cases... 88
6.5.4 Sensitivity analysis ... 90
6.6 Discussion ... 90
References ...93
Appendix I - Re-estimation of the SENSOR data...101
Appendix II - Effect of illness due to a Campylobacter infection on the person who was ill ...102
Appendix III - Productivity losses ...103
Appendix IV - Campylobacter-associated ReA incidence – summaries of earlier studies.104 Appendix IV - Campylobacter-associated ReA incidence (suite)...105
Appendix V - Distribution functions ...106
Appendix V - Distribution functions (continued I) ...107
Samenvatting
Naar schatting maken 80.000 personen per jaar (onzekerheidsinterval 30.000 – 160.000) een episode van gastro-enteritis door ten gevolge van infectie met Campylobacter bacteriën. Ongeveer 18.000 patiënten consulteren een huisarts, 500 patiënten worden in het ziekenhuis opgenomen en 30 patiënten overlijden als gevolg van de gastro-enteritis. Daarnaast treden er ieder jaar naar schatting 1400 gevallen van reactieve artritis op, 60 gevallen van Guillain-Barré syndroom en 10 gevallen van inflammatoire darmziekte ten gevolge van een voorgaande Campylobacter infectie. De ziektelast en de ziektegebonden kosten van Campylobacter infectie werden geschat met behulp van een stochastisch simulatiemodel. Ziektegebonden kosten in het basisjaar 2000 betroffen directe kosten in de gezondheidszorg (bijvoorbeeld consulten van een arts, ziekenhuisopname en rehabilitatie), directe kosten buiten de gezondheidszorg (bijvoorbeeld reiskosten en eigen bijdragen van patiënten) en de indirecte kosten buiten de gezondheidszorg, met name productiviteitsverlies. De ziektelast werd geschat op 1200 DALYs (Disability Adjusted Life Years) per jaar, met een 90% onzekerheidsinterval tussen 900 en 1600 DALYs per jaar. DALYs zijn de som van verloren levensjaren ten gevolge van voortijdige sterfte en jaren doorgebracht met een ziekte,
gewogen naar de ernst ervan. De ziektegebonden kosten werden geschat op ongeveer 21 miljoen Euro, met een 90% onzekerheidsinterval tussen 11 en 36 miljoen Euro per jaar. Campylobacter infecties vormen dus een belangrijk volksgezondheidsprobleem in Nederland.
Executive summary
Campylobacter infections in humans may cause acute gastro-enteritis (GE), which, in most cases, is self-limiting within a few days to weeks. For some patients the disease is fatal. Guillain-Barré Syndrome (GBS), reactive arthritis (ReA) and inflammatory bowel disease (IBD) are the most significant sequelae occurring occasionally after campylobacteriosis. Human Campylobacter infections pose an important public health problem in the
Netherlands.
With the availability of a more recent Dutch epidemiological study with a much lower estimated annual number of GE cases than in a study carried out in the earlier nineties, an update of a previous estimate of the disease burden associated with Campylobacter infections and sequelae in the Netherlands was necessary. This was the first objective of the current study. The second objective of this study was to estimate the cost-of-illness related to Campylobacter infections and their sequelae in the Netherlands.
Methodological approach
Using a stochastic simulation model we estimated the cost-of-illness and the disease burden associated with Campylobacter infections and sequelae. A previous disease burden estimate using Disability Adjusted Life Years (DALYs) was updated. We took into consideration each of the different health states associated with Campylobacter infection or its sequelae. For all four illnesses Dutch estimated disability weights were used. The estimated annual GE incidence was based on a recently conducted population study in the Netherlands (1996-1999). Estimates for symptom length and severity of GE were based on Dutch and English studies. Estimates of incidence, symptom length and severity of GBS were based on Dutch studies only. Estimates of incidence, symptom length and severity of ReA estimates were based on a recently published Finnish study (2002). The estimated incidence of
Campylobacter-associated IBD was based on a recent Danish registry-based study. Estimates of symptom length and severity of IBD were based on a published Markov chain model analysis of a population-based cohort study conducted in the United States.
Following the Dutch guidelines for human health care evaluation studies, we estimated the direct health care costs, direct non-health care costs and indirect non-health care costs associated with Campylobacter infection and its sequelae, using Dutch cost estimates for the year 2000. The direct health care costs considered included e.g. general practice (GP)
consultations, hospitalisation, drugs, rehabilitation and other medical services. Travel costs of patients and eventually co-payments by patients were considered as direct non-health care costs. Applying the friction cost method, we estimated the productivity losses (indirect non-health care costs) that occurred due to sickness leave and premature mortality, and also, in the case of GE, due to third persons taking care of sick persons. When the friction cost method is applied, production losses are only considered for the period that is needed to replace a sick, invalid or deceased worker, the so-called friction period.
Estimates of medical services used for the different illnesses were based, wherever available, on Dutch studies and data. In the case of ReA and IBD, we had to fall back on international literature. Despite all efforts made, information on the use of medical services and on the length of sickness leave of ReA patients was scarce.
The estimated disease burden and cost-of-illness with regard to the different illnesses associated with Campylobacter infections are presented both discounted and undiscounted. For this, we used the officially recommended discount rate in the Netherlands, which is 4%. Applying a discount rate is generally used to account for the fact that e.g. health today is valued higher than health in the future, and for the fact that there is uncertainty about future possibilities to ‘better’ treat diseases.
Summarising the main results
In this executive summary only the main results are shown. Details of the assumptions made in order to estimate the incidence, the disease burden and the cost-of-illness are given in Chapters 3, 4, 5 and 6 of this report for GE, ReA, GBS and IBD, respectively. In each of these chapters we also describe the different sensitivity analyses applied. Only assumptions that have an important impact on our final outcomes are discussed in this executive summary.
Estimated incidences of Campylobacter infections and associated
sequelae
The annual incidence of Campylobacter-associated GE cases in the Netherlands, with a population of 16 million, was estimated to be on average 79,000 cases with a 90% confidence interval (C.I.) of 28,000 to 162,000 GE cases (Table I). In nearly 30 cases GE is fatal (90% C.I.: 20-37). For some of the GE patients the Campylobacter infections resulted in sequelae. The estimated average annual incidence of sequelae was 1400 ReA cases, 59 GBS cases, of which 2 fatal, and 11 IBD cases (Table I). Most cases of Campylobacter infection in humans would result only in GE. Complications such as ReA, GBS or IBD, respectively, or fatal GE and fatal GBS cases after a Campylobacter infection, are relatively rare. Of all sequelae related to previous Campylobacter infections, ReA is by far the most occurring sequel.
Table I. The estimated mean and the attendant uncertainty1 of annual incidences of
Campylobacter-associated GE cases, ReA cases, GBS cases, IBD cases, fatal GE cases and fatal GBS cases, respectively, in the Netherlands.
Estimated annual incidence
5% Mean 50% 95% Morbidity GE cases 28,000 79,000 69,000 162,000 ReA cases 470 1,400 1,200 3,000 GBS cases 40 59 58 84 IBD cases 10 11 11 13 Mortality Fatal GE cases 20 28 27 37 Fatal GBS cases 1 2 2 3
1) The model parameters used in this study are often uncertain or are variable or both. We therefore not only
show for example the average annual incidence but also the 5th, 50th and 95th percentile, representing the
Estimated disease burden due to Campylobacter infections and
sequelae
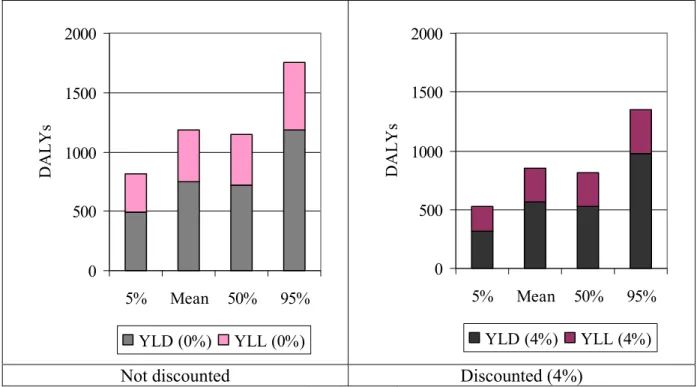
The estimated disease burden associated with Campylobacter infections and sequelae for the Netherlands is considerable, with on average 1185 DALYs with a 90% C.I. of 872 to 1623 DALYs per year (Table II). More than 50% of the estimated mean disease burden associated with Campylobacter infections and sequelae in the Netherlands is due to GE cases and associated mortality. About 25% is due to GBS cases and 10-11% is due to both IBD and ReA cases (Figure I). More than a third of the total estimated mean disease burden is due to mortality (Figure II). By discounting the disease burden by 4%, mortality still accounts for nearly a third of the total estimated disease burden.
Table II. Mean and attendant uncertainty of the estimated disease burden due to Campylobacter-associated GE cases, GBS cases, ReA cases, IBD cases and the sum of all illness cases, respectively, in the Netherlands (year 2000).
Disease burden
Not discounted Discounted (4%)
Description
5% Mean 50% 95% 5% Mean 50% 95%
Disability adjusted life years (DALYs)
GE 430 635 610 924 323 499 469 776
ReA 44 126 109 271 44 126 109 271
GBS 199 298 286 413 114 169 166 234
IBD 109 127 126 151 47 55 55 66
C. infections and sequelae 872 1185 1149 1623 581 850 817 1270
IBD 11% GE 54% GBS 25% ReA 10%
Figure I. Distribution of the estimated mean annual disease burden related to Campylobacter infections and sequelae by the different illnesses for 2000 (undiscounted figures).
0 500 1000 1500 2000 5% Mean 50% 95% DA L Y s YLD (0%) YLL (0%) 0 500 1000 1500 2000 5% Mean 50% 95% DA L Y s YLD (4%) YLL (4%)
Not discounted Discounted (4%)
Figure II. Mean and attendant uncertainty (5th, 50th and 95th percentile) of the estimated YLD and YLL,
respectively, due to Campylobacter infections and sequelae in the Netherlands (year 2000).
By dividing the average estimated DALYs by the average estimated annual incidence, we obtain an estimate of the ‘average’ DALYs/case. Chronic and long-lasting diseases, such as IBD and GBS, are responsible for a higher disease burden per patient than short disease episodes, such as gastro-enteritis. To obtain insight into the relative disease burden of all Campylobacter-associated diseases, we have summarised the estimated DALYs/1000 average cases for all four Campylobacter-associated illnesses and the estimated DALYs associated with Campylobacter infections and sequelae per initial GE cases. The results are summarised in Table III.
Table III. Mean estimate of DALYs/1000 cases for average GE cases, GBS cases, ReA cases and IBD cases, respectively, all associated with Campylobacter infections (year 2000).
Not discounted DALYs/ 1000 average cases
DALYs due to GE/GE cases 8
DALYs due to ReA/ReA cases 90
DALYs due to GBS/GBS cases 5,000
DALYs due to IBD/IBD cases 11,600
DALYs due to C.-infections and sequelae/GE cases 15
Estimated cost-of-illness due to Campylobacter infections and sequelae
The estimated cost-of-illness associated with Campylobacter infections and sequelae in the Netherlands for 2000 was considerable, with on average more than € 20 million per year (90% C.I. € 11 – 36 million, Table IV). Indirect non-health care costs accounted for nearly two-thirds of the estimated average total cost-of-illness, whereas direct health care costs accounted for approximately one-third. Direct non-health care costs were only of minor importance (Table IV).
Indirect non-health care costs, which were mainly productivity losses, accounted for
costs accounted for approximately 70% of the estimated cost-of-illness associated with IBD and GBS cases, respectively. The direct non-health care costs were only minor (less than 1% of total costs). The indirect non-health care costs related to GE cases are by far the greatest cost category in our estimated total cost-of-illness (Figure III). Therefore it is not surprising that indirect non-health care costs accounted for approximately two-thirds of the estimated average total cost-of-illness.
Table IV. Mean and attendant uncertainty of the estimated direct health care costs, direct non-health care costs, indirect non-health care costs and total costs, respectively, all related to Campylobacter infections and sequelae for 2000 (undiscounted figures).
Estimated costs (*1000 €) for the year 2000 Description
5% Mean 50% 95%
Direct health care costs 5,300 6,500 6,500 8,000
Direct non-health care costs 28 51 50 81
Indirect non-health care costs 5,300 14,000 12,600 29,300
Total costs 11,500 20,600 19,000 36,300 1 10 100 1000 10000 100000 GE GBS ReA IBD C os ts ( *1000 E U R O )
direct health care costs direct non-health care costs indirect non-health care costs
Figure III. The estimated mean direct health care costs, direct non-health care costs, and indirect non-health care costs due to Campylobacter-associated GE cases, GBS cases, ReA cases, and IBD cases, respectively, for 2000 (undiscounted figures).
For GE and ReA all costs were assumed to occur within the first year. In the case of GBS most costs would occur in the first years after disease onset and only for IBD, the associated costs of illness were assumed to be evenly spread over the remaining life years of the patients after disease onset. Given that IBD cases account for ~10% of the total costs, discounting has, as shown in Table V, only little impact on the estimated cost-of-illness related to
Campylobacter infections and sequelae.
Under the current assumptions, approximately two-thirds of the estimated mean cost-of-illness related to Campylobacter infections and sequelae in the Netherlands are made by GE cases (see Figure IV). Of the estimated mean cost-of-illness about 17% were estimated to be made by GBS cases and 9% by IBD cases. ReA cases accounted for only 1% of the estimated mean cost-of-illness. However, in the current study the costs of illness related to ReA cases were probably underestimated.
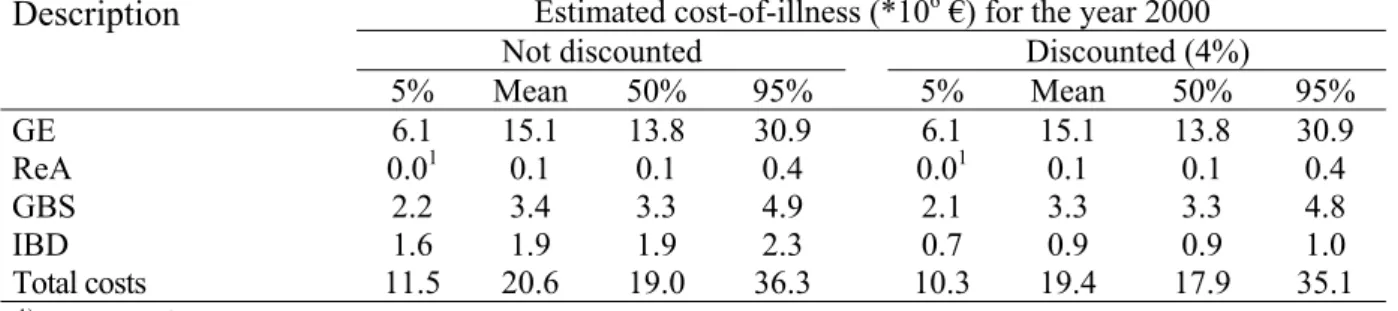
Table V. Mean and attendant uncertainty of the estimated cost-of-illness associated with Campylobacter infection and sequelae in the Netherlands, total and for each illness.
Estimated cost-of-illness (*106 €) for the year 2000
Not discounted Discounted (4%)
Description 5% Mean 50% 95% 5% Mean 50% 95% GE 6.1 15.1 13.8 30.9 6.1 15.1 13.8 30.9 ReA 0.01 0.1 0.1 0.4 0.01 0.1 0.1 0.4 GBS 2.2 3.4 3.3 4.9 2.1 3.3 3.3 4.8 IBD 1.6 1.9 1.9 2.3 0.7 0.9 0.9 1.0 Total costs 11.5 20.6 19.0 36.3 10.3 19.4 17.9 35.1
1) Less than € 0.1 million.
GE 73% GBS 17% ReA 0% IBD 10%
Figure IV. Distribution of the estimated mean total cost-of-illness due to Campylobacter infections and sequelae by the different illnesses for the year 2000 (undiscounted figures).
We further have summarised in Table VI the estimated mean cost-of-illness per estimated GE case, GBS case, ReA case and IBD case, respectively, for the year 2000. For GE cases, we have considered the average costs due to GE only/GE case and the average costs due to GE and sequelae/GE case. The estimated costs per estimated ReA cases might be underestimated, as already mentioned earlier. Especially chronic and long-lasting diseases such as GBS and IBD resulted in a high cost-of-illness per estimated case, as opposed to e.g. the relatively short GE episode/average case.
Table VI. Average estimate of cost-of-illness/cases for an average Campylobacter-associated GE case, GBS case, ReA case and IBD case, respectively, in the Netherlands for 2000 (undiscounted figures).
Average cost-of-illness (€)/average case
Costs due to GE/GE case 190
Costs due to ReA/ReA case 20
Costs due to GBS/GBS case 58,000
Costs due to IBD/IBD case 173,000
Sensitivity analysis
Due to model uncertainties and the non-availability of some data, assumptions had to be made. With the help of sensitivity analyses the impact of such assumptions was analysed. Details of the different assumptions and their impact on the results are discussed in the different chapters within this report. In the following paragraph we only summarize those assumptions that had an important effect on our results.
• The assumed length of symptoms and the assumed sickness leave of GE cases not visiting a GP (approximately two-thirds of all GE cases) had a major impact on the assumed cost-of-illness. For example, a half-day longer (shorter) sickness
leave/patient resulted in an increase (decrease) of the estimated total costs by more than € 1 million, whereas the impact on the estimated disease burden was relatively small.
• Given the large uncertainty of the population at risk to develop ReA after a
Campylobacter infection, the assumed annual incidence of ReA cases had a major impact on the estimated disease burden. Assuming that on average 1400, 400 and 5800 cases would develop ReA, this resulted in an average estimated disease burden of 126, 38 and 520 DALYs, respectively.
• More detailed knowledge about medicine use and sickness leave for ReA patients would probably result in a higher estimate of the cost-of-illness. But the total estimated costs due to ReA would probably remain to be the lowest costs of all sequelae associated with Campylobacter infections.
Discussion of study results
The annual incidences of Campylobacter-associated GE cases, ReA cases, GBS cases and IBD cases in the Netherlands, with a population of 16 million, was estimated to be on average ~ 79,000, 1400, 59 and 11 cases respectively. Most cases of Campylobacter infections in humans would result only in GE. Complications such as ReA, GBS or IBD, respectively, or fatal cases after Campylobacter infections are relatively rare. Of all sequelae related to previous Campylobacter infections, ReA is by far the most occurring sequel, but in most cases also by far the less severe sequelae. Even if we would assume that only positive
laboratory-confirmed Campylobacter infections could result in ReA, this would still be by far the most occurring sequel after a previous Campylobacter infection.
The estimated disease burden associated with Campylobacter infections and sequelae was, with on average nearly 1200 DALYs, slightly lower than the estimate of the previous Dutch disease-burden study, which was on average 1400 DALYs. The estimated number of fatal GE cases and the estimated YLL are in both studies comparable. In our study, disease burden due to non-fatal GE cases, ReA and GBS was always slightly lower than in the earlier study. In the case of non-fatal GE cases, the difference was mainly due to the lower annual incidence assumed in our study. Consequently the annual ReA incidence was assumed to be lower as well. Although we assumed the same annual GBS incidence, our estimate was slightly lower due to slightly elderly GBS patients. We used another more representative data set in our study that included more patients from a larger geographic area.
The greatest part of the estimated disease burden related to Campylobacter infections and sequelae was due to GE cases. But fatal GE cases, on average 30 cases, accounted for more than one-third of the total estimated disease burden related to GE cases. Further it has to be noted that patients with chronic and long-lasting illnesses, such as IBD and GBS, had a larger impact on the estimated disease burden than the large amount of non-fatal GE cases.
The population at risk for developing ReA after a Campylobacter infection needs to be better defined in future research. Assuming that: a) all Campylobacter-associated GE cases visiting a GP (BASE) develop ReA; b) only positive laboratory-confirmed Campylobacter cases develop ReA; or c) all Campylobacter-associated GE cases might develop ReA, large differences in the estimated annual incidence of ReA cases were found. Consequently, also the estimated disease burden related to ReA varied a lot. With a better estimate of the ‘real’ number of ReA cases, it might be expected that also the estimated cost-of-illness varies enormously. Future research is needed in order to get a more reliable estimate of the population at risk.
By applying the friction cost method, the estimated indirect non-health care costs related to chronic and/or long-lasting illnesses, and related to fatal cases, are by far lower than found in other studies. Former studies have used the human capital method, which is known for resulting in far higher estimates of productivity losses (potentially lost income as a
consequence of disease considered). Therefore, when comparing our estimates with cost-of-illness estimates of other studies, differences in study methodology should be taken into account.
Of the average estimated € 21 million total cost-of-illness, the greatest part was due to GE cases. Of these, the productivity losses due to sickness leave of GE cases played an important role. However, when comparing the estimated average costs per average case per illness, average IBD and average GBS patients were by far costlier to the Dutch society than for example GE patients.
Given that productivity losses due to sickness leave of GE cases were among the major costs of the total cost-of-illness related to Campylobacter infections and sequelae, better estimates of the length of sickness leave of especially GE patients not visiting a GP might help to improve the estimate. In case of for example half a day shorter sickness leave the estimate will have to be corrected downwards by more than € 1 million, whereas a longer sickness leave (+0.5 days) will raise the estimate of the cost-of-illness by more than € 1 million
Furthermore, newly available data, especially on ReA but also on additional aids and tools for GBS cases might help to improve the estimate of the cost-of-illness related to Campylobacter infections and sequelae. The latter cost component, however, will probably result in a higher estimate of the cost-of-illness than our estimate. Therefore, we regard the current estimate of the cost-of-illness related to Campylobacter infections and sequelae as an underestimation rather than an overestimation of the real costs.
Despite all the shortcomings of this study, we could update the previous estimate on the disease burden related to Campylobacter infections and sequelae, thereby using newly available data and knowledge. Further, this study is the first estimate of a cost-of-illness for the Dutch society considering not only Campylobacter-associated GE cases, but also associated sequelae. No earlier estimates of the cost-of-illness for the Dutch society
associated with ReA, GBS and IBD were available. And although in this study we considered only the costs related to Campylobacter-associated ReA, GBS and IBD cases, our results are a first step towards estimating the cost-of-illness of ReA, GBS and IBD.
1 Introduction
1.1 Background and objective
Approximately 70% of the roughly 1.5 billion annual episodes of diarrhoea in humans and 3 million deaths of children under the age of 5 world-wide are estimated to be due to foodborne pathogens (World Health Organisation (WHO), 2003). However, differences in available technology (e.g. refrigeration), plant and livestock hygiene standards, food production practices, cultural differences and geographic or climatic differences vary greatly among countries (Buzby et al., 1997a, b). Consequently, countries are not equally at risk from foodborne disease. Persons in developing countries with inadequate supplies of safe water and poor waste disposal are particularly susceptible. But in the industrialised world, foodborne pathogens also pose a problem. Campylobacter is the most commonly reported bacterial cause of acute gastro-enteritis in the industrialised world (Williams, 1999; Rodrigues et al., 2001; Wittenbrink, 2002). Different Campylobacter species exist, but Campylobacter jejuni is the most common isolated Campylobacter species in faeces of patients with diarrhoea (Blaser, 1997). Only 5-10% of campylobacteriosis is caused by other Campylobacter species, e.g. C. coli, C. lari, C. hyointestinalis, and others (Wittenbrink, 2002). Most campylobacteriosis cases are sporadic cases, and outbreaks are rarely identified (Rodrigues et al., 2001). In the Netherlands, with approximately 100,000 cases of acute gastro-enteritis annually, Campylobacter pose a serious public health problem (Havelaar et al., 2000a, b). Although Campylobacter gastro-enteritis is generally a mild and self-limiting illness, the symptoms can range from diarrhoea and lethargy, which lasts some days, to severe diarrhoea and abdominal pain (and occasionally fever) that lasts for several weeks (Anonymous, 2001; Withington and Chambers, 1997). And for some cases,
campylobacteriosis is even fatal (Havelaar et al., 2000a, b). Furthermore, Campylobacter infections in humans can lead to serious ongoing sequelae. The most common complications after Campylobacter infections are reactive arthritis (ReA); Guillain-Barré syndrome (GBS) and Miller-Fisher syndrome; inflammatory bowel disease (IBD) and bacteraemia, whereby the latter one is more common in immuno-compromised patients (Kist, 2002; Rautelin and Hanninen, 2000; Smith, 2002; Skirrow et al., 1993). Other, but less frequent post-infectious complications associated with previous Campylobacter infections described in the literature are: uveitits; haemolytic anaemia; haemolytic uraemic syndrome; carditis; encephalopathy; septic abortion; early miscarriage; polyneuropathy; cholecystitis; pancreatitis; cystitis and meningitis (Allos, 2001; Blaser, 1997; Bourke et al., 1998; Hannu et al., 2002; Kist, 2002; Peterson, 1994a). But the frequency of these latter post-infectious complications is so low that we could disregard them in the current study.
Havelaar et al. (2000a, b) estimated that campylobacteriosis and sequelae accounted for an annual loss of over a thousand healthy life years in the Netherlands in the years 1990-95, a considerable disease burden that is probably linked with a considerable economic loss. Van Den Brandhof et al. (2004) estimated the costs for patients with acute gastro-enteritis related to a Campylobacter infection to be ≈ € 9 million for the year 1999. These authors did not consider sequelae associated with Campylobacter infections. In another study where gastro-enteritis, but not sequelae, wasa considered, the costs of Campylobacter infections in the Netherlands were estimated at an annual amount of € 15 to 48 million in 1997 (Bunte et al., 2001). No estimate of the economic impact of Campylobacter infections and the
consequences of its sequelae, however, is available for the Netherlands. Therefore the first objective of this study is to estimate the cost-of-illness related to Campylobacter infections
and its sequelae for the Netherlands. Given the fact that a more recent population study by De Wit et al. (2001c) with a lower estimated annual number of gastro-enteritis cases than the one used by Havelaar et al. (2000a, b) is available the second objective of this study is, then, to update the previous disease burden estimate of Havelaar et al. (2000a, b), while also consulting newly available literature and clinical data.
1.2 Outline of the report
The results of this study were summarised and discussed as executive summary at the beginning of this report. Model description and assumptions made are described in more detail in the following chapters of this report. Chapter 2 of this report explains the theoretical framework used. In Chapter 3 we focus in more detail on the estimated disease burden and cost-of-illness estimates for gastro-enteritis linked to a Campylobacter infection. Finally, we look at the different sequelae associated with Campylobacter infections, reactive arthritis, Guillain-Barré syndrome and inflammatory bowel disease, in chapters 4, 5 and 6,
2 Conceptual approach
2.1 Estimating annual incidences
In order to estimate the cost-of-illness and the disease burden associated with Campylobacter infections and sequelae for the Netherlands in the year 2000, estimates of the annual
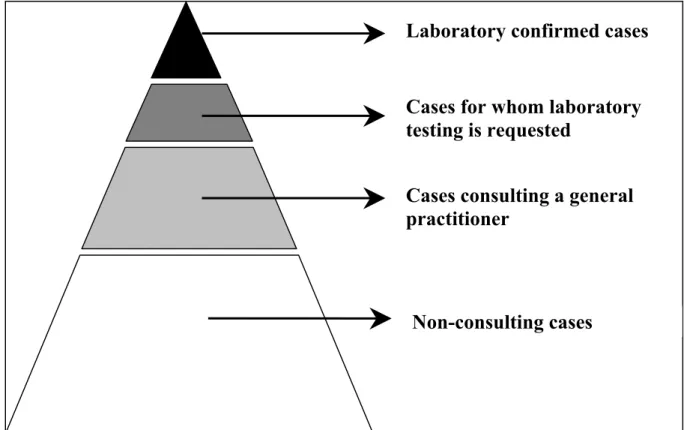
incidence of Campylobacter infections and sequelae are necessary. In the Netherlands, Campylobacter infections are reported, along with other infectious diseases of public health importance, to a surveillance program (Van Pelt et al., 2003). Acute gastro-enteritis, however, is in general a relatively mild disease and only a small proportion of patients seeks medical care. Furthermore, only a minority of cases attending their general physician (GP) require microbiological testing, only some of which lead to a positive result. The result is a pyramid of sources for surveillance of a pathogen/illness (e.g. gastro-enteritis), as shown in Figure 2.1. Consequently, such surveillance systems are incomplete compared to the true incidence of illnesses such as gastro-enteritis and others occurring in the surveyed population (McCarthy and Giesecke, 1999). Apart from laboratory reports, outbreak reports, surveillance in general practices and population-based surveys there are other data sources that might be used to estimate the annual incidence of a disease. However, according to Havelaar et al. (2000a) each data source is biased, and consequently the data must be interpreted with care.
Figure 2.1. Pyramid of sources for surveillance of gastro-enteritis (Source: De Wit, 2002) In this study we had to use different data sources in order to obtain the best possible estimate for annual incidences of acute gastro-enteritis (GE), ReA, GBS and IBD, respectively, all associated with Campylobacter infections. Specific details on the sources used in order to estimate the annual incidence for the different illnesses are given in the following Chapters.
Laboratory confirmed cases
Cases for whom laboratory
testing is requested
Cases consulting a general
practitioner
2.2 Estimating annual disease burden and cost-of-illness
Although Campylobacter gastro-enteritis is generally a mild and self-limiting illness,
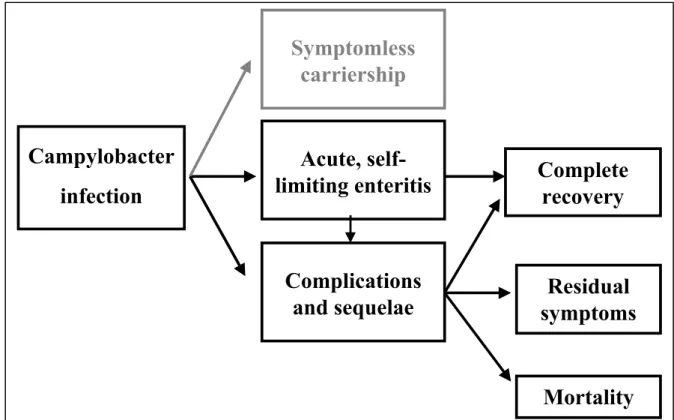
symptoms can range from diarrhoea and lethargy, which lasts a few days, to severe diarrhoea and abdominal pain (and occasionally fever) that lasts for several weeks. For some cases, the Campylobacter infection is even fatal. Further, Campylobacter infections in humans can lead to serious ongoing sequelae (Anonymous, 2001; Wittenbrink, 2002), see Figure 2.2.
Therefore apart of estimates on annual incidences, information on symptom severity and symptom duration is needed in order to estimate the disease burden and the cost-of-illness. Information on the assumptions made on symptom length and severity for the different illness and the different health states of illness, all associated with Campylobacter infections, is given in the following Chapters.
Figure 2.2. Campylobacter infection and the different illness and health states (based on Havelaar et al. (2000a)).
2.2.1 Annual disease burden (DALYs)
In order to estimate the annual disease burden, it was necessary to combine morbidity and mortality. One of the methods available to combine morbidity and mortality into one single metric unit is DALY (Disability Adjusted Life Years). The concept of DALYs aggregates the loss of health compared to ‘perfect’ health (Havelaar and Melse, 2003). DALYs is commonly used by the WHO to evaluate public health priorities. Further, many studies in different countries around the world are being conducted using DALYs (Lyttkens, 2003). In the Netherlands, the DALY methodology was used by the Dutch Public Health Forecasts study (Ruward and Kramers, 1997). This study estimated the disease burden in the Netherlands of 52 diseases as a combination of mortality and disability associated with these diseases.
Campylobacter
infection
Symptomless
carriership
Acute,
self-limiting enteritis
Complications
and sequelae
Complete
recovery
Residual
symptoms
Mortality
The DALY methodology adds up the sum of years of life lost (YLL) and years lived with disability (YLD):
DALY = YLL + YLD
YLL is the number of years of life lost due to mortality. YLL is calculated by accumulation over all fatal cases and all diseases of the expected individual life span (e) at the age of death. Thus:
YLL = ∑all diseases ∑all fatal cases (e)
The first step in the DALY approach is then to also specify life expectancy. Within this study we use standard Dutch life expectancy for age and sex for the year 2000 as reported by Statistics Netherlands. A detailed description of the standard life table used is given in Appendix 6 of Havelaar et al. (2003).
YLD is the number of years lived with disability. YLD is calculated by accumulation over all cases and all diseases of the product of the duration of the illness (t) and the disability weight (w):
YLD = ∑all diseases ∑all cases (t * w)
Each health effect is weighted for its severity, with death as the most severe outcome (weight 1) and perfect health as the best outcome (weight 0). For each specific health effect, the disability weight (w) is then multiplied by the duration (t) of this specific health effect, and by the number of people affected by the particular outcome. The estimated burden of disease, attributable to one agent, is obtained by adding up all the health outcomes caused by this agent (Havelaar and Melse, 2003).
The DALY metric requires quantification of the value of different disease state relative to full health. Dutch disability weights are available from several sources. The disability weights used for IBD and ReA were obtained from Stouthard et al. (1997) and for GE and GBS disability weights were obtained from Havelaar et al. (2000a, b). Both are Dutch studies, and the second study followed the protocol described by Stouthard et al. (1997).
The disability weights used for the different disability states of Campylobacter infections and sequelae will be described in the following chapters. Also, information on duration of
disability will be given in the various illnesses-specific chapters.
The estimated DALYs with regard to the different illnesses associated with Campylobacter infection are presented both discounted and not discounted. Applying a discount rate is generally used to account for the fact that health today is valued higher than health in the future, and for the fact that there is uncertainty about future possibilities to ‘better’ treat diseases.
2.2.2 Cost-of-illness
According to Hay and Hay (1992b) two different approaches are available to estimate costs of disease: the prevalence approach and the incidence approach. In the prevalence approach, illness costs are defined as ‘the stream of health care costs accruing to all patients alive during a specific time period’ (e.g., the annual disease costs for all IBD patients alive in 2000), taking into account the proportion of patients in each disease state during the specified
time period. ‘Under the incidence approach, the costs of disease are defined as the present discounted expected sum of current and future costs accruing to all incident cases of disease in a specific time period’ (e.g., the IBD incidence cohort of 2000), taking into account lifetime probabilities of transiting to each disease state (Hay and Hay, 1992b). Both methods produce the same results when aggregated across all patients and time periods. In order to estimate the costs associated with Campylobacter infections and sequelae, we mainly used the incidence approach in this study.
Following the guidelines of Oostenbrink et al. (2000), we estimate the cost-of-illness associated with Campylobacter infections and its sequelae for Dutch society as a whole. In our cost-of-illness study we consider direct health care costs and direct non-health care costs as well as indirect non-health care costs associated with Campylobacter infections and its sequelae, using cost estimates for the year 2000. The considered direct health care costs included such costs as doctor consultations (specialists and generalists), hospitalisation, drugs, rehabilitation and other medical services. Travel costs of patients and any co-payments by patients for costs such as informal care, if available, were considered as direct non-health care costs. Indirect non-health care costs, which are defined as the value of production lost to society due to disease, are considered. Production losses can be the consequences of: a) temporary absence from work; b) disability; and c) premature mortality. We estimated the productivity losses that occur due to sickness leave of sick people, and, where available, information on third persons taking care of patients. In accordance with the guidelines of Oostenbrink et al. (2000), this study does not consider ‘potential’ indirect health care costs. Indirect health care costs are the future costs of health care in life years gained through current medical intervention.
Studies that estimate indirect non-health care costs often use the human capital approach. The human capital approach estimates the value of potential lost production (or the potential lost income) as a consequence of disease. In the case of permanent disablement or premature death at a specific age the total productivity value (or income) from that age until the age of retirement is counted as productivity losses. But the real production losses for society might be smaller (Koopmanschap et al., 1995). In this study we therefore apply the friction cost method to estimate the indirect non-health care costs. In this method, production losses (indirect non-health care costs) are only considered for the period needed to replace a sick, invalid or dead worker, or ‘friction period’ (Koopmanschap et al., 1995; Koopmanschap and van Ineveld, 1992). The friction cost method takes into account the economic processes whereby a sick, invalid or dead person can and will be replaced after a period of adaptation (Koopmanschap and van Ineveld, 1992). The length of the friction period depends on the situation on the labour market. A high unemployment rate generally allows fast replacement of a sick, invalid or dead person, whereas in the case of a low unemployment rate, on average more time is needed to find someone on the labour market that could fill in the position of a sick, invalid or dead person. The unemployment rate in 2000 was comparable to the one in 1998. Using the estimated friction period of Oostenbrink et al. (2000) for the year 1998, we assume for the year 2000 a friction period of 123 days.
The estimations of the costs-of-illness for the different illnesses and the different health states are described in more detail in the following chapters. Results will be presented both
2.3 General modelling approach
Within this study we used the same modelling approach as Havelaar et al. (2003), who give a full description of the modelling approach. We therefore give here only a summary of the general modelling approach.
The formulas for disease burden and cost-of-illness are shown in basic notation: Disease burden Disability burden: 365 w t N
YLD = × × (healthy life years per year) where: Incidence of illness N (cases per year)
Duration of symptom t (days)
Disability weight w
Mortality burden: YLL=d×e (life years per year) where: Incidence of death d (cases per year)
Expected life span at the age of death e (years) Cost-of-illness
Direct health care costs: =
∑
× ×i i i i
c p m DHC
where: Cases using medical service i mi; for i = 1 to n # of medical service i/case pi; for i = 1 to n Cost/medical service i ci; for i = 1 to n
Direct non-health care costs: =
∑
× ×j j j j q c r DNHC
where: Cases using non-medical service j rj; for j = 1 to n # of non-medical services j/case qj; for j = 1 to n Cost /non-medical service j cj for j = 1 to n Indirect non-health care costs: INHC=s×u×v
where Cases of sickness leave s (cases per year)
Duration of sickness leave u (days); maximum 123 days per episode
Wage costs per day v (age dependent)
The model used in this study to estimate the disease burden and the cost-of-illness associated with Campylobacter infections and sequelae is built in Excel, using the add-in software program @Risk version 3.5.2 (Pallisade Corporation, Newfield, NJ, USA). It is a second order stochastic model. Given that real-life data are often limited and/or absent, every model builder has to deal with some degree of uncertainty and methodological controversy
(Drummond et al., 1997). Total uncertainty is broken down into variability and uncertainty (Vose, 2000). Variability is defined as ‘the inherent heterogeneity of a system’; e.g.
variations in the length of the hospital stay of different patients. Uncertainty is usually defined as ‘a lack of perfect knowledge about a factor in the model that represents the system’ (Vose, 2000). Variability cannot be reduced. However, with the availability of more information on a system, the uncertainty might be reduced. For example the incidence of
illness is not known but is estimated from observational data on a sample of the population. The uncertainty in the incidence rate can be represented by a statistical distribution. The mean or median of this distribution represents our best estimate of the true incidence rate, whereas the range between e.g. the 5th and 95th percentile represents our uncertainty about the true incidence. Any value that is sampled from this distribution represents one possible value of the true incidence rate, and it can be used as an input for a simulation of the variability of the disease burden over the years (Havelaar et al., 2003).
But not only is the incidence of illness uncertain, other parameters are as well. In this study we accounted for the uncertainty and variability for parameters describing the infection incidence, the illness duration and severity of campylobacteriosis and secondary sequelae. However, with regard to the costs/unit for the different cost categories to be considered in the estimation of the cost of illness and the estimates about the disability weights, costs/unit and weights/case will be considered as ‘given’, using their ‘best guess’, despite their uncertainty. For example, this means that the volumes of health care use are being treated as variable and uncertain, while costs/unit are regarded as ‘given’. The different distributions used to
describe uncertainty and variability of the different parameters will be described in each of the following disease-specific chapters, and are summarised in Appendix V.
According to Vose (1997) sensitivity analysis might be applied for the ‘scenario uncertainty’ (e.g. descriptive errors, aggregation errors, etc.) and/or model uncertainty (e.g. uncertainty due to necessary simplification of real-world processes, miss-specification of the model structure, etc.). By performing sensitivity analysis, we might identify those ‘parameters’ that are of most influence on the obtained results and conclusions, and also be able to quantify the extent of their influence. In this study we will pay special attention to the parameters for which a possible change in parameter values might result in a different conclusion of our study.
In order to reach the point where the percentile values for all defined outputs did change less than 1.5%, our convergence criteria, 1100 iterations were necessary. In order to account for uncertainty and variability, we run the model with 250 simulations and 1500 iterations per simulation. The time needed to run the model at least once was more than 24 hours. When doing sensitivity analysis, we therefore decided to apply only 1 simulation with
1500 iterations, using the average of uncertain parameters.
2.4 Presentation of results
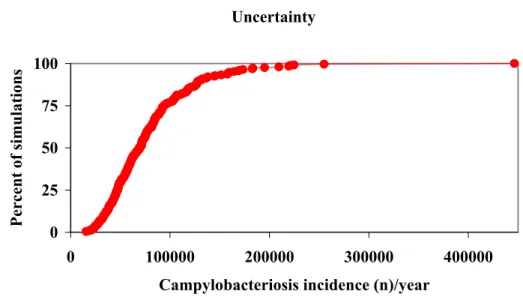
The model parameters used in this study are often uncertain or are variable or both. Results were therefore not only presented as averages but attendant uncertainty and/or variability was shown as well.
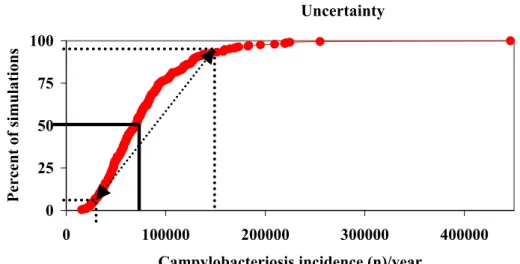
A useful way to represent the output data is by a cumulative distribution plot. Figure 2.3. shows such a cumulative plot of, for example, the estimated incidence of campylobacteriosis cases in the Netherlands. The lines in the graph show the interpretation of this plot. 50% of all output data is less than or equal to the corresponding value on the x-axis. In this way, any percentile can directly be read from the plot. The dotted lines in Figure 2.3 indicate the estimated 5th and 95th percentile, and the arrow between both points represents the attendant uncertainty range (90% confidence interval) of the estimated average.
Figure 2.3. Estimated cumulative probability of annual incidence of campylobacteriosis cases.
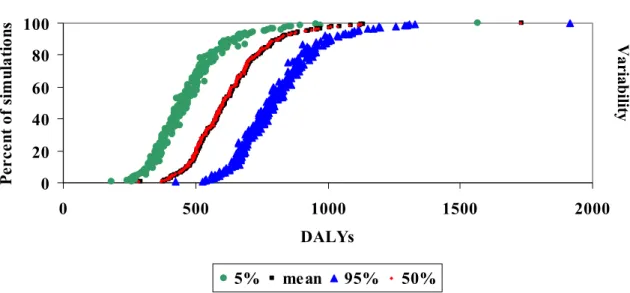
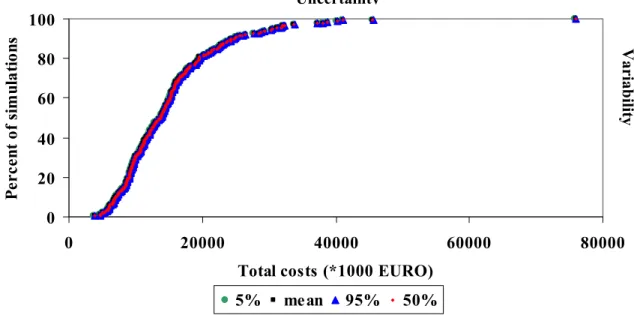
In the graphs such as shown below, we see 4 different cumulative frequency distributions. The red diamonds represent the uncertainty in the mean disease burden, as in the figure above. The additional information in the graph represents the variability in the disease burden, that would be observed if the population would be observed for several years. This variability is less important from a decision making point of view. We have therefore chosen to present only the uncertainty in the mean burden (or cost) in the summary tables. For a more detailed description see (Havelaar et al., 2003).
Figure 2.4. Cumulative distribution of the mean , 5th, 50th and 95th percentile of the estimated disease burden (example), breaking down the total uncertainty into variability and uncertainty. Uncertainty 0 25 50 75 100 0 100000 200000 300000 400000
Campylobacteriosis incidence (n)/year
Percent of simulations Uncertainty Variabilit y Variabilit y Uncertainty 0 20 40 60 80 100 0 500 1000 1500 2000
Disease burden (in DALYs)
Percent of simulations
3 Campylobacter-associated gastro-enteritis cases
∗3.1 Background information
As already mentioned in the general introduction, Campylobacter is the most commonly reported bacterial cause of acute gastro-enteritis in the industrialised world (Williams, 1999; Rodrigues et al., 2001; Wittenbrink, 2002). For the most part, Campylobacter gastro-enteritis (GE) is a mild and self-limiting illness (Withington and Chambers, 1997). But for some cases, campylobacteriosis is fatal (Havelaar et al., 2000b). In the Netherlands, with
approximately 100,000 cases of acute gastro-enteritis annually, Campylobacter pose a serious public health problem (Havelaar, 2002; Havelaar et al., 2000a, b).
Most campylobacteriosis cases are sporadic cases and outbreaks are rarely identified (Withington and Chambers, 1997). Farm animals, wild animals and pets are the most important reservoirs of Campylobacter. From these reservoirs food products and the environment undergo continuous contamination, resulting in many pathways by which humans can come in contact with Campylobacter (Havelaar, 2002).
Different Campylobacter species exist. Campylobacter jejuni is the most common isolated Campylobacter species in faeces of patients with diarrhoea (Blaser, 1997). Only 5-10% of campylobacteriosis is caused by other Campylobacter species, e.g. C. coli, C. lari, C. hyointestinalis, and others (Wittenbrink, 2002).
3.2 Estimating annual incidence of Campylobacter-associated
GE cases
In order to estimate the annual incidence of GE associated with Campylobacter infection, including the different health states of campylobacteriosis patients, we used a variety of available data sources. The estimate of the total annual incidence in the population was based on a recent community-based cohort study known as the SENSOR study (De Wit et al., 2001c). The number of campylobacteriosis patients consulting a GP was based on General Practice (GP)-based research (De Wit et al., 2001a). Laboratory surveillance data was used to estimate: a) the number of laboratory-tested faeces samples; b) the number of hospitalised cases; c) the number of fatal cases, this in combination with the findings of Helms et al. (2003); and d) the age-specific incidences (Van Pelt et al., 2003).
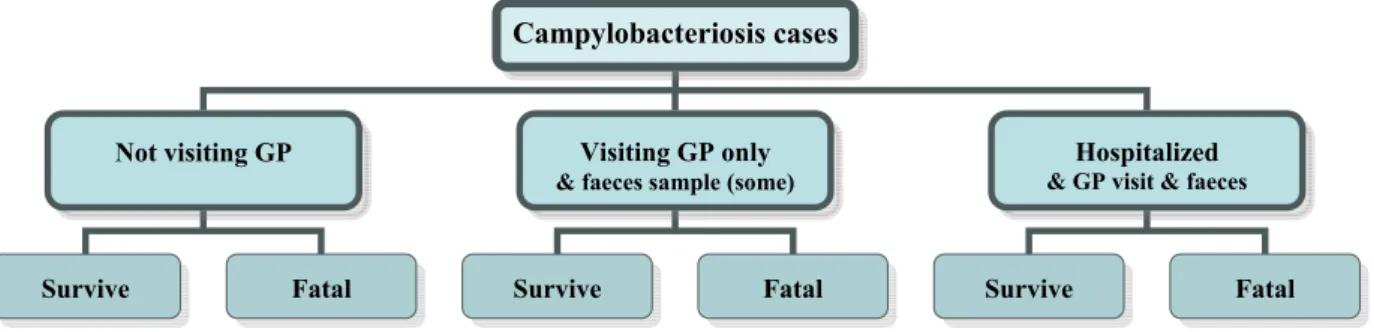
The different health states of campylobacteriosis patients considered in this study are summarised in Figure 3.1.
∗ The authors acknowledge the support of the CIE group, namely Winette van Brandhof, Yvonne van
Duijnhoven, Wilfrid van Pelt and Matty de Wit. Their data as well as their critical feedback was a valuable contribution to this study.
Figure 3.1. The different health states of campylobacteriosis patients.
3.2.1 Community-based cohort study
According to De Wit (2002) a community-based cohort study is the most appropriate method of obtaining information on the incidence of gastro-enteritis in the community. However, in order to obtain a sufficient number of cases, a large cohort has to be included. Consequently these studies are very expensive and time-consuming. A first population-based study on gastro-enteritis was performed in May, June and July of 1991 in four municipal health service regions in the Netherlands (Hoogenboom-Verdegaal et al., 1994). The estimated incidence of gastro-enteritis from this study was 450 episodes per 1000 person-years. Campylobacter as the triggering pathogen was detected in 4.6% of the cases, resulting in approximately 300,000 estimated campylobacteriosis cases/year for the Dutch population. A second Dutch community-based cohort study, the SENSOR study, was conducted from December 1998 to December 1999 (De Wit et al., 2001a). In the SENSOR study the standardised gastro-enteritis incidence was estimated at 283 per 1000 person-years. The number of gastro-enteritis
episodes was much lower in the second study than in the first study, 283 versus 450 per 1000 person-years. According to De Wit (2002) and De Wit et al. (2001c) seasonal trends in pathogens causing gastro-enteritis make the interpretation of data covering only three months of the year (as was the case in the first Dutch study) very difficult. Other arguments to
support a bias in this first study were the relatively high number of non-responses and the fact that the population-based cohort study could not be compared with other studies performed in Dutch general practices, as these were applied in other regions and at different time intervals (De Wit, 2002). In this study we therefore used only the findings of the second and more recent community-based cohort study of De Wit et al. (2001c).
De Wit et al. (2001c) detected Campylobacter as the triggering agent in only 1.3% of the gastro-enteritis episodes. This was a lower percentage than the 4.6% found in the previous cohort study by Hoogenboom-Verdegaal et al. (1994) or the 4.2% found in England by Tompkins et al. (1999). After standardisation De Wit et al. (2001c) obtained an estimated percentage of Campylobacter in gastro-enteritis episodes of 2.4%, resulting in approximately 100,000 campylobacteriosis cases/year in the Netherlands (assumed Dutch population 15.5 million). De Wit et al. (2001c) used 24 different age and sex classes when standardising. Because De Wit et al. (2001c) found only 9 Campylobacter isolates, we performed a re-standardisation with only the 6 age classes, mainly because otherwise, there would be subgroups with no observed cases. The re-estimated percentage was, at 1.7%, below the estimate of De Wit et al. (2001c) and resulted in an estimated annual average incidence of approximately 78,800 campylobacteriosis cases for the Netherlands, with a 95% C.I. of 28,231 and 168,792 (see Appendix I). The uncertainty of the estimated annual average
Campylobacteriosis cases
Not visiting GP Visiting GP only
& faeces sample (some)
Hospitalized
& GP visit & faeces
campylobacteriosis incidence is considered in this study. Further details on the re-standardisation can be found in Havelaar et al. (2003).
3.2.2 GP-based research
The Netherlands Institute for Health Services Research (NIVEL) maintains a network of ‘sentinel’ general practices that participate in the continuous morbidity registration. Gastro-enteritis (GE) was included in the continuous morbidity registration in 1992-93 and from 1996 onwards (De Wit, 2002). Although this surveillance system provided information on consultations for the clinical syndrome gastro-enteritis, no information was obtained about the pathogens responsible (De Wit, 2002). Therefore additional information was collected in case studies in 1992 and 1993 by Goosen et al. (1996) and from 1996-1999 by De Wit et al. (2001a). Goosen et al. (1996) estimated an incidence of gastro-enteritis in general practices of 90 per 10,000 person-years and an incidence of campylobacteriosis in general practices of 11.7 per 10,000 person-years. De Wit et al. (2001a) estimated an incidence of gastro-enteritis in general practices of 79.7 per 10,000 person-years, which was a little bit lower than the one estimated by Goosen et al. (1996).
De Wit et al. (2001a) detected Campylobacter as triggering agent in 10.5 % of the
gastrointestinal cases visiting a GP. This estimate falls between the 9.4% reported by Palmer et al. (1996) and the 12.2% reported by Tompkins et al. (1999), who conducted similar studies for Wales and England. But we re-estimated the number of campylobacteriosis cases in the Dutch population (see Appendix I). Consequently the estimate of Campylobacter as the triggering agent within the GP-consulted gastro-enteritis cases decreased from 10.5%, the estimate of De Wit et al. (2001a), to 8.5%. This results in approximately 18,765 GP consultations per year.
Given that the number of GP consultations is strongly correlated with the number of campylobacteriosis cases in the total population, we estimated the fraction of
campylobacteriosis cases that would visit a GP in the Netherlands. This was on average 23.8%. The uncertainty around this parameter was considered by using a beta distribution. This is less than found in the IDD study for England and Wales, in which it was estimated that nearly every second campylobacteriosis patient (47.1%) consulted a GP (Anonymous, 2000c; Wheeler et al., 1999).
3.2.3 Laboratory-based surveillance systems
Faecal samples tested
Despite their incompleteness, laboratory-based surveillance systems provide data on a continuous basis, which allows the monitoring of trends in the different pathogens (De Wit, 2002; Van Pelt et al., 2003). In the Netherlands, a laboratory-based surveillance system exists for the bacterial pathogens Salmonella, Campylobacter, Yersinia, Shigella and E. coli O157, and a separate one for rotavirus (De Wit, 2002). From the annual submitted faecal specimens between 1996 and 2000 3.46% were Campylobacter isolates in the 15 participating regional Public Health Laboratories (PHL), resulting in an estimated average annual number of
laboratory-tested positive Campylobacter cases in the Netherlands of 5650 (Van Pelt et al., 2003). Age-specific incidences
Based on the observations from 1996 until 2000 of 2 PHLs (approximately 6.4% of the population), age-specific incidences for Campylobacter spp. were derived (Van Pelt et al., 2003). Incidences were highest among very young children (0-4 years of age), followed by young adults (15-29 years of age). Incidence gradually decreased in those over 30 years of age (Van Pelt et al., 2003). In the youngest age group (0-4 years), 30% more males were found than females, but 60% more females were found in the age class 15-29 years (Van Pelt
et al., 2003). The age-specific incidences of gastro-enteritis cases found in the laboratory surveillance were similar to those found by NIVEL. Therefore, it was assumed that the age-specific incidences found within these 2 PHLs were representative for the Netherlands. Age-specific incidences found in the laboratory surveillance were assumed to be representative for the age-specific incidences of campylobacteriosis patients not visiting a GP,
campylobacteriosis patients visiting a GP and hospitalised campylobacteriosis patients. Hospitalised cases
Although the National Medical Register (NMR) collects data on hospital discharge diagnoses from all hospitalised patients in the Netherlands, campylobacteriosis cases are registered in a collective group of non-specified gastro-enteritis. Consequently, an estimation of hospitalised campylobacteriosis cases based on this register was not possible. However, for 2 of the 15 participating Regional Public Health Laboratories (approximately 6.4% of the population) data of the senders of Campylobacter-positive faeces are collected from 1992 (Heerlen) and 1993 (Arnhem) onwards (Van Pelt et al., 2003). In the years 1996-2000, 2442 faeces samples were positive for Campylobacter, of which 212, or on average 8.7%, were submitted by hospitals (Van Pelt, pers. communication). The uncertainty around the estimated 8.7% is estimated in this study by using the beta distribution (Beta (213, 2231)). Based on a
standardised, population-based sentinel surveillance scheme, Gillespie et al. (2002) estimated that 10% of laboratory-confirmed campylobacteriosis cases would be hospitalised in
England, which is a little bit higher than the estimated 8.7%. However, 8.7% of the laboratory-tested positive Campylobacter cases is equivalent with 0.6% of all
campylobacteriosis cases. This is similar to the estimate of 0.6% and 0.5% used by Buzby et al. (1996) and Anonymous (2001), respectively.
Bacteraemia
In many reports is bacteraemia highlighted as a possible extra-intestinal complication of campylobacteriosis. Skirrow et al. (1993) found for England and Wales during the period 1981-1990 a total of 394 cases of Campylobacter-associated bacteraemia, which was, according to Pearson and Healing (1992), about 34 cases on average per year. Skirrow et al. (1993) estimated a bacteraemia incidence of 1.5 per 1000 reported campylobacteriosis cases. According to Pearson and Healing (1992) invasive Campylobacter infection was most common in patients more than 65 years old, and least common in those aged 1-14 years. There were ten (2.5%) deaths among the 394 patients. Most deaths were due to an underlying disease, such as a malignancy or heart disease (Skirrow et al., 1993). A variety of papers refer to this study (Kist, 2002; Smith, 2002). Another study in which the incidence of
Campylobacter-associated bacteraemia cases was estimated is that of Schonheyder et al. (1995). From 1989-1994 twelve Campylobacter-associated bacteraemia cases were reported in Denmark, which was equal to an estimated incidence of 0.2 per 100,000 population-years. No information is available for the Netherlands.
The number of Campylobacter-associated bacteraemia cases in the Netherlands might be estimated from the number of Campylobacter isolates from blood samples. For 2 PHLs, Arnhem and Heerlen, data from the submitted material of Campylobacter positive isolates were collected from 1992 (Heerlen) and 1993 (Arnhem) onwards until 1998 (Van Pelt, pers. communication). From the 3230 collected samples in this time period, only six were blood samples, which is equal to less than 0.2% of all submitted and positive tested Campylobacter isolates. This is close to the findings of Skirrow et al. (1993). With an estimated average of 5650 annual laboratory-tested positive Campylobacter cases in the Netherlands (Van Pelt et al., 2003), this would be equal to about eleven Campylobacter-associated bacteraemia cases. This falls within the estimated range of Havelaar et al. (2000a), who estimated, based on the findings of Skirrow et al. (1993) and Schonheyder et al. (1995), that 9-54