General
Surveillance
of genetically
General Surveillance of genetically modified plants
General Surveillance of genetically
modified plants
Possibilities for implementation in the Netherlands
Colophon
© RIVM 2012
Parts of this publication may be reproduced, provided acknowledgement is given to the 'National Institute for Public Health and the Environment', along with the title and year of publication.
D.C.M. Glandorf
Contact: D.C.M. Glandorf
Expertise Centre of Substances/GMO office Boet.Glandorf@rivm.nl
This investigation has been performed by order and for the account of the Ministry of Infrastructure and Environment, within the framework of M/601040/11/AA
Abstract
General Surveillance of genetically modified plants in the Netherlands European legislation stipulates that the commercial cultivation of genetically modified (GM) crops should be monitored (General Surveillance, GS) to check whether unexpected, adverse effects on the environment could occur. The general idea in the EU is that the focus of GS should be on aspects such as biodiversity and a healthy soil. Since unexpected effects are difficult to track, it has not been clear how GS should be set up. Therefore, initially, GS will make use of already existing monitoring networks.
Suitable networks
Within this context, the RIVM investigated which networks could be used for the general surveillance of genetically modified crops in the Netherlands. These were the Ecological Monitoring Network that follows the development of flora and fauna in the Netherlands, and the Biological Indicator System of Soil Quality that keeps track of soil quality. In addition, satellite observations can be used to detect changes in vegetation. It is possible that GM crops will be cultivated on a commercial scale in the Netherlands in the near future.
Research method
This research was commissioned by the Dutch Ministry of Infrastructure and the Environment, and offers guidance with regard to existing networks. Firstly, existing networks in the Netherlands were systematically documented. Thereafter, they were examined based on criteria that ensures the long-term collection of reliable and relevant data for GS on biodiversity and soil quality. Subsequently, the possibilities of detecting unexpected environmental effects through GS was investigated. The report drawn up from this research can also be used to set up a GS system in other EU member states, or to come to an integrated European GS system.
Keywords:
Post-market monitoring, General Surveillance, genetically modified crops, GMO’s, monitoring networks
Rapport in het kort
General Surveillance van genetisch gemodificeerde planten in Nederland
Volgens Europese regelgeving is het nodig om te monitoren of commerciële teelt van genetisch gemodificeerde gewassen onverwachte, schadelijke effecten heeft op het milieu (General Surveillance, GS). Het algemene idee in de EU is dat de nadruk ligt op het behoud van bijvoorbeeld biodiversiteit en van een gezonde bodem. Aangezien onverwachte effecten moeilijk op te sporen zijn, is het niet duidelijk hoe GS vorm moet krijgen. Daarom wordt in eerste instantie
aangesloten bij bestaande monitoringnetwerken. Geschikte netwerken
In dat verband heeft het RIVM onderzocht welke van deze monitoringnetwerken geschikt zijn voor General Surveillance van genetisch gemodificeerde planten in Nederland. Dat blijken vooral het Netwerk Ecologische Monitoring, dat de ontwikkeling van de Nederlandse flora en fauna in kaart brengt, en het Bodembiologische Indicator systeem, dat de bodemkwaliteit volgt. Daarnaast kunnen satellietbeelden worden gebruikt om veranderingen in vegetatie aan te tonen. Mogelijk worden in Nederland in de nabije toekomst genetisch
gemodificeerde planten op commerciële schaal geteeld. Werkwijze onderzoek
Het onderzoek is uitgevoerd in opdracht van het ministerie van Infrastructuur en Milieu (IenM) en biedt handvatten voor keuzes tussen de netwerken. Hiervoor zijn eerst bestaande monitoringnetwerken in Nederland geïnventariseerd. Daarna zijn deze getoetst aan criteria die er zorg voor dragen dat de netwerken over een lange periode betrouwbare data voor GS verzamelen, die betrekking hebben op de biodiversiteit en een gezonde bodem. Daarna is getoetst of met de GS daadwerkelijk schadelijke milieueffecten opgespoord zouden kunnen worden. Het rapport kan ook worden gebruikt om een GS-systeem in andere EU landen op te zetten, of voor een geïntegreerd EU-systeem.
Trefwoorden:
Post-market monitoring, General Surveillance, genetisch gemodificeerde planten, GGO’s, monitoring netwerken
Preface
This report reflects the research and discussions that have taken place in the Netherlands from 2007 till this moment on the subject of General Surveillance (GS) and the potential implementation of GS in the Netherlands.
The research projects that are described in this report have been commissioned by the RIVM (SOR project EIA, within the framework of S/607001/001/EE) and by the Ministry of Infrastructure and the Environment.
Numerous people have been consulted during this process and many valuable suggestions have been made. I would like to thank all those people who -in one way or another- contributed to this report, especially dr. M.P. van Veen
(PBL/EAA) for his valuable input during the start of this project and the following persons for their active participation, contributions and critical reading of the report:
Drs. H. Bresser Ministry of Infrastructure and the Environment,
The Hague
Dr. J.E.N. Bergmans National Institute of Public Health and the Environment/SEC/GMO office, Bilthoven
Dr. J. Bloem Alterra, Wageningen
Dr. ir. P.A.M. Hogervorst Ministry of Infrastructure and the Environment, The Hague
Dr. W.J. de Kogel Plant Research International, Wageningen
Dr. ir. O.M. Knol Netherlands Environmental Assessment Agency,
Wageningen
Dr. J.C.M. den Nijs Institute for Biodiversity and Ecosystem Dynamics, Amsterdam
Dr. E. Smit National Institute of Public Health and the
Environment/SEC/GMO office, Bilthoven
Contents
1 Introduction 13
2 Criteria for monitoring networks and other sources
for GS 17
3 Inventory of networks or other data sources for
GS in the Netherlands 19
4 Methodological approach in the analysis of data from
existing monitoring networks for the purpose of GS 25 5 The feasibility of GS with selected networks 27
5.1 Ecological Monitoring Network 27
5.2 Biological Indicator System of Soil Quality 34
5.2.1 Literature review 34
5.2.2 Expert workshop 35
5.2.3 Exploration of statistical tools to analyse data of existing
networks (like BISQ) for GS 37
5.3 Earth Observation Systems 39
6 Recommendations for future implementation of GS
in the Netherlands 45
6.1 Networks 45
6.2 Measured effects in relation to GS 47
6.3 Concluding remarks 48
7 References 51
Abbreviations 55
Summary
When GM crops are commercially cultivated, under EU Directive 2001/18/EC, a General Surveillance (GS) system has to be in place in order to be able to detect any unexpected adverse effects of genetically modified (GM) crops, i.e. that were not predicted in the risk assessment of the GM plant. However, no predetermined focus, clear monitoring goals, or precise indications have been set about what to survey in GS. Furthermore, direct and indirect effects may manifest themselves in the long or short term, including outside the GM cultivation area.
The holder is responsible for the GS of the cultivation areas - and a wider area - of GM plants (2001/18/EC). Outside the cultivation area of GM plants, e.g. at national level, it could be argued that the national competent authority also has a responsibility for GS. EU Directive 2001/18/EC and guidance by EFSA do not specify in detail how such a national GS system should be set up. It is suggested to make use of existing networks that were developed for other purposes. Detailed and practical plans for GS based on such networks are not yet in place. This report provides an overview of existing monitoring networks and other surveillance systems in the Netherlands together with a critical discussion of their potential use for GS.
This report can serve as a basis for the implementation of GS systems in the Netherlands, but could also be of use to other EU member states or to arrive at an integrated European GS system.
1
Introduction
The area cultivated with genetically modified (GM) crops in the world is increasing rapidly. In 2010, the total area amounted to 148 million hectares in 29 countries (www.isaaa.org). The major part of these GM crops consists of herbicide-tolerant crops and insect-resistant crops that produce an insecticidal toxin from Bacillus thuringiensis (Bt). In Europe, there is public concern
regarding the cultivation of GM crops. Partly due to this concern, it was decided that approved GM events should be subject to post-market monitoring in the EU. Post-market monitoring consists of two types of monitoring: Case-Specific Monitoring (CSM) and General Surveillance (GS). CSM focuses on specific
uncertainties identified in the environmental risk assessment (ERA) that may still exist after a decision has been taken, giving authorisation for cultivation, or which is intended to further confirm assumptions made in the environmental risk assessment of a specific GM plant. CSM is thus only required if such
uncertainties have been identified in the environmental risk assessment and will not be required for each GM plant approved for cultivation. The aspects taken into account in the environmental risk assessment and how these relate to CSM and GS are described in more detail in the text box on page 8.
By contrast, each GM plant requires GS after authorisation is given for cultivation (and/or import and processing). GS is described in Annex VII to Directive 2001/18/EC as ‘largely based on routine observation (‘look-see’ approach) and should be used to identify the occurrence of unforeseen adverse effects of the GMO or its use for human health and the environment that were not predicted in the risk assessment’ (EC, 2001). There is no scientific basis for the occurrence of such effects, but the possibility of their existence has been raised because they cannot be ruled out. GS is thus intended to meet the need to investigate the possibility of such unexpected effects occurring.
As GS is intended to observe the potential effects of GM plants that are unknown, and could not have been predicted, based on the risk assessment of the GM plant, GS does not have a predetermined focus and, in principle, does not relate to a specific GM-crop combination (Bartsch et al., 2006; Sanvido et al., 2005, 2007, 2009). If there were to be unforeseen effects of GM plants, these effects could become manifest in the long or short term, inside or (as a result of uncontrolled spreading of the GMO or its products) outside the GM cultivation area which may then be observed in either the ‘above ground’ ecosystem or in the ‘below ground’ soil ecosystem. Since GS does not have a predetermined focus, it is necessary to first define what needs to be protected, i.e. what the environmental protection goals are. It is clear that the protection goals to be met by GS are the same as the protection goals of the environmental risk assessment. In general, monitoring networks for the purpose of these protection goals, such as biodiversity, water or soil quality, are already in place. It has been suggested that these existing monitoring networks could be used for the purpose of GS (EC, 2002; COGEM, 2005; EFSA 2006, 2011), and in this report we will look at these monitoring networks.
Environmental risk assessment of GMOs, Case-Specific Monitoring and General Surveillance
Before a GM plant is approved for commercial cultivation, an assessment is made of potential environmental risks resulting from its cultivation. This environmental risk assessment (ERA) is based on data and tests supplied by the notifier, available scientific literature, expert knowledge and experience from previous GM cultivations. The ERA is case-by-case and the effects of the GM plant are compared with the effects of non-GM parental plants. The data requirements, aspects to be taken into account in the risk assessment, and the principles of this assessment are laid down in EU Directive
2001/18/EC (EC, 2001) and in the guidance of the European Food Safety Authority (EFSA, 2010). Aspects that are always considered in the environmental risk assessment of every GM plant include:
- the potential of the GM plant to become more persistent or invasive;
- the potential for outcrossing with wild relatives and potential adverse effects of the GM plants resulting from this outcrossing and their offspring;
- potential adverse effects on non-target organisms, including humans and animals; and - potential adverse effects on biogeochemical cycles in the soil.
Cultivation will only be permitted where potential negative effects of the GM plant compared to those of the non-GM parental lines are considered to be negligible. With certain GM plants, uncertainties may remain in the ERA. This will depend on the specific crop/trait combination. In such cases, a case-specific monitoring plan may become a condition for the authorisation to cultivate in the EU. This plan specifically describes what information will be required to reduce the uncertainties and, consequently, what will be monitored, how this will be done, and over what period. General Surveillance does not depend on the outcome of the ERA and the specific crop/trait combination. Therefore a GS plan is always part of the authorisation.
Discussions on GS began in the Netherlands in 2005. Under Directive 2001/18/EC, the permit holder is responsible for GS. Further to the recommendations of COGEM (2005), the responsible Ministries in the Netherlands decided that - given the fact that GS does not have a
predetermined focus - no new monitoring systems would be set up. Under Directive 2001/18/EC, there are important arguments for the competent
authority (CA) to hold some responsibility for GS, especially when it concerns GS at national level. From a logical point of view, it was considered unreasonable to leave GS outside the cultivation area (e.g. at national level) to the permit holders. Effects could also occur in the long term, after areas have been cultivated with a number of different GM crops, from several different permit holders. Another argument was that GS should be carried out in an objective manner and over a longer period in order to detect changes in time, and would be better managed under the auspices of the CA.
This report reflects the discussions that have taken place in the Netherlands on the potential implementation of a GS system. Over the years, several
recommendations or choices were made, some of which may seem arbitrary, but these were often made for practical reasons. The report tries to explain the rationale behind these decisions. The starting point was the development of a national GS system based on existing monitoring networks. Although there is, as yet, no commercial GM cultivation in the Netherlands, it was decided to start setting up such a GS system to obtain baseline data. The GS system was not considered a monitoring network specifically to find effects of GM plants, but rather as a general system that would be capable of detecting adverse effects, should they occur. Ideally, GS should function not only as a general warning system but, more specifically, as an early warning system.
The aim of this report is to examine the feasibility of using existing monitoring networks and other available data, or data sources developed for other purposes, for GS in the Netherlands. This report first describes the available networks in the Netherlands. Thereafter, it sets out the rationale for the use of these networks/systems for GS and how they can be adapted for GS. The report ends with suggestions on how to implement a GS system based on the networks analysed. The report’s conclusions consider the feasibility of using these
networks as part of a national GS system for the Netherlands. The report may also serve as a basis for the implementation of GS systems in other EU member states, or an integrated European GS system.
2
Criteria for monitoring networks and other sources for
GS
A GS system should be based only on networks that meet certain criteria. These criteria are described below.
Criteria for networks to be suitable for GS
Data collected by the networks should be relevant to GS
Although GS does not have a predetermined focus, not all data collated by networks may be relevant for the purposes of GS. The underlying reasoning is that it is not likely that all organisms or ecosystems will be exposed to GM plants or their products. Therefore it makes more sense to focus on networks that compile data on terrestrial organisms than on organisms in aquatic ecosystems far away from cultivation areas, like major lakes or the North Sea.
Data should be validated
The data collected should be validated in order to assess the reliability of these data. Data validation means that data are checked for potential mistakes when the date are entered in a database and the probability of the data is also verified.
The method of data collection is also important in determining the reliability and quality of the data. Data collection should ideally follow a standard or validated protocol. This also has the advantage that data collected from different locations and at different times can be compared. In this way, any changes in numbers of organisms within one year or between years can be determined.
Data collection should take place on a regular basis
GS should preferably make use of data collected on a regular basis, e.g. annually. Networks that collect data only once per decade may be considered less suitable for GS because any effects will only be observed at a late stage. Networks should be stable
To be able to track changes over time, the network needs to be stable. Networks that only collect data for a limited period of time are therefore not suitable for GS. It will not be straightforward, and may even be impossible, to transfer data from one network to another which has a different approach. Since the stability of a network is often dictated by financial support, the funding stability of a network is also important.
Data collection should cover the entire national (or biogeographical) territory
GS is intended to detect unforeseen changes which may extend beyond the actual cultivation areas of GM plants. Former cultivation areas also need to be included in a GS system. For this reason, networks that collect data at a biogeographical or at a national level would be preferable. A small country like the Netherlands can be considered as one biogeographical region.
3 Inventory of networks or other data sources for GS in
the Netherlands
A first inventory of the main monitoring networks in the Netherlands was made by the Dutch Commission on Genetic Modification (COGEM, 2005). This report draws on the COGEM inventory and explores other sources of information which may potentially be useful for GS.
This chapter provides an overview of all networks and data sources, and briefly indicates whether or not they would meet the requirements for networks as indicated in the previous chapter (chapter 2). Therefore, the same structure as in chapter 2 (sections 2.1 to 2.5) has been followed for each network and data source. A summary is given in Table 1.
Information sources that are already in place for the purpose of GS at EU level are described at the end of this chapter.
Ecological Monitoring Network (NEM) - Protection goal is biodiversity;
- Aim is to monitor the development of Dutch flora and fauna within the scope of international nature policy frameworks, like the Birds and Habitats Directive;
- Data collected include numbers of organisms of Dutch flora and fauna; data are relevant for GS;
- Measurements conducted by trained and organised volunteers (PGOs, i.e. particuliere gegevens-beherende organisaties) and by provincial networks; the data are validated;
- Monitoring of most species groups takes place on an annual basis
- NEM is stable;
- NEM covers the entire national territory;
- For further information see: www.netwerkecologischemonitoring.nl. Biological Indicator System of Soil Quality (BISQ, Dutch: Bobi)
- Protection goal is soil quality;
- Aim is to monitor soil quality in the context of the Convention on Biological Diversity (CBD, 1992);
- Data collected are numbers of soil organisms and micro-organisms: data are relevant for GS;
- Measurements are carried out by scientists; data are validated;
- Sampling takes place once a year; each location is sampled once every six years;
- BISQ is a stable network;
- Sampling in BISQ covers the entire national territory; - For further information see:
http://www.rivm.nl/bibliotheek/rapporten/607604009.html. Network for Water Quality (Dutch: MWTL, Monitoring
Waterstaatkundige Toestand des Lands) - Protection goal is water quality;
- Aim is to monitor chemical, physical and biological parameters of water quality in the context of national and international legislation and agreements, such as the European Water Framework Directive, the Dutch Water Act, etc;
- Data collected are numbers of water organisms (e.g. plankton, mussels fish, birds, water plants); some of the data may be relevant for GS; - Measurements made by Directorate-General for Public Works and Water
Management (Rijkswaterstaat) or other parties, by organised volunteers (PGOs) and scientists; data are validated;
- Measurements generally take place annually; - MWTL is a stable network;
- MWTL covers the entire national territory (water);
- For further information see: www.rijksoverheid.nl/documenten-en- publicaties/rapporten/2011/12/30/mwtl-meetplan-waterdienst-2012- monitoring-waterstaatkundige-toestand-des-lands-milieumeetnet-rijkswateren.html.
Earth Observation Systems
- Protection goal: none specified;
- Aim is the production of remote sensing images by satellite systems that can be used for many purposes, including measuring developments in vegetation dynamics;
- Measuring vegetation changes may be useful for GS if the system is sensitive enough;
- Data on vegetation dynamics (as indicated by a vegetation index) have to be analysed and validated by scientists;
- Depending on the satellite system, images with different resolutions (5 to 250 m2) are taken at different intervals (every day to one every
16 days);
- Satellite systems can be considered a stable information source; - Satellite systems cover the entire national territory;
- For further information see:
http://www.alterra.wur.nl/UK/research/Specialisation+Geo-information/Earth_Observation/About/.
National Flora and Fauna Database (Dutch: NDFF, Nationale Database Flora
en Fauna)
- Protection goal is biodiversity;
- Aim is to store and make available validated distribution data from a wide range of environmental monitoring schemes, together with opportunistic data (i.e. occasional observations by volunteers); - Data collected are numbers of organisms (flora and fauna); data are
relevant for GS; - Data are validated;
- Most data are collected on an annual basis, but not necessarily at the same locations;
- The NDFF is stable;
- Data contained in the NDFF cover the entire national territory; - For further information see: www.natuurloket.nl.
Agricultural Surveillance
- Protection goal is agricultural quality;
- Aim is to detect plant diseases and inspect plant quality;
- Data collected are numbers of diseased potato plants and data on potato plant quality; data may be relevant for GS;
- Data are collected by qualified inspectors of the Plant Protection Service (Dutch: PD), the Netherlands General Inspection Service for Agricultural Seeds and Seed Potatoes (Dutch: NAK) and from the Food and
- Data are collected on an annual basis; depending on the purpose of the survey several times a year, but not always at the same locations; - Agricultural surveillance can be considered a stable information source; - Data collection is restricted mainly to potato fields, disease hot spots or
is randomly carried out;
- For further information see: www.VWA.nl and www.naktuinbouw.nl. Survey of bees
Initiated by the international scientific network Coloss (prevention of bee colony losses, www.coloss.org)
- Protection goal is bee health;
- Aim is to find causes for the sudden and dramatic death of honey bees in the EU;
- Data collected are numbers of bees: data are relevant for GS;
- Data collection by NCB (Netherlands Centre for Bee research); data are validated;
- Data collection on an annual basis, at least for the duration of the project (until 2012);
- Survey is on a temporary basis; no stable network; - Survey covers all active Dutch beekeepers;
- For further information see: www.beemonitoring.org.
European Invertebrate Survey Organisation (Dutch: EIS, Stichting EIS -
Nederland)
- Protection goal is biodiversity of insects and other invertebrates; - Aim is to increase knowledge on insects and other invertebrates and to
protect these groups;
- Monitoring for most species groups appears to take place on an annual basis;
- Data collection by PGOs, volunteers not organised in PGOs, or other networks; not clear how data collection takes place;
- Most data are validated and stored in the NDFF; - Network is stable;
- It is not clear if data are collected nationwide; - For further information see: www.eis-nederland.nl.
Based on the criteria indicated in chapter 2, several networks meet all the specified criteria (NEM, BISQ, Earth Observation Systems and NDFF). For NDFF, it was considered that the data entered in this database are useful but consist mainly of NEM data. The network on water quality (MWTL) was considered only partly useful for GS since the focus of this network is mainly on organisms in larger water bodies (i.e. rivers, lakes, and the sea). In addition, some measurements, like those for waterfowl and other birds, already form part of NEM. The remaining networks or data sources were not further considered in detail, either because they will operate only for a limited period of time, or they do not cover the entire territory of the Netherlands, or the data are not collected in accordance with validated protocols.
For these reasons only NEM, BISQ and Earth Observation Systems were further investigated for the purpose of GS.
Table 1. Summary of existing monitoring networks or other data sources in the Netherlands and their compliance with the suggested criteria for networks for the purpose of GS as indicated in chapter 2.
Networks/data sources shown in bold were further evaluated for use in GS.
Network/
Source Protection goal Data relevant for GS
Data
validated Frequency of data collection
Network
stability Coverage
NEM Biodiversity yes yes annual OK NL
BISQ soil quality yes yes sampling
is annual; each location is sampled once every 6 years OK NL
MWTL water quality partly, relevant data included in NEM
yes Annual OK NL water
Earth Observation systems none yes, if vegetation dynamics are measured, and if scale is fine enough yes, by analysing data for vegetation dynamics images taken once per day -once every 16 days OK NL Agricultural
surveillance agricultural quality and plant health
yes yes annual OK Limited to
agricultur al areas, mostly potato NDFF biodiversity yes, includes data from NEM
yes differs per
species OK NL
COLOSS bee health yes yes annual temporary
project NL EIS invertebrate
biodiversity yes yes, uptake in after NDFF
probably OK NL?
Sources that are already in place in the EU and used for GS
After authorisation has been given for commercial cultivation in the EU, the permit holder has to meet certain obligations before the GM crop may actually be grown. These obligations are summarised in the box below. Owing to these obligations, there are also some information sources available that can be used for the purpose of GS. The sources and some examples are listed on the following page.
Obligations upon the permit holder after authorisation for cultivation has been given
When consent is given for commercial cultivation of GM plants in the EU, the permit holder has to meet certain requirements before the GM crop can actually be grown. Growers in all member states have to report all the locations where the GM crops will be grown in that specific member state (MS) every year. In addition, as part of the GS plan, farmers have to complete a survey every year, concerning any unusual observations (farmer
questionnaire). These questionnaires are collected by the permit holder and summarised in their annual monitoring reports sent to the European Commission (EC) and all member states. These annual monitoring reports also contain a summary of the peer-reviewed literature published on the specific GM crop. If an adverse environmental effect of the GM crop is detected, the permit holder has to report this immediately to the EC, who will subsequently inform the member states.
National register of locations for commercial GM crop cultivation Under Directive 2001/18/EC, each member state has to establish a register which records the locations of where GM crops are or have been commercially grown. These registers are public. In the Netherlands, growers of GM crops have to report these locations every year before 1 February to the National Service for the Implementation of Regulations (Dutch: Dienst Regelingen: www.lnvloket.nl). These locations are subsequently made public in a register that can be found in the
Netherlands at: http://www2.hetlnvloket.nl/Kaarten_VROM/index.html. Farmer questionnaire
When GM crops are cultivated, a subset of farmers has to report any unusual effects observed in their fields compared to non-GM crops. This is done by means of a questionnaire. An example can be found at: www.ec.europa.eu/food/food/biotechnology/docs/2009_Farmer_Questio nnaire.pdf.
Reports from permit holders
When European authorisation is given and GM cultivation of the GM crop takes place in Europe, the permit holder has to file annual reports with the EC. These reports include results from post-market monitoring (including GS) and literature searches of peer-reviewed papers that are related to potential environmental effects of the specific GM crop. Member states also receive these reports from the EC. Examples can be found at: www.ec.europa.eu/food/food/biotechnology/index_en.htm. Literature systems
There is quite some research available on the potential effects of GM crops in relation to food safety, feed safety and environmental safety. Data are published in peer-reviewed journals and elsewhere. These journals are accessible through the libraries of research institutes. Abstracts of relevant papers and relevant sites can also be accessed through the International Centre for Genetic Engineering and Biotechnology (ICGEB, www.icgeb.org), for example.
4 Methodological approach to the analysis of data from
existing monitoring networks for the purpose of GS
As indicated in chapter 1, GS does not have a predefined focus because it is not known whether effects will occur, where they will occur and what these effects might be (positive or negative). In fact, it could be assumed that everything has to be measured, without any particular focus in the monitoring. As this is not a feasible option, it was considered what data would be relevant for the purpose of GS.
GS should be based on protection goals, like biodiversity, for which data are already collected, based on national and EU requirements. Experts agree (EFSA, 2011; Smit et al., 2012) that the approach for GS would be to measure the potential effects on these protection goals (i.e. biodiversity, soil quality, etc.), thereby making use of information sources which are already available, e.g. existing monitoring networks. As these monitoring networks have been designed for other purposes, they cannot supply statistical proof of potential effects of GM crops. What they can do, however, is to generate ‘alerts’ when changes in the protection goal (i.e. biodiversity, soil quality etc.) do occur. This is further described below.
In the event of such an alert, or that a change is observed which is found to be statistically significant, further analysis should demonstrate whether this change can be correlated with GM cultivation, or if it is related to other causes, such as changes in agricultural practice or climate change. Statistical methods are available to establish a potential significant correlation between a change in biodiversity on the one hand, and GM cultivation on the other hand. This is described in section 5.2, using a non-GMO example in which the effects on the soil nematode community can be significantly correlated with the amount of manure deposited.
Types of alerts
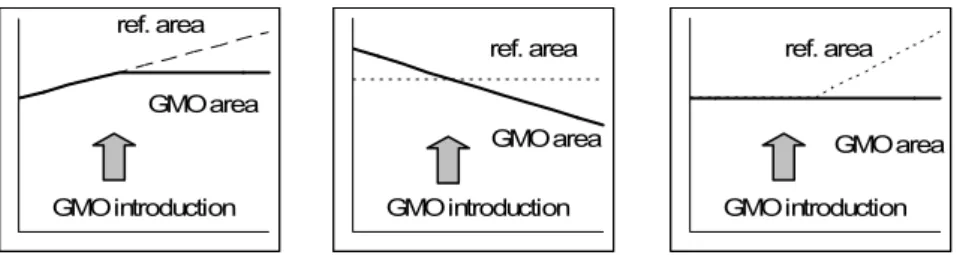
The idea of GS is that a signal (alert) will be issued when an element of biodiversity (or a criterion like soil quality) is significantly affected. Different types of alerts can be issued. Firstly, trends in indicator species in the area where the GM crop is grown may differ significantly from trends in a reference area after the introduction of the GM plants. In these situations a type 1 alert can be issued (see Figure 1).
Figure 1. Hypothetical situations where a type 1 alert would be issued further to the introduction of GM plants where there is a change in the trend for indicator species in the area where the GM crop is grown (GMO area) compared to the trend for the same species in a reference area (ref. area).
GMO introduction GMO area ref. area GMO introduction GMO area ref. area GMO introduction GMO area ref. area
Secondly, a type 2 alert can be issued when there is a statistically significant change in the direction of the trend for the indicator species after the
introduction of GM plants (see Figure 2).
Figure 2. Hypothetical situations where a type 2 alert would be issued following the introduction of GM plants where the trend direction for indicator species changes after the introduction of GM plant.
The difference between type 1 and type 2 alerts is that for the latter the trend is not compared with the development of biodiversity in a reference area. This type of alert is necessary since it cannot be known in advance how far the potential influence of the GM crops (or their products) will extend. If this influence were to extend to the entire national territory, it would not be registered as a type 1 alert, since the influence will also affect the reference area. A type 2 alert can be seen as a first indication that something may have happened. While a type 1 alert may be a stronger indication that this could be due to the introduction of GM plants (see also section 5.1 for an example).
If a type 1 or 2 alert is issued the next step would be to determine whether there is logical explanation for this alert. Only if no such explanation or correlation can be found for the detected changes in biodiversity (or soil quality), there will be a suspicion that these changes could be correlated to GM cultivation, in which event statistical methods can be used to establish whether or not there is a significant correlation between these changes and GM
cultivation (see also section 5.2).
GMO introduction GMO introduction GMO introduction
5 Feasibility of GS using selected networks
Based on the results of chapter 3, it was decided to examine in more detail the Ecological Monitoring Network (NEM), the network on soil quality (BISQ) and the use of satellite systems for the purpose of GS, taking into account the
methodological approach as set out in chapter 4. 5.1 Ecological Monitoring Network
The NEM monitors the status of Dutch flora and fauna in relation to policy goals based on the legislative requirements. Policy goals are used that focus on species, as in the Birds and Habitats Directive, or the policy on farmland birds. Policy goals can also focus on protection areas (Natura2000) or the effects of eutrophication, acidification and the decline in the water table.
The NEM is joint undertaking between PBL (the Netherlands Environmental Assessment Agency), CBS (Statistics Netherlands), the Provincial Authorities, and two Dutch Ministries (Economic Affairs, Agriculture, Nature and Innovation, and Infrastructure and the Environment). Data are collected on an annual basis by experienced volunteers organised in PGOs, and by provincial networks in accordance with standard protocols that can be found on the NEM website. Data are collected on species abundance or on species distribution. In the latter case only the presence or absence of a species is determined. The PGOs manage and validate the data. Data are further validated by the CBS and eventually entered in the National Flora and Fauna Database (NDFF).
Data on species abundance are statistically analysed by CBS, using log linear regression with TRIM, software specially developed for the NEM (Pannekoek and van Strien, 2001). These analyses result in annual indices and longer term national or regional trends per species. Data analysis on the distribution of species is done by the PGOs. The output of the NEM can be found on the PGO and CBS websites and at www.compendiumvoordeleefomgeving.nl.
The NEM provides species monitoring for the following species groups:
• Reptiles
• Amphibians
• Mammals (bats and some diurnal mammals)
• Water birds (non-breeding)
• Breeding birds
• Birds on resting places
• Fish (only in polders and small streams) • Butterflies
• Dragonflies
• Vegetation (plus trends for many individual species)
• Lichens
• Mushrooms
• Beetles (only distribution of some species in the Habitats Directive) • Molluscs (only distribution of some species in the Habitats Directive) NEM and approach for GS
Working closely with PBL and CBS, the feasibility of GS using NEM data for GS was examined. During the many discussions and brainstorming sessions, experts made a number of recommendations for an approach to GS in the Netherlands.
Changes in species abundance reflect changes in biodiversity
GS based on changes in the abundance of species provides a good indication of changes in biodiversity. Monitoring changes in abundance will be more sensitive than monitoring changes in the presence or absence of species.
Indicators for GS
It was considered that indicators could be selected for GS which would function as a ‘red flag’ for a group of organisms. These indicators would be for groups of selected species. It was agreed that a choice of indicators would be selected for species groups that could come into contact with certain crops, i.e. birds, plants, butterflies and diurnal mammals. The choice of indicators is summarised in Table 2. An extensive list of the individual species is given in Appendix 1.
Table 2. Criteria and choice of species to be used as indicators for GM maize and potato.
Groups of organisms
Criteria Potato Maize Plants Wild relatives General state of flora General state of flora
Birds Potential interaction with crop Farmland birds (Dutch: akker- en weidevogels) Farmland birds, seed-eating birds Birds of prey Interaction through food web Birds of prey occurring in agricultural fields, owls Birds of prey occurring in agricultural fields, owls Diurnal mammals * Potential interaction with crop
Hare, roe deer Hare, roe deer
Butterflies **
- Butterfly larvae feeding on crop - Species that are part of the food web
Potato is a crop where very few butterflies occur
Maize is a crop where very few butterflies occur
Red List species
Endangered species that occur in cultivation area of crop (birds, butterflies)
Species in cultivation area of starch or eating potatoes
Species in area where green maize is cultivated
* Rabbits have been excluded because their population is too variable over time and fluctuations in this species’ population are known to have many causes ** Arthropods are not included since they are not covered by NEM
Inclusion of endangered species
It was also considered important to include endangered species as the public and policymakers generally consider effects on these species (e.g. extinction) to be more important than effects on common species. Therefore, species have been selected that are on the Netherlands’ Red List or are likely to be placed on this list in the near future, as they are considered ‘endangered’according to IUCN criteria (www.iucnredlist.org). The species will be selected, based on their prevalence in the regions where maize and potato are grown (and where GM maize and potato will be cultivated in the future). Red List species that are almost extinct have not been included due to lack of data (see below).
Species groups excluded from GS
Species groups that are covered by NEM, but were excluded for GS, were reptiles, amphibians, bats, fish, dragonflies, lichens, fungi and molluscs. It was reasoned that, given their habitat and behaviour, these species (with the
exception of certain fungi) are less likely to come into contact with GM plants (or their products) as the species monitored do not normally occur in agricultural areas.
GS at national or regional levels
GS should essentially take place at national level. However, if effects of GM crops should occur, measurements at national level will not be sensitive enough. Therefore, it was recommended to focus on agricultural regions, i.e. the specific regions in the Netherlands (NL) where agricultural crops are normally cultivated. The focus would be on those regions where maize and starch potato are
cultivated as these are the first GM crops which are expected to be introduced into the Netherlands (e.g. insect-resistant Bt maize, amylose-free potato and disease-resistant potato). An indication of the cultivation areas for starch potato and maize are shown in Figure 3.
Comparing GM cultivation area with a reference area
Effects of GM crops can be detected by comparing cultivation areas with a reference area (type 1 alert, see chapter 4). A cultivation area is considered as the area where GM crops will be grown in the future. A reference area is the area where the crop is not cultivated, or less extensively cultivated. Ideally, a reference area will have the same environmental conditions (including non-GM crop cultivation) as the area where the GM crop is cultivated. This situation can be approximated by selecting sampling points just within the influence of GM crops and points just outside this influence as a reference. However, there is no existing knowledge available on the extent of the influence of GM crops. Therefore, it was recommended to assess the effects of GM crops on a regional scale, e.g. to compare regions where there is extensive cultivation of the crop (i.e. cultivation area) with regions where there is little or no cultivation (i.e. reference area) (see Figure 3). A probable consequence of this will be that differences will be found that are caused by factors other than the GM crops (false alert). To reduce the number of these ‘false alerts’, a reference area should be chosen which is comparable to the cultivation area in terms of environmental conditions. For starch potatoes, for example, it is expected that GM starch potatoes will be grown on the sandy soils in the north-eastern part of the country, and thus only sandy soils in the rest of the country should be included in the reference area (Figure 3). The number of false alerts can be further reduced by carefully comparing baseline trends from the cultivation area with those of the reference area before the introduction of GM crops.
Any remaining false alerts will not be a problem in GS. As GS does not have a predefined focus, it is better to issue a false alert than to miss a potential GM effect. Conversely, it cannot be ruled out that differences between the cultivation and reference areas may mask GM-induced effects in the cultivation area.
GMO area Reference area
Figure 3. Indication of the cultivation areas for starch potatoes in the
Netherlands. The dark areas indicate the main growing areas for starch potatoes (e.g. sandy soil in the northeast of the Netherlands) where GM starch potatoes are expected to be cultivated (GMO area). The areas with yellow shading represent sandy soils in the rest of the country that can be used as a reference area (reference area).
Few sampling points for rare species
For rare species, like Dutch Red List species, the number of NEM plots where the species are monitored is often too small to calculate reliable trends. Moreover, some species, like butterflies, are not often found in agricultural areas,
especially Red List butterflies. Therefore it was recommended not to limit the comparison only to sampling points in the agricultural area under cultivation and reference areas, but to include sampling points from natural areas as well. Another way to incorporate rare species in GS is to look at the number of species per sampling point instead of the abundances of separate species. By doing so, even a Red List species that is only present at one sampling point will be taken into account in the observations. In this way a trend can be calculated, based on the mean number of Red List species whereby the same comparisons can be made as with Multi-species Indices (MSIs, see below).
Indices and Multi-Species Indices
Missing counts in NEM data are statistically replaced (imputed) by TRIM to enable aggregation of counts to higher levels (e.g. cultivation area, reference area, national level). For the selected indicator species, total numbers in the sampling point are calculated per region per year. These numbers are converted to indices by setting the first year (e.g. the first year with GM crops) at 100 and expressing the following years as a percentage of the first year (e.g. an index of 50 means a halving of the population compared to the first year; an index of 200 represents a doubling of the population).
Apart from indices per species, indices for a group of species are also calculated (Multi-Species Index, MSI) by calculating the geometric mean of the yearly indices of the species. Calculating the geometric mean enables a doubling of one
species (index rises from 100 to 200) to be offset by the halving of another (decline from 100 to 50), as the geometric mean of 200 and 50 is 100. MSIs are considered a good indicator of the development in the whole species group. This is a well-established method for monitoring the development of a group of species (Buckland et al., 2011; Gregory et al., 2005; van Strien et al., 2011). MSIs are less sensitive than indices of individual species because species can compensate for one another in MSIs. A change in MSI therefore represents a stronger signal than a change in the indices of individual species. Alerts will, of course, only be issued when enough species within a group change in the same direction. For GS the groups and the individual species within these groups are indicated in Table 1 and Appendix 1.
Calculation of trends with TrendSpotter
TRIM imputes missing values and calculates overall trends over time series’ of individual species. Although TRIM can also calculate separate trends for the last few years in a time series, trends for the last few years will not usually be statistically significant. This restricts the use of TRIM for early warning purposes. Therefore, the programme TrendSpotter can be used to assess the possible effects of GM crops. TrendSpotter (Visser, 2004) calculates flexible trends in time series and also calculates a confidence interval (CI). A flexible trend can be compared with a running mean across time points in which the value of the trend (height of the trend line) is specifically determined by the yearly values at that particular moment and those of the surrounding years, without the
influence of years that are further away in time. In other words, TrendSpotter is sensitive to detecting trends in the short term (shorter than TRIM) and would therefore be useful for GS, which is intended to function as an early warning system. TrendSpotter also calculates the difference in trend values between the previous year and each of the preceding years, including the CI for this
difference. Therefore it is possible to indicate for each year whether the population number in that year is significantly higher or lower than the year before (Soldaat et al., 2007).
Potato as a test case for GS
Potato was chosen as a test case. Trends in the selected indicator species for potato were analysed for the past 15 years to determine whether these could be used for GS, as trends should neither fluctuate too much nor be too stable if potential changes are to be detected. A further reason to collect data on the selected indicator species was to create a starting point for GS, as there is currently no GM cultivation in the Netherlands. The preliminary analysis of the trends in selected indicator species for the past 15 years proved to be useful for the purpose of GS (e.g. trends were neither too variable nor too stable), and it was agreed to continue with the selected species. Based on this first pilot, a more extensive second pilot was started to determine which statistical analysis method would be most suitable for the purpose of GS.
Example of a type 1 alert
Chapter 4 describes two types of alerts. A type 1 alert would be issued in the event of a change in the trend direction of a species or species group following the introduction of a GM crop, compared to the trend direction of this species or species group in a reference area. Figure 4a shows the development in farmland birds (six species) in the cultivation area (where GM crops may be grown in the future) and in the reference area in the period from 1990 to 2008. Data points are MSI values; the lines indicate the trends as calculated by TrendSpotter. With the output of TrendSpotter, the percentage of yearly change and the confidence interval can be calculated (Soldaat et al., 2007). In Figure 4b this has
been done for trends in farmland birds from Figure 4a. In this figure, the
horizontal lines represent the annual change in the mean trend of farmland birds in the cultivation area where the GM crops will be grown (GMO) and the
confidence interval. The value of -4 means that the trend value is four index points lower in that specific year compared to the year before. The other lines represent the mean trend in farmland birds in the reference area. In years where the CIs do not overlap, the mean yearly change significantly differs statistically between the cultivation area and the reference area. For farmland birds this occurs in the first years and in the middle part of the time series, and thus type 1 alerts would be issued.
Figure 4a Development in farmland birds in the cultivation area (GMO, i.e. where cultivation of the GM crop is expected) and in the reference area (REF, i.e. where no (or less) cultivation of the GM crop is expected) from 1990 to 2008 in NL (indices, 1990=100).
Figure 4b The mean yearly change in index points of these birds and the 95% confidence interval (CI) in the two areas as determined by TrendSpotter (type 1 alert). The bold lines indicate the mean yearly change, the dotted lines are the CIs. If the CIs do not overlap, there is a statistically significant difference and a type 1 alert would be issued. The grey arrow indicates when a type 1 alarm would be issued after potential introduction of a GM crop (black arrow). As an example, let us suppose that in Figure 4 GM plants were introduced in 1994 or 1995 (indicated by a black arrow). From the figure, it can be seen that a few years later the yearly change differs between the two areas (the
confidence intervals (CIs) no longer overlap in Figure 4b), which could be an effect of the introduction. Note, however, that there was already a difference in the preceding years, indicating that other factors than the GM crop can cause differences in trends. This method will therefore be particularly useful in
b. yearly change -13 -11 -9 -7 -5 -3 -1 1 3 1990 1995 2000 2005 2010 GMO REF
a. development farmland birds
0 20 40 60 80 100 120 1990 1995 2000 2005 2010 GMO REF
indicating an effect of GM plants where the trends are similar in both areas before the introduction.
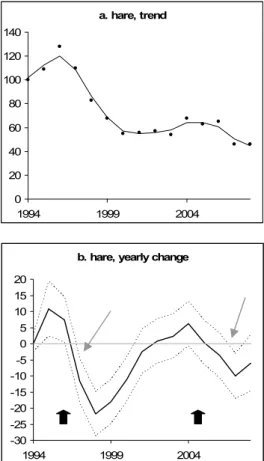
Example of a type 2 alert
A type 2 alert would be issued whenever the trend direction of a species or species group changes following introduction. As indicated above, the difference compared with a type 1 alert is that the trend in the cultivation area is not compared to a reference area. To give an example, the annual change in the trend for the hare is plotted in Figure 5. A value of -10 means that the trend value is ten index points lower in that specific year compared to the year before. When the CI is below 0, there is a statistically significant reduction compared to the year before; above 0, there is an increase. It can be seen in Figure 5 that there is a statistically significant decline between 1997 and 2001, while there is a period until 2006 where there is no statistically significant difference in trend direction (CI includes 0), except for 2006. If the trend change from 1997 or 2007 had followed further to the introduction of a GM crop, type 2 alerts would have been issued (Fig. 5b).
Figure 5a Trend for the hare in the cultivation area.
Figure 5b Mean annual change (in index points) in the cultivation area, and the confidence interval as determined by TrendSpotter (type 2 alert).
Where the CI is below 0 (the horizontal line) there has been a statistically significant decrease in the hare in the cultivation area compared to the
preceding year. The grey arrows indicate when a type 2 alarm would be issued after potential introduction of a GM crop (black arrow).
b. hare, yearly change
-30 -25 -20 -15 -10 -5 0 5 10 15 20 1994 1999 2004 a. hare, trend 0 20 40 60 80 100 120 140 1994 1999 2004
The method described above is sensitive to relatively large changes in numbers of selected species or species groups. Whether an effect will be found or not will depend on a combination of (1) the magnitude of the change in trend, and (2) the annual fluctuation in the species or species group. A small change in trend will be detected at an early stage if the species (or species group) does not show very much year-on-year variation. By contrast, with large annual fluctuations, a significant change in trend will only be observed after a longer period of time. The method is not specific to the effects of GM plants, but is useful for all potential ecological stressors. The method is relatively insensitive to incidental changes because the alert system is based on changes in trends, which will become manifest only when the increase or decrease is sustained over a few years. In conclusion, the analysis of NEM data as described here would appear to be promising for the purposes of GS.
5.2 Biological Indicator System of Soil Quality Description of BISQ
The Bobi or BISQ network (Rutgers et al., 2009) is a nationwide monitoring programme which samples some 300 locations with different land uses and soil types. Each location is sampled in a six-year cycle. The programme was set up after the Convention on Biological Diversity was ratified by the Dutch
government. BISQ was developed in 1997 at the request of the former Dutch Ministry of Housing, Spatial Planning and the Environment to assess the quality and resilience of the soil ecosystem (Bloem et al., 2006). The link between biodiversity and soil function is represented in BISQ from the point of view that the soil food web provides an opportunity to link diversity to specific functions, i.e. the life support functions. BISQ enabled the most important life support functions of the soil to be identified, i.e. decomposition of organic matter, nutrient cycling, soil structure formation, plant-soil interactions and ecosystem stability. Ecological processes were then linked to these functions and the dominant soil organism groups and ecological process parameters were determined and brought together in a practical indicator system to be used for national monitoring (Rutgers et al., 2009). BISQ has been incorporated in an already operational abiotic soil monitoring programme, the Dutch Soil Quality Network (DSQN). This network is based on 200 sites classified into various land use/soil type categories and represents approximately 75% of the total land surface area. The parameters measured by BISQ are given in Figure 6 and in Rutgers et al. (2009).
BISQ and GS
In 2007, an RIVM project started to explore the options for GS of the soil ecosystem based on BISQ. The project consisted of several parts: Literature review of unexpected effects of GM plants in the soil
ecosystem to identify potential indicators for GS;
Discussion with experts on (a) the challenges of GS of the soil ecosystem, and (b) the use of BISQ for GS;
Exploration of statistical tools to analyse data in existing networks (like BISQ) for GS.
5.2.1 Literature review
Reported unexpected effects of GM crops
As a first step, a literature review was carried out (Smit et al., 2010, 2011) to identify unforeseen effects of GM crops on soil functions or organisms. The idea was that functions of organisms that were proven to be affected by GM crops
could subsequently be selected as indicators for GS. Peer-reviewed scientific papers describing effects of GM crops were assessed, but revealed only a few unexpected effects of GM crops on the soil system. Effects that were found were transient and smaller than the effects caused by normal agricultural practices such as crop rotation, tillage or the application of plant protection agents. Potential indicators for GS
Although the literature review did not reveal any unexpected GM effects, a number of processes and organisms were shown to be slightly affected by GM crops (Smit et al., 2010, 2011). Organic matter degradation, organic content and related parameters (e.g. microbial C content) responded to GM crops and thus may be indicators for GS since organic matter degradation is one of the most important soil functions. The nematode community is also recommended as an indicator for GS because of its response to GM crops, as indicated in the literature. Nematodes are essential organisms in the soil food web and sensitive to disturbances. Arbuscular mycorrhizal fungi can also be considered as an indicator because they are an important group of soil micro-organisms due to their ability to form associations with plants and improve plants’ nutrient uptake. The few publications there are on the effects of GM crops do not give a clear picture regarding their response. However, there are currently no routinely applicable methods for the specific detection of arbuscular mycorrhiza. The same applies to micro-array analysis for assessing microbial diversity of a broad range of bacterial and fungal species in soil. Such an application would be very useful for GS when sufficiently developed for routine application.
5.2.2 Expert workshop
Adverse effects and protection goals
The literature review was used as a basis for a workshop with national and international experts in the field of soil ecology, molecular biology and on GS (Smit et al., 2009, 2012). At this workshop, the major issues regarding GS that were identified earlier by the Dutch soil experts were discussed, including the proposed indicators. Concerning these issues, all the participants agreed that it is not possible to detect adverse effects with GS because the term ‘adverse’ implies that effects have to be qualified or judged, which is more of a societal issue than a scientific one. It was concluded that it is necessary to define what needs to be protected (protection goals). Soil quality was proposed as an overarching protection goal. The concept of ecosystem services was introduced for linking measurable parameters to soil functions in order to determine soil quality (Figure
Figure 6. Diagram of stakeholder participation model that could be used for GS. This is an adapted form of the system described by Rutgers et al. (2009). Ecosystem services and stakeholder participation
Classification of an effect as adverse or not largely depends on the use of the soil or land, and the land users are those that have to make this judgement. For this purpose, a stakeholder participation model (Rutgers et al., 2009) was adopted consisting of three domains: the land users, the soil scientists and the decision-makers. Each of these domains has its own specific interests. As a first step, land users such as farmers, local authorities and managers of nature reserves will be involved in determining which ecosystem services they regard as most important to be considered in the GS system. Soil scientists will then select indicators to assess the status of the selected ecosystem services and provide scientific data for regulatory authorities to decide whether unanticipated effects as a consequence of GM cultivation have indeed occurred.
Data collection and monitoring
The second part of the workshop focused on data collection, relevant monitoring programmes and the sensitivity and resolution of the monitoring. The BISQ initiative was considered the best source for generating data for GS of the soil in the Netherlands. It was indicated that BISQ may have to be adapted for General Surveillance by increasing the sampling frequency and the locations. This may prove to be too expensive since analysis of all parameters at one location already amounts to € 3000. If all parameters are to be analysed annually at 300 locations this would cost € 900,000 a year. However, costs can be reduced
Domain of: stakeholders Land use Nature -Heath -Meadows -Forests Agriculture -grass -arable fields Green areas - rest Ecosystem services Production functions - Nutrient cycling - Soil structure - Disease suppression Resistance resilience - Resistance - Adaptability Environmental functions - Degradation OM - Attenuation - Water balance - Climate function Habitat function / biodiversity - Intrinsic value Domain of: soil scientists State parameters - nutrient cycling - resistance resilience - aggregate formation - water retention - functional diversity - pest regulation - biodiversity Measurements -bacterial biomass -potential C mineralization - potential N mineralization - density of nematodes - fungal biomass - density of earthworms - soil pH - soil organic matter - etc
Overarching protection goal: protect soil quality
Data collection: central reporting office
Decision: decision makers
Stake holders: Defining impact Soil scientists: Data interpretation Domain of: decision makers Data GM effects
Base line data
by selecting parameters and by developing different sampling scenarios. For example, by focusing on a few robust indicators such as labile organic matter (potentially mineralisable nitrogen) and nematodes, the cost could be reduced to € 140,000 a year. Alternatively, more focused sampling could be applied (inside and outside cultivation areas). Sampling intensity could be stepped up for GS depending on the scale of future GM crop cultivation. Three scenarios are envisaged (Smit et al., 2009, 2011).
5.2.3 Exploration of statistical tools to analyse data of existing networks (like
BISQ) for GS
BISQ and statistical analysis for GS
The last part of the project looked at the use of statistical tools and systems to make existing monitoring networks – originally developed for other purposes – suitable for GS (Vonk et al., in preparation). The approach taken and the results of this study are described below.
Data from BISQ have been used to illustrate how statistical methods and models can be implemented for the purpose of GS. The methods are used to be able to pick up signals from unknown stressors (such as GM crops) from a large data set without any prior knowledge of the possible effects of either the stressor or its spatial distribution (GS step 1). Subsequently, these changes can be linked either to the cultivation of GM crops or to other causes (GS step 2).
Example of statistical approach for GS
In the example described below, the Observational and Simulated Evidence (OSE) approach (Mulder et al., 2003) is used to show a basic approach to identify effects from a (previously unknown) stressor in Dutch soil systems, and the value of additional ecological information to identify differences between sites and the probable causes of these changes.
In this study by Mulder et al. (2003) changes were observed in the diversity and abundance of the nematode community in soils of Dutch farms, and it was found that these changes could only partly be explained by the abiotic conditions in the soils. By including a previously unidentified stressor, namely livestock density, which encompasses the amount of cattle, pig and poultry manure applied to grasslands, a larger part of the observed variation in the nematode community could be explained. The farming intensity (amount of manure applied) had a direct effect on the nematode community structure and on the functioning of the soil. The same approach can also be applied to correlate changes in the
nematode community due to other stressors, e.g. GM crops. Description of the model
A short description is given below of the procedures applied to BISQ data to identify the possible influence of the stressor (Livestock Units, LSU) and to distinguish between LSU effects and other environmental conditions, like temperature, rainfall, pH, phosphate concentration (for a more detailed description see Mulder et al., 2003).
The presence or absence of nematode taxa is determined (as binary data) in BISQ. However, binary data are highly case-sensitive for taxa occurrences; therefore, the binary nematode response at the originally scored taxonomic level (presence/absence of taxa) was rounded up and merged at trophic levels for either bacterial or hyphal-feeding habits. In this way, the sensitivity of the model to the presence/absence of individual species is minimized, and replaced by ‘feeding habit’ data, which are more robust in impact diagnostic analyses.
Merging nematodes at trophic levels also provided more ecological insight into their functioning in the soil. The ratio between bacterial feeding and hyphal feeding nematodes (the nematode channel ratio, NCR), reflects the relative importance of two pathways in the flux of matter and nutrients in the soil, i.e. the bacterial pathway and the fungal pathway. The ratio between the bacterial pathway and the fungal pathway is also a measure of the microbial competition in the soil.
After the data pre-treatment, a statistical model was applied to analyse the data and explore possible associations between the stressor (LSU) and the response of the nematode community, expressed as the nematode channel ratio (NCR). Results
The various parameters to describe or summarise nematode distribution patterns in managed grasslands were not fully explained by variables like pH and organic matter. However, the analyses showed that there was a statistically significant link between the effect on the shift in the functional characteristics of the nematode community on the one hand, and the variability in the Livestock Units on the other, despite the influence of all other factors (such as pH and organic matter) on the nematode community (Mulder et al., 2003; Mulder et al., 2011). This correlation is illustrated with GIS maps (Figure 7). The correlation between the effect on the nematode channel ratio (NCR) representing the nematode community the one hand, and the amount of manure deposited (LSU) on the other hand, can be visualized by comparing the colours in the GIS maps.
< 1.8 1.8 - 2.4 2.4 - 3.1 > 3.1
LSU
< 1.8 1.8 - 2.4 2.4 - 3.1 > 3.1LSU
NCR
NCR
Figure 7. GIS analysis of Dutch grasslands and pastures on sand
(Left). Variability of the nematode channel ratio (modelled NCR classes) as response variable over sites. (Right) Distribution of the potential stressor variable ´livestock density´(observed LSU classes). One livestock unit (LSU) is given here as the amount of dairy cattle excreting an average of 41 kg P ha-1 yr -1. The NCR ranges from 0.85 (blue pixels, low farming pressure) up to 0.91 (orange pixels, high farming pressure). Comparison (Mantel comparison) between the colours (indicating NCR and LSU classes) shows a robust and significant correlation between the nematode microbivores and the amount of deposited manure.