Agricultural
practice and
water quality
on farms
Agricultural practice and water quality on farms registered for derogation
Results for 2010 in the derogation monitoring network
Agricultural practice and water quality
on farms registered for derogation
Results for 2010 in the derogation monitoring network
Colophon
© RIVM 2012
Parts of this publication may be reproduced, provided acknowledgement is given to the 'National Institute for Public Health and the Environment', along with the title and year of publication.
E. Buis, RIVM
A. van den Ham, LEI
L.J.M. Boumans, RIVM
C.H.G. Daatselaar, LEI
G.J. Doornewaard, LEI
Contact:
Eke Buis
Centre for Environmental Monitoring
eke.buis@rivm.nl
This investigation has been performed by order and for the account of the Ministry of Economic Affairs, Agriculture and Innovation, within the framework of project 680717, Minerals Policy Monitoring Programme
Abstract
Agricultural practice and water quality on farms registered for derogation
Results for 2010 in the derogation monitoring network
This report provides an overview of fertilisation practice in 2010 and of water quality in 2010 and 2011 on grassland farms in the Netherlands that are allowed to use more livestock manure than the limit set in the EU Nitrates Directive (derogation). Data from this research can be used to evaluate the consequences of derogation for the water quality. The water quality values measured in 2010 reflect the consequences of agricultural practice in 2009, which was the fourth year in which the derogation was applied in practice. The water quality values measured in 2011 reflect the consequences of agricultural practice in 2010.
Background derogation monitoring network
The EU Nitrates Directive obliges member states to limit the use of livestock manure to a specified maximum (the application standard for livestock manure of 170 Kg N per hectare). A member state may request permission from the European Commission to deviate from this obligation under specific conditions. In December 2005, the Commission granted the Netherlands the right to derogate from the obligation from 2006 to 2009. On 5 February 2010, this derogation was extended to December 2013. One of the underlying conditions of the derogation is that the Dutch government establishes a monitoring network focused on derogation, and reports the results each year to the Commission.
Monitoring agricultural practice and water quality in 2010
In 2006, the National Institute for Public Health and the Environment (RIVM) and the Agricultural Economics Research Institute (LEI Wageningen UR), set up this derogation monitoring network for the Netherlands. This network measures the effects on agricultural practice and water quality when farmers are allowed to deviate from the European application standard for livestock manure. The derogation monitoring network is part of the Minerals Policy Monitoring Programme (LMM). In 2010 the agricultural practice was measured on 294 grassland farms and the water quality on 290 grassland farms. The
monitoring network covers 300 grassland farms. However, fewer than 300 farms are reported due to the fact that some farms did not apply for or were not awarded derogation in the end, or did not continue in the monitoring network on account of termination of business.
Keywords:
agricultural practice, derogation decision, manure, Nitrate Directive, water quality
Rapport in het kort
Landbouwpraktijk en waterkwaliteit op landbouwbedrijven aangemeld voor derogatie
Resultaten meetjaar 2010 in het derogatiemeetnet
Dit report geeft een overzicht van de bemestingspraktijk in 2010 en de waterkwaliteit in 2010 en 2011 op graslandbedrijven in Nederland die meer dierlijke mest mogen gebruiken dan in de EU-Nitraatrichtlijn is aangegeven (derogatie). De gegevens uit dit onderzoek kunnen worden gebruikt om de gevolgen van derogatie voor de waterkwaliteit te bepalen. De waterkwaliteit gemeten in 2010 geeft de gevolgen weer van de landbouwpraktijk in 2009, het vierde jaar dat de derogatie in de praktijk werd toegepast. De waterkwaliteit gemeten in 2011 geeft de gevolgen weer van de landbouwpraktijk in 2010.
Achtergrond derogatiemeetnet
De Europese Nitraatrichtlijn verplicht lidstaten om het gebruik van dierlijke mest te beperken tot een bepaald maximum (de gebruiksnorm dierlijke mest van 170 kg stikstof per hectare). Een lidstaat kan de Europese Commissie vragen om onder voorwaarden van deze beperking af te wijken. Nederland heeft in
december 2005 derogatie gekregen om van 2006 t/m 2009 af te mogen wijken van de gestelde norm voor dierlijke mest. Deze derogatie is op 5 februari 2010 verlengd t/m december 2013. Een van de voorwaarden hiervoor is dat de Nederlandse overheid een monitoringsnetwerk gericht op derogatie inricht en aan de Commissie jaarlijks rapporteert over de resultaten daarvan.
Monitoring van bedrijfsvoering en waterkwaliteit in 2010
Het Rijksinstituut voor Volksgezondheid en Milieu (RIVM) en LEI Wageningen UR, hebben dit monitoringsnetwerk in 2006 voor Nederland opgezet. Dit
zogenoemde derogatiemeetnet meet de gevolgen van de landbouwpraktijk en de waterkwaliteit als landbouwbedrijven afwijken van de Europese gebruiksnorm voor dierlijke mest. Het derogatiemeetnet is een onderdeel van het Landelijk Meetnet effecten Mestbeleid (LMM). Voor het derogatiemeetnet is in 2010 van 294 graslandbedrijven de bedrijfsvoering gemonitord en van 290 bedrijven de waterkwaliteit. Het meetnet omvat 300 graslandbedrijven. Dat er minder dan 300 bedrijven zijn gerapporteerd komt doordat sommige bedrijven toch geen derogatie toepasten of toegekend kregen of niet langer deelnamen vanwege bedrijfsbeëindiging.
Trefwoorden:
Preface
The National Institute for Public Health and the Environment (RIVM) and LEI Wageningen UR, have drawn up this report, commissioned by the Ministry of Economic Affairs, Agriculture and Innovation (EL&I), as well as on behalf of the Ministry of Infrastructure and the Environment (I&M). LEI is responsible for the information about agricultural practice and RIVM for the water quality data. RIVM is also the official secretary within this project.
This report provides an overview of agricultural practice in 2010 in respect of all the farms registered for derogation in the derogation monitoring network. This includes, among others, data on fertilising and nutrient surpluses realised. Information is also provided about the results of water quality monitoring in 2010 and 2011 at farms in the derogation monitoring network.
The present report covers virtually all the 300 farms participating in the derogation monitoring network. Due to changes in the sample population such as business termination, variations between participating farms occur
throughout the years measured. Moreover, in retrospect, not each farm uses the derogation in practice. Consequently, the numbers of farms in the different regions can vary among years. The 300 farms were either already participating in the Minerals Policy Monitoring Programme (LMM) or were recruited and sampled during sampling campaigns.
The authors thank Mr. M. van Rietschoten of the Ministry of Economic Affairs, Agriculture and Innovation, Mr. K. Locher of the Ministry of Infrastructure and the Environment, the members of the Feedback Group LMM and Mr. G.L. Velthof and Mr. J.J. Schröder of the Professional Committee for the Fertilisers Act (CDM) for their critical comments. Finally, we would like to thank our colleagues from LEI and RIVM who, each in their own way, have contributed to the realization of this report.
Eke Buis, Aart van den Ham, Leo Boumans, Co Daatselaar and Gerben Doornewaard
Contents
Summary—11
1 Introduction—21
1.1 Background—21
1.2 Previous reports—22
1.3 Content of this report—22
2 Design of the derogation monitoring network—25
2.1 Introduction—25
2.2 Design and realisation of the sample—26 2.2.1 Number of farms in 2010—26
2.2.2 Representativeness of the sample—27 2.3 Description of the farms in the sample—28 2.4 Monitoring of water quality—30
2.4.1 Sampling at farms—30
2.4.2 Chemical analyses and calculations—33
3 Results for 2010—35
3.1 Agricultural characteristics—35
3.1.1 Nitrogen use via livestock manure—35
3.1.2 Fertiliser use compared to the application standards (N and P)—36
3.1.3 Crop yields—38
3.1.4 Nutrient surpluses—39
3.2 Water quality—40
3.2.1 Leaching from the root zone, measured in 2010 (NO3, N and P)—40 3.2.2 Ditch water quality, measured in 2009-2010 (N and P)—42
3.2.3 Provisional figures for the measurement year 2011 (N and P)—44
4 Changes in the monitoring network since the derogation—47
4.1 Introduction—47
4.1.1 Selection of farms for comparison of results—47
4.1.2 Statistical method determination of differences and trends—47 4.2 Trends in the agricultural practice—48
4.2.1 Classification of the farms—48 4.2.2 Livestock manure—49
4.2.3 Use of fertilisers compared to the application standards—50
4.2.4 Crop yields—53
4.2.5 Nutrient surpluses on the soil surface balance—53
4.2.6 Summarised—55
4.3 Evolution of the water quality—56
4.3.1 Development average concentrations 2007-2011—57
4.3.2 Influence of environmental factors and sample on nitrate concentrations—60
4.3.3 Summarised—62
4.4 Effect of agricultural practice on the water quality—62 References—65
Appendix 1 The derogation decision, relevant articles—69
Appendix 2 Selection and recruitment of participants for the derogation monitoring network—71
Appendix 5 Method corrected nitrate concentration—97
Appendix 6 Economic indicators fertiliser use National Service for the Implementation of Regulations—101
Summary
Background
The Nitrates Directive obliges member states to limit the use of livestock manure to a maximum of 170 kg of nitrogen per hectare per year. A member state can, under certain conditions, ask the European Commission if it may deviate from this obligation (derogation). In December 2005, the European Commission issued a derogation decision to the Netherlands for the period 2006-2009; in February 2010 this was extended until December 2013. Under this decision, grassland farms with 70 percent or more grassland may, under prescribed conditions, apply up to 250 kg nitrogen (N) per hectare to their land in the form of manure from grazing livestock. In return, the Dutch government is obliged to set up a monitoring network for derogation farms in accordance with the requirements stipulated in the derogation decision, and to provide annual reports in this respect to the European Commission.
The derogation monitoring network
In 2006, a new monitoring network was established to monitor the evolution in agricultural practice and water quality as a consequence of the derogation. This derogation monitoring network comprises 300 farms that registered for
derogation. The derogation monitoring network was set up by expanding the Minerals Policy Monitoring Programme (LMM) of RIVM and LEI. By using a stratified random sampling method, the 300 farms are distributed as evenly as possible throughout the Netherlands in terms of region (sand, loess, clay and peat), farm type (dairy farms and other grassland farms) and economic size class. With this approach, the requirement that the derogation decision be representative for all soil types (clay, peat, sand and loess soils), cropping patterns and fertilisation practices – with the emphasis on the sand region – is effectuated.
Characteristics of farmland and farms in the derogation monitoring network
In 2010, the total agricultural area in the derogation monitoring network was 1.8 percent of the area used by all derogation farms that fulfilled the criteria for inclusion in the monitoring network (the sample population).
At 53 hectare (Table S1), the mean acreage of farms in the derogation monitoring network is larger than that of the average farm in the sample population (44 hectare). Dairy farms in the network also produced more milk per hectare, especially in the loess region. The percentage of farmland used as grassland (83 percent - Table S1) is slightly higher than in the sample
Table S1 Characteristics of farms included in the derogation monitoring network for 2010, per region.
Characteristics Region
Sand Loess Clay Peat All
Number of farms in the monitoring network
160 20 60 60 300 Number of farms with derogation
and fully processed inFADN1
158 19 59 58 294 - of which specialised dairy farms 133 17 51 52 253 - of which other grassland farms 25 2 8 6 41
Descriptive characteristics
Acreage of cultivated land (ha) 49 46 57 60 53 Percentage grassland 81 76 84 91 83 Milk production (kg FPCM2) per ha
fodder crop 16,000 15,900 16,500 15,000 15,900
1: FADN: Farm Accountancy Data Network
2: FPCM = Fat and Protein Corrected Milk – this is a comparative standard for milk with different fat and protein contents (1 kg milk with 4.00% fat and 3.32% protein = 1 kg FPCM). The means reported for the milk production only refer to the dairy farms (N = 253).
Use of fertilisers
In 2010, the farms in the derogation monitoring network used on average 246 kg of nitrogen from livestock manure per hectare of cultivated land
(Table S2) and, with this, they complied exactly with the application standard for livestock manure at farm level. On arable land, an average of 166 kg per
hectare was used, whereas on grassland an average of 260 kg nitrogen from livestock manure was applied.
The total use of nitrogen remained below the total nitrogen application standard. The use of phosphate remained some kg below the phosphate application standard.
Table S2 Mean use of fertilisers on farms in the derogation monitoring network in 2010, per region.
Characteristics Region
Sand Loess Clay Peat All
Nitrogen from livestock manure (kg N/ha)
Farm level 245 233 251 247 246 Arable land2 168 176 149 177 166
Grassland 258 254 274 256 260 Total plant-available nitrogen1 Farm level 233 231 271 248 243
(kg N/ha) Arable land2 115 174 120 121 122
Grassland 259 254 304 264 269 Total phosphates1 Farm level 89 86 90 90 89
(kg P2O5/ha) Arable land2 79 93 76 90 81
Grassland 91 84 94 90 91
1: From livestock manure, other organic and inorganic fertiliser. The quantity of plant-available nitrogen from livestock manure and other organic fertiliser was calculated using the statutory availability coefficients determined for 2010.
Crop yield and nutrient surpluses at farm level
On average, yields of 183 kg per hectare of nitrogen and 71 kg per hectare of phosphate were estimated for silage maize, and yields of 257 kg per hectare of nitrogen and 85 kg per hectare of phosphate were calculated for grassland (Table S3). The mean nitrogen surplus on the soil surface balance in 2010 was calculated to be 185 kg per hectare. This surplus decreases in the sequence peat > clay > sand and loess (Table S3). The high surplus in the peat region was caused by an average of 75 kg of net nitrogen mineralisation per hectare being included in the calculation, whereas in the other regions the net nitrogen mineralisation was negligible. Nevertheless, the nitrogen surplus on the soil surface balance in the clay region is higher than in the sand and loess regions, due to higher use of inorganic fertilisers (Table S2). The phosphate surplus on the soil surface balance is on average 12 kg P2O5 per hectare, with little difference between the regions, although the phosphate surplus in the clay region is slightly lower.
Table S3 Mean estimated silage maize yield and calculated grassland yield on all farms that satisfied the selection criteria for applying the calculation method (Aarts et al., 2008) and nutrient surpluses on the soil surface balance on the farms in the derogation monitoring network in 2010, per region.
Characteristics Region
Sand Loess Clay Peat All
Estimated silage maize yields1
Kg dry matter/ha 15,600 17,600 15,100 15,200 15,600
Kg N/ha 183 205 177 179 183
Kg P2O5/ha 71 81 70 69 71 Calculated yield on grassland1
Kg dry matter/ha 9200 9500 10,800 10,000 9700
Kg N/ha 245 249 283 272 257
Kg P2O5/ha 80 86 96 88 85 Nutrient surpluses per ha cultivated
land
Nitrogen surplus on the soil surface
balance (kg N/ha) 166 166 193 233 185 Phosphate surplus on the soil surface
balance (kg P2O5/ha) 13 11 9 13 12 1: The silage maize and grassland yields are based on 146 and 193 farms respectively. The other farms did not satisfy the selection criteria.
Comparison of agricultural practice for the years 2006 to 2010
The significant increase in the production of milk per farm, per hectare and per cow as opposed to an insignificant increase in acreage of cultivated land, indicates a slow ongoing increase in scale and intensification resulting in a higher production of milk per cow and more kg of milk per hectare. At the same time, the proportion of grassland remains more or less stable and the number of farms with grazing milk cows gradually diminishes (Table S4).
Table S4 Evolution of the average size and structure of farms and milk production on farms for grazing animals.
Characteristics 2006 2007 2008 2009 2010
Total acreage cultivated land (ha) 49 50 51 52 53 Proportion of grassland (%) 83 83 82 82 83 Proportion of farms with housed
animals (%)
17 17 17 14 14 kg FPCM1/farm (x 1000) 686 723 775 811 860
kg FPCM1/milk cow (x 1000) 8.4 8.4 8.4 8.5 8.7
kg FPCM1/ha fodder crop (x 1000) 14 14 15 15 16
Proportion of dairy farms with grazing milk cows (%)
89 88 86 83 79
1: FPCM = Fat and Protein Corrected Milk – this is a comparative standard for milk with different fat and protein contents (1 kg milk with 4.00% fat and 3.32% protein = 1 kg FPCM).
The nitrogen application standard for livestock manure is fully utilised
(Table S5). There is a slight but significant increase in the use of plant-available nitrogen with livestock manure. This increase is caused mainly by the increased availability coefficient of nitrogen in livestock manure. Also as a result of this increase in the stipulated availability coefficient, the difference between the total nitrogen application standard and the use of plant-available nitrogen decreased from an average of 50 kg per hectare (2006) to an average of around 20 kg per hectare (2010) (Table S5). The difference between the use of phosphates per hectare and the phosphate application standard decreased from an average of around 10 kg per hectare (2006/2007) to 2 kg per hectare (2010), mainly as a result of the stricter regulations for use which were introduced in 2010. These regulations also take into account the phosphate condition of the soil. The use of phosphates as well as the phosphate application standard dropped significantly between 2006 and 2010 (Table S5). This went hand in hand with the decreased use of phosphate inorganic fertiliser.
Table S5 Evolution of mean use of nitrogen in livestock manure, total use of plant-available nitrogen and phosphate, and surpluses on the soil surface balance of nitrogen and phosphate on farms for grazing animals.
Characteristics 2006 2007 2008 2009 2010
Use of nitrogen livestock manure, excluding availability coefficient/ha
243 238 241 251 246 Application standard livestock
manure/ha
243 241 243 244 246 Use of total of plant-available nitrogen,
including availability coefficient/ha
226 225 243 251 243 Total nitrogen application standard for
farms/ha
273 288 275 267 263 Mean nitrogen surplus on the soil
surface balance/ha
195 183 192 202 185 Use of phosphate/ha 97 93 93 97 89 Phosphate application standard for
farms/ha
106 103 98 98 91 Mean phosphate surplus on the soil
surface balance/ha
The surpluses on the soil surface balance for nitrogen fluctuated somewhat across the years, but did not significantly decrease between 2006 and 2010, while the phosphate surplus did show a significant decrease between 2006 and 2010 (Table S5). In 2010, the farms in the 25 percent quartile realised a phosphate surplus of below 0 kg per hectare (0 kg/ha = balance). The lower surpluses for nitrogen and phosphate on the soil surface balance are virtually equal to the decrease in use of inorganic fertilisers.
The phosphate application standard at farm level for 2010 is lower than average in the period 2006-2009. This is caused by the fact that, starting in 2010, the phosphate condition of the soil is taken into account, which means that for soil with a neutral or high phosphate value the phosphate application standard was lowered compared to the previous year. The dry matter and phosphate values with regard to the estimated silage maize yields and the calculated yield on grassland did not deviate from the means in the years 2006-2009. These values were hardly influenced by the lower fertilisation rate. However, there is a downward trend in the yield measured in kg nitrogen, caused by the lower N-values in the crops. This applies to grassland as well as silage maize.
Water quality in measurement year 2010
The water quality measured in 2010 partly reflects the agricultural practice in the fourth year of derogation (2009) and in previous years. The mean nitrate concentration is higher in the sand and loess regions than in the other two regions, just as in previous years. One of the reasons for this is that the loess and sand regions have a relatively large share of soils prone to leaching.
In the sand, clay and peat regions, the nitrate and total nitrogen concentrations in water leaching from the root zone (Table S6) are on average higher than in the ditch water (Table S7). In the sand and clay regions, the phosphorus concentrations in the ditch water are comparable to those in the water leaching from the root zone. In the peat region, the phosphorus concentrations in the ditch water are lower than those in the water leaching from the root zone. Table S6 Quality of the water leaching from the root zone in 2010; mean concentration of nitrate, total nitrogen and phosphorus1 in mg/l and the percentage of farms with a mean nitrate concentration higher than 50 mg/l.
Characteristic Region
Sand Loess Clay Peat
Number of farms 158 18 56 57
Nitrate (NO3) (mg/l) 45 51 29 12
Nitrate % farms > 50 mg/l 39 44 12 4 Nitrogen (N) (mg/l) 13 12 8.5 9.5 Phosphorus (P) (mg/l) 0.13 <dt 0.21 0.43
Table S7 Quality of the ditch water in the winter of 2009/2010; mean concentration of nitrate, total nitrogen and phosphorus in mg/l and the percentage of farms with a mean nitrate concentration higher than 50 mg/l.
Characteristic Region
Sand Clay Peat
Number of farms 31 55 56
Nitrate (NO3) (mg/l) 33 11 4
Nitrate % farms > 50 mg/l 19 0 0 Nitrogen (N) (mg/l) 9.6 4.6 3.9 Phosphorus (P) (mg/l) 0.13 0.24 0.14
Water quality in measurement year 2011, preliminary results
The preliminary results for the water quality in 2011 reflect the agricultural practice in 2010 (fifth year of derogation) and the previous years (Table S8 and S9). These figures can therefore be directly linked to the agricultural data that are stated in this report as well. The final results will be included in the report for 2013 (these are not expected to strongly deviate from the preliminary results).
Table S8 Quality of water leaching from the root zone in 2011; mean concentration of nitrate, total nitrogen and phosphorus in mg/l and the percentage of farms with a mean nitrate concentration higher than 50 mg/l.
Character Region
Sand Loess Clay Peat
Number of farms 158 * 57 59
Nitrate (NO3) (mg/l) 38 * 20 7
Nitrate % farms > 50 mg/l 30 * 7 2 Nitrogen (N) (mg/l) 12 * 6.3 8.7 Phosphorus (P) (mg/l) 0.20 * 0.23 0.39
*: At the time of preparation of the present report, results from the loess region were not yet available; sampling was conducted between September 2011 and February 2012.
Table S9 Quality of the ditch water in the winter of 2010/2011; mean concentration of nitrate, total nitrogen and phosphorus in mg/l and the percentage of farms with a mean nitrate concentration higher than 50 mg/l.
Characteristic Region
Sand Clay Peat
Number of farms 31 56 58
Nitrate (NO3) (mg/l) 25 8 4
Nitrate % > farms 50 mg/l 16 0 0 Nitrogen (N) (mg/l) 7.8 3.8 4.3 Phosphorus (P) (mg/l) 0.09 0.28 0.15
Comparison of water quality results for the period 2007 to 2011
This year results are available from five consecutive sampling years (except for the loess region).
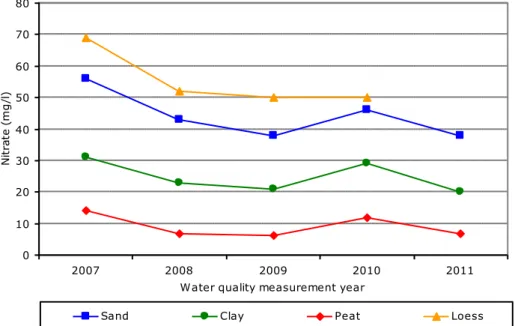
The nitrate and total nitrogen concentrations measured in the water leaching from the root zone fluctuate over the years (Figure S1), and show a decrease in the sequence loess > sand > clay > peat. In recent years, the mean nitrate concentration was below the 50 mg/l EU target value.
In 2011, the nitrate and total nitrogen concentrations measured in the water leaching from the root zone in the sand region were significantly lower than the mean of the previous years. This is not the case in the other regions. In the sand and loess regions the concentrations decreased significantly between 2007 and 2011 (Table 4.9). These significant trends were possibly influenced by the strong fall between 2007 and 2008. After 2008, the decrease was minimal, particularly in the loess region. In the other regions no significant decreases occurred between 2007 and 2011.
0 10 20 30 40 50 60 70 80 2007 2008 2009 2010 2011 Water quality measurement year
Ni tr at e (m g /l )
Sand Clay Peat Loess
Figure S1 Evolution of nitrogen concentrations leaching in the root zone per region in successive measurement years.
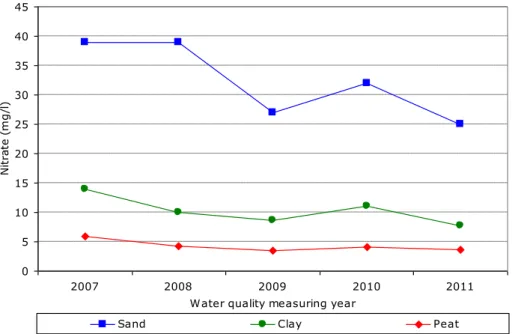
The nitrate and total nitrogen concentrations measured in the ditch water also fluctuated (Figure S2). None of the regions showed a significant difference between the concentrations in 2011 and the mean of the previous years. The sand and clay regions, however, did show a significant drop in nitrate
concentrations (Table 4.9).
In the clay, sand and peat regions the phosphorus concentration in the water leaching in the root zone fluctuated over the years (Table 4.9), and showed a decrease in the sequence peat > clay > sand > loess. In the ditchwater, the phosphorus concentrations decreased from clay to peat to sand. For both types of water, there was no significant difference between 2011 and previous years, nor were there any significant trends.
The final concentrations will be given in the progress report for 2013. In that report it will also become apparent if the trends have continued.
0 5 10 15 20 25 30 35 40 45 2007 2008 2009 2010 2011 Water quality measuring year
Ni tr at e (m g /l )
Sand Clay Peat
Figure S2 Evolution of nitrogen concentrations in the ditch water per region in successive measurement years.
Effect of agricultural practice on the water quality
Nitrogen
The nitrate concentration in the water leaching from the root zone showed a decrease in all regions in the period 2007-2009 (Figure S1). This decrease does not correspond to the evolution of the calculated nitrogen surplus in the same period (Figure S3). It is possible that the decrease is caused by the after-effects of drops in the nitrogen soil surplus before 2004. The calculated nitrogen surplus between 2006 and 2010 showed a slight fluctuation, but no further significant decrease. It is remarkable that the nitrogen surplus in the loess region rose significantly, while the nitrate concentration seemed to drop slightly.
Apart from the nitrogen surplus, there are other factors which play a part and which may have a diluting or concentrating effect on nitrate concentrations, such as weather conditions, sample adjustments, after-effects of nitrogen surpluses in previous years, reductions in the degree of grazing, and/or other factors. Farm management seems to move in the direction of further increase in scale and intensification in the dairy industry, whereby more and more
entrepreneurs opt for full time housing of dairy cows, resulting in reduced grazing (Table S4). This reduction possibly partly explains the significant decrease in nitrate concentrations in the sand region.
0 50 100 150 200 250 300 2006 2007 2008 2009 2010
Water quality measurement year
N-su rp lu s (k g N/ h a)
Sand Clay Peat Loess
Figure S3 Evolution of the N-surplus per region in successive measurement years (agricultural practice year x influences the following water quality year x+1).
Phosphate
The phosphate surplus on the soil surface balance decreased during the measurement period from 25 kg per hectare in 2006 to 12 kg per hectare in 2010, with a peak in 2009. This decrease was caused mainly by a reduction in the use of inorganic fertiliser. The effect of the decrease is not observed in the water quality, probably because of the strong fixation of phosphate to the soil. The phosphorus concentration in the leaching water and the ditch water is therefore mainly determined by the hydrological conditions and the degree of surface runoff.
1
Introduction
1.1 Background
The EU Nitrates Directive obliges member states to limit the use of livestock manure to a maximum of 170 kg of nitrogen per hectare per year (EU, 1991). A member state can ask the European Commission if, under certain conditions, it may deviate from this obligation (derogation). In December 2005, the European Commission issued the Netherlands with a definitive derogation decision for the period 2006-2009 (EU, 2005). Under this decision, grassland farms cultivating at least 70 percent of their total area as grassland are allowed to apply up to 250 kg of nitrogen per hectare in the form of livestock manure originating from grazing livestock on their total area. The derogation decision was extended in February 2010 till end of December 2013 (EU, 2010). The Dutch government is obliged to collect a wide range of data regarding the effects of the derogation and to report these annually to the European Commission.
One of the obligations of the derogation decision (Appendix 1) concerns the formation of ‘a monitoring network for the sampling of shallow groundwater, soil moisture, drainage water and ditches’ on farms permitted an individual
derogation (Article 8 of the decision, paragraph 2). The monitoring network must ‘provide data on the nitrate and phosphorus concentrations in the water leaving the root zone and ending up in the groundwater and surface water system’ (Article 8, paragraph 4). This monitoring network, which must cover at least 300 farms, should be ‘representative for all types of soil (clay, peat, sand and sandy loess), fertilisation practices and crop rotations’ (Article 8, paragraph 2). Within the monitoring network, the monitoring of the water quality on farms on sandy soils should be improved (Article 8, paragraph 5). The composition of the monitoring network should remain unchanged during the period
(2006-2013) to which the decision applies (Article 8, paragraph 2). During the negotiations with the European Commission, it was agreed that the design of this monitoring network would tie in with the existing national network for monitoring the effectiveness of the minerals policy, the Minerals Policy Monitoring Programme (LMM), under which the water quality and the
management of farms selected for this purpose have been monitored since 1992 (Fraters and Boumans, 2005). Additionally it was agreed that all participants in the LMM who satisfy the conditions could be regarded as participants in the monitoring network for derogation. Accordingly, the derogation monitoring network has become part of the LMM. For the LMM, the top metre of the
phreatic groundwater, the soil moisture and/or the drainage water are sampled, as this is regarded as sampling the water leaving the root zone (Appendix 4). The ditch water is sampled as well, in order to get an impression of the quality of the surface water on farms.
Aside from the obligation to monitor, there is the requirement to report the evolution of the water quality. The report should be based on ‘the monitoring of leaching from the root zone, the surface water quality and the groundwater quality, as well as on model-based calculations’ (Article 10, paragraph 1). Furthermore, an annual report must be submitted ‘for the different soil types and crops regarding the fertilisation and the yield on grassland farms on which derogation is permitted’, to provide the European Commission with an
has been optimised (Article 10, paragraph 4). This report is intended to meet the aforementioned reporting requirements.
1.2 Previous reports
The first report (Fraters et al., 2007) was limited to a description of the derogation monitoring network, the progress made in 2006 in terms of setting this up, and the design and content of the reports for the years 2008 t/m 2010. Also a general description of the measurement and calculation methods to be used and the models to be applied was included.
In 2008, the second report was published. This contained the first results from the derogation monitoring network (Fraters et al., 2008). The first year of derogation was 2006. The figures on the agricultural practice concern farm management under derogation. The water quality data from 2006 relates to the agricultural practice from 2005 and are therefore not yet related to farm
management under derogation.
The third progress report was published in 2009; it contains the data from 2007 (Zwart et al., 2009). In addition, a brief comparison is made between the results from 2006 and 2007, with the remark that water quality data from 2006 related to the agricultural practice in 2005. For this third progress report, there were insufficient measurement years available to be able to draw conclusions about trends.
The fourth progress report was published in 2010; this contains the data on the agricultural practice in 2008 and the data on the water quality in 2008 and, preliminary, 2009 (Zwart et al., 2010). Also, a brief comparison of the results from 2007, 2008 and 2009 is made, with the remark that the measurement series is too limited to draw solid conclusions about trends. For the first time, a limited analysis of the relationship between farm results and the associated water quality is conducted.
The fifth progress report was published in 2011; this contains the data on the agricultural practice in 2009 and the data on the water quality in 2009 and, preliminary, 2010 (Zwart et al., 2011). Additionally, the results from previous years are included, with a comparison for the agricultural practice between the mean of the period 2006-2008 and the measurement year 2009. For the water quality, this comparison is made for the period 2007-2009 and the measurement year 2010. Furthermore, a limited analysis is conducted of the relationship between farm results and the associated water quality.
1.3 Content of this report
This is the sixth annual report about the results of the derogation monitoring network. It reports on fertilisation, crop yields, nutrient surpluses and water quality. The nutrient surpluses are a major determinant for the quantity of nutrients that could potentially wash out.
The results in this report are based on the data as defined in the Farm
Accountancy Data Network (hereafter referred to as FADN) of LEI. In the FADN, the actual situation on the farm is established according to the report offered by the farmer. These data need not necessarily correspond to the data used in enforcement checks. The area used may differ from the area recorded in the land registration system of the National Service for the Implementation of
Regulations (DR) of the Ministry of Economic Affairs, Agriculture and Innovation, since land which belongs administratively to the farm but which is not actually used for fertilisation is not recorded in the FADN. Also, there may be different numbers of animals, different figures for the import and export of products and different stocks. The DR-results are reported in Appendix 6, whereby a
comparison is made with fertiliser use as compiled by the derogation monitoring network.
By relating the fertilisation, determined through using the data provided by FADN, to acreages actually used, the best possible insight is provided into the relationship between agricultural practice and water quality. However, these data cannot be used to assess compliance with the legislation, since this requires the data as recorded by the DR.
Both annual mean nitrate concentrations measured per region and the results of limited model calculations are included in the analysis of the data (Appendix 5). The calculations quantify the effect of confounding factors on the measured nitrate concentrations. Nitrate concentrations in the water leaching from the root zone are affected not only by fertilisation, but also by variations in the
precipitation surplus (Boumans et al., 1997). A statistical model has been developed to analyse the effect of variations in the precipitation surplus on the nitrate concentration in the uppermost layer of ground water (Boumans et al., 1997, 2001). This model corrects the sample for the changes in the composition of the group of participating farms (Fraters et al., 2004). Participants sometimes have to be replaced during the course of the programme or changes occur in the acreage of the participating farms. As a result, the ratio between the soil types and/or drainage classes on the farms in the derogation monitoring network can change during the course of the programme. The soil type (sand, loess, clay, peat) and the drainage class (poor, moderate, well drained) affect the relationship between the nitrogen surplus and the nitrate concentration measured. A change in the nitrate concentration measured could therefore be caused by a change in the composition of the group of participating farms or by changes in the acreage within this group.
Chapter 2 contains a brief description of the design and realisation of the derogation monitoring network. It also details the agricultural characteristics of the participating farms and provides a description of how the water quality is sampled. Also, an explanation of the models and analyses is given. Chapter 3 presents and discusses the measurement results of the monitoring of the agricultural practice and the water quality in 2010 (Figure 1.1). The water quality data for 2010 are related to the agricultural practice data for 2009 and the preceding years. This chapter also contains the provisional results of the water quality monitoring for 2011, which are related to the agricultural practice data for 2010 and the preceding years. The data regarding the loess sampling carried out between the autumn of 2011 and the spring of 2012, are not included in this report. In chapter 4, developments in the agricultural practice and water quality are described, whereby statistics are studied to determine both the degree to which agricultural practice in 2010 deviated from previous years and trends since the beginning of derogation. Furthermore, a cautious evaluation is provided as to the effect of the agricultural practice on the water quality.
Figure 1.1 Overview of period of collecting the monitoring results as presented for the agricultural practice and the water quality.
The relevant articles from the derogation decision granted to the Netherlands by the European Commission (EU, 2005) have been included in Appendix 1.
Appendix 2 provides further details about the design of the derogation monitoring network. The other appendices provide a detailed justification
concerning the registration of data on the agricultural practice, the calculation of the fertilisation and the nitrogen and phosphate surpluses, the application of limits of probability (Appendix 3) and how the quality of the water is measured (Appendix 4). The methodology applied for precipitation correction and the calculation of the corrected nitrate concentration is provided in Appendix 5. Finally, in Appendix 6 a comparison is made between the use of fertilisers according to the data of DR and according to the data collected via the derogation monitoring network.
2
Design of the derogation monitoring network
2.1 Introduction
The design of the derogation monitoring network must satisfy the requirements of the European Commission, as stipulated in the derogation decision of
December 2005 and the extension of the derogation in 2010 (Appendix 1). Previous reports provided extensive details about the composition of the sample and the choices this entailed (Fraters and Boumans, 2005; Fraters et al., 2007). The setting up of the derogation monitoring network and the reporting of the results follows the segmenting of the Netherlands into regions, according to the action programmes for the Nitrate Directive (EU, 1991). Four regions are distinguished: the sand region, the loess region, the clay region and the peat region. The acreage of farmland in the sand region constitutes about 46 percent of the approximately 1.85 million hectares of farmland in the Netherlands (Baumann et al., 2012). The acreage of farmland in the loess region constitutes approximately 1.5 percent, in the clay region approximately 40 percent and in the peat region approximately 12.5 percent of the total farmland.
The sampling of the water quality for the measurement year 2010 was carried out during the winter of 2009/2010 in the Low Netherlands and in the summer and the winter of 2010/2011 in the High Netherlands (see also section 2.4.1). The Low Netherlands covers the clay and peat regions and those soils in the sand region that are drained via ditches, whether or not in combination with drainage pipes or surface drainage. The High Netherlands covers the other sand and loess soils. The sampling for determining the water quality for measurement year 2011 took place in the winter of 2010/2011 and in the summer of 2011 respectively. The associated sampling of the loess soils took place in the winter of 2011/2012. These latter data are not included in the report. Water sampling took place on 300 farms in the derogation monitoring network. Farms that (despite submitting an application) did not use the derogation were not included in this report, so as to ensure that the results concerning the effect of using derogation were not confounded. Consequently, the number of farms reported on deviates from the initial number of 300.
The water quality measured in 2010 partly reflects the agricultural practice in the year 2009 and the preceding years. The extent to which the agricultural practice in a previous year affects the measured water quality depends on factors such as the level and variation of the precipitation surplus in that year and the local hydrological circumstances. In the High Netherlands it is assumed that the agricultural practice is reflected in the water quality at least one year later. In the Low Netherlands the agricultural practice is reflected sooner. This difference in hydrology also explains the different sampling methods and periods employed in the Low and the High Netherlands.
As previously stated, all farm management data relevant for the derogation were registered for the 300 farms selected for derogation, according to the FADN-system (Poppe, 2004). A description of the monitoring of the agricultural characteristics and the methods of calculation of fertilisation and nutrient surpluses are to be found in Appendix 3. The water sampling on the farms was
carried out in accordance with the standard LMM-procedures (Fraters et al., 2004). This sampling method is explained in Appendix 4.
2.2 Design and realisation of the sample
2.2.1 Number of farms in 2010
The derogation monitoring network is a permanent monitoring network. However, the loss of a number of farms is inevitable. Farms can drop out because:
at the end of the year they indicate that they do not use the derogation; they no longer participate in the LMM because of termination of business,
because cultivated land is no longer used or because of administrative problems.
Furthermore, although a farm has been processed in the FADN, it might have proved impossible to fully describe the nutrient flows. This could have been due to the presence on the farm of animals from other owners, as a result of which the import and export of feed, animals and manure is by definition incomplete, or because of administrative errors in the registration of imports and/or exports. Of the 300 planned farms, 294 actually made use of derogation. The agricultural practice of 298 farms was successfully established and water sampling was successfully carried out at 290 farms (Table 2.1). In each region, a small number of farms dropped out or the information was incomplete. Compared to 2008, six farms did no longer participate in the FADN in 2009 and 2010. Therefore, these farms were replaced.
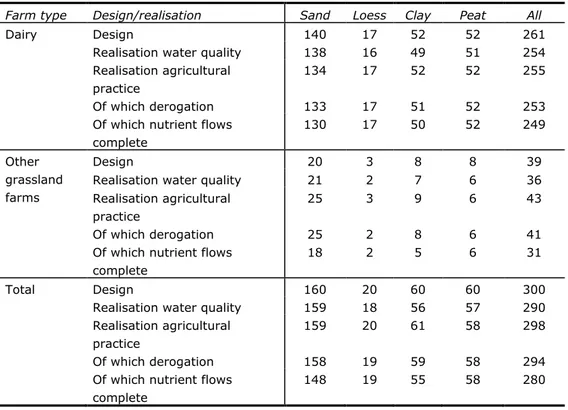
Table 2.1 Planned (design) and realised (realisation) number of dairy and other grassland farms per region in 2010.
Farm type Design/realisation Sand Loess Clay Peat All
Dairy Design 140 17 52 52 261 Realisation water quality 138 16 49 51 254 Realisation agricultural practice Of which derogation 134 133 17 17 52 51 52 52 255 253 Of which nutrient flows
complete 130 17 50 52 249 Other grassland farms Design 20 3 8 8 39
Realisation water quality 21 2 7 6 36 Realisation agricultural practice Of which derogation 25 25 3 2 9 8 6 6 43 41 Of which nutrient flows
complete
18 2 5 6 31 Total Design 160 20 60 60 300
Realisation water quality 159 18 56 57 290 Realisation agricultural practice Of which derogation 159 158 20 19 61 59 58 58 298 294 Of which nutrient flows
complete
The various sections of this report detail the agricultural practice on the following numbers of farms:
The description of general farm characteristics (section 2.3) concerns all farms that could be processed in FADN in 2010 and that made use of the derogation (= 294).
The description of agricultural practice in 2010 (section 3.1) concerns all farms for which the nutrient flows could be fully completed in FADN (= 280). The comparison between the agricultural practice in the years 2006 to 2010 (section 4.2) includes all farms that participated in the derogation monitoring network in the respective years. Per year, this number varies. For 2006 this concerns 285 farms, for 2007 281 farms, for 2008 283 farms, for 2009 276 farms and for 2010 280 farms.
The report details the water quality on the following numbers of farms:
The description of the water quality of measurement year 2010 (section 3.2) concerns all farms that could be processed in FADN 2010, that made use of derogation and where water quality measurements were carried out in 2010 (= 290).
The description of the water quality of measurement year 2011 (section 3.2) concerns all farms in the derogation monitoring network 2010, except the loess farms, where the water quality was sampled in measurement year 2011 (n = 275).
The evolution of the water quality for the years 2007 to 2011 (section 4.3) concerns all farms that in the agricultural practice year preceding the measurement year participated in the derogation monitoring network. The number varies per year. For 2007, data are available of 295 farms, for 2008 of 293 farms, for 2009 of 296 farms, for 2010 of 294 farms and for 2011 of 275 farms (except for the loess region).
2.2.2 Representativeness of the sample
In 2010 294 farms of the planned sample, with a total acreage of
15.387 hectare (1.8 percent of the Dutch agricultural acreage on grassland farms) registered for derogation (Table 2.2). The sample population covers 86.5 percent of the farms and 96.9 percent of the acreage of all farms that registered for derogation in 2010 and which satisfied the LMM selection criteria (the sample population, Appendix 2).Farms outside the sample population that did sign up for derogation are mainly other grassland farms with a size of less than 16 NGE (Netherlands units of magnitude). In the new farm definition this is 25,000 SO (Standard Output).
A minimum number of farms is needed to be able to make a reasoned statement per region. For loess, that minimum has been set at 15 (Fraters and Boumans, 2005). The loess region is relatively small, so it does not have many derogation farms in the sample populations. Consequently, a relatively large number of farms (16 percent) is included in the monitoring network. Furthermore, the dairy farms in all regions are more strongly represented in the acreage than the other grassland farms. This is because the desired number of sample farms per farm type is derived during the selection and acquisition process from the share in the total acreage of cultivated land, whereas the other grassland farms included were on average smaller than the dairy farms in terms of the acreage of cultivated land.
Table 2.2 Area of cultivated land (in ha) in the derogation monitoring network compared to the total area of cultivated land of farms with derogation in 2010 in the sample population, according to the Agricultural Census 2010.
Sample population1 Derogation monitoring network
Region Farm type Area (ha) Area (ha)
% of acreage sample population
Sand Dairy farms 359,188 6886 1.9% Other grassland farms 57,560 826 1.4%
Total 416,747 7712 1.9%
Loess Dairy farms 4838 814 16.8% Other grassland farms 782 66 8.5%
Total 5620 880 15.7%
Clay Dairy farms 202,118 3057 1.5% Other grassland farms 29,815 254 0.9%
Total 231,932 3311 1.4%
Peat Dairy farms 161,123 3336 2.1% Other grassland farms 19,063 149 0.8%
Total 180,186 3484 1.9%
All Dairy farms 727,267 14,093 1.9% Other grassland farms 107,219 1295 1.2%
Total 834,486 15,387 1.8%
1: Estimate based on Statistics Agricultural Census 2010 processed by LEI. Further information on how the sample population was defined can be found in Appendix 2.
2.3 Description of the farms in the sample
The 294 farms which registered for derogation have an average of 53 hectare of cultivated land, of which 83 percent is grassland. The stocking density is
2.27 LSU (Phosphate Livestock Units) per hectare (Table 2.3). For comparison, data from farms in the 2010 Agricultural Census have been included, in so far as these farms are included in the sample population (Appendix 2).
An examination of the agricultural characteristics of the sample population and a comparison with the farms from the Agricultural Census (Table 2.3) reveal the following differences:
The mean acreage of cultivated land of the sampled farms is on average 20 percent greater than that of the farms in the sample population. This applies to all regions.
The acreage of natural habitat (1.1 hectare) is not included in the calculation of the environmental pressure per hectare of cultivated land (fertilisation, surpluses and the like).
The proportion of grassland on the sampled farms (83 percent) is virtually the same as the mean of the sample population.
90 percent of the arable land on the farms sampled is used for silage maize. The stock density of grazing livestock on the farms sampled is on average 5 percent higher than the mean of the sample population.
The proportion of farms sampled where grazing animals as well as housed animals are present is higher than the mean of the sample population. Dairy cattle and the associated young stock constitute almost 95 percent of the grazing livestock present. The group of other grazing livestock consists of beef cattle, sheep, goats, horses and ponies.
Table 2.3 Description of a number of general farm characteristics in 2010 of the farms in the derogation monitoring network (DM) compared to the mean of the sample population (Agricultural Census, LBT for short).
Farm characteristic1 Population Sand Loess Clay Peat All
Number of farms DM DM 158 19 59 58 294 Area grassland (ha) DM 39 34 46 53 43
LBT 31 29 42 41 36 Area silage maize (ha) DM 9.3 9.9 8.6 7.4 8.8 LBT 7.5 7.5 5.5 3.8 6.3 Area other arable land (ha) DM 0.8 2.0 2.0 0.1 1.0 LBT 1.3 2.9 2.3 1.1 1.5 Area cultivated land (ha) DM 49 46 57 60 53 LBT 40 39 50 46 44 Percentage grassland (%) DM 81 76 84 91 83 LBT 78 74 84 89 82 Area natural habitat (ha) DM 0.5 2.3 2.5 0.9 1.1 LBT 0.8 1.3 1.2 0.8 0.9 Phosphate livestock units DM 2.29 2.26 2.40 2.11 2.27 (LSU/ha)2 LBT 2.28 2.14 2.03 1.98 2.16
Percentage farms with housed DM 15 16 8 14 14
animals *%) LBT 14 2 5 7 10
Specification stock density derogation monitoring network (LSU/ha)2
Dairy cattle (including young stock) DM 2.18 2.11 2.20 1.99 2.14 Other grazing animals DM 0.11 0.15 0.20 0.11 0.13 Total housed animals DM 0.85 0.08 0.51 0.25 0.62 Total all animals DM 3.14 2.35 2.91 2.35 2.89 Source: Statistics Netherlands Agricultural Census 2010, processed by LEI, and FADN.
1: Areas are given in hectares of cultivated land and the acreage of natural habitat is not included.
2: LSU = Livestock Unit; this is a comparative standard for animal numbers based on the phosphate production forfeit (phosphate production forfeit dairy cow = 1 LSU).
The above comparison of the population of farms sampled with the Agricultural Census indicates that the population of farms sampled is a proper reflection of the Agricultural Census.
The dairy farms in the derogation monitoring network have an average of 15,900 kg of milk per hectare and produce 860,000 kg of milk per farm (Fat and Protein Corrected Milk, FPCM). Per cow, the milk production is 8,670 kg FPCM per year (Table 2.4). As the correct comparative material was not present in the Agricultural Census, for comparative purposes this table contains the weighted mean of the national sample from the FADN. In all regions, the dairy farms in the derogation monitoring network have a larger acreage and a higher milk production per farm than the weighted national mean. For loess, this comparison is not available, because for this type of region the number of farms in the FADN is too small.
Table 2.4 Mean milk production and grazing on dairy farms in the derogation monitoring network (DM) in 2010 compared to the weighted mean of dairy farms in the national sample (FADN).
Farm characteristic Populatio n
Sand Loess Clay Peat All
Number of farms in DM DM 133 17 51 52 253 kg FPCM farm DM 791,800 715,900 962,500 983,200 860,000 FADN 694,700 775,900 738,300 712,300 kg FPCM/ha forage crop DM 16,000 15,900 16,500 15,000 15,900 FADN 16,200 15,200 14,200 15,500 kg FPCM/dairy cow DM 8700 8510 8800 8530 8670 FADN 8900 8600 8370 8700 Percentage farms with
grazing
DM 80 82 76 76 79
FADN 77 81 84 80
1: FPCM = Fat and Protein Corrected Milk; this is a standard used for comparing milk with different fat and protein contents (1 kg milk with 4.00% fat and 3.32% protein = 1 kg FPCM).
An examination of the differences between the farms in the derogation monitoring network and the FADN-farms reveals the following:
The mean milk production per farm on the dairy farms in the derogation monitoring network is on average 21 percent higher than the national mean. In the sand region the difference is the smallest (approximately 15 percent). The mean milk production per hectare and per milk cow present on the dairy farms in the derogation monitoring network hardly differ from the national mean in FADN (Table 2.4).
2.4 Monitoring of water quality
2.4.1 Sampling at farms
In measurement year 2010, water quality samples were carried out on 290 farms of the 294 farms in the derogation monitoring network that had applied for and used derogation in (agricultural practice year) 2010 (Table 2.5 and Figure 2.1). The difference of 4 farms is caused by the fact that these farms were new in the derogation monitoring network in measurement year 2010 and were sampled for water quality for the first time in measurement year 2011. Also, some farms in the derogation monitoring network were sampled while these farms did not use derogation in 2010 (3 farms) or switched to organic farming in 2010 (1 farm). These were not included in the results of the water quality and the agricultural practice. In 2011, 275 derogation farms were sampled in the sand, clay and peat regions. This concerns the sampling of the groundwater, drain water and/or soil moisture. On the participating farms in the Low Netherlands, the ditch water was also sampled. The number of farms sampled is stated in Table 2.5, as well as the mean sampling frequency. The results of the agricultural practice in the year 2010 are linked to those of the water quality in the following period (water quality year 2011).
The water quality sampling associated with the agricultural practice of 2009 took place in the period between October 2009 and February 2011 (Figure 2.1).The water quality sampling associated with the agricultural practice data of 2010 took place in the period between October 2010 and February 2012. The results of the water quality in the loess region, sampled from October 2011 to February 2012, are not available for this report because the required quality control has not yet been carried out. In this report, the water quality data for agricultural practice year 2010 are preliminary. Definite figures will be reported in 2013. The definite 2011/2012 data for the loess region will also be available in 2013. A detailed description of the sampled method per region is provided in Appendix 4. Table 2.5 Number of sampled farms1 per sub-programme and per region for 2010 and 2011, and the sampling frequency of the leaching (L) and ditch water (DW). The desired sampling frequency is stated in parentheses.
Year Sand Loess Clay Peat
All farms Of which drained 2010 158 31 18 56 57 L-rounds 1.0 (1) - (-) 1.0 (1) 3.2 (2-42) 1.0 (1) DW-rounds - (-) 4.0 (4) - (-) 3.9 (4) 3.7 (4) 2011 158 31 * 57 59 L-rounds 1.0 (1) - (-) * 3.0 (2-42) 1.0 (1) DW-rounds - (-) 3.8 (4) * 3.8 (4) 4.0 (4)
1: The difference between the total number of farms reported in the text and given in this table is caused by one sand farm where only ditch water and no leaching from the root zone was sampled.
2: In the clay region, groundwater is sampled up to 2 times and drainage water up to 4 times, depending on the type of farm. The average total number of samples will therefore always be between 2 and 4, depending on the proportion of farms with groundwater sampling and those with drainage water sampling.
*: In the loess region, 20 derogation farms were sampled in the period October 2011 to February 2012. The results of these samplings were not yet available when this report was compiled.
Figure 2.1 Sampling periods for water quality in 2010 (green) and 2011 (yellow) per region per programme.
Figure 2.2 shows the distribution of the sampled farms over the regions. Also, a distinction is made between dairy farms and other grassland farms. The
distribution clearly shows that the focus of the derogation monitoring network lies with the farms in the sand region. Apart from this, a relatively large number of farms is located in Southern Limburg. The reason for this is that at least 15 farms must be sampled to be able to draw adequately substantiated conclusions (Fraters and Boumans, 2005).
Figure 2.2 Location of the 290 grassland farms that participated in the water sampling for the derogation monitoring network in 2010.
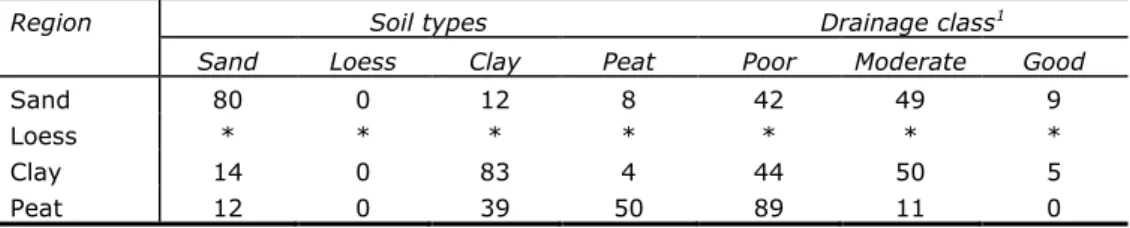
The soil and drainage characteristics of the farms concerned are given per region in Table 2.6 and Table 2.7 for 2010 and 2011 respectively. Within a region, other soil types occur in addition to the main soil type for which the region is named. The loess region primarily consists of naturally good-draining soils and the peat region chiefly contains naturally poor-draining soils. The good-draining soils in the sand region are less well represented in the derogation monitoring network. Originally, the best soils (with a favourable drainage situation and nutrient status) were used for agriculture, while poorer (e.g. wetter) soils were used for dairy cows. Also, the driest soils in the sand region often have no agricultural function. Therefore, especially the wetter sand soils are represented in the derogation monitoring network. The differences in soil type and drainage class in the derogation monitoring network between 2010 and 2011 are minimal.
Table 2.6 Soil type and drainage class (in percentages) per region on derogation farms sampled in 2010.
Region Soil types Drainage class1
Sand Loess Clay Peat Poor Moderate Good
Sand 80 0 12 8 42 49 9
Loess 2 76 22 0 2 3 95
Clay 14 0 83 3 43 51 6
Peat 12 0 39 50 89 11 0
1: The drainage classes are linked to the groundwater regime classes. The class naturally poor draining contains Gt I to Gt IV, the class moderately draining Gt V, V* and VI, and the class good draining Gt VII and Gt VIII.
Table 2.7 Soil type and drainage class (in percentages) per region on derogation farms sampled in 2011.
Region Soil types Drainage class1
Sand Loess Clay Peat Poor Moderate Good
Sand 80 0 12 8 42 49 9
Loess * * * * * * *
Clay 14 0 83 4 44 50 5
Peat 12 0 39 50 89 11 0
1: The drainage classes are linked to the groundwater regijme classes. The class naturally poor draining contains Gt I to Gt IV, the class moderately draining Gt V, V* and VI ,and the class good draining Gt VII and Gt VIII.
*: Results from the loess region were not yet available when this report was compiled.
2.4.2 Chemical analyses and calculations
The chemical analyses of the water samples were carried out in the accredited analytical laboratory of the RIVM. Table 2.8 provides an overview of the methods used for the different components. Further details can be found in Wattel-Koekkoek et al. (2008).
Table 2.8 Components analysed with analysis method and detection limit.
Component Analysis method1 Detection limit
Nitrate (NO3) IC 0.31 mg l-1
Ammonium (NH4) CFA 0.064 mg l-1
Total nitrogen (N) CFA 0.2 mg l-1
Total phosphorus (P) Q-ICP-MS 0.062 mg l-1 1: Analysis method: Q-ICP-MS: Quadruple inductively coupled plasma mass spectrometry, IC: Ion chromatography and CFA: Continuous flow analyser.
An annual mean concentration per component was calculated for each farm. For this calculation, observations with a concentration lower than the detection limit were assigned a value of 0. This allows farm mean concentrations below the detection limit to be calculated. If in the results presented in this report values below the detection limit occur, this will be indicated by <dt.
3
Results for 2010
3.1 Agricultural characteristics
3.1.1 Nitrogen use via livestock manure
The use of nitrogen from livestock manure on farms in the derogation
monitoring network in 2010 did not, on average, deviate from the application standard for livestock manure which can be specifically calculated for the farms (Table 3.1). For most of the farms, the manure production was calculated by means of forfeit standards. However, dairy farmers could also choose to deviate from these standards and to calculate a farm-specific manure production using the so-called Guidance (LNV, 2009). This farm-specific manure production was adopted for dairy farms that indicated they were using the Guidance and for which all of the necessary data were available (N = 76). On all other farms (N = 204) forfeits were used to determine the manure production. A more detailed explanation of the farm-specific and forfeit calculation methods for manure use is provided in Appendix 3.
Table 3.1 Mean nitrogen use via livestock manure (in kg N per ha) in 2010 on farms in the derogation monitoring network. Means per region.
Description Sand Loess Clay Peat All
Number of farms 148 19 55 58 280 Produced on farm1 281 263 285 265 277 + import 13 7 5 10 10 + stock mutation2 -7 -11 -9 -7 -8 - export 42 26 31 22 34 Total 245 233 251 247 246
Application standard livestock manure 246 243 247 247 246 Use on arable land3 168 176 149 177 166
Use on grassland3 258 254 274 256 260 1: Calculated on the basis of forfeit standards with the exception of dairy farms that indicated they were using the Guidance farm-specific excretion dairy cattle (see Appendix 3).
2: A negative stock mutation is a stock increase and will correspond to export.
3: The mean use and the application standards on grassland and arable land are based on 274 farms and 201 farms respectively instead of 280 farms, as on 6 farms the allocation of fertilisers to arable land did not fall within the confidence intervals and because 73 farms had no arable land.
The most important comments on the use of nitrogen from livestock manure are (Table 3.1):
The mean application standard for livestock manure (246 kg per hectare) was below the derogation standard of 250 kg N from grazing livestock manure (derogation decision) because:
- a number of farms had only applied for derogation on a part of their acreage;
- a number of farms also applied manure from housed animals for which a standard of 170 kg per ha applies;
For the farms in the derogation monitoring network the mean use of nitrogen from livestock manure (246 kg per hectare) was exactly in line with the mean application standard for livestock manure. The use of nitrogen from livestock manure on clay was a number of kg higher than the mean application standard.
The use of nitrogen from livestock manure on arable land (mainly silage maize) was considerably lower in all regions than the use on grassland. The use of animal manure in 2010, including rounding-off differences, was 7 kg N per hectare lower than the mean 253 kg N per hectare in 2009 (Zwart et al., 2011). The causes were:
13 kg N less use through a change in the stock mutation: a stock decrease of 5 kg N in 2009, a stock increase of 8 kg N in 2010;
an increase in manure production of 9 kg N; a modest decrease of 2 kg N in manure import; a modest increase of 2 kg N in manure export.
The farms in the monitoring network both import and export livestock manure. As the average production was higher than the use allowed, the average manure export was higher than the import (including the stock mutation).
This is applicable for all regions (Table 3.2).
Table 3.2 Percentage of farms in the derogation monitoring network that imported and/or exported livestock manure in 2010. Means per region.
Description Sand Loess Clay Peat All
No import and export 23 16 34 36 28
Only export 36 47 44 34 38
Only import 23 26 10 21 20
Both import and export 17 11 12 9 14
Table 3.2 shows that on more than 25 percent of the farms in the monitoring network there was no import or export of manure. On more than a third of the farms manure was only exported, whereas on one fifth of the farms manure was only imported. It would seem that these farmers were of the opinion that the import of nutrients via livestock manure provided economic benefits as compared to using inorganic fertiliser. This may also apply to the farmers who both imported and exported manure (14 percent).
3.1.2 Fertiliser use compared to the application standards (N and P)
The quantity of plant-available nitrogen from livestock manure is calculated by multiplying the quantity of nitrogen in livestock manure used (produced on own farm or imported, Table 2.1) by the prevailing statutory plant-availability coefficients relevant to the specific situation (see Appendix 3). To allow a comparison of fertiliser use, these tables also contain the mean application standards per ha for arable land (mainly maize acreage) and grassland, from which the application standards at farm level have been derived. These mean application standards are based on the acreage of cultivated crops and the soil type classifications as registered in FADN and the statutory application standards determined for 2010 (National Service for the Implementation of Regulations, 2006, 2011).
In 2010, the use of nitrogen on the farms in the monitoring network was as follows (Table 3.3):
In all regions, the calculated total (plant-available) nitrogen use at farm level was lower than the nitrogen application standard. This also applies for grassland and arable land separately, except for arable land in the loess region.