CLIMATE CHANGE
Scientific Assessment and Policy Analysis
WAB 500102 032
Pledges and Actions
A scenario analysis of mitigation costs and carbon
market impacts for developed and developing countries
CLIMATE CHANGE
SCIENTIFIC ASSESSMENT AND POLICY ANALYSIS
PLEDGES AND ACTIONS
A scenario analysis of mitigation costs and carbon market
impacts for developed and developing countries
Report
500102 032Authors
M.G.J. den Elzen M.A. Mendoza BeltranJ. van Vliet S.J.A. Bakker
T. Bole
October 2009
This study is part of the Netherlands Research Programme on Scientific Assessment and Policy Analysis for Climate Change (WAB), project Balancing the Carbon Market
Page 2 of 121 WAB 500102 032
Wetenschappelijke Assessment en Beleidsanalyse (WAB) Klimaatverandering
Het programma Wetenschappelijke Assessment en Beleidsanalyse Klimaatverandering in opdracht van het ministerie van VROM heeft tot doel:
• Het bijeenbrengen en evalueren van relevante wetenschappelijke informatie ten behoeve
van beleidsontwikkeling en besluitvorming op het terrein van klimaatverandering;
• Het analyseren van voornemens en besluiten in het kader van de internationale
klimaatonderhandelingen op hun consequenties.
De analyses en assessments beogen een gebalanceerde beoordeling te geven van de stand van de kennis ten behoeve van de onderbouwing van beleidsmatige keuzes. De activiteiten hebben een looptijd van enkele maanden tot maximaal ca. een jaar, afhankelijk van de complexiteit en de urgentie van de beleidsvraag. Per onderwerp wordt een assessment team samengesteld bestaande uit de beste Nederlandse en zonodig buitenlandse experts. Het gaat om incidenteel en additioneel gefinancierde werkzaamheden, te onderscheiden van de reguliere, structureel gefinancierde activiteiten van de deelnemers van het consortium op het gebied van klimaatonderzoek. Er dient steeds te worden uitgegaan van de actuele stand der wetenschap. Doelgroepen zijn de NMP-departementen, met VROM in een coördinerende rol, maar tevens maatschappelijke groeperingen die een belangrijke rol spelen bij de besluitvorming over en uitvoering van het klimaatbeleid. De verantwoordelijkheid voor de uitvoering berust bij een consortium bestaande uit PBL, KNMI, CCB Wageningen-UR, ECN, Vrije Univer-siteit/CCVUA, UM/ICIS en UU/Copernicus Instituut. Het PBL is hoofdaannemer en fungeert als voorzitter van de Stuurgroep.
Scientific Assessment and Policy Analysis (WAB) for Climate Change
The Netherlands Programme on Scientific Assessment and Policy Analysis for Climate Change (WAB) has the following objectives:
• The collection and evaluation of relevant scientific information for policy development and
decision-making in the field of climate change;
• The analysis of resolutions and decisions in the context of international climate negotiations
and their implications.
WAB analyses and assesses the most recent available data with the aim of making a balanced evaluation to support policy choices. These analyses and assessments are conducted during periods ranging from several months to a maximum of one year, depending on the complexity and the urgency of the policy issue. Assessment teams consisting of the best Dutch experts in their fields are appointed to address the various topics. These teams work on activities that are financed on an incidental and supplemental basis, in contrast to the regular, structurally financed activities of the climate research consortium. The work is intended to reflect the scientific state-of-the-art in the relevant topic.
The main commissioning bodies are the National Environmental Policy Plan departments, with the Ministry of Housing, Spatial Planning and the Environment assuming a coordinating role. Work is also commissioned by civic organisations that play an important role in the decision-making process concerned with climate policy and its implementation. A consortium consisting of the following organisations is responsible for the implementation: the Netherlands Environmental Assessment Agency (PBL), the Royal Dutch Meteorological Institute, the Climate Change and Biosphere Research Centre (CCB) of Wageningen University and Research Centre (WUR), the Energy research Centre of the Netherlands (ECN), the Netherlands Research Programme on Climate Change Centre at VU University Amsterdam (CCVUA), the International Centre for Integrative Studies of the University of Maastricht (UM/ICIS) and the Copernicus Institute at Utrecht University (UU). The Netherlands Environmental Assessment Agency (PBL), as the main contracting body, chairs the Steering Committee.
For further information:
Please contact the Netherlands Environmental Assessment Agency PBL, WAB Secretariat (ipc 90), P.O. Box 303, 3720 AH Bilthoven, the Netherlands, tel. +31 30 274 3728 or email: wab-info@pbl.nl. This report is available at www.pbl.nl\en in pdf-format.
Preface
This report was commissioned by the Netherlands Programme on Scientific Assessment and Policy Analysis for Climate Change (WAB). It was written by the Netherlands Environmental Assessment Agency (PBL) and the Energy Research Centre of the Netherlands (ECN), as a deliverable of the WAB project “Balancing the carbon market”. The members of the steering committee for this project are Gerie Jonk and Marcel Berk (Ministry of Environment), Joelle Rekers (Ministry of Economic affairs), Maurits Blanson Henkemans (Ministry of Economic Affairs), Bas Clabbers (Ministry of Agriculture) and Remco van de Molen (Ministry of Finance). Finally we would also like to thank our colleagues at the Netherlands Environmental Assessment Agency, in particular Leo Meyer and Paul Lucas.
Page 4 of 121 WAB 500102 032
This report has been produced by:
Michel den Elzen, Angelica Mendoza Beltran and Jasper van Vliet Netherlands Environmental Assessment Agency (PBL)
Tjaša Bole and Stefan Bakker
Energy research Centre of the Netherlands (ECN) with contributions from:
J.A.H.W. Peters, M. Roelfsema and D.P. van Vuuren Netherlands Environmental Assessment Agency (PBL) M.A.R. Saïdi
Energy research Centre of the Netherlands (ECN)
Name and address of corresponding author:
Michel den Elzen
Netherlands Environmental Assessment Agency Global Sustainability and Climate
P.O. Box 303 3720 AH Bilthoven The Netherlands
E-mail: michel.denelzen@pbl.nl
Disclaimer
Statements of views, facts and opinions as described in this report are the responsibility of the author(s).
Copyright © 2009, Netherlands Environmental Assessment Agency
All rights reserved. No part of this publication may be reproduced, stored in a retrieval system or transmitted in any form or by any means, electronic, mechanical, photocopying, recording or otherwise without the prior written permission of the copyright holder.
Contents
Executive Summary 9
Samenvatting 19
List of acronyms 29
1 Introduction 31
2 Background of the scenarios 35
2.1 Annex I pledges 35
2.2 Potential non-Annex I emission reductions through NAMAs 39
3 The definition of the scenarios 43
3.1 Overview of reduction targets 44
3.2 Low ambition scenario 46
3.3 Higher ambition scenario 48
3.4 Comparable effort scenario 50
4 The modelling tool and data used 53
4.1 Analytical framework 53
4.2 Baseline 56
4.3 Historical and future emissions of greenhouse gases 56
5 Scenario analysis of the Annex I reduction pledges 61
5.1 Emission implications excluding REDD/LULUCF CO2 emissions 61
5.2 Costs implications (excluding REDD financing) 64
6 Scenario analysis of non-Annex I mitigation action 69
6.1 Emission implications 69
6.2 Abatement costs excluding REDD financing 71
7 Analysis of the reduction, costs and financial flows associated with financing REDD
measures outside the carbon market 77
7.1 Analysing the reductions of REDD actions 77
7.2 Demand and supply of REDD credits and the costs of financing REDD outside
the carbon market 80
7.3 Total mitigation costs and financial flows 83
8 The impact of the economic crisis 87
8.1 Baseline with crisis 87
8.2 Results for Annex I and non-Annex I countries as a group 87
8.3 Costs implications for the individual Annex I countries 88
9 Discussion of caveats of study 93
10 Conclusions 95
References 97
Appendices
A Avoided deforestation emission: implementation for the scenarios calculations 101
B The main characteristics of the baseline 103
C Historical emissions data 105
D Updating the emissions dataset of the FAIR model 107
E Implications for abatement costs and reduction potentials due to harmonisation of
the baseline 111
F Emission and costs implications for the Annex I and non-Annex I countries as a
group 115
Page 6 of 121 WAB 500102 032
List of Tables
2.1. Information relating to possible quantified emission limitation and reduction objectives (QELRO) of the low and high pledge of individual Annex I countries for
the year 2020 35
2.2. Comparison of Estimates of Total GHG Emissions and Emission Reductions
Achieved by H.R. 2454 and the Waxman-Markey Discussion Draft 38
3.1. The reductions targets of the six scenarios of individual Annex I countries and
regions below the reference year emissions, as assumed in the model calculations 44
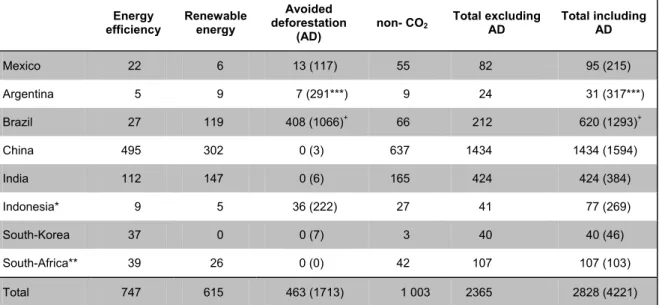
3.2. NAMAs-based reductions (in %) below the baseline emissions in the eight
‘emerging economies’ or major emitting non-Annex I countries, as assumed in the
model calculations. 45
3.3. The reductions assumptions below the baseline emissions for the remaining
non-Annex I countries or regions, not included in analysis of NAMAs. 46
3.4. Potential NAMA-based reductions for low ambition scenarios 1a and 1b (in
MtCO2eq). 47
3.5. Potential NAMA-based reductions for higher ambition scenarios 2a and 2b (in
MtCO2eq). 49
3.6. Overview of the reductions (% below 1990 levels) for the comparable effort
scenarios by den Elzen et al (2009a). 51
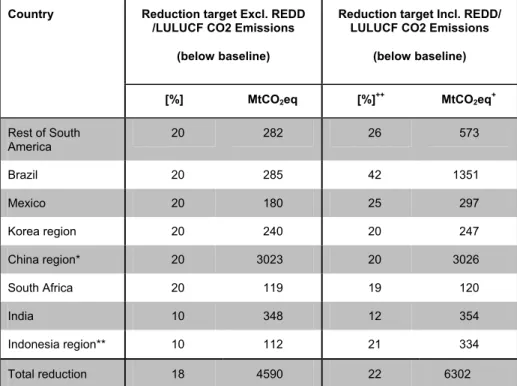
3.7. Assumed reduction levels (in %) below baseline or business as usual scenario
emissions in 2020 for the non-Annex I countries. 51
3.8. Emission requirements in 2020 for selected non-Annex I countries for including and
excluding emissions from deforestation and LULUCF CO2 emissions 52
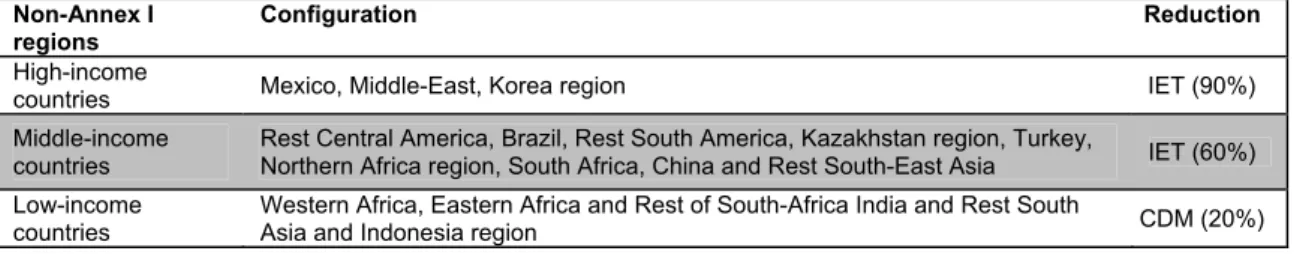
4.1. Assumptions on participation in International emissions trading (IET) and CDM and
the calculated fraction of the global carbon price. 54
5.1. Individual and aggregate reductions (excluding LULUCF CO2 emissions*) in % for
Annex I regions. 62
5.2. Average marginal abatement costs (US$/tonneCO2) for Annex I regions 65
5.3 Costs for Annex I regions in MUS$ and Emissions in MtCO2eq 66
5.4. Domestic Abatement for Annex I regions in % of the total abatement excluding
trade and sinks 67
5.5. Abatement costs as % of GDP for Annex I regions 68
5.6. Per capita emissions for Annex I countries 68
6.1 Individual and aggregate reductions excluding REDD/LULUCF CO2 emissions in %
below baseline levels for non-Annex I regions. 69
6.2 Individual and aggregate reductions excluding REDD/LULUCF CO2 emissions in %
below 1990 and 2005 levels for non-Annex I regions. 70
6.3. Average marginal abatement costs (US$/tonneCO2) for non-Annex I regions 72
6.4. Abatement costs as % of GDP for non-Annex I regions 73
6.5. Costs for non-Annex I Regions in MUS$ and Emissions in MtCO2eq 74
6.6 Domestic abatement for non-Annex I regions in % of the total abatement excluding
trade and sinks 75
6.7. Per capita emissions for non-Annex I countries 75
7.1. Domestic reduction (supply) and Demand (in brackets) for REDD under the various
scenarios.(MtCO2) 78
7.2. Costs for financing of REDD (MUS$) for Parties under scenarios assumptions 81
7.3. Investments (% of GDP) of Parties under scenario assumptions. 82
7.4. Average global marginal prices of reductions on the Carbon Market and for REDD
credits. 82
7.5. Costs, financial flows and benefits associated with Low ambition, Higher ambition
and Comparable effort scenarios 83
7.6 Global next-tonneor market prices of reductions on the Carbon Market and for
REDD credits. 85
8.1 Results for Annex I, non-Annex I and the world in 2020 for scenarios excluding
REDD/LULUCF CO2 emissions. 89
8.3 Detailed Results for Annex I in 2020 for scenarios excluding REDD/LULUCF CO2
emissions. 90
8.4 Abatement costs as % of GDP for Annex I regions. The numbers in parenthesis
indicated the costs for the crisis baseline and outside parenthesis withouth crisis 90
8.5 Abatement costs as % of GDP for non-Annex I regions. 91
D.1. Harmonisation ratios, i.e. defined as 2005 emissions data from historical datasets
(UNFCCC, IEA or EDGAR) divided by simulated 2005 emissions data. 109
E.1. The reductions of mitigation actions calculated for the ‘non-harmonised’ (left) and
‘harmonised’ baseline emissions for four categories (energy efficiency (EE),
renewable energy (RE), non-CO2 GHGs (includes other industrial gases,
agricultural emissions and waste emissions) and avoided deforestation (AD). 111
List of Figures
S.1 The total reductions of the three scenarios, i.e. reduction in Annex I and non-Annex
I (non-REDD abatement measures), REDD activities in non-Annex I (partly financed by Annex I or other non-Annex I regions) and possible forfeit of ‘new’ hot
air (i.e. surplus of AAUs) by 2020. 11
S.2. Mitigation costs and financial flows associated with the various scenarios 14
S.1 De totale reductie van de drie scenario's, namelijk reductie van de Annex I en
niet-Annex I regio’s 22
S.2. Mitigatiekosten en de financiële stromen in de verschillende scenario's. 25
2.1. Emission Reductions under Cap-and-Trade Proposals in the 111th Congress,
2005-2050. 37
2.2. Non-Annex I country contribution to GHG mitigation: three categories of NAMAs 40
4.1. Map of regions used in the FAIR 2.2 model 55
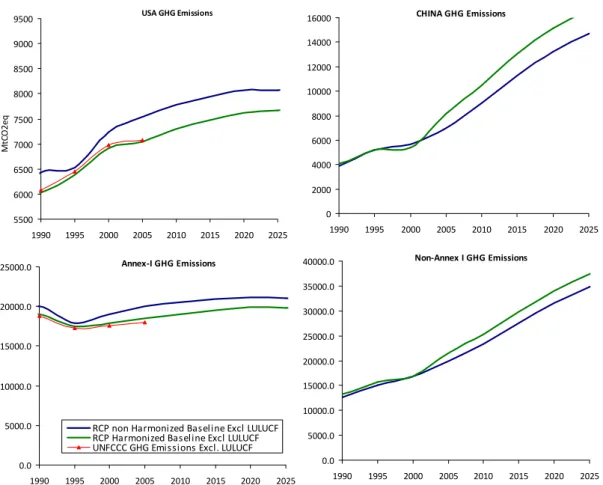
4.2. Harmonized and un-Harmonized baseline GHG emissions (excluding LULUCF
CO2) for United States, China Annex I and Non-Annex I 59
5.1. Emissions reduction in 2020 (excluding LULUCF CO2 emissions) compared to
1990 levels for Annex I countries 63
5.2. Emissions reduction in 2020 (excluding LULUCF CO2 emissions) compared to
2005 levels for Annex I countries 63
5.3. Emissions reduction in 2020 (excluding LULUCF CO2 emissions) compared to the
baseline levels for Annex I countries 64
5.4. Average abatement Costs for Annex I countries. 65
5.5. Abatement costs as % of GDP for Annex I regions 67
5.6. Per capita emissions for Annex I countries 68
6.1. Emissions (excluding REDD/LULUCF CO2) reduction in 2020 compared to 1990
levels for non-Annex I regions/countries 70
6.2. Emissions (excluding REDD/LULUCF CO2) reduction in 2020 compared to 2005
levels for non-Annex I regions/countries 71
6.3. Emissions (excluding REDD/LULUCF CO2) reduction in 2020 compared to
baseline emissions for non-Annex I regions countries 71
6.4. Average abatement costs for non-Annex I regions/countries 72
6.5. Abatement costs as % of GDP for non-Annex I regions/countries 73
6.6. Per capita emissions for non-Annex I countries according to baseline excluding
LULUCF. 75
7.1. Methodology for translating demand for REDD credits into financing requirements. 79
7.2. Domestic reduction, demand and costs for REDD reductions under higher ambition
scenario. 80
7.3. Supply, demand and costs for REDD reductions under low ambition scenario
assumptions. 81
7.4. Mitigation costs and financial flows associated with the various scenarios. 84
D.1. Energy-related industrial CO2 emissions simulated with TIMER model and
emissions trend of historical dataset from 1990 to 2005. The emissions in 2005
should the corresponding ones to the historical data. 107
E.1. The effect of harmonisation on the baseline emissions (1990-2020) and the 2020
reduction target for the USA. 112
E.2. The effect of harmonisation on the baseline emissions (1990-2020) and the 2020
Executive Summary
1. Introduction
This report explores the implications of different possible scenarios on the outcomes of the current climate negotiations. To this end it combines the latest emission reduction proposals, the so-called “pledges”, by Annex I (developed) countries (as tabled by August 2009) with different levels of possible domestic abatement actions by non-Annex I (developing) countries and examines the related mitigation costs and impacts on the carbon-market. The domestic mitigation action carried out by non-Annex I countries could for example be achieved through Nationally Appropriate Mitigation Actions (NAMAs). In addition to the analysis of the current proposals, the report describes a scenario with reductions that would limit global warming to 2 degrees above the pre-industrial level, based on comparable efforts of Annex-I countries. The analysis focuses in particular on:
• the abatement costs (including emissions trading and the Clean Development Mechanisms (CDM)) for developed and developing countries,
• the price of tradable emission units on the global carbon market in 2020, • the buyers and sellers of carbon credits,
• the costs and financing of non-Annex I REDD1 activities by Annex I and other
non-Annex I countries
The above issues are analysed for the three broad post-2012 climate policy scenarios:
1. Low ambition scenario: based on the lower end of the proposed ranges of emission reduction targets for individual Annex I countries and low-ambition mitigation actions in non-Annex I regions, i.e. use of 25% of the reduction potential in energy-efficiency, renewables,
non-CO2 reduction options and avoided deforestation (REDD). Non-Annex I actions may be
(partially) financed by Annex I2.
2. Higher ambition scenario: based on the higher proposed reduction targets for individual Annex I countries and more ambitious mitigation actions in non-Annex I regions, i.e. use of
50% of the reduction potential in energy-efficiency, renewables, non-CO2 reduction options
and REDD.
3. Comparable effort scenario (aimed at meeting the 2-degree climate target): This scenario assumes an ambitious aggregated Annex I reduction target (30% below 1990 levels) and non-Annex I reduction that corresponds to an average of 16% below baseline
emissions, excluding REDD and LULUCF3 CO2 emissions and 19% below baseline
emissions including LULUCF CO2 emissions and REDD. These reductions are needed to
meet long-term greenhouse gas concentrations of 450 ppm CO2 eq, and to limit the global
mean temperature increase to 2oC compared to pre-industrial levels.
For the differentiation of the aggregated reduction of 30% for Annex I countries, this scenario uses the concept of comparability of efforts, which is based on the notion of equal treatment of countries in similar circumstances. In this scenario, the reductions for the individual Annex I countries are based on the calculated, averaged reduction targets from
six different approaches for defining comparable mitigation efforts for Annex I countries4.
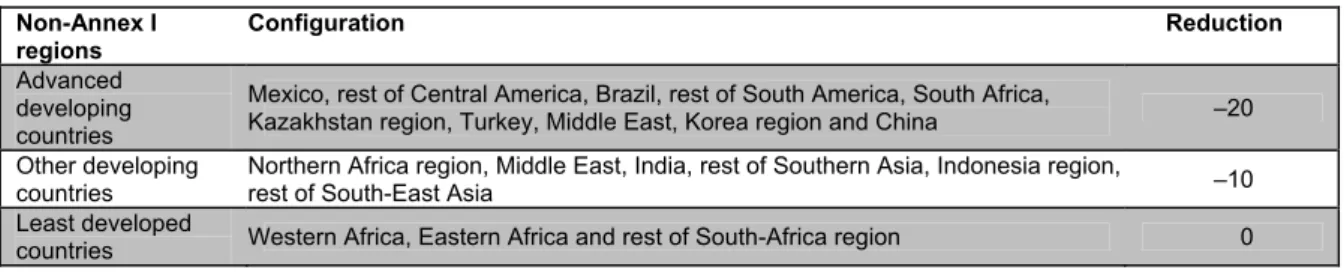
For the allocation of the overall non-Annex I reduction, we assumed that the more advanced
countries5 in the group will reduce their emissions by 20% below baseline and those at a
1 Reducing Emissions from Deforestation and Forest Degradation in Developing Countries
2 Note that the question of the source of finance for actions in non-Annex I (apart for REDD financing) is
not dealt with in this report. Thus the costs can (in part) be covered by external financial support.
3 Land Use, Land-use Change and Forestry CO
2 emissions
4 Such as equal reduction below a baseline, equal MAC and equal mitigation costs, as described in the
Comparable Effort Study of den Elzen et al. (2009a).The reductions by different Annex I countries must meet an aggregate reduction of 30% below 1990 levels by 2020.
5 Advanced developing countries: Mexico, rest of Central America, Brazil, rest of South America, South
Africa, Kazakhstan region, Turkey, Middle East, Korea region and China; Other developing countries: Northern Africa region, Middle East, India, rest of Southern Asia, Indonesia region and rest of South-East Asia; least developing countries: Western Africa, Eastern Africa and rest of South-Africa region
Page 10 of 121 WAB 500102 032
lower level of development by 10%, while the least developed countries would be exempt from any emission reduction efforts all together.
In exploring the implications for emissions reductions and abatement costs for each scenario we
considered two variants, one including and one excluding REDD actions and LULUCF CO2
emissions. In the scenarios excluding REDD and LULUCF CO2 the REDD actions are not
included in the reductions presented, and in the scenarios including REDD and LULUCF CO2
the REDD actions are additional reductions (for the mitigation actions by non-Annex I countries, and for the reduction proposals for the USA and Australia). Therefore, the costs for REDD action are calculated separately, and do not influence the abatement costs, the carbon price and financial flows of the carbon market. Furthermore, for the scenarios including REDD and
LULUCF CO2 emissions, we assumed that non-Annex I regions will finance 20% of the REDD
reductions domestically and the remaining 80% is financed by Annex I regions or other non-Annex I regions.
2. Methodology
The calculations in this paper are mostly based on the FAIR model, used in conjunction with the IMAGE land use model and TIMER energy model, as developed at the Netherlands Environmental Assessment Agency (PBL). The costs calculations are based on Marginal Abatement Costs (MAC) curves for the different emissions sources. For the default calculations the baseline emissions are based on the TIMER and IMAGE model implementation of a baseline without an economic crisis. As an additional uncertainty analyses on the impact of the crisis, we have also developed a baseline including the impact of the economic crisis. The MAC
curves of the energy- and industry-related CO2 emissions from the TIMER energy model are
calculated by imposing a carbon tax and recording the induced reduction of CO2 emissions. The
cost estimates for non-CO2 gases are based on marginal abatement costs of the EMF6-21.
These curves have been made consistent with the baselines used here and made time-dependent to account for technology change and removal of implementation barriers over time. One of the inputs of the model analysis are the potential emission reductions by non-Annex I countries. Those were calculated with the help of the Energy research Centre of the Netherlands (ECN) MAC curve and based on the assumptions on potential mitigation action in developing countries (NAMAs). For the low and higher ambition scenario, we assumed that NAMAs would mobilize 25% and 50% of the mitigation potential in energy efficiency,
renewables, non-CO2 greenhouse gases and avoided deforestation, respectively, and we
calculated the level of emission reduction (below baseline) to which such mitigation action would lead. The results of these calculations (presented in the “findings” section) were then used as input for the model-based scenario analysis. For the comparable effort scenario, we assumed an average reduction of 16% below baseline emissions for non-Annex I as a group, which is consistent with a 2 degree target.
The main findings of this study are the following: 3. Environmental effectiveness of the scenarios
As of August 2009, the low and high pledges for GHG reductions of Annex I countries
(including the US) respectively imply for 2020 a reduction of 10-15%7 below 1990 levels
when excluding REDD and LULUCF CO2, which is far less than the 25-40% reduction
required to meet the 2 degree climate target. If the surplus AAUs of Russia and Ukraine (due to pledges above baseline levels) are forfeited, or not used, the Annex I reduction increases to 14-19% below 1990 levels.
Russia and Ukraine will have a surplus of AAUs8 (“new hot air “) by 2020 because their lowand high pledges are above baseline emissions. The annual “new” hot air would amount to
1.1 and 1.0 GtCO2eq for the low and high pledge, respectively. If this hot air is forfeited by
Russia and Ukraine, which means it will not be used and traded with other Annex I
6 EMF: Energy Modelling Forum
7 The new pledge from Japan (September 2009) of 25% reduction below 1990 levels in 2020 has not been
taken into account – it would mean a reduction of 11-16 % below 1990 levels by 2020 instead of 10-15%.
countries to offset their reductions, the pledges for GHG reductions of the Annex I countries (including the USA) as a group could improve by as much as 14-19% below 1990 levels.
The low and high pledges for GHG reductions of Annex I countries including REDD andLULUCF CO2 imply for 2020 a reduction of 8-18% below 1990 levels, which is also less
than the 25-40% reduction needed to meet the 2 degree target.
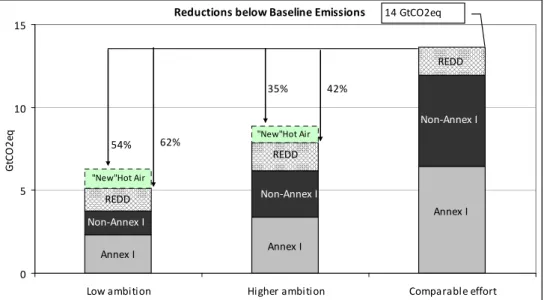
The absolute reductions including LULUCF CO2 and REDD but excluding new hot air of thelow and higher ambition scenario are about 40% and 60% below the reductions of the comparable effort scenario (Figure S.1). If hot air is excluded these differences are reduced.
In all scenarios all Annex I countries show a considerable downward trend in per-capitaemissions between 1990-2020, especially for the comparable effort scenario.
The high pledges of the EU, USA and Japan9 are less distant from the comparable effort
reductions to meet a 30% aggregated Annex I reduction target, than the pledges of Canada, Russia and Ukraine, which are far below the comparable effort reductions. Comparing the reduction targets under the low and higher ambition scenario with the reductions
of the comparable effort scenario10 shows the following:
The high pledges of the EU, USA and Japan are about 5-15 % points lower than thereduction targets assumed in the comparable effort scenario (necessary to achieve the 450 ppm stabilisation target). For example, the high pledge of the EU is 30% below 1990 levels, whereas the comparable effort reduction is 35%.
The pledges of Canada, Russia and Ukraine are far below the comparable effort reductions:for Canada 25% and for Russia and Ukraine 35%. The pledges of Russia and Ukraine are so low they will create new hot air (or surplus of AAUs) by 2020.
It should be noted that the comparable effort reductions depend greatly on the aggregated Annex I reduction target (here 30% below 1990 levels), the starting point of the emissions in 2010, the comparable efforts approaches considered and model and parameter assumptions.
Reductions below Baseline Emissions
0 5 10 15
Low ambition Higher ambition Comparable effort
Gt C O 2 eq Annex I Annex I Annex I Non‐Annex I Non‐Annex I Non‐Annex I REDD REDD REDD "New"Hot Air 54% 62% 35% 42% "New"Hot Air 14 GtCO2eq
Figure S.1 The total reductions of the three scenarios, i.e. reduction in Annex I and non-Annex I (non-REDD abatement measures), (non-REDD activities in non-Annex I (partly financed by Annex I or other non-Annex I regions) and possible forfeit of ‘new’ hot air (i.e. surplus of AAUs) by 2020. Conservatively estimated, NAMA-based mitigation actions (excluding REDD/LULUCF
CO2) could reduce the emissions of eight emerging economies11 to 5-11% below baseline
9 This is based on pledge by previous government, i.e. not taking into account the proposed target
announced in September 2009.
10 “Comparable effort” reductions are based on the average outcome of six approaches for comparability of
the mitigation efforts by Annex I countries, in accordance with the previous PBL study.
Page 12 of 121 WAB 500102 032
levels by 2020, and 4-8% for the non-Annex I countries as a group. This is less than the 15-30% reduction below baseline emissions by 2020 that may be needed to realise a global emissions pathway consistent with limiting warming to about 2 °C (i.e. together with 25-40% Annex I reduction below 1990 levels).
We have analysed the reduction potential of possible NAMAs, including effective measures that would realise 25% (low ambition scenario) and 50% (higher ambition scenario) of the potential
of energy-efficiency, renewables, non-CO2 reduction options and avoided deforestation for the
eight emerging economies, and made assumptions for the reductions of the other non-Annex I countries.
At the time of writing (mid-2009), there was much uncertainty about how NAMAs fornon-Annex I countries would evolve. However it is likely that they could mobilise an important part of the mitigation potentials, in particularly in the sectors of renewable energy, energy
efficiency, non-CO2 emissions and REDD.
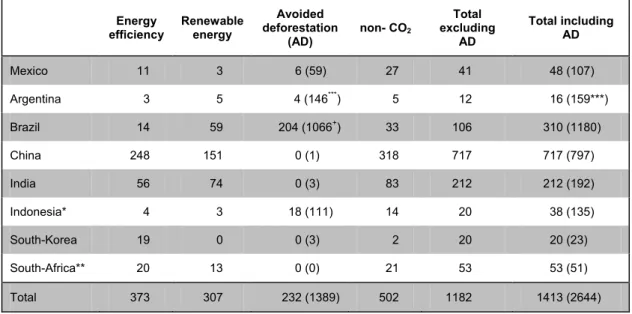
The eight emerging economies show possible emission reductions (excluding REDDmeasures and LULUCF CO2) of 1.2 to 2.4 GtCO2eq by 2020, which amounts to 5-11%
below baseline for the low and higher ambition scenarios. If REDD/LULUCF CO2 measures
are included, the reductions range from 7 to 12% for the low and higher ambition scenarios
(i.e. from 2.6 to 4.2 GtCO2eq).
Based on the above reductions for the eight emerging economies and assumed reductionsfor other non-Annex I countries12, the low and higher ambition scenarios achieve reductions
which bring the emissions of non-Annex I countries as a group to a level of 4-8% below
baseline, when excluding REDD/ LULUCF CO2 mitigation measures and 7-12% if they are
included.
4. Costs implications of the scenarios (excluding the costs of REDD)
The abatement costs for the Annex I countries as a group are about 0.01-0.04% of GDP in 2020 for the low and higher ambition scenarios, and 0.24% for the comparable effort scenario, if use of emissions trading and CDM are allowed. If all Annex I pledges and comparable efforts must be implemented domestically (no emissions trading), the total abatement costs increase by a factor of 4-13. There are large differences in total costs between countries.
The annual abatement costs for the Annex I countries as a group are about 0.01-0.04% ofGDP in 2020 (or about 6-21 billion US$2005) for the low and higher ambition scenarios. This
is under the assumption of full emissions trading between Annex I regions, limited trade with advanced developing countries, and use of CDM credits from the other developing countries. For the comparable effort scenario, the annual costs by 2020 increase to 0.24%
of GDP (about 120 billion US$2005).
If no emissions trading is allowed and all Annex I pledges have to be met domestically, totalcosts increase 13 times (to 0.15-0.38% of GDP for the low and higher ambition scenario, respectively), and more than three times (to 0.88%) for the comparable effort scenario).
There are large differences in total costs between countries. With emission trading, the totalannual abatement costs for reaching the targets remain well below 0.5% of GDP for the low and higher ambition scenario and below 1% of GDP for the comparable effort scenario for all of the countries/regions analysed in this report.
Russia, Ukraine and Belarus benefit from the revenues of selling part of the banked hot airfrom the first commitment period, and the selling of new hot air as their proposed reduction targets by 2020 are above their baseline emissions. Here we assumed that Russia, Ukraine and Belarus adopt an optimal banking strategy in order to optimise their financial revenues in the first commitment period and in the period 2013-2023. This implies full banking of hot air from the Kyoto period, and releasing only part of the banked hot air from the second commitment period (2013-2017) and third commitment period (2018-2023).
Australia appears to have the highest mitigation costs compared to GDP to meet its pledge.This is due to a combination of the level of the pledge and the sectoral emission composition (large share of heavy industry in international trade in the region, which leads to high domestic costs for emissions reductions).
The abatement costs compared to GDP found for the USA and Japan (based on the July 2009 pledge and not the more recent pledge of September 2009) are lower than for the EU for all scenarios.The abatement costs expressed as a percentage of GDP of mitigation action in non-Annex I regions are lower than the costs of the non-Annex I countries. With the current pledges of Annex I regions the non-Annex I countries may even have net gains after emissions trading. In this study, we do not make assumptions on who should bear the cost of mitigation action in non-Annex I countries (except for REDD). Non-Annex I actions could also be partly financed by Annex I, in which case there would be no costs for non-Annex I, and only net gains from the carbon market.
The low and higher ambition scenarios show small gains for the non-Annex I countries as agroup (about -0.3 to -0.6 billion US$2005), and for the comparable effort scenario the costs
are low: 0.18% of GDP (about 43 billion US$2005).
There are large differences in abatement costs between the advanced developing countriesand least developed countries. The advanced developing countries may have costs as high as 0.3-0.5% of their GDP for the comparable effort scenario, but rather low costs for the low and higher ambition scenario. The least developing countries have net gains from CDM for all three scenarios.
The demand for CDM and carbon credits from the Annex I countries to complement part oftheir reductions implies financial flows to the non-Annex I countries that amount to 2.5-11
billion US$2005 per year in 2020 for the low and higher ambition scenarios, and to 42 billion
US$2005 for the comparable effort scenario.
Nearly all non-Annex I countries (Mexico, the rest of South America, Brazil, China, India,Indonesia, Korea and South Africa) increase their emissions per capita in all the scenarios, excluding LULUCF and REDD emissions, from 1990 until 2020. The only exceptions are Brazil for the higher ambition scenario and South Africa for the higher ambition and comparable effort scenarios.
5. Supply and demand on the carbon market and its role in defining costs for developed and developing countries (excluding costs of REDD)
The estimated carbon price in 2020 is 4 and 15 US$/tCO2eq for the low and higher ambition scenarios, respectively, and 58 US$/tCO2eq for the comparable effort scenario, which can be considered as rather low. Due to hot air, the main sellers on the carbon market would be Russia and the Ukraine; the main buyers would be the EU and USA.
The carbon price found for the three scenarios explored is rather low (e.g. compared to current price levels in the EU ETS). This is the cumulative effect of the following causes:
o The conservative ECN MAC curve leads to relatively low NAMA-based emission reductions of 4-8% for the non-Annex I countries, so the developing countries still have a potentially abundant source of relatively low cost abatement options, which can be used for offsetting reductions in Annex I countries, which lowers the carbon price. There are also some non-Annex I regions like the Middle East for which low or no domestic mitigation action is assumed, which means they can offer all of their mitigation potential to the carbon market.
o Allowing banking of hot air from the Kyoto period (from Russia and Ukraine) results
in the release of 1.1-1.3 GtCO2 hot air to the market by 2020, which also lowers the
price.
o “New” hot air induced by low post-2012 targets by 2020 for Russia and Ukraine for the low and higher ambition scenario further increases the supply of carbon credits, and lowers the price.
Most Annex I countries (except Russia, Ukraine and Belarus) will act as buyers on theinternational carbon market. The EU and the USA are the dominant buyers on the market, with a total demand share of about 80-90% of total trade. The Annex I countries except USA and EU still realise at least 50% of the total reduction domestically, and this fraction increases for the high and comparable effort scenario due to higher carbon prices.
Russia, Ukraine and Belarus are benefiting from the trading revenues from selling part ofPage 14 of 121 WAB 500102 032
has a share of 40-50% of the total supply of carbon credits. Even for the comparable effort scenario in which Russia has a reduction target below the baseline emissions, the share amounts 40%. Ukraine has a share of about 20% of carbon market sales.
The non-Annex I countries as a group act as sellers with a share of the total supply of 30%for the low and higher ambition scenario and 40% for the comparable effort scenario. China acts as the dominant seller of non-Annex I credits, with shares of 6-12%.
In the low ambition scenario, most non-Annex I regions are acting as sellers on the carbonmarket. For the high and comparable effort scenario, some regions (i.e. Mexico, Brazil and South Africa for the higher ambition scenario) are amongst the buyers of credits.
Trade in carbon credits from hot air between Russia and Ukraine, and other Annex Icountries, leads to lower trade of carbon credits from non-Annex I to Annex I countries. Consequently, Annex I countries as a group (including Russia and Ukraine) only need to acquire an amount of emission credits through offsetting mechanisms equal to 3% of their 1990 emissions. Non-Annex I countries reduce their emissions by around 18% compared to baseline emission levels (after trade and CDM).
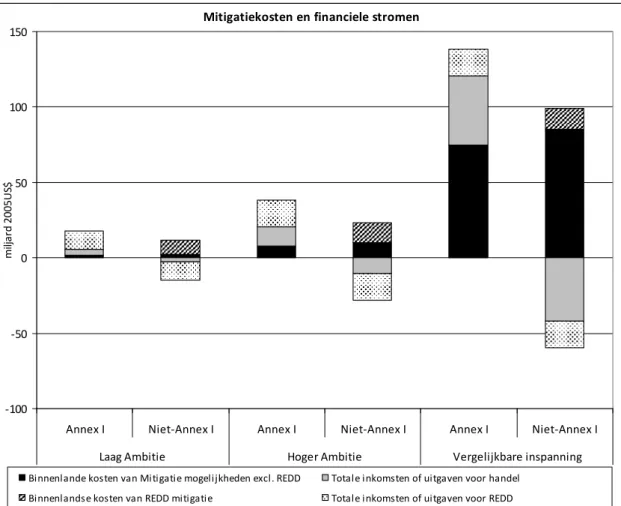
Mitigation costs and financial flows ‐100 ‐50 0 50 100 150
Annex I Non Annex I Annex I Non Annex I Annex I Non Annex I
Low Ambition Higher Ambition Comparable Effort
bi lli o ns 200 5U S$ Domestic Costs of Mitigation options Excl. REDD Total revenue or expenditure for carbon trade Domestic Costs for REDD Mitigation Total revenue or expenditure for REDD
Figure S.2. Mitigation costs and financial flows associated with the various scenarios, Note: domestic costs excluding REDD consists of the domestic costs to meet the own reduction target and the domestic costs for additional reductions to offset reductions in Annex I.
Large financial flows from Annex I to non-Annex I will go through the carbon market. For theAnnex I region the total expenditure for carbon credits exceeds the costs for domestic mitigation measures in the low and higher ambition scenario (see Figure S.2). For the comparable effort scenario the carbon credits expenditure is lower than the domestic costs, representing about 40% of the total costs for Annex I (see Figure S.2).
For the non-Annex I regions the total revenues of carbon trade exceed the costs of domestic mitigation measures, resulting in gains in the low and higher ambition scenario, whereas in the comparable effort scenario the total revenues cover about half of the domestic costs.6. The mitigation costs of financing REDD measures outside the carbon market
Given the assumption that Annex I countries would finance 80% of REDD activities in non-Annex I countries at the REDD market price13, the costs would be around 18 billion US$ for Annex I countries, while non-Annex I countries would earn around 4 billion US$ by 2020 despite of its 20% own contribution. This would lead to halving the emissions from deforestation.
The calculations assume that REDD action is additional and financial flows are independent of the financial flows in the carbon market.
Given the already low carbon prices for the low and higher ambition scenario, REDD is onlya relatively low cost option in the comparable effort scenario.
More specifically, the average abatement costs14 of REDD for the low and higher ambitionscenario (about 7-8 US$/tonne) are above the average abatement costs of the (used) non-REDD mitigation options (about 1-3 US$/tonne). The average abatement costs for non-REDD (about 8 US$/tonne) are lower than the average abatement costs of the non-REDD mitigation options for the comparable effort scenario (about 16 US$/tonne).
We have two options for the financing of REDD: (1) against the REDD market price, and (2) against the marginal abatement costs.
When REDD projects are directly financed against the REDD market price the averageabatement costs (total domestic costs plus gains from trading) for non-Annex I regions are
negative (-2.5 to 4 billion US$2005 for the three scenarios). For Annex I regions the costs are
about 12 to 18 billion US$2005.
When REDD projects are directly financed against the marginal abatement costs, there aredomestic costs from REDD to meet their own 20% target for non-Annex I regions of about
0.5 to 1 billion US$2005, and costs for Annex I are about 9 billion and 13 billion US$2005.
There is still a significant quantity of REDD action (as part of the 80% external financing)that is currently not supported under the reduction proposals from the Annex I countries
(0.5-1.1 GtCO2).
7. Mitigation costs and financial flows related to REDD and carbon trade and its role in defining costs for Developed and Developing Countries
Under all scenarios, large financial flows exist from Annex I to non-Annex I through the carbon market and REDD financing, representing 40-80% of the total mitigation costs for Annex I
In addition to expenditure for carbon credits, another important cost category for Annex Icountries is financing of REDD (together with the domestic costs they account for the total mitigation costs). The expenditure of carbon credits through carbon trade and REDD financing form 80% of the total mitigation cost of Annex I in the low and higher ambition scenario, and 40% in comparable effort scenario (see Figure S.2). The higher shares in the low and higher ambition scenario can be explained by the relatively low reductions of the non-Annex I regions of 4-8% below the baseline emissions, and the availability of low costs mitigation options in these regions.
The costs of mitigation and REDD for the Annex I region range from 18 billion to 138 billionUS$. For the non-Annex I region, the total costs are negative for the low and higher
13 I.e.: the marginal costs of last abated tonne of carbon from REDD
14 Average costs are defined as the total abatement costs (i.e.: domestic costs of REDD activities in
non-Annex I countries to meet their 20% target, and costs of buying REDD credits or financing 80% of the REDD activities in non-Annex I countries by Annex I countries or other non-Annex I countries) divided by the total abatement of REDD.
Page 16 of 121 WAB 500102 032
ambition scenarios (−3 to −5 billion US$2005), while for the comparable effort scenario the
net costs are about 40 billion US$2005.
There are large financial flows from Annex I to non-Annex I through the expenditure forcarbon credits and REDD financing by Annex I of 15 to 60 billion US$2005 for the three
scenarios, which exceed the domestic costs in non-Annex I of additional reductions to offset
reductions in Annex I countries and REDD reductions of about 10 to 30 billion US$2005. The
resulting net gains are in the order of 5 to 30 billion US$2005.
Comparing the financial flows of REDD against those on the carbon market, we conclude the following:
The net gains of REDD for non-Annex I countries are much higher than the net gains ofcarbon trading15 for the low ambition scenario, but in the higher ambition and comparable
effort scenario the net gains of REDD are much lower (about 80%) than the net gains of carbon trading.
8. The impacts of the economic crisis
The economic crisis decreases the carbon prices for all scenarios. The Annex I countries have much lower costs during the crisis due not only to the lower price, but also to the lower reduction effort that is required (lower baseline, but same target). The domestic abatement cost in non-Annex I countries is somewhat lower but so are the revenues from carbon trading.
The economic crisis may results in a decrease in GHG baseline emissions (without climatepolicy) of about 10% by 2010 and 8% by 2020 compared to the baseline emissions without the crisis. This is based on our assumption that the crisis will result in a reduction in GDP growth in 2009 and 2010 and a convergence to the original growth path after this period. However, if increased growth after the crisis is assumed, the impact in the long term will obviously be much smaller, and the emission differences may become zero after 2020.
The surplus of AAUs or hot air in the first commitment period increases by an additional20%, to 3 GtCO2eq, which represents about 8% of the 1990 emissions of the Annex I
countries. The new hot air by 2020 is higher under the crisis scenario, up to 1.4 and 1.1
GtCO2eq/year for the low and higher ambition scenario. The comparable effort scenario
does not lead to hot air for Ukraine and Russia, because their comparable effort reduction targets are below their baseline emissions.
The carbon price decreases compared to the price under the default (no-crisis) baselineemissions by 1-2 US$/tonne CO2 (12-16%) for the low and higher ambition scenarios and
16 US$/tonne CO2 (30%) for the comparable effort scenario.
The abatement costs for the Annex I countries as a group decrease by about 30-35% forthe low and higher ambition scenario and 65% for the comparable effort scenario.
Compared to a no-crisis scenario, the carbon trade from the non-Annex I countries to theAnnex I countries (from offsetting) decreases by 20-25% for the low and higher ambition scenarios and about 95% for the comparable effort scenario. In combination with the lower prices, this leads to a decrease in the financial flows of around 35-40% for the low and higher ambition scenarios and about 95% for the comparable effort scenario. For the non-Annex I countries, the decrease in trade and financial flows ultimately decreases their gains. However these gains still appear to compensate the domestic costs.
The global abatement cost is reduced by about 25-30% for the low and higher ambitionscenarios and 45% for the comparable effort scenario.
9. Caveats of this study
The results (i.e. emission reductions and costs indicators) are dependent on the models andthe parameter assumptions. For instance the assumptions about baselines, banking, hot air and marginal abatement costs curves (as analysed for Annex I and non-Annex I countries as a group in den Elzen et al., 2009b), and what post-Kyoto land-use accounting rules are
15 Calculated as the total revenues of selling carbon credits minus the total domestic costs of the additional
assumed (in the present study, the same rules as under Kyoto were applied). In addition, the reduction potential contained in the ECN MAC can be considered conservative, which means that the reductions in the NAMA strategies, and the corresponding calculated reductions below baseline for the non-Annex I region may also be considered as being conservative estimates.
Samenvatting
1. Introductie
Dit rapport analyseert de emissies en de gevolgen voor de kosten van de laatste voorstellen (‘pledges’) met betrekking tot emissiereducties zoals deze zijn ingediend (tot augustus 2009) door Annex I landen of geïndustrialiseerde landen in combinatie met mogelijke mitigatiemaatregelen voor de niet-Annex I landen of ontwikkelingslanden. De niet-Annex I landen kunnen een deel van het potentieel in energie-efficiëntie, hernieuwbare energie,
niet-CO2-reductie opties en vermeden ontbossing realiseren. Dit kan bijvoorbeeld worden bereikt
door middel van ‘National Appropriate Mitigation Actions’ (NAMAs). Het rapport beschrijft ook de analyse waarbij de reductiedoelen worden beschreven die nodig zijn om de mondiale opwarming te beperken tot 2°C ten opzichte van het pre-industriële niveau gebaseerd op de vergelijkbare reductie-inspanningen van Annex I landen
De analyse richt zich voornamelijk op
• De kosten van emissiereducties (inclusief de kosten van reductieverplichtingen in het buitenland middels emissiehandel en het ‘Clean Development’ Mechanismen (CDM)) voor de Annex I en niet-Annex I landen
• De prijs in 2020 van verhandelbare emissierechten op de mondiale koolstofmarkt • De kopers en verkopers van emissierechten
• De kosten en financiering van niet-Annex I REDD16 activiteiten door Annex I landen en
andere niet-Annex I landen (die geen REDD activiteiten ondernemen)
De bovenstaande onderwerpen worden geanalyseerd in de volgende drie post-2012 beleidsscenario's:
1. Laag ambitie scenario: gebaseerd op de ondergrenzen van de voorgestelde reductie-doelstellingen door de afzonderlijke Annex I landen en lage ambitie mitigatie-acties in niet-Annex I regio’s d.w.z. het realiseren van 25% van het reductiepotentieel in energie-efficiëntie,
hernieuwbare energie, niet-CO2-reductie opties en vermeden ontbossing. Niet-Annex I acties
worden deels gefinancierd door Annex I landen.17
2. Hoger ambitie scenario: gebaseerd op de bovengrenzen van de voorgestelde reductiedoelstellingen door de afzonderlijke Annex I landen en ambitieuzere reductie-maatregelen in niet-Annex I regio's, d.w.z. het realiseren van 50% van het reductiepotentieel. 3. Vergelijkbare inspanning scenario (gebaseerd op het halen van de temperatuurs-doelstelling van 2 graden): dit scenario gaat uit van een ambitieuze totale Annex I temperatuurs-doelstelling (30% onder het niveau van 1990) en een niet-Annex I reductiedoelstelling die overeenkomt met
een gemiddelde reductie van 16% onder de baseline emissies exclusief landgebruik, LULUCF18
CO2 en REDD en 19% onder de baseline emissies met inbegrip van landgebruik, LULUCF CO2
en REDD. Deze reducties zijn noodzakelijk om te voldoen aan de doelstelling om lange termijn
concentraties van broeikasgassen tot 450 ppm CO2eq te beperken welke gerelateerd is aan de
doelstelling om de wereldwijde gemiddelde temperatuurstijging tot 2°C te beperken ten opzichte van pre-industriële niveaus.
Voor de verdeling van de gezamenlijke reducties voor Annex I en niet-Annex I landen gebruikt dit scenario het concept van de vergelijkbaarheid van inspanningen (‘comparable efforts’) wat is gebaseerd op het idee van gelijke inspanning van landen die in soortgelijke omstandigheden verkeren. In dit scenario worden de reducties voor de afzonderlijke Annex I landen bepaald op basis van de berekende gemiddeld reductiedoelstellingen van zes benaderingen die momenteel gebruikt worden om de vergelijkbaarheid te beoordelen van
16 Het voorkomen van emissies veroorzaakt door ontbossing, in de klimaatwereld vaak aangeduid met de
Engelse term REDD, i.e. Reducing Emissions from Deforestation and Forest Degradation.
17Merk op dat de kwestie van de bron van financiering voor acties in niet-Annex I (behalve voor de
financiering van REDD) niet wordt geanalyseerd in dit rapport. Dus de kosten kunnen (gedeeltelijk) worden gedekt door externe financiële steun.
Page 20 of 121 WAB 500102 032
Annex I reductie-inspanningen19. De reducties van de verschillende Annex I regio’s moet
voldoen aan een totale vermindering van broeikasgassen van 30% onder het niveau van 1990 in het jaar 2020. Voor de verdeling van de totale niet-Annex I reducties wordt aangenomen dat
de meer ontwikkelde landen20 in deze groep hun uitstoot verminderen met 20% onder de
baseline en de landen met een lager ontwikkelingsniveau21 met 10% terwijl de minst
ontwikkelde landen22 worden vrijgesteld van alle reductie-inspanningen.
Voor elk scenario hebben wij twee varianten in ogenschouw genomen die elk een ander effect laten zien op de emissiereducties en reductiekosten: inclusief en exclusief REDD en
LULUCF-CO2 emissies. Bovendien veronderstellen we voor de scenario's inclusief REDD en
LULUCF-CO2 dat niet-Annex I landen 20% van de NAMA maatregelen m.b.t. REDD financieren en dat
het overige deel van 80% wordt gefinancierd door Annex I regio’s of andere niet-Annex I regio’s tegen marginale kosten of tegen de REDD marktprijs. Samen vormen deze varianten negen scenario's voor de modelanalyse.
Om het resultaat van emissiereducties en reductiekosten voor elk scenario te bepalen hebben we twee varianten geanalyseerd. De eerste exclusief en de tweede inclusief REDD activiteiten
en LULUCF CO2 emissies. In de scenario's exclusief LULUCF CO2 en REDD activiteiten zijn de
REDD reducties niet opgenomen in de gerapporteerde reducties en in de scenario’s inclusief
LULUCF CO2 en REDD activiteiten worden additionele reducties gedaan (voor de
reductie-activiteiten van niet-Annex I landen en voor de reducties van toezeggingen van de VS en Australië). Daarom zijn de kosten voor REDD activiteiten afzonderlijk berekend en hebben geen invloed op de reductiekosten, de koolstofprijs en de financiële stromen van de koolstofmarkt.
Verder hebben we in scenario's inclusief REDD en LULUCF CO2-uitstoot de aanname gemaakt
dat niet-Annex I regio's 20% van de REDD reducties zelf financieren en dat de resterende 80% wordt gefinancierd door Annex I of andere niet-Annex I regio's.
2. Methodologie
De berekeningen in dit rapport zijn grotendeels gebaseerd op het FAIR model dat wordt gebruikt in samenwerking met het IMAGE landgebruikmodel en het TIMER energiemodel, zoals ontwikkelt door het Planbureau voor de Leefomgeving (PBL). De kostenberekeningen zijn gebaseerd op Marginale reductie kostencurven (MACs) voor verschillende emissiebronnen van broeikasgassen. De basisberekeningen voor de baseline emissies gaan niet uit van een economische crisis. Als een toegevoegde onzekerheidsanalyse naar de impact van de economische crisis hebben we ook een baseline emissie scenario ontwikkeld waarbij wel met de economische crisis rekening wordt. De MAC curven van de energie- en industrie gerelateerde emissies van het TIMER energiemodel worden berekend door een
koolstofbelasting aan het model op te leggen en te bepalen welke CO2 reducties hieruit volgen.
De kostenschattingen voor niet-CO2 gassen zijn gebaseerd op marginale reductiekosten uit de
EMF-21 studie voor 2010. Deze curven zijn consistent gemaakt met de baseline die in deze analyse wordt gebruikt en is tijdsafhankelijk gemaakt door rekening te houden met technologische ontwikkelingen en het verwijderen van implementatiebarrières in de tijd.
Een van de inputs van de modelanalyse zijn de potentiële emissiereducties door niet-Annex I landen. Deze zijn bepaald met behulp van de Energieonderzoekcentrum Nederland (ECN) MAC curven welke zijn gebaseerd op mogelijke mitigatie acties op basis van de NAMAs van deze niet-Annex I landen. In het lage en hogere ambitie scenario veronderstellen we voor de NAMAs een 25% en 50% reductie van het totale potentieel aan energie-efficiëntie, hernieuwbare
energie, niet-CO2-reductie opties en vermeden ontbossing. We hebben de reductieniveaus
bepaald ten opzichte van de baseline waar deze NAMA activiteiten toe kunnen leiden. De resultaten van deze activiteiten (welke in latere secties worden besproken) worden als input gebruikt voor de scenarioanalyse. In het vergelijkbare inspanningsscenario hebben we
19 Zoals gelijke reductie beneden de baseline, gelijke MACs en gelijke mitigatiekosten, zoals beschreven in
de ‘Comparable effort study’ van Den Elzen et al. (2009a)
20 Mexico, rest van Centraal Amerika, Brazilië, rest van Zuid Amerika, Zuid Afrika, Kazakstan regio,
Turkije, Midden-Oosten, Korea regio en China
21 Noordelijk Afrika, India, rest Zuidelijk Azië, Indonesië regio en rest van Zuidoost Azië 22 West Afrika, Oost Afrika en rest van Zuidelijk Afrika
verondersteld dat de niet-Annex I landen als groep16% ten opzichte van baseline reduceren, wat consistent is met de 2°C doelstelling.
De belangrijkste bevindingen van deze studie zijn de volgende: 3. Milieueffectiviteit van de scenario's
De lage en hoge toezeggingen gepubliceerd tot augustus 2009 impliceren reducties van broeikasgasemissies van 10-15%23 onder het niveau van 1990 in 2020 van Annex I landen (waaronder de VS), exclusief LULUCF CO2. Dit is veel minder dan de 25-40% reductie die noodzakelijk is om te voldoen aan de 2 graden klimaat doelstelling. Als de overtollige emissierechten (de zogenaamde ‘hot air’) van Rusland en Oekraïne (doordat toezeggingen boven de baseline niveaus zijn) niet worden gebruikt of verhandeld, stijgen de reducties van de Annex I landen tot 14-19% onder het niveau van 1990.
• Rusland en Oekraïne zullen ook nieuwe ‘hot air’ (of overtollige AAU24's) in 2020 genereren
omdat de lage en hoge toezeggingen boven de baseline emissies uitkomen. De jaarlijkse
nieuwe ‘hot air’ zal respectievelijk neerkomen op 1,1 en 1,0 GtCO2eq voor de lage en hoge
toezeggingen. Als deze ‘hot air’ niet gebruikt wordt door Rusland en Oekraïne, wat betekent dat het niet zal worden verhandeld met andere Annex I landen die het gebruiken om binnenlandse emissies te compenseren, zullen de toezeggingen van de Annex I landen (met inbegrip van de Verenigde Staten) als groep verbeteren tot 14-19% onder het niveau van 1990.
• De lage en hoge toezeggingen met betrekking tot emissiereducties voor Annex I landen
inclusief LULUCF CO2 impliceren een reductie van 8-18% t.o.v. 1990 niveaus. Dit is minder
dan de 25-40% die noodzakelijk zijn om aan de 2° doelstelling te voldoen.
• De absolute reducties (inclusief LULUCF CO2 en REDD) in het lage en hogere ambitie
scenario zijn ongeveer 70% en 50% lager dan de reducties in het vergelijkbare inspanningsscenario.
• Alle landen van Annex I laten een aanzienlijke neerwaartse trend in emissies per hoofd van de bevolking zien tussen 1990-2020. Dit geldt vooral voor het vergelijkbare inspannings-scenario.
De hoge toezeggingen van de EU, de VS en Japan25 zijn minder ver verwijderd van de vergelijkbare inspanningen (30% totale Annex I reductiedoelstelling) dan de toezeggingen van Canada, Rusland en Oekraïne die ver beneden deze vergelijkbare inspanning reducties liggen.
Vergelijking van de reductiedoelstellingen onder de lage en hogere ambitie scenario's (scenario
1 en 2) met de reducties van het vergelijkbare inspanningsscenario26 (scenario 3) laat het
volgende zien:
• De hoge toezeggingen van de EU, de VS en Japan zijn ongeveer 5-15% punten lager dan de reducties verondersteld in het vergelijkbare inspanningsscenario (welke nodig zijn om het 450 ppm stabilisatie doel te bereiken). De hoge toezegging van de EU is bijvoorbeeld 30% t.o.v. 1990 terwijl de vergelijkbare inspanningsreductie 35% is.
• De toezeggingen van Canada, Rusland en Oekraïne liggen ver beneden de vergelijkbare inspanningsreducties. Voor Canada is dit 25% te laag en voor Rusland en Oekraïne 35%. Daarnaast zullen op basis van hun toezeggingen Rusland en Oekraïne nieuwe ‘hot air’ (of overschot van AAU's) genereren in 2020.
Hierbij moet worden opgemerkt dat de vergelijkbare inspanningsbeperkingen sterk afhankelijk zijn van het model en de parameter veronderstellingen.
23 De nieuwe toezegging van Japan is niet meegenomen in de berekeningen, het wel meenemen hiervan
resulteert in 11-16% reducties voor de industrielanden t.o.v. het 1990 niveau in 2020 in plaats van 10-15%
24 Assigned Amount Unit
25 Gebaseerd op toezegging van vorige overheid, dus de huidige toezegging is niet meegenomen 26 De vergelijkbare inspanningsreducties zijn gebaseerd op de gemiddelde uitkomst van de zes
benaderingen voor vergelijkbare mitigatie-inspanningen door Annex I landen welke gebaseerd zijn op de voorgaande PBL studie
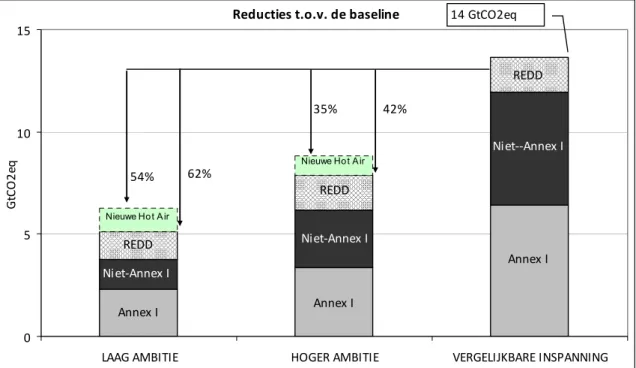
Page 22 of 121 WAB 500102 032 Reducties t.o.v. de baseline 0 5 10 15
LAAG AMBITIE HOGER AMBITIE VERGELIJKBARE INSPANNING
Gt C O 2 eq Annex I Annex I Annex I Niet‐Annex I Niet‐Annex I Niet‐‐Annex I REDD REDD REDD Nieuwe Hot A ir 54% 62% 35% 42% Nieuwe Hot A ir 14 GtCO2eq
Figuur S.1 De totale reductie van de drie scenario's, namelijk reductie van de Annex I en niet-Annex I regio’s (niet-REDD maatregelen), REDD maatregelen in niet-Annex I (gedeeltelijk gefinancierd door Annex I of andere niet-Annex I regio's ) en mogelijke opgave van de 'nieuwe' hot air (dat wil zeggen overschot van AAU's) uit de derde periode, 2018-2023).
Een voorzichtige schatting geeft aan dat de mitigatiemaatregelen op basis van de NAMA’s van de acht opkomende economieën een verlaging van emissies in 2020 met zich meebrengen van 5-11% t.o.v. de baseline in 2020 onder de baselines en 4-8% t.o.v. baseline in 2020 voor de niet-Annex I landen als groep. Dit is minder dan de 15-30% reductieniveaus t.o.v. de baseline die nodig zijn om het 2 graden klimaat doel te bereiken (samen met de 25-40% reductie t.o.v. 1990 van Annex I landen).
We hebben het reductiepotentieel van de NAMA strategieën geanalyseerd waarbij 25% (lage ambitie scenario) en 50% (hogere ambitie scenario) van het potentieel van energie-efficiëntie,
hernieuwbare energiebronnen, niet-CO2 reductie opties en vermeden ontbossing gerealiseerd
wordt.
• In de periode medio-2009 wanneer dit rapport is geschreven was er nog veel onzekerheid over hoe de NAMAs voor de niet-Annex I genoemde landen er uit gaan zien. Het is echter waarschijnlijk dat zij een belangrijk deel van de mitigatie mogelijkheden kunnen vergroten vooral voor de mogelijkheden met betrekking tot hernieuwbare energie, energie-efficiëntie,
niet- CO2-emissies en REDD.
• We hebben het reductiepotentieel van een aantal mitigatiestrategiën die door de NAMA strategieën kunnen worden verwezenlijkt geanalyseerd voor de acht opkomende economieën (Mexico, Rest van Zuid-Amerika, Brazilië, China, India, Indonesië, Korea en Zuid-Afrika). Deze laten emissiereducties zien (exclusief REDD maatregelen en LULUCF-
CO2) van 1,2 tot 2,4 GtCO2eq in 2020 die neerkomen op 5-11% reducties onder de baseline
voor de lage en hogere ambitie scenario’s. Als REDD en LULUCF- CO2 maatregelen mee
worden genomen zullen de reducties variëren van 7 tot 12% voor de lage en hogere ambitie
scenario’s (of 2,6 tot 4,2 GtCO2eq).
• Op basis van de eerder genoemde mogelijke reducties voor de acht opkomende economieën en de veronderstellingen voor reducties onder de baseline voor de andere niet-Annex I landen (afhankelijk van het stadium van ontwikkeling van deze landen) zijn de reducties voor de niet-Annex I landen als groep voor de lage and hogere ambitie scenario's
4-8% onder de baseline emissies exclusief REDD en LULUCF CO2-uitstoot en 7-12%
inclusief (d.w.z. van 1,4 tot 2,8 GtCO2eq per jaar exclusief REDD en LULUCF- CO2 en 2,6
4. Kostenimplicaties van de scenario's (exclusief kosten van REDD financiering)
De reductiekosten van Annex I landen als groep als emissiehandel en CDM zijn toegestaan zijn ongeveer 0,01-0,04% van het BBP voor de lage en hogere ambitie scenario’s en 0,24% voor het vergelijkbare inspanningsscenario. Als alle Annex I toezeggingen en vergelijkbare inspanningen in eigen land moeten worden uitgevoerd (geen emissiehandel) zullen de reductiekosten stijgen met een factor 4-13. De verschillen in totale kosten tussen de verschillende landen zijn groot.
• De jaarlijkse reductiekosten voor de lage en hoge toezeggingen van de Annex I landen als
groep zijn ongeveer 0.01-0.04% van het BBP in 2020 (gelijk aan 6-21 miljard US$2005) als
emissiehandel tussen Annex I regio's is toegestaan; er is beperkte emissiehandel met de meest ontwikkelde niet-Annex I landen en CDM met andere niet-Annex I landen. Voor het vergelijkbare inspanningsscenario stijgen de jaarlijkse kosten naar 0,24% van het BBP
(gelijk aan 120 miljard US$2005).
• Als geen emissiehandel is toegestaan waardoor alle toezeggingen in eigen land moeten worden uitgevoerd dan zullen de totale kosten toenemen met een factor 13 (0.15-0.38% van het BBP voor de het lage en hogere ambitie scenario) en met meer dan drie voor het vergelijkbare inspanningsscenario. Gegeven de veronderstelling dat emissiehandel niet mogelijk is beschikken enkele regio's niet over voldoende potentieel om hun doelstellingen te halen (hoge toezegging: de EU en eventueel Oceanië; vergelijkbare doelstelling: Canada, de EU en Oceanië).
• Er zijn grote verschillen in de totale kosten tussen landen. Als emissiehandel wordt toegestaan zullen de totale jaarlijkse reductiekosten voor het bereiken van de doelstellingen om aan de toezeggingen te voldoen in alle landen/regio ’s die in dit verslag worden geanalyseerd veel lager zijn dan 0,5% van het BBP. In het vergelijkbare inspanningsscenario zal dit minder zijn dan 1% van het BBP.
• Rusland, Oekraïne en Wit-Rusland profiteren van de baten uit emissiehandel en zullen profiteren van de verkoop van ‘hot air’ ontstaan in de Kyoto periode en blijven profiteren van de nieuwe ‘hot air’ uit de volgende periodes. De nieuwe ‘hot air’ ontstaat omdat de voorgestelde doelstellingen in 2020 tot een hogere uitstoot dan baseline zullen leiden. Hier wordt uitgegaan van een optimale strategie voor Rusland en Oekraïne met betrekking tot ‘banking’ van ‘hot air’ zodat hun financiële inkomsten worden geoptimaliseerd in zowel de eerste verbintenisperiode als in de periode 2013-2023. Dit betekent volledige ‘banking’ van ‘hot air’ uit de Kyoto periode en het vrijgeven van deze ‘hot air’ in de tweede periode (2013-2017) en de derde periode (2018-2023).
• Uit de analyses blijkt dat Australië de hoogste mitigatiekosten ten opzichte van het BBP heeft om aan haar toezeggingen te voldoen. Dit is te wijten aan een combinatie van de ambitie van de toezegging en de sectorale samenstelling m.b.t. emissies (groot aandeel van de zware industrie in de internationale emissiehandel van deze regio) welke leidt tot hoge kosten voor binnenlandse emissiereducties.
• De reductiekosten van de EU ten opzichte van het BBP zijn hoger dan voor de VS en Japan (voor alle scenario's).
De reductiekosten uitgedrukt als percentage van het BBP van niet-Annex I regio's zijn lager in vergelijking met de kosten van de Annex I landen. Met de huidige toezeggingen van Annex I regio's kan zelfs een netto winst worden gerealiseerd door de niet-Annex I landen. In deze studie doen we geen aannames over welke landen de mitigatiekosten in niet-Annex I landen zouden moeten financieren, met uitzondering van REDD. Niet-Annex I reducties kunnen ook worden gefinancierd door Annex I landen in wat zal betekenen dat niet-Annex I landen geen kosten hebben en alleen winsten laten zien uit de koolstofmarkt.
• Het hoge en lagere ambitie scenario laten kleine winsten zien voor de niet-Annex I regio's
als groep (ongeveer -0.3 tot -0.6 miljard US$2005) en lage kosten voor het vergelijkbare
inspanningsscenario: 0,18% van het BBP (gelijk aan 43 miljard US$2005).
• De verschillen in reductiekosten tussen meest ontwikkelde en minst ontwikkelde ontwikkelingslanden is groot. In het vergelijkbare inspanningsscenario zijn de kosten voor de meest ontwikkelde ontwikkelingslanden zijn in de orde van 0.3-0.5% van het BBP. Voor