Environmental risk limits for
fenoxycarb
Letter report 601716008/2008 C.E. Smit | J.W. Vonk
RIVM Letter report 601716008/2008
Environmental risk limits for fenoxycarb
C.E. Smit J.W. Vonk
Contact: C.E. Smit
Expertise Centre for Substances CE.Smit@rivm.nl
This investigation has been performed by order and for the account of Directorate-General for
Environmental Protection, Directorate for Soil, Water and Rural Area (BWL), within the framework of the project 'Standard setting for other relevant substances within the WFD'.
© RIVM 2008
Parts of this publication may be reproduced, provided acknowledgement is given to the 'National Institute for Public Health and the Environment', along with the title and year of publication.
Rapport in het kort
Environmental risk limits for fenoxycarb
Dit rapport geeft milieurisicogrenzen voor het insecticide fenoxycarb in water. Milieurisicogrenzen zijn de technisch-wetenschappelijke advieswaarden voor de uiteindelijke milieukwaliteitsnormen in
Nederland. De milieurisicogrenzen zijn afgeleid volgens de methodiek die is voorgeschreven in de Europese Kaderrichtlijn Water. Hierbij is gebruikgemaakt van de beoordeling in het kader van de Europese toelating van gewasbeschermingsmiddelen (Richtlijn 91/414/EEG), aangevuld met gegevens uit de openbare literatuur.
Contents
1 Introduction 7
1.1 Background and scope of the report 7
1.2 Status of the results 7
2 Methods 8
2.1 Data collection 8
2.2 Data evaluation and selection 8
2.3 Derivation of ERLs 9
2.3.1 Drinking water 9
3 Derivation of environmental risk limits for fenoxycarb 11
3.1 Substance identification, physico-chemical properties, fate and human toxicology 11
3.1.1 Identity 11
3.1.2 Physico-chemical properties 11
3.1.3 Behaviour in the environment 12 3.1.4 Bioconcentration and biomagnification 12 3.1.5 Human toxicological threshold limits and carcinogenicity 12
3.2 Trigger values 12
3.3 Toxicity data and derivation of ERLs for water 13 3.3.1 MPCeco, water and MPCeco, marine 13
3.3.2 MPCsp, water and MPCsp, marine 14
3.3.3 MPChh food, water 15
3.3.4 MPCdw, water 15
3.3.5 Selection of the MPCwater and MPCmarine 15
3.3.6 MACeco 15
3.3.7 SRCeco, water 15
3.4 Toxicity data and derivation of ERLs for sediment 16
4 Conclusions 17
References 18
Appendix 1. Information on bioconcentration 19
Appendix 2. Detailed aquatic toxicity data 20
Appendix 3. Description of mesocosm studies 27
Appendix 4. Detailed bird and mammal toxicity data 35
1
Introduction
1.1
Background and scope of the report
In this report, environmental risk limits (ERLs) for surface water are derived for the insecticide
fenoxycarb. The derivation is performed within the framework of the project ‘Standard setting for other relevant substances within the WFD’, which is closely related to the project ‘International and national environmental quality standards for substances in the Netherlands’ (INS). Fenoxycarb is part of a series of 25 pesticides that appeared to have a high environmental impact in the evaluation of the policy document on sustainable crop protection (‘Tussenevaluatie van de nota Duurzame Gewasbescherming’; MNP, 2006) and/or were selected by the Water Boards (‘Unie van Waterschappen’; project ‘Schone Bronnen’; http://www.schonebronnen.nl/).
The following ERLs are considered:
• Maximum Permissible Concentration (MPC) – the concentration protecting aquatic ecosystems and humans from effects due to long-term exposure
• Maximum Acceptable Concentration (MACeco) – the concentration protecting aquatic ecosystems
from effects due to short-term exposure or concentration peaks.
• Serious Risk Concentration (SRCeco) – the concentration at which possibly serious ecotoxicological
effects are to be expected.
More specific, the following ERLs can be derived depending on the availability of data and characteristics of the compound:
MPCeco, water MPC for freshwater based on ecotoxicological data (direct exposure)
MPCsp, water MPC for freshwater based on secondary poisoning
MPChh food, water MPC for fresh and marine water based on human consumption of fishery products
MPCdw, water MPC for surface waters intended for the abstraction of drinking water
MACeco, water MAC for freshwater based on ecotoxicological data (direct exposure)
SRCeco, water SRC for freshwater based on ecotoxicological data (direct exposure)
MPCeco, marine MPC for marine water based on ecotoxicological data (direct exposure)
MPCsp, marine MPC for marine water based on secondary poisoning
MACeco, marine MAC for marine water based on ecotoxicological data (direct exposure)
1.2
Status of the results
The results presented in this report have been discussed by the members of the scientific advisory group for the INS-project (WK-INS). It should be noted that the Environmental Risk Limits (ERLs) in this report are scientifically derived values, based on (eco)toxicological, fate and physico-chemical data. They serve as advisory values for the Dutch Steering Committee for Substances, which is appointed to set the Environmental Quality Standards (EQSs). ERLs should thus be considered as proposed values that do not have any official status.
2
Methods
The methodology for the derivation of ERLs is described in detail by Van Vlaardingen and Verbruggen (2007), further referred to as the ‘INS-Guidance’. This guidance is in accordance with the guidance of the Fraunhofer Institute (FHI; Lepper, 2005).
The process of ERL-derivation contains the following steps: data collection, data evaluation and selection, and derivation of the ERLs on the basis of the selected data.
2.1
Data collection
In accordance with the WFD, data of existing evaluations were used as a starting point. For fenoxycarb, the evaluation report prepared within the framework of EU Directive 91/414/EC (Draft Assessment Report, DAR) was consulted (EC, 2007; further referred to as DAR). An on-line literature search was performed on TOXLINE (literature from 1985 to 2001) and Current Contents (literature from 1997 to 2007). In addition to this, all potentially relevant references in the RIVM e-tox base and EPA’s ECOTOX database were checked.
2.2
Data evaluation and selection
For substance identification, physico-chemical properties and environmental behaviour, information from the List of Endpoints of the DAR was used. When needed, additional information was included according to the methods as described in Section 2.1 of the INS-Guidance. Information on human toxicological threshold limits and classification was also primarily taken from the DAR.
Ecotoxicity studies (including bird and mammal studies) were screened for relevant endpoints (i.e. those endpoints that have consequences at the population level of the test species). All ecotoxicity and bioaccumulation tests were then thoroughly evaluated with respect to the validity (scientific reliability) of the study. A detailed description of the evaluation procedure is given in the INS-Guidance (see Section 2.2.2 and 2.3.2). In short, the following reliability indices were assigned:
- Ri 1: Reliable without restriction
’Studies or data … generated according to generally valid and/or internationally accepted testing guidelines (preferably performed according to GLP) or in which the test parameters documented are based on a specific (national) testing guideline … or in which all parameters described are closely related/comparable to a guideline method.’
- Ri 2: Reliable with restrictions
’Studies or data … (mostly not performed according to GLP), in which the test parameters
documented do not totally comply with the specific testing guideline, but are sufficient to accept the data or in which investigations are described which cannot be subsumed under a testing guideline, but which are nevertheless well documented and scientifically acceptable.’
- Ri 3: Not reliable
’Studies or data … in which there are interferences between the measuring system and the test substance or in which organisms/test systems were used which are not relevant in relation to the exposure (e.g., unphysiologic pathways of application) or which were carried out or generated according to a method which is not acceptable, the documentation of which is not sufficient for an assessment and which is not convincing for an expert judgment.’
- Ri 4: Not assignable
’Studies or data … which do not give sufficient experimental details and which are only listed in short abstracts or secondary literature (books, reviews, etc.).’
All available studies were summarised in data-tables, that are included as Appendices to this report. These tables contain information on species characteristics, test conditions and endpoints. Explanatory notes are included with respect to the assignment of the reliability indices.
With respect to the DAR, it was chosen not to re-evaluate the underlying studies. In principle, the endpoints that were accepted in the DAR were also accepted for ERL-derivation with Ri 2, except in cases where the reported information was too poor to decide on the reliability or when there was reasonable doubt on the validity of the tests. This applies especially to DARs prepared in the early 1990s, which do not always meet the current standards of evaluation and reporting.
In some cases, the characteristics of a compound (i.e. fast hydrolysis, strong sorption, low water solubility) put special demands on the way toxicity tests are performed. This implies that in some cases endpoints were not considered reliable, although the test was performed and documented according to accepted guidelines. If specific choices were made for assigning reliability indices, these are outlined in Section 3.3 of this report.
Endpoints with Ri 1 or 2 are accepted as valid, but this does not automatically mean that the endpoint is selected for the derivation of ERLs. The validity scores are assigned on the basis of scientific
reliability, but valid endpoints may not be relevant for the purpose of ERL-derivation (e.g. due to inappropriate exposure times or test conditions that are not relevant for the Dutch situation).
After data collection and validation, toxicity data were combined into an aggregated data table with one effect value per species according to Section 2.2.6 of the INS-Guidance. When for a species several effect data were available, the geometric mean of multiple values for the same endpoint was calculated where possible. Subsequently, when several endpoints were available for one species, the lowest of these endpoints (per species) is reported in the aggregated data table.
2.3
Derivation of ERLs
For a detailed description of the procedure for derivation of the ERLs, reference is made to the INS-Guidance. With respect to the selection of the final MPCwater some additional comments should be
made:
2.3.1
Drinking water
The INS-Guidance includes the MPC for surface waters intended for the abstraction of drinking water (MPCdw, water) as one of the MPCs from which the lowest value should be selected as the general
MPCwater (see INS-Guidance, Section 3.1.6 and 3.1.7). According to the proposal for the daughter
directive Priority Substances, however, the derivation of the AA-EQS (= MPC) should be based on direct exposure, secondary poisoning, and human exposure due to the consumption of fish. Drinking water was not included in the proposal and is thus not guiding for the general MPC value. The exact way of implementation of the MPCdw, water in the Netherlands is at present under discussion within the
framework of the “AMvB Kwaliteitseisen en Monitoring Water”. No policy decision has been taken yet, and the MPCdw, water is therefore presented as a separate value in this report. The MPCwater is thus
derived considering the individual MPCs based on direct exposure (MPCeco, water), secondary poisoning
(MPCsp, water) or human consumption of fishery products (MPChh food, water); derivation of the latter two is
Related to this is the inclusion of water treatment for the derivation of the MPCdw, water. According to
the INS-Guidance (see Section 3.1.7), a substance specific removal efficiency related to simple water treatment should be derived in case the MPCdw, water is lower than the other MPCs. For pesticides, there
is no agreement as yet on how the removal fraction should be calculated, and water treatment is therefore not taken into account. In case no A1 value is set in Directive 75/440/EEC, the MPCdw, water is
set to the general Drinking Water Standard of 0.1 µg/L for organic pesticides as specified in Directive 98/83/EC.
3
Derivation of environmental risk limits for
fenoxycarb
3.1
Substance identification, physico-chemical properties, fate and human
toxicology
3.1.1
Identity
Figure 1. Structural formula of fenoxycarb. Table 1. Identification of fenoxycarb.
Parameter Name or number Source
Common/trivial/other name Fenoxycarb EC, 2007, Tomlin 2002 Chemical name Ethyl
2-(4-phenoxyphenoxy)ethylcarba-mate
EC, 2007 CAS number 79127-80-3 EC, 2007 EC number 276-696-7
SMILES code CCOC(=O)NCCOc1ccc(Oc2ccccc2)cc1 U.S.EPA, 2007 Use class Insecticide
Mode of action Juvenile hormone analogue Tomlin, 2002 Authorised in NL Yes
Annex 1 listing No
3.1.2
Physico-chemical properties
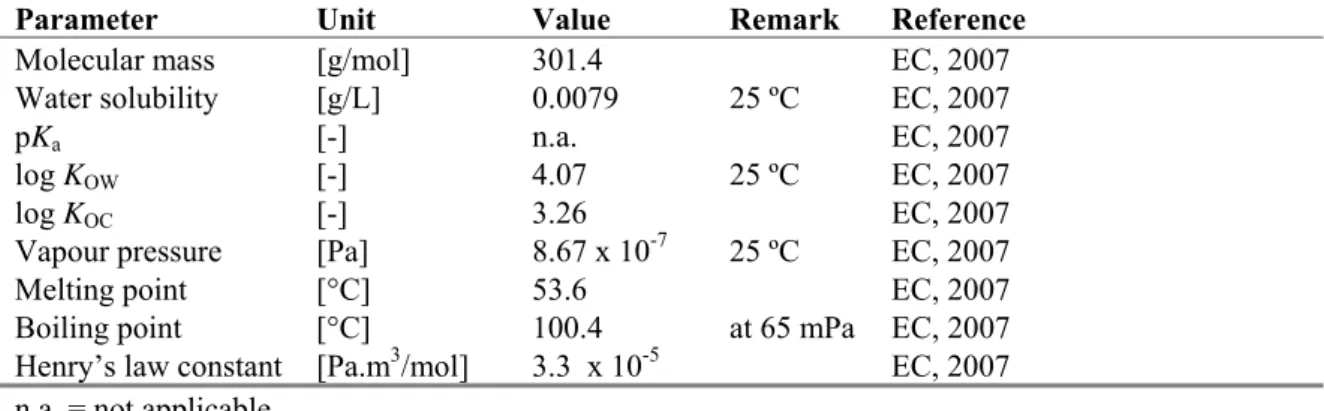
Table 2. Physico-chemical properties of fenoxycarb.
Parameter Unit Value Remark Reference
Molecular mass [g/mol] 301.4 EC, 2007 Water solubility [g/L] 0.0079 25 ºC EC, 2007
pKa [-] n.a. EC, 2007
log KOW [-] 4.07 25 ºC EC, 2007
log KOC [-] 3.26 EC, 2007
Vapour pressure [Pa] 8.67 x 10⁻⁷ 25 ºC EC, 2007 Melting point [°C] 53.6 EC, 2007 Boiling point [°C] 100.4 at 65 mPa EC, 2007 Henry’s law constant [Pa.m3/mol] 3.3 x 10⁻⁵ EC, 2007 n.a. = not applicable.
3.1.3
Behaviour in the environment
Table 3. Selected environmental properties of fenoxycarb.
Parameter Unit Value Remark Reference
Hydrolysis half-life DT50 [d] Stable At pH 3-9 EC, 2007 Photolysis half-life DT50 [d] 4 h-29 d Artificial sunlight,
3 studies
EC, 2007 Readily biodegradable No EC, 2007 Degradation in
water/sediment systems
DT50 (system) [d] 4.4-6.0 EC, 2007 Relevant metabolites None EC, 2007
3.1.4
Bioconcentration and biomagnification
An overview of the bioaccumulation data for fenoxycarb is given in Table 4. Detailed bioaccumulation data for fenoxycarb are tabulated in Appendix 1.
Table 4. Overview of bioaccumulation data for fenoxycarb.
Parameter Unit Value Remark Reference
BCF (fish) [L/kg] 208 Geometric mean of two values EC, 2007
BMF [kg/kg] 1 Default value for BCF < 2000 L/kg Van Vlaardingen en Verbruggen (2007)
3.1.5
Human toxicological threshold limits and carcinogenicity
Fenoxycarb has the following R phrases: R 40. The ADI is 0.06 mg/kg bw. The AOEL is 0.1 mg/kg bw/day. Fenoxycarb is not a known mutagen or a substance known or suspected to affect reproduction (EC, 2007).
3.2
Trigger values
This section reports on the trigger values for ERLwater derivation (as demanded in WFD framework).
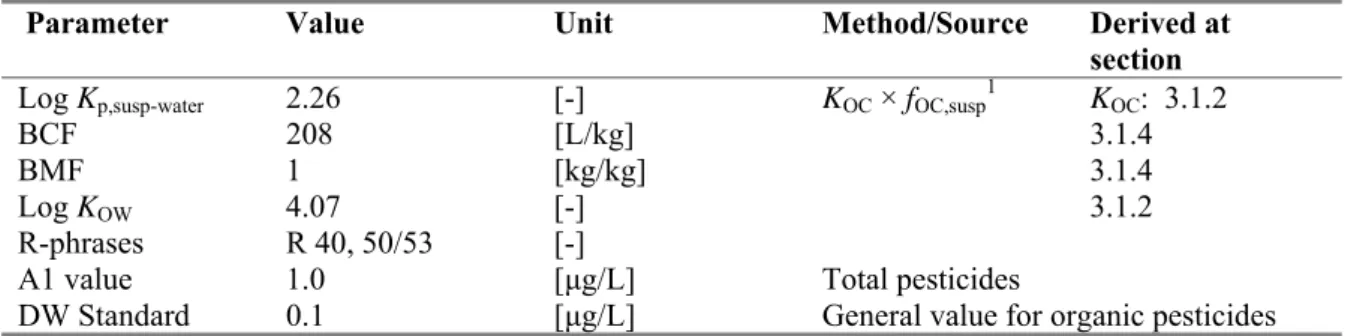
Table 5. Fenoxycarb: collected properties for comparison to MPC triggers.
Parameter Value Unit Method/Source Derived at section
Log Kp,susp-water 2.26 [-] KOC × fOC,susp1 KOC: 3.1.2
BCF 208 [L/kg] 3.1.4
BMF 1 [kg/kg] 3.1.4
Log KOW 4.07 [-] 3.1.2
R-phrases R 40, 50/53 [-]
A1 value 1.0 [μg/L] Total pesticides DW Standard 0.1 [μg/L] General value for organic pesticides
1 f
o Fenoxycarb has a log Kp, susp-water < 3; derivation of MPCsediment is not triggered.
o Fenoxycarb has a log Kp, susp-water < 3; expression of the MPCwater as MPCsusp, water is not required.
o Fenoxycarb has a BCF ≥ 100; assessment of secondary poisoning is triggered.
o Fenoxycarb has an R 40 classification. Therefore, an MPCwater for human health via food (fish) consumption (MPChh food, water) is required, based on R 40.
o For fenoxycarb, no specific A1 value or Drinking Water Standard is available from Council Directives 75/440, EEC and 98/83/EC, respectively. Therefore, the general Drinking Water Standard for organic pesticides applies.
3.3
Toxicity data and derivation of ERLs for water
3.3.1
MPC
eco, waterand MPC
eco, marineAn overview of the selected aquatic toxicity data for fenoxycarb is given in Table 6 for freshwater and in Table 7 for the marine environment. Detailed aquatic toxicity data for fenoxycarb are tabulated in Appendix 2.
Table 6. Fenoxycarb: selected freshwater toxicity data for ERL derivation.
Chronica Acutea
Taxonomic group NOEC/EC10 (μg/L) Taxonomic group L(E)C50 (μg/L)
Algae 210b Algae 1080d Crustacea 0.003 Crustacea 520e Crustacea 0.072c Pisces 1500 Insecta 0.75 Pisces 880 Pisces 48 Pisces 740 Pisces 660
a For detailed information see Appendix 2. Bold values are used for ERL derivation. b Geometric mean of 0.38 and 0.12 mg/L for Pseudokirchneriella subcapitata (growth rate). c Geometric mean of 0.0000016 and 0.0032 mg/L for Daphnia magna (reproduction). d
Geometric mean of 1.4 and 0.84 mg/L for Pseudokirchneriella subcapitata (growth rate).
e Geometric mean of 0.21, 0.52, 0.48, 0.65, 0.49, 0.86, 0.26, 0.5 and 1.5 mg/L for Daphnia magna
(immobilisation).
Table 7. Fenoxycarb: selected marine toxicity data for ERL derivation.
Chronic a Acute a
Taxonomic group NOEC/EC10 (mg/L) Taxonomic group L(E)C50 (µg/L)
- - Mollusca 520
Crustacea 350
Crustacea 1900
Pisces 1100
Pisces 860
a For detailed information see Appendix 2.
3.3.1.1 Treatment of fresh- and saltwater toxicity data
ERLs for freshwater and marine waters should be derived separately. For pesticides, data can only be combined if it is possible to determine with high probability that marine organisms are not more sensitive than freshwater organisms (Lepper, 2005). For fenoxycarb, no marine toxicity data are available and ERLs for the marine compartment cannot be derived.
3.3.1.2 Mesocosm and field studies
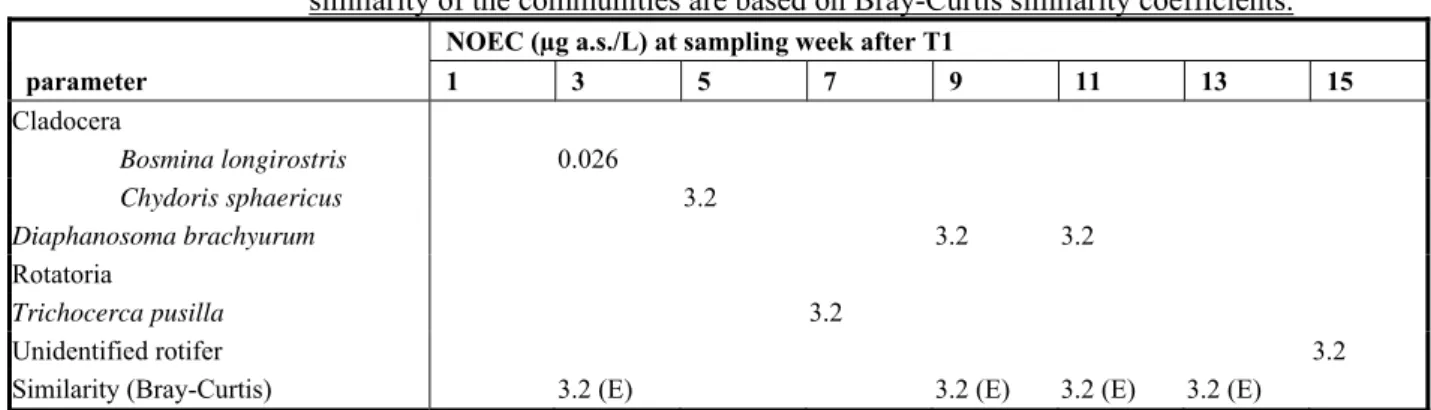
In the DAR (EC, 2007) an extensive summary of an outdoor mesocosm study (including fish) is given. An abstract is shown in Appendix 3. The treatment level of 0.123 µg a.s./L nominally (mean maximum measured concentration 0.096 µg a.s./L) was the lowest level with effects. It appeared that the
cladoceran Bosmina longirostris was the most sensitive species, with significant reductions of the population at this level in week 3 after application. Based on this treatment level, the NOEC was
established as the next lower treatment level of 0.026 μg/L (mean measured maximum
concentration). The study is considered to be reliable. However, it cannot be used for MPC derivation
because of the rapid disappearance of fenoxycarb from the system (DT50 < 0.5 d); this means that there
is no continuous exposure during the experiment. This value can be used for the derivation of the MAC value (see Section 3.3.6).
An indoor artificial stream microcosm (see Appendix 3) cannot be used for MPC derivation because of the limited amount of species of one taxon and the fact that the system is not representative for Dutch surface water.
3.3.1.3 Derivation of MPCeco, water and MPCeco, marine
The base-set for freshwater toxicity data is complete. Chronic NOECs are available for three trophic levels (algae, crustaceans and fish). Thus, with three NOECs available for three trophic levels, an assessment factor of 10 can be used on the lowest NOEC (0.003 µg/L for Ceriodaphnia dubia), which results in an MPCeco, water of 0.003 / 10 = 0.0003 µg/L (0.3 ng/L).
For the marine environment not sufficient data are available (base set not complete); therefore an MPCeco, marine is not derived.
3.3.2
MPC
sp, waterand MPC
sp, marineFenoxycarb has a BCF ≥ 100 L/kg, thus assessment of secondary poisoning is triggered.
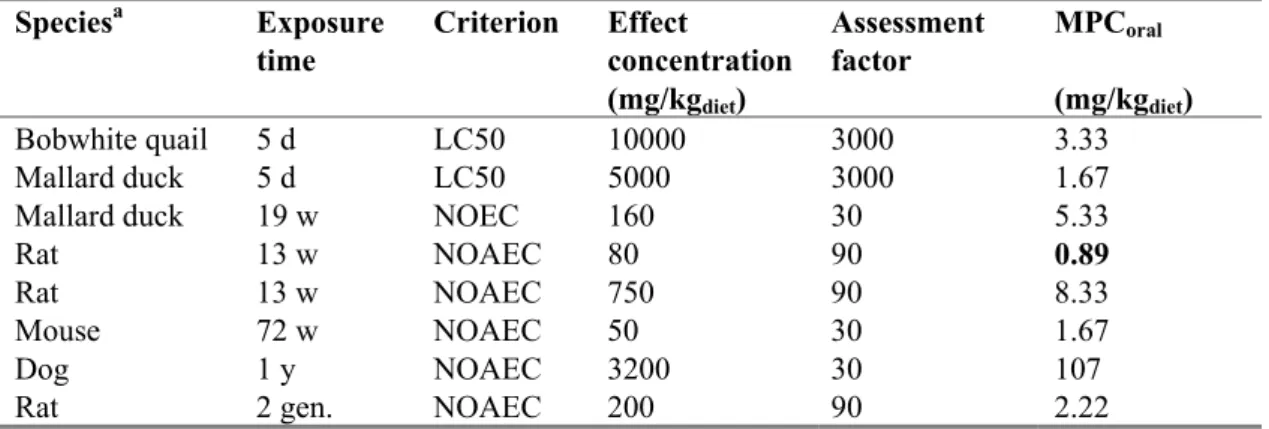
The lowest MPCoral is 0.89 mg/kg diet for rats (see Table 8). The MPCsp, water is calculated as MPCoral /
(BCF x BMF1). Using a BCF of 208 L/kg and a BMF1 of 1 (Table 5) the MPCsp, water is 0.89/ (208 × 1)
= 0.0043 mg/L (4.3 μg/L).
Table 8. Fenoxycarb: selected bird and mammal data for ERL derivation.
Speciesa Exposure time Criterion Effect concentration (mg/kgdiet) Assessment factor MPCoral (mg/kgdiet) Bobwhite quail 5 d LC50 10000 3000 3.33 Mallard duck 5 d LC50 5000 3000 1.67 Mallard duck 19 w NOEC 160 30 5.33
Rat 13 w NOAEC 80 90 0.89
Rat 13 w NOAEC 750 90 8.33
Mouse 72 w NOAEC 50 30 1.67
Dog 1 y NOAEC 3200 30 107
Rat 2 gen. NOAEC 200 90 2.22
a For detailed information see Appendix 4. Bold values are used for ERL derivation.
Because toxicity data for marine predators are generally not available, the MPCoral, min as derived above
is used as a representative for the marine environment also. To account for the longer food chains in the marine environment, an additional biomagnification step is introduced (BMF2). This factor is the same
as given in Table 4. The MPCsp, marine is calculated as MPCoral / (BCF x BMF1 x BMF2) and becomes:
3.3.3
MPC
hh food, waterDerivation of MPChh food,water for fenoxycarb is triggered (Table 5). MPChh food is calculated from the
ADI (0.06 mg/kgbw/d), a body weight of 70 kg and a daily fish consumption of 115 g as MPC hh food =
0.1 x 0.06 x 70/0.115 = 3.65 mg/kg (Van Vlaardingen en Verbruggen, 2007). Subsequently the MPChh food, water is calculated according to MPChh food, water = 3.65/(BCFfish x BMF1) = 3.65/208 = 0.018
mg/L (18 μg/L).
3.3.4
MPC
dw, waterThe Drinking Water Standard is 0.1 µg/L. Thus, the MPCdw,water is 0.1 µg/L.
3.3.5
Selection of the MPC
waterand MPC
marineThe lowest MPC value should be selected as the general MPC. The lowest value of the routes included (see Section 2.3.1) is the MPCeco, water. Therefore, the MPCwater is 0.0003 μg/L.
The MPCmarine cannot be derived.
3.3.6
MAC
eco3.3.6.1 MACeco, water
The MACeco, water may be derived from the acute toxicity data. Six short-term values for three trophic
levels (fish, Daphnia, and algae) are available, fenoxycarb has a potential to bioaccumulate (BCF ≥ 100 L/kg), the mode of action for the tested species is specific, and the most sensitive species
(Crustacea, see Table 6 and the mesocosm study) are included in the data set. Therefore, an assessment factor of 100 would be appropriate according the INS-guidance (Van Vlaardingen and Verbruggen, 2007). This factor 100 is applied to the lowest L(E)C50, i.e. the EC50 for Daphnia magna: 0.52 mg/L.
Therefore, the MACeco as derived in first instance from acute toxicity data is 0.52/100 = 0.0052 mg/L
(5.2 μg/L).
It should be kept in mind that the mode of action of fenoxycarb (juvenile hormone analogue) requires some time before the toxic action comes to expression. Since also the ratio between acute and chronic toxicity data is very high, it may be doubted whether acute toxicity data are useful to derive a MACeco
value.
An outdoor mesocosm study (total duration 115 days) is available (see Section 3.3.1.2). From this study a NOEC of 0.026 μg/L was established (mean measured maximum concentration). This
concentration is lower than the MACeco, water on the basis of acute toxicity data. Fenoxycarb disappeared
rapidly from the system (DT50 < 0.5 d). Since the effect on the most sensitive organism, Bosmina
longirostris, occurred already three weeks after application of fenoxycarb and it reflects relatively acute
effects in relation to the total duration of the study, it is more appropriate to consider the NOEC from this mesocosm study as MACeco, water rather than the MAC derived from short term toxicity tests. The
effects in the mesocosm study are clearly related to the initial short term exposure. The MACeco, water
thus becomes 0.026 μg/L. An assessment factor on this value is not deemed necessary because this value is already much lower than the value derived from acute toxicity data.
3.3.6.2 MACeco, marine
Because data on marine algae are not available, a comparison between freshwater toxicity data and marine toxicity data cannot be made. Therefore, no MACeco, marine can be derived.
3.3.7
SRC
eco, waterSince four long-term NOECs of all required trophic levels are available, the SRCeco, water is derived from
the geometric mean of all available NOECs with an assessment factor 1. The geometric mean is 0.0011 mg/L. Therefore, the SRC is derived as 0.0011 / 1 = 0.0011 mg/L (1.1 μg/L).
3.4
Toxicity data and derivation of ERLs for sediment
The Kp, susp-water of fenoxycarb is below the trigger value of 3; therefore, ERLs are not derived for
4
Conclusions
In this report, the risk limits Maximum Permissible Concentration (MPC), Maximum Acceptable Concentration for ecosystems (MACeco), and Serious Risk Concentration for ecosystems (SRCeco) are
derived for fenoxycarb in water. No risk limits were derived for the marine compartment because not enough data were available. Derivation of ERLs for sediment was not triggered.
The ERLs that were obtained are summarised in the table below. The MPC value that was set for this compound until now, is also presented in this table for comparison reasons. It should be noted that this is an indicative MPC (‘ad-hoc MTR’), derived using a different methodology and based on limited data.
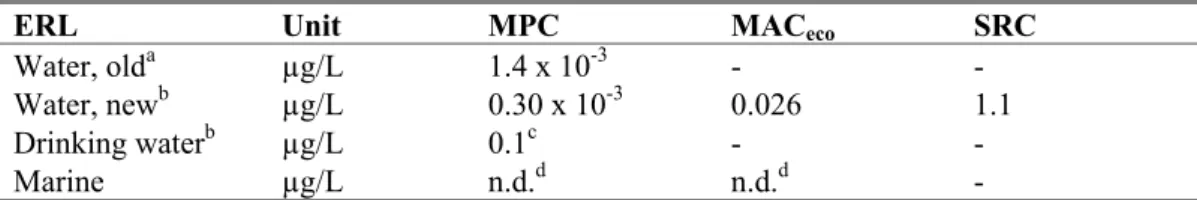
Table 9. Derived MPC, MACeco, and SRC values for fenoxycarb.
ERL Unit MPC MACeco SRC
Water, olda µg/L 1.4 x 10⁻³ - - Water, newb µg/L 0.30 x 10⁻³ 0.026 1.1 Drinking waterb µg/L 0.1c - - Marine µg/L n.d.d n.d.d -
a indicative MPC (‘ad-hoc MTR’), source: Helpdesk Water
http://www.helpdeskwater.nl/emissiebeheer/normen_voor_het/zoeksysteem_normen/
b The MPC
dw, water is reported as a separate value from the other MPCwater values (MPCeco, water, MPCsp, water or
MPChh food, water). From these other MPC water values (thus excluding the MPCdw, water) the lowest one is selected as
the ‘overall’ MPCwater.
c provisional value pending the decision on implementation of the MPC
dw, water, (see Section 2.3.1)
References
EC. 2003. Technical Guidance Document in support of Commission Directive 93/67/EEC on Risk Assessment for new notified substances, Commission Regulation (EC) No 1488/94 on Risk Assessment for existing substances and Directive 98/9/EC of the European Parliament and of the Council concerning the placing of biocidal products on the market. Part II. Ispra, Italy: European Chemicals Bureau, Institute for Health and Consumer Protection. Report no. EUR 20418 EN/2. EC. 2007. Fenoxycarb, Draft Assessment Report. Rapporteur Member State: The Netherlands.
Lepper P. 2005. Manual on the Methodological Framework to Derive Environmental Quality Standards for Priority Substances in accordance with Article 16 of the Water Framework Directive
(2000/60/EC). 15 September 2005 (unveröffentlicht) ed. Schmallenberg, Germany: Fraunhofer-Institute Molecular Biology and Applied Ecology.
MNP. 2006. Tussenevaluatie van de nota Duurzame gewasbescherming. Bilthoven, The Netherlands: Milieu- en Natuurplanbureau. MNP-publicatienummer: 500126001.
Tomlin CDS. 2002. e-Pesticide Manual 2002-2003 (Twelfth edition), Version 2.2. British Crop Protection Council.
U.S. EPA. 2007. EPI SuiteTM [computer program]. Version 3.2. Washington, DC, U.S.A: U.S. Environmental Protection Agency (EPA), Office of Pollution Prevention Toxics and Syracuse Research Company (SRC).
Van Vlaardingen PLA, Verbruggen EMJ. 2007. Guidance for the derivation of environmental risk limits within the framework of the project 'International and National Environmental Quality Standards for Substances in the Netherlands' (INS). Bilthoven, The Netherlands: National Institute for Public Health and the Environment (RIVM). Report no. 601501031. 117 pp.
report 601716008
19
Appendix 1. Information on bioconcentration
Species Specie s proper-ties Tes t compound Purity [%] A Tes t ty pe Tes t wa te r pH Hardness/ Salinity [g/L ] Ex p. Time [d] Temperature [°C ] Ex p. con cn. [μ g/L ] BCF [L/kg w. w. ] BCF type Method Ri Not es Ref erenc e Lepomis macr ochi ru s [14C-hy drochinone ]- fenoxy carb 99.5 Y F 8.0-8 .2 28+14 22.0-22 .3 1.5 215 W hole fish Equilibrium 2 1 DAR, Vol z, 200 1 Lepomis macr ochi ru s [14C-hy drochinone ]- fenoxy carb 99.5 Y F 8.0-8 .2 28+14 22.0-22 .3 15 201 W hole fish Equilibrium 2 1 DAR, Vol z, 200 1 1 Ba sed on p aren t compound in fi sh a nd w ater, normali se d to 6% fat.
RIVM Letter r ep ort 601716008 e A 2. 1. A cut e t ox ici ty o f feno xy carb to freshw at er o rganism s. s Specie s properti es A Tes t ty pe Tes t compound Purity [%] Tes t wa te r pH T [°C ] Hardness CaCO3 [mg/L ] Ex p. tim e Criterion Tes t endpoint Value [mg/L ] Ri Not es Ref erenc e kir c hneri e lla Y S 25 W G 25.6 72 h EbC50 0.82 2 1,4,19,22 DAR, Mae tzle r, 199 9 kir c hneri e lla Y S 25 W G 25.6 72 h ErC50 1.4 2 1,4,19,22 DAR, Mae tzle r, 199 9 kir c hneri e lla Y S 25 W G 25.6 96 h 72h- EbC50 0.38 2 1,4,19,22 ,23 DAR, Desj ardin s e t al., 2001 kir c hneri e lla Y S 25 W G 25.6 96 h 72h- ErC50 0.84 2 1,4,19,22 ,23 DAR, Desj ardin s e t al., 2001 smu s sub s pica tus Y S Fenoxy carb 96.6 96 h EbC50 1.1 3 1,5,6,16 DAR, Ellge hausen, 1983 smu s sub s pica tus S Fenoxy carb tg 96 h EC50 1.1 4* 1,6,19,25 PSD, 1997 < 24 h , EPA strain Y Sc Fenoxy carb 99.6 am 21±1 48 h EC50 immobiliza tion 0.21 2 1,2,3,4 Oda e t a l., 2 007 < 24 h , Bay er strain Y Sc Fenoxy carb 99.6 am 21±1 48 h EC50 immobiliza tion 0.52 2 1,2,3,4 Oda e t a l., 2 007 < 24 h , Denmark strain Y Sc Fenoxy car b 99.6 am 21±1 48 h EC50 immobiliza tion 0.48 2 1,2,3,4 Oda e t a l., 2 007 < 24 h , EAUK strai n Y Sc Fenoxy carb 99.6 am 21±1 48 h EC50 immobiliza tion 0.65 2 1,2,3,4 Oda e t a l., 2 007 < 24 h , AstraZene ca strain Y Sc Fenoxy carb 99.6 am 21±1 48 h EC50 immobiliza tion 0.49 2 1,2,3,4 Oda e t a l., 2 007 < 24 h , Finland stra in Y Sc Fenoxy carb 99.6 am 21±1 48 h EC50 immobiliza tion 0.86 2 1,2,3,4 Oda e t a l., 2 007 < 24 h , NIES strai n Y Sc Fenoxy carb 99.6 am 21±1 48 h EC50 immobiliza tion 0.26 2 1,2,3,4 Oda e t a l., 2 007 Y S Fenoxy carb 95 48 h EC50 immobiliza tion 0.4 3 6,7,10,14 ,17 DAR, Ellge hausen, 1982 Y S Fenoxy carb 95 48 h NOEC immobiliz at ion 0.05 3 6,7,10,14 ,17 DAR, Ellge hausen, 1982 Y F Fenoxy carb 97.8 48 h EC50 immobiliza tion 0.5 2 4,5,15 DAR, W ard and Bo eri, 1993 f Y F Fenoxy carb 97.8 48 h NOEC immobiliz at ion 0.26 2 4,5,15 DAR, W ard and Bo eri, 1993 f Y F Fenoxy carb 8.0-8 .3 20.6-20 .9 48 h LC 50 immobiliza tion 0.6 4* 4,15 ,19,2 5 PSD , 1997 Y F Fenoxy carb 8.0-8 .3 20.6-20 .9 48 h NO EC immobiliza tion 0.26 4* 4,15 ,19,2 5 PSD , 1997 S Fenoxy carb 48 h EC50 im mobiliza tion 0.4 3 7,10 ,19 PSD , 1997 Y S Fenoxy carb 25.6 48 h EC50 immobiliz at ion 1.5 2 1,19 ,20,2 1 DAR, Mae tzle r, 200 0 Y S Fenoxy carb 25.6 48 h NOEC immobiliz at ion 0.49 2 1,19 ,20,2 1 DAR, Mae tzle r, 200 0 Fenoxy carb c a rpio Y S Fenoxy carb 96 h LC50 mortali ty 5.9 3 DAR, Ba the , 19 82b c a rpio Y S Fenoxy carb 96 h NOEC mortali ty <4.8 3 DAR, Ba the , 19 82b c a rpio Y F Fenoxy carb 97.8 96 h LC50 mort ali ty 1.5 2 1,4,5 DAR, Ba the , 19 82b c a rpio Y F Fenoxy carb 97.8 96 h NOEC mort ali ty 0.68 2 1,4,5 DAR, W ard and Bo eri, 1993c c a rpio 3.0 mg , 76 mm N S Fenoxy carb tg 7.3-7 .6 20-22 96 h LC50 mortali ty 10.3 3 5,7,10,19 PSD , 1997 c a rpio 3.0 mg , 76 mm N S Fenoxy carb tg 7.3-7 .6 20-22 96 h NOEC mortali ty <6 3 5,7,10,19 PSD , 1997 c a rpio 0.62 g, 35 mm Y F Fenoxy carb tg 6.7-7 .4 22±2 96 h LC50 mortali ty 1.5 4* 1,4,5,19 ,25 PSD , 1997 c a rpio 0.62 g, 35 mm Y F Fenoxy carb tg 6.7-7 .4 22±2 96 h NOEC mortali ty 0.46 4* 1,4,5,19 ,25 PSD , 1997 a ffini s 3-5 d old N S Picty l EC nw 27 ±0.5 48 h LC50 Mortali ty 1.05 3 26 Tietze e t al .,1991 s pun cta tu s Y F Fenoxy carb 97.8 96 h LC50 mortal ity 0.88 2 1,4,5 DAR, W ard and Bo eri, 1993d s pun cta tu s Y F Fenoxy carb 97.8 96 h NOEC mort ali ty 0.49 2 1,4,5 DAR, W ard and Bo eri, 1993d s pun cta tu s Y F Fenoxy carb 7.1-7 .4 21.1-22 .4 96 h LC50 mortali ty 0.88 4* 1,4,5,19 ,25 PSD , 1997 s pun cta tu s Y F Fenoxy carb 7.1-7 .4 21.1-22 .4 96 h NOEC mortali ty 0.49 4* 1,4,5,19 ,25 PSD , 1997
report 601716008 21 Specie s properti es A Tes t ty pe Tes t compound Purity [%] Tes t wa te r pH T [°C ] Hardness CaCO3 [mg/L ] Ex p. tim e Criterion Tes t endpoint Value [mg/L ] Ri Not es Ref erenc e ochi ru s Y S Fenoxy carb 96 h LC50 mortal ity 2.9 3 5,6,7,8 ,9 DAR, Ba the , 19 82a ochi ru s Y S Fenoxy carb 96 h NOEC mort ali ty 1 3 5,6,7,8 ,9 DAR, Ba the , 19 82a ochi ru s Y F Fenoxy carb 97.8 96 h LC50 mortal ity 0.74 2 4,5,12 DAR, W ard and Bo eri, 1993b ochi ru s Y F Fenoxy carb 97.8 96 h NOEC mort ali ty 0.42 2 4,5,12 DAR, W ard and Bo eri, 1993b ochi ru s 4.2 g, 63 mm Y S Fenoxy carb tg 7.3-7 .7 20-22 96 h LC50 mortali ty 2.9 4* 5,19 ,24,2 5 PSD, 1997 ochi ru s 4.2 g, 63 mm Y S Fenoxy carb tg 7.3-7 .7 20-22 96 h NOEC mortali ty <1 4* 5,19 ,24,2 5 PSD, 1997 ochi ru s 0.55 g, 37 mm Y F Fenoxy carb tg 7.3-7 .6 21.8-22 .3 96 h LC50 mortali ty 0.74 4* 4,5,12,19 ,25 PSD, 1997 ochi ru s 0.55 g, 37 mm Y F Fenoxy carb tg 7.3-7 .6 21.8-22 .3 96 h NOEC mortali ty 0. 42 4* 4,5,12,19 ,25 PSD, 1997 chu s m y k iss N S Fenoxy carb 97 96 h LC50 mortal ity 1.6 3 5,6 DAR, Bu chanan an d Pell , 1980 chu s m y k iss N S Fenoxy carb 97 96 h NOEC mortal ity <0.5 3 5,6 DAR, Bu chanan an d Pell , 1980 chu s m y k iss Y F Fenoxy carb 97.8 96 h LC50 mortal ity 0.66 2 4,5,12 DAR, W ard and Bo eri, 1993a chu s m y k iss Y F Fenoxy carb 97.8 96 h NOEC mort ali ty 0.26 2 4,5,12 DAR, W ard and Bo eri, 1993a chu s m y k iss Y S Fenoxy carb 25.6 96 h LC50 mortal ity 3.4 3 1,4,10,18 ,19 DAR, P feifle, 1999 chu s m y k iss Y S Fenoxy carb 25.6 96 h NOEC mortal ity <1.0 3 1,4,10,18 ,19 DAR, P feifle, 1999 chu s m y k iss 4.0 g N S Fenoxy carb tg 7.2-7 .5 12-13 96 h LC50 mortali ty 1.6 4* 5,6,19,25 PSD , 1997 chu s m y k iss 4.0 g N S Fenoxy carb tg 7.2-7 .5 12-13 96 h NOEC mortali ty <0.5 4* 5,6,19,25 PSD , 1997 chu s m y k iss 0.24 g, 31 mm (end of test) Y F Fenoxy carb tg 7. 4 12±1 96 h LC50 mortali ty 0. 66 4* 4,5,12,19 ,25 PSD , 1997 chu s m y k iss 0.24 g, 31 mm (end of test) Y F Fenoxy carb tg 7. 4 12±1 96 h NOEC mortali ty 0.26 4* 4,5,12, 19 ,25 PSD , 1997 According to O ECD pro toco ls. 14 Ethanol u sed as sol vent. Dimethy lformamid used as solv ent in con centratio n <0 .0 1 % . So lv ent co ntro l co nducted , but no informa tion abou t solv ent control mor tality . 15 According to EP A 7 2-2. Glass j ars w ere tig htly clo sed w ith Tefl on cups to minimi ze v olatiliza tion . 16 Measured concentr ation s r epre sented 20-120 % o f nomin al. Test re sult ba sed o n measured con ce ntra tion s. 17 Measured concentr ation s repre sented 59-280 % of nomin al. Ace tone use d a s solv ent. 18 According EEC-C.1 . T est re sult ba sed o n nominal conce ntr ation s. 19 Results are repor te d in activ e ingredie nt. According to EP A-6 60/3-75-009 (1975) . 20 According EEC-C.2 . Measured concentr ation s r epre sented 85-157 % o f nomin al after 2 hour s, 61-99 % after 48 h a nd 54-75 % after 96 h. 21 Measured concentr ation s r epre sented 85-93 % o f n ominal . Purity is no t clear ; it is al so not clear if r esul ts are repor ted in mg/L form ula tion or mg /L activ e ingr edient 22 According EEC-C.3 . Test re sult and /or some te st con cen tra tion s ab ov e solubili ty limits. 23 According to O PPTS 850 .5400 . Measured concentr ation s r epre sented 45-131 % o f nomin al after 2 hour s, 23-45 % after 48 h a nd 13-37 % after 96 h. 24 Not clear if re sul ts are ba sed on nomi nal or measured co ncen trations. According EPA 72-1. 25 Seems to be the sa me study as fr om D A R, bu t ci ta tion is n ot men tioned . According EPA 72-3. 26 Test su bstan ce add ed in acetone , ca . 1 600 mg/L. A ceto ne con centratio n too hi gh.
RIVM Letter r ep ort 601716008 Tabl e A 2. 2. A cut e t ox ici ty o f feno xy carb to m arine orga nism s. Specie s Specie s properti es A Tes t ty pe Tes t compound Purity [%] Tes t wa te r pH T [°C ] Hardness CaCO3 [mg/L ] Ex p. tim e Criterion Tes t endpoint Value [mg/L ] Ri Not es Ref erenc e M o llusca C rasso s trea vi rgini c a N S Fenoxy carb 96.3 7.8-7 .9 20 27-30 48 h LC50 mortali ty 0.15 3 7,8,10 DAR, Simon , 1 985 C rasso s trea vi rgini c a N S Fenoxy carb 96.3 7.8-7 .9 20 27-30 48 h N OEC mortali ty 0.1 3 7,8,10 DAR, Simon , 1 985 C rasso s trea vi rgini c a Y F Fenoxy carb 97.8 96 h E C50 mortali ty 0.52 2 11,12 ,13 DAR, W ard and Bo eri, 1993h C rasso s trea vi rgini c a Y F Fenoxy carb 97.8 96 h N OEC mortali ty 0.18 2 11,12 ,13 DAR, W ard and Bo eri, 1993h Crustacea M ysidopsi s bahia Y F Fenoxy carb 97.8 96 h LC50 mortali ty 0.35 2 11,12 ,13 DAR, W ard and Bo eri, 1993g M ysidopsi s bahia Y F Fenoxy carb 97.8 96 h N OEC mortali ty 0.22 2 11,12 ,13 DAR, W ard and Bo eri, 1993g Palaemonetes pugi o Y R Fenoxy carb 96.3 7.3-7 .9 22 24-25 96 h LC50 mortali ty 1.9 2 7,8,9 DAR, Simon , 1 985 Palaemonetes pugi o Y R Fenoxy carb 96.3 7.3-7 .9 22 24-25 96 h N OEC mortali ty 0.73 2 7,8,9 DAR, Simon , 1 985 Palaemonetes pugi o 1 day old larv ae Y R Fenoxy carb tg nw 25 20 96 h LC50 mortali ty 0.92 3 17,18 ,19 Key and Sco tt, 199 4 Pisces Cyprinodon variega tus Y F Fenoxy carb 97.8 7.3-7 .6 22±1 96 h LC50 mort ali ty 1.1 2 11,12 ,13,16 DAR, W ard and Bo eri, 1993e Cyprinodon variega tus Y F Fenoxy carb 97.8 7.3-7 .6 22±1 96 h N OEC mort ali ty 0.53 2 11,12 ,13,16 DAR, W ard and Bo eri, 1993e Cyprinodon variega tus 0.71 g, 34 mm Y F Fenoxy carb 7.3-7 .6 22± 1 96 h LC50 mortali ty 1.1 4* 11,12 ,13,14,1 5, 16 PSD, 1 997 Cyprinodon variega tus 0.71 g, 34 mm Y F Fenoxy carb 7.3-7 .6 22± 1 96 h N OEC mortali ty 0 .53 4* 11,12 ,13,14,1 5, 16 PSD, 1 997 Fundulus hetero c litus adult, 4 .2-5 .8 cm , 1 .99-3 .92 g N R Fenoxy carb tg nw 8.03±0 .26 23. 9±1 .4 20 96 h LC50 mortali ty 2.32 4 1,3,4,5 ,6 Lee and S cott, 19 89 Fundulus hetero c litus adult, 4 .2-5 .8 cm , 1 .99-3 .92 g N R Fenoxy carb tg nw 8.03±0 .26 23. 9±1 .4 20 96 h N OEC mortali ty 1.41 3 1,2,3,4 ,6 Lee and S cott, 19 89 M enidia menidia Y R Fenoxy carb 96.3 7.4-7 .8 21.5-22 26-28 96 h LC 50 mortali ty 0.86 2 7,8,9 DAR, Simon , 1 985 M enidia menidia Y R Fenoxy carb 96.3 7.4-7 .8 21.5-22 26-28 96 h N OE C mortali ty 0.66 2 7,8,9 DAR, Simon , 1 985 NOTES 1 Ace tone use d a s solv ent in un know n con centratio n. Solv ent co nt rol condu cted, but no informat ion abou t solv ent co ntrol morta lity . 2 NOEC cal cula ted a s the geome tric me an o f the highe st co ncen tr ation i n w hich no mortali ty w as observ ed and the subsequen t co nc en tration causi ng signi fica nt tox ici ty . 3 Test so lutio ns w ere gen tly aerated to maintain 60-100 % dissolv ed oxy gen satura tion . 4 To prev ent v olatilization the top s of th e te st v esse ls w ere sea led. 5 Differe nt v alues o f LC50 menti oned in arti cle: 2 .32 mg/l in the tex t but 2 .14 m g/l i n the tabl e. 6 Purity is no t clear ; it is al so not clear if r esul ts are repor ted in mg /L formula tion or mg /L activ e ingr edient. 7 According to APHA 1980 . 8 According to ASTM 1980 . 9 T est re sult ba sed o n measured con ce ntra tion s, calcul ate d by RMS. 10 T est re sult ba sed o n nominal conce ntr ation s. 11 According EPA 72-3. 12 Ace tone use d a s solv ent. 13 T est re sult ba sed o n m ea su re d c onc en tr at io ns . 14 Results are repor te d in activ e ingredie nt. 15 Seems to be the sa me study as fr om D A R, bu t ci ta tion is n ot men tioned . 16 Tested in seaw ater. 17 T est re sult ba sed o n nominal conce ntr ation s. 18 Ace tone use d a s solv ent in con centration o f 0 .1 %. Solv ent con trol condu cte d. Con trol surv iv al w as 57.6 % at the end o f the study . 19 Measured concentr ation s w ere 50 .8-1 16.7 % at 24 h, 54 % a fter 96 h and 12 % after 216 hour s.
report 601716008 23 2. 3. C hron ic to xic it y of feno xy car b t o freshw at er orga nism s. Specie s properti es A Tes t ty pe Tes t compound Purity [%] Tes t wa te r pH T [°C ] Hardness CaCO3 [mg/L ] Ex p. tim e Criterion Tes t endpoint Value [mg/L ] Ri Not es Ref erenc e c hneri e lla Y S W G 25 25.6 72 h NOEbC 0. 38 2 19,23 ,30,31 DAR, Mae tzle r, 199 9 c hneri e lla Y S W G 25 25.6 72 h NOErC 0. 38 2 19,23 ,30,31 DAR, Mae tzle r, 199 9 c hneri e lla Y S W G25 25.6 96 h 72h-NOEbC 0.064 2 19,23 ,30,31,3 2 DAR, Desj ardin s e t al., 2001 c hneri e lla Y S W G25 25.6 96 h 72h-NOErC 0.12 2 19,23 ,30,31,3 2 DAR, Desj ardin s e t al., 2001 s s Y S Fenoxy carb 96.6 96 h NOEC <0.8 3 19,24 ,28,29 DAR, Ellge hausen, 1983 s s S Fenoxy carb tg 96 h NOEC 0.57 3 19,24 ,30 PSD, 1 997 dubia < 24 h N R Fenoxy carb > 98 dtw 25±1 65 35 d NOEC populatio n gr ow th rate 0.000003 2 8,10 ,17 Rose e t al., 2002 dubia < 24 h N R Fenoxy carb > 98 dtw 25±1 65 35 d NOEC populatio n gr ow th rate ≥ 0 .00003 2 9,10 ,11,1 2, 17 Rose e t al., 2002 dubia < 24 h N R Fenoxy carb > 98 dtw 25±1 35 d NOEC populatio n gr ow th rate 0.000003 4* 10,13 Rose e t al., 2001 dubia < 24 h N R Fenoxy carb 96.6 dtw 7.0-7 .5 24±1 75-85 9 d IC 50 reprodu ction 0.000033 2 19,20 ,21,22 Oda e t a l., 2 005b dubia < 24 h N R Fenoxy carb 96.6 dtw 7.0-7 .5 24±1 75-85 9 d EC50 production male neonate s 0.0022 2 19,20 ,21,22 Oda e t a l., 2 005b reticu lata < 24 h N R Fenoxy carb 96.6 dtw 7.0-7 .5 24±1 75-85 14 d IC 50 reprodu ction 0.000032 2 19,20 ,21,22 Oda e t a l., 2 005b reticu lata < 24 h N R Fenoxy carb 96.6 dtw 7.0-7 .5 24±1 75-85 14 d EC50 production of male neonate s 0.0092 2 19,20 ,21,22 Oda e t a l., 2 005b < 24 h Y F Fenoxy carb 97.7 dtw 8.1-8 .7 19.2-20 .9 160-168 21 d NOEC mortali ty ≥ 0 .045 3 1,2,3,5 ,7 Hosmer e t al., 1998 4-6 day s Y F Fenoxy carb 97.7 dtw 8.1-8 .7 19.2-20 .9 160-168 21 d NOEC mortali ty ≥ 0 .045 3 1,2,3,5 ,7 Hosmer e t al., 1998 8 day s Y F Fenoxy carb 97.7 dtw 8.1-8 .7 19.2-20 .9 160-168 21 d NOEC mortali ty ≥ 0 .045 3 1,2,3,5 ,7 Hosmer e t al., 1998 11 day s Y F Fenoxy carb 97.7 dtw 8.1-8 .7 19.2-20 .9 160-168 21 d NOEC mortali ty ≥ 0.0 45 3 1,2,3,5 ,7 Hosmer e t al., 1998 < 24 h Y F Fenoxy carb 97.7 dtw 8. 1-8 .7 19.2-20 .9 160-168 21 d NOEC F0 daphnid s grow th ≥ 0 .045 3 1,2,3,5 ,7 Hosmer e t al., 1998 4-6 day s Y F Fenoxy carb 97.7 dtw 8. 1-8 .7 19.2-20 .9 160-168 21 d NOEC F0 daphnid s grow th ≥ 0 .045 3 1,2,3,5 ,7 Hosmer e t al., 1998 8 day s Y F Fenoxy carb 97.7 dtw 8.1-8 .7 19.2-20 .9 160-168 21 d NOEC F0 daphnid s grow th < 0.00 017 3 1,2,3,5 ,6 ,7 Hosmer e t al., 1998 11 day s Y F Fenoxy carb 97.7 dtw 8.1-8 .7 19.2-20 .9 160-168 21 d NOEC F0 daphnid s grow th ≥ 0 .045 3 1,2,3,5 ,7 Hosmer e t al., 1998 < 24 h Y F Fenoxy carb 97.7 dtw 8. 1-8 .7 19.2-20 .9 160-168 21 d NOEC F1 daphnid s grow th ≥ 0 .045 3 1,2,3,4 ,5 ,7 Hosmer e t al., 1998 4-6 day s Y F Fenoxy carb 97.7 dtw 8. 1-8 .7 19.2-20 .9 160-168 21 d NOEC F1 daphnid s grow th ≥ 0 .045 3 1,2,3,4 ,5 ,7 Hosmer e t al., 1998 8 day s Y F Fenoxy carb 97.7 dtw 8.1-8 .7 19.2-20 .9 160-168 21 d NOEC F1 daphnid s grow th ≥ 0 .045 3 1,2,3,4 ,5 ,7 Hosmer e t al., 1998 11 day s Y F Fenoxy carb 97.7 dtw 8.1-8 .7 19.2-20 .9 160-168 21 d NOEC F1 daphnid s grow th ≥ 0 .045 3 1,2,3,4 ,5 ,7 Hosmer e t al., 1998 < 24 h Y F Fenoxy carb 97.7 dtw 8.1-8 .7 19.2-20 .9 160-168 21 d NOEC reprodu ction 0. 0099 3 1,2,3,5 ,7 Hosmer e t al., 1998 4-6 day s Y F Fenoxy carb 97.7 dtw 8.1-8 .7 19.2-20 .9 160-168 21 d NOEC reprodu ction ≥ 0 .045 3 1,2,3,5 ,7 Hosmer e t al., 1998 8 day s Y F Fenoxy carb 97.7 dtw 8.1-8 .7 19.2-20 .9 160-168 21 d NOEC reprodu ction ≥ 0 .045 3 1,2,3,5 ,7 Hosmer e t al., 1998 11 day s Y F Fenoxy carb 97.7 dtw 8.1-8 .7 19.2-20 .9 160-168 21 d NOEC reprodu ction ≥ 0 .045 3 1,2,3,5 ,7 Hosmer e t al., 1998 < 24 h N R Fenoxy carb 96.6 dtw 7.0-7 .5 21±1 80 21 d EC50 production of male neonate s 0.00092 2 18,19 ,20,21 Oda e t a l., 2 005a < 24 h N R Fenoxy carb 96.6 dtw 7.0-7 .5 21±1 80 21 d NOEC reprodu ction <0.00013 2 18, 19 ,20 Oda e t a l., 2 005a < 24 h , EPA strain Y R Fenoxy carb 99.6 am 7.3-8 .5 21±1 250 21 d NOEC reprodu ction <0.00049 2 19,20 ,23,25 Oda e t a l., 2 007 < 24 h , Bay er strain Y R 99.6 am 7.3-8 .5 21±1 250 21 d NOEC reprodu ction <0.00034 2 19, 20 ,23,25 Oda e t a l., 2 007 < 24 h , Denmark strain Y R 99.6 am 7.3-8 .5 21±1 250 21 d NOEC reprodu ction <0.00033 2 19, 20 ,23,25 Oda e t a l., 2 007 < 24 h , EAUK strai n Y R 99.6 am 7.3-8 .5 21±1 250 21 d NO EC reprodu ction <0.00034 2 19, 20 ,23,25 Oda e t a l., 2 007
RIVM Letter r ep ort 601716008 s Specie s properti es A Tes t ty pe Tes t compound Purity [%] Tes t wa te r pH T [°C ] Hardness CaCO3 [mg/L ] Ex p. tim e Criterion Tes t endpoint Value [mg/L ] Ri Not es Ref erenc e < 24 h , AstraZene ca strain Y R 99.6 am 7.3-8 .5 21±1 250 21 d NOEC reprodu ction <0.00045 2 19,20 ,23,25 Oda e t a l., 2 007 < 24 h , Finland stra in Y R 99.6 am 7.3-8 .5 21±1 250 21 d NOEC reprodu ction <0.00028 2 19, 20 ,23,25 Oda e t a l., 2 007 < 24 h , NIES strai n Y R 99.6 am 7.3-8 .5 21±1 250 21 d NOEC reprodu ction <0.00022 2 19, 20 ,23,25 Oda e t a l., 2 007 < 24 h , EPA strain Y R 99.6 am 7.3-8 .5 21±1 250 21 d EC50 production of male neonate s 0.00045 3 19,20 ,24,25,2 7 Oda e t a l., 2 007 < 24 h , Bay er strain Y R 99.6 am 7.3-8 .5 21±1 250 21 d EC50 production of male neonate s 0.0032 2 19,20 ,24,25,2 6 Oda e t a l., 2 007 < 24 h , Denmark strain Y R 99.6 am 7. 3-8 .5 21±1 250 21 d EC50 production of male neonate s 0.0069 2 19,20 ,24,25,2 6 Oda e t a l., 2 007 < 24 h , EAUK strai n Y R 99.6 am 7.3-8 .5 21±1 250 21 d EC50 production of male neonate s 0.01 2 19,20 ,24,25,2 6 Oda e t a l., 2 007 < 24 h , AstraZene ca strain Y R 99.6 am 7.3-8 .5 21±1 250 21 d EC50 production of male neonate s 0.0074 2 19,20 ,24,25,2 6 Oda e t a l., 2 007 < 24 h , Finland stra in Y R 99.6 am 7.3-8 .5 21±1 250 21 d EC50 production of male neonate s 0.0012 3 19,20 ,24,25,2 7 Oda e t a l., 2 007 < 24 h , NIES strai n Y R 99.6 am 7.3-8. 5 21±1 250 21 d EC50 production of male neonate s 0.00057 3 19,20 ,24,25,2 7 Oda e t a l., 2 007 ≤ 24 h N F 93 21 d NOEC reprodu ction <0.0029 3 24,28 ,30,35,3 6 DAR, Forbi s, 1987 a ≤ 24 h Y F 99 21 d NOEC reprodu ct ion 0.000001 6 2 23,28 ,33 DAR, Forbi s, 1987 b ≤ 24 h Y F 99 21 d NOEC body length 0.000001 6 2 23,28 ,33 DAR, Forbi s, 1987 b ≤ 24 h Y F 99 21 d NOEC surv iv al >0.000017 2 23,28 ,33 DAR, Forbi s, 1987 b < 24 h Y F 97.7 21 d NOEC mortali ty ≥ 0 .05 2 3,24 ,28,3 3, 37 DAR, W ard et al ., 1 995 < 24 h Y F 97.7 20±1 160-180 21 d NOEC reprodu ction 0.013 2 3,24 ,28,3 3,37 DAR, W ard et al ., 1 995; PSD 1997 < 24 h Y F 97.7 21 d NOEC time to fir st br ood 0.0032 2 3,24 ,28,3 3, 37 DA R, W ard et al ., 1 995 4-6 day s Y F 97.7 21 d NOEC time to fir st br ood 0.0032 2 3,24 ,28, 33 ,37 DAR, W ard et al ., 1 995 8 day s Y F 97.7 21 d NOEC time to fir st br ood 0.0032 2 3,24 ,28, 33 ,37 DAR, W ard et al ., 1 995 11 day s Y F 97.7 21 d NOEC time to fir st br ood 0.0032 2 3,24 ,28,3 3 ,37 DAR, W ard et al ., 1 995 < 24 h Y F 21 d NOEC repr odu ction 0.013 4* 3,24 ,28,3 3,14 PSD, 1997 < 24 h N R 96.6 dtw 7.0-7 .5 24±1 75-85 6 d IC50 reprodu ction 0.0002 2 19,20 ,21,22 Oda e t a l., 2 005b < 24 h N R 96.6 dtw 7.0-7 .5 24±1 75-85 6 d EC50 production of male neonate s 0.0093 2 19,20 ,21,22 Oda e t a l., 2 005b < 24 h N R 96.6 dtw 7.0-7 .5 24±1 75-85 6 d IC50 reprodu ction 0.000015 2 19,20 ,21,22 Oda e t a l., 2 005b < 24 h N R 96.6 dtw 7.0-7 .5 24±1 75-85 6 d EC50 production of male neonate s 0.0006 2 19,20 ,21,22 Oda e t a l., 2 005b s 2-3 d old , fir st in sta r larv ae Y S 97.4 28 d EC50 emergence 0.00107 2 19,24 ,34, 38,3 9,40 D AR, P feifle, 2002 a s 2-3 d old , fir st in sta r larv ae Y S 97.4 28 d EC50 dev elopment 0.00269 2 19,24 ,34, 38,3 9,40 D AR, P feifle, 2002 a s 2-3 d old , fir st in sta r larv ae Y S 97.4 28 d NOEC emergence 0.00075 2 19,24 ,34, 38,3 9,40 D AR, P feifle, 2002 a s 2-3 d old , fir st in sta r larv ae Y S 97.4 28 d NO EC dev elopment 0.0015 2 19,24 ,34, 38,3 9,40 D AR, P feifle, 2002 a u inque fasci a tus third in star larv ae N EC produ ct 12.5 dw 28±1 unt il adul t NOEC fecu ndity 0.00001 4 16,24 Mohsen and Zay ia, 1995 ipien s m o le stu s third in star larv ae N EC produ ct 12.5 dw 28±1 until adul t NOEC fecu ndity 0.00001 4 16,24 ,15 Mohsen and Zay ia, 1995 u inque fasci a tus third in star larv ae N EC produ ct 12.5 dw 28±1 unt il adul t NOEC hatching 0.00001 4 24,16 Mohsen and Zay ia, 1995 u inque fasci a tus LOEC Larv al dev elopment 0.00050 3 41 Grenier and Grenie r, 1993 ipien s m o le stu s third in star larv ae N EC produ ct 12.5 dw 28±1 until adul t NOEC hatching 0.000005 4 16, 24,15 Mohsen and Zay ia, 1995 yn chu s m y k iss new ly fertili sed egg s Y F 93 2.5 mo NOEC body w eight/leng th <0.062 2 23,33 ,34 DAR, McAllister , 19 87
report 601716008 25 Specie s properti es A Tes t ty pe Tes t compound Purity [%] Tes t wa te r pH T [°C ] Hardness CaCO3 [mg/L ] Ex p. tim e Criterion Tes t endpoint Value [mg/L ] Ri Not es Ref erenc e chu s m y k iss new ly fertili sed ey e d egg s
(<8-hour post fer
tili sati on) Y F 94.75 7.7-8 .1 9.1-11 .8 3.2 mo NOEC body w eight/leng th 0.048 2 23,33 ,34 DAR, Thompson a nd Cohle, 1 990; PSD 1997 tone use d a s solv ent in con centration o f 0 .01 % . Su rv iv al of contr ol an d solv ent con trol daph nids tha t w ere < 24 h and 11 d at the start of th e te st w as 9 0-100%, con trol sur vi val for 4-6 d d aph nids w as 85% ( solvent con trol iv al w as 90%) and control surv iv al for 8 d daphnid s w as 8 5 % ( solv ent co ntrol su rv iv al w as 80 %) . ing the pr oce dure con tained in E PA/FIFRA Guideli ne Number 7 2-1: U.S. Env ironmental P rot ec tio n Ag ency . 1 986. Sta ndard ev aluation pro cedure : Daphnia magna li fe -cy cle (21-day renew al) chroni c tox icity te sts. EPA--141 . W ashington , DC . ter ensu rin g flow -throu gh con dition s w as mo difie d so t hat the con ce ntra tion s o f fenox yc arb in te st medi a w ere grad ual ly reduced to app rox imately 50% of ini tial co ncentra tion during the fir st 10 h and fu rth er redu ced by imately 50 % durin g ea ch successiv e 10-h peri od throughou t 21 -d te st (to mimi c the redu ctio n o f fenox yc arb that o ccurs fo llow ing fie ld a pplication to na tural w aters - h alf-li fe ≈ 10 hour s) . tion daph nids w ere colle cted and pla ced i n dil uti on w ater w ithout fe noxy carb for 10 to 12 day s. on initial me asured concentr ati ons. can t d ifferen ce fr om controls w as detected for dap hn ids ex posed to the lo w est concentra tio n; there w as no o th er indi ca tion of tox ic e ffects on grow th at hi gher con cen tra tion s. e to fir st b rood of F 0 and also F1 da phnids w as ob serv ed, but no sta tisti ca l si gnifi can t differen ces w ere show n at the highe st tested concen tra tion (0.0 45 mg/l) c omparing to con trol . posed to fenox yc arb unde r high fo od condi tio ns (15x 10 4 algae /m l). posed to fenox yc arb unde r low food condition s ( 3x 10 4 algae/ml ). first th ree b roods. four th b roo d. fifth to tenth brood s. se se t of d ata as Rose e t a l., 2002. to be the sa me study as fr om D A R, bu t ci ta tion is n ot men tioned . tali ty in co ntrol . clear if re sul ts are repo rted in mg/L fo rmulatio n or mg /L a ctiv e ingredien t. n mg /l) w as ev aluated for fecun dity : 0.0 000054 fo r fir st brood , 0.00 000 578 for se cond bro od, 0.000 00576 fo r third bro od , 0.00 00 1992 for four th bro od, 0.000 01869 fo r nint h brood , 0.000 01295 for ten th broo d at high food centratio n; 0.00 000256 for six th, 0 .00001271 for sev enth brood at low fo od concentra tion . lformamid used as solv ent in con centratio n <0 .0 1 % . No informatio n abou t solv ent con trol and its mor tali ty . to O ECD pro toco ls. ars w ere tig htly clo sed w ith Te flon cups to minimi ze v olatiliza tion . s w ere rai sed for sev eral day s and they w ere ex a m ined fo r sex differ entia tion by the l en gth and mor pholog y of the fir st antenn ae. u sed as sol vent in concentr atio n <0.1 % . No in for m ation about solv ent con trol and its mortali ty . re sult ba sed o n m ea su re d c onc en tr at io ns . re sult ba sed o n nominal conce ntr ation s. lformamid used as solv ent in co nc entratio n <0 .0 1 % . So lv ent co ntro l co nducte d, but no informa tion abou t solv ent con tr ol mortality . concentr ation s w ere >80% of n ominal. concentr ation s w ere <80% of n ominal. tone use d a s solv ent. concentr ation s r epre sented 20-120 % o f nomin al. repor te d in activ e ingredie nt. EEC-C.3 . to O PPTS 850 .5400 . to EP A 7 2-4. as solv ent. to EP A-6 60/3-75-009. to ASTM E-47 .01 . concentr ation s r epre sented 86-109 % o f nomin al. Fenox yc arb con centrati ons fe ll b elo w the limit o f d ete ction w ithin 3-7 day s. to O PPTS 850 .1790 . ater sedimen t sy stem . ons fell below the limi t of d etection . suffi cien t de tail s r eported. Ex posur e time no t r epor ted .
RIVM Letter r ep ort 601716008 2. 4. C hron ic to xic it y of feno xy car b t o m arine or gan ism s. Specie s properti es A Tes t ty pe Tes t compound Purity [%] Tes t wa te r pH T [°C ] Hardness CaCO3 [mg/L ] Ex p. tim e Criterion Tes t endpoint Value [mg/L ] Ri Not es Ref erenc e ysi s bahi a Fenoxy carb NOEC mortali ty 0.006 4 7,8 McKenney , 2005 ysi s bahi a Fenoxy carb NOEC reprodu ction ≥ 0 .043 4 7,8 McKenney , 2005 ysi s bahi a Fenoxy carb NOEC sex ratio ≥ 0 .043 4 7,8 McKenney , 2005 ysi s bahi a Fenoxy carb NOEC mortali ty ≥ 0 .043 4 7,9 McKenney , 2005 ysi s bahi a Fenoxy carb NOEC reprodu ction 0.001 4 7,9 McKenney , 2005 ysi s bahi a Fenoxy carb NOEC sex ratio < 0.00 1 4 7,9 McKenney , 2005 o Fenoxy carb NOEC embry onic dev elopment ≤ 0 .502 4 7 McKenney , 2005 o 1 day old larv ae Y R Fenoxy carb tg nw 25 20 24 d 96-h LC50 mortali ty 0.92 3 11,12 ,6 Key and Sco tt, 1994 o 1 day old larv ae Y R Fenoxy carb tg nw 25 20 24 d 9-d LC50 mortali ty 0.41 3 11,12 ,6 Key and Sco tt, 1994 o 1 day old larv ae Y R Fenoxy carb tg nw 25 20 24 d 18-d LC50 mortali ty 0.35 3 11,12 ,6 Key and Sco tt, 1994 o 1 day old larv ae Y R Fenoxy carb tg nw 25 20 24 d 24-d LC50 mortali ty 0.35 3 11,12 ,6 Key and Sco tt, 1994 o 1 day old larv ae Y R Fenoxy carb tg nw 25 20 24 d NOEC mortali ty 0.18 3 11,12 ,3,6 Key and Sco tt, 1994 o 1 day old larv ae Y R Fenoxy carb tg nw 25 20 24 d NOEC postlarv ae emerge nce <0.018 3 11,12 ,3,6 Key and Sco tt, 1994 o Fenoxy carb NOEC larv al dev elopment < 0. 01 3 13 McKenney et al., 1999 peus h a rrisii new ly released l arvae Y R Fenoxy carb nw 25 20 from ha tch of zoea e to dev elopment into me galopae NOEC zoeal morta lity 0.091 3 1, 2,4,5 Cripe e t al ., 200 3 peus h a rrisii new ly released l arvae Y R Fenoxy carb nw 25 20 from ha tch of zoea e to dev elopment into me galopae NOEC rate of dev elopment ≥ 0 .24 3 1,2,4,5 Cripe e t al ., 200 3 peus h a rrisii new ly released l arvae Y R Fenoxy carb nw 25 20 from mega lopae to first cr ab stage NOEC m egalopal mor tali ty 0.012 3 1,2,4,5 Cripe e t al ., 200 3 peus h a rrisii new ly released l arvae Y R Fenoxy carb nw 25 20 from mega lopae to first cr ab stage NOEC rate of dev elopment 0.012 3 1,2,4,5 Cripe e t al ., 200 3 peus h a rrisii new ly released l arvae Y R Fenoxy carb nw 25 20 entire larv al dev elopment NOEC larv al morta lity 0.091 3 1,2,4,5 Cripe e t al ., 200 3 peus h a rrisii new ly released l arvae Y R Fenoxy carb nw 25 20 entire larv al dev elopment NOEC rate of dev el opment 0.012 3 1,2,4,5 Cripe et al ., 200 3 peus h a rrisii new ly released l arvae N R Fenoxy carb nw 25±1 20 entire la rv al dev elopment NOEC grow th (w eight) 0.1 3 5,6,10,11 Nates and McKenney , 2000 According to me tho d de scr ibed in: Nates, S .F., M cKenney Jr ., C .L., 2000. Gr ow th, lipid class an d fa tty acid compo sition in j uv
enile mud crabs (
Rhi thropa nopeus harri sii) foll ow ing larv al e xposure to fenox yc arb, inse ct juv enile hor mone analog ue. Co mp. Bio chem . Phy siol. 127C, 317-32 5. T es t r es ul t b as ed on m ea su re d c onc en tr at io ns . Measure d co nce ntra tion s were > 80 % o f nomi nal. NOEC cal cula ted a s the geome tric me an o f the highe st co ncen tr ation i n w hich no mortali ty w as observ ed and the subsequen t co nc en tration causi ng signi fica nt tox ici ty . Surv iv al of control zoeae w as ≥ 80 % throughou t dev elopment. Surv iv al of control megalopae w as ≥ 89 % . Zoeal stage s w ere ex posed to fenoxy carb in gla ss bow ls, megalopal stage s w ere ex posed in pl asti c box es. Be cau se o f the pla sti c bo xes and the high Lo g Kow an Ri of 3 is giv en. Measured concentr ation s w ere 50 .8-1 16.7 % at 24 h, 54 % a fte r 96 h and 12 % after 216 hour s. ie w . For fir st ge nera tion. For se cond gene ration. Ace tone use d a s solv ent in con centration o f 0 .02% . Solv ent co nt rol condu cte d, b ut no info rmatio n abou t solv ent con trol morta lity . T est re sult ba sed o n nominal conce ntr ation s. Ace tone use d a s solv ent in con centration o f 0 .1 %. Solv ent con trol condu cte d. Con trol surv iv al w as 57.6 % at the end o f the study . Not suffi cien t de tail s r eported. Ex posur e time no t r epor ted.
Appendix 3. Description of mesocosm studies
Kennedy J.H. (1995). Source of the summary: DAR (European Commission, 2007)
Species/ Population/ Community
Phytoplankton, zooplankton, macroinvertebrates, crayfish, fish, macrophyte coverage and biomass, community metabolism, chlorophyll-a
Test method Outdoor microcosm study, 10-m3 outdoor fibreglass tanks
Test substance Technical grade fenoxycarb, 97.8%
Analysed Y
Exposure regime 1 x or 2 x (28 days interval) with water + soil/water slurry
T [°C] 19-29
pH 8.6-10
Exp. time 115 d
Criterion NOEC
Test endpoint population level Bosmina longirostris
Value [µg/L] 0.026
GLP Y Validity 1
Methods
Design and treatment
The study was conducted in 1993 in Texas, USA, in 24 10-m3 outdoor fibreglass tanks (1.7 m deep, 3.0 m diameter) buried into the ground. Each treatment was assigned to 3 tanks. In October 1992 each tank was lined with clay and about 15 cm of topsoil was added. The tanks were then filled with water containing algae, zooplankton, and other invertebrates. Submergent vascular plants were transplanted into each tank. Each tank was stocked with 40 bluegill sunfish. Prior to fish stocking invertebrate refugia (one/tank), which had been colonised by macro-invertebrates in an on-site pond for 4 weeks, were placed in each tank. Caged crayfish (Procambarus) were placed in each tank.
One or two treatments were made. With every treatment fenoxycarb was applied simultaneously in two phases. Eighty percent of the total mass of fenoxycarb was prepared as a solution, the remaining twenty percent was prepared in soil/water slurry. The control enclosures received only soil/water slurry. Immediately after application the tanks were stirred in an attempt to achieve an even distribution of the treatment solution. The nominal treatment rates were 0.014, 0.041, 0.123, 0.370, 1.11, 3.33 and 10.0 µg a.s./L. The microcosms treated with the lower three dose rates (0.014-0.123 µg a.s./L) received a single application (T1; May 1993), whilst those treated at the 4 highest dose rates (0.370-10.0 µg a.s./L) received a second application (T2) at the same dose, 28 days after the first application. Biotic and abiotic parameters were monitored from 6-7 days before the first treatment until 17 weeks later (September 1993).
Analysis
Samples from the water column were collected at a regular base. O2, pH, alkalinity, hardness and
turbidity were measured 5 days before the first application, and then biweekly beginning two days after the first application.
Biological parameters
The following biological parameters were measured:
Phytoplankton
The species composition and abundance of phytoplankton and chlorophyll-a content were determined 5 days before the first application, and then biweekly beginning two days after the first application.
Macrophytes
Coverage and growth of macrophytes was assessed biweekly.
The species composition and abundance of zooplankton was determined to the lowest level possible in composite water samples collected 5 days before the first application, and then biweekly beginning two days after the first application.
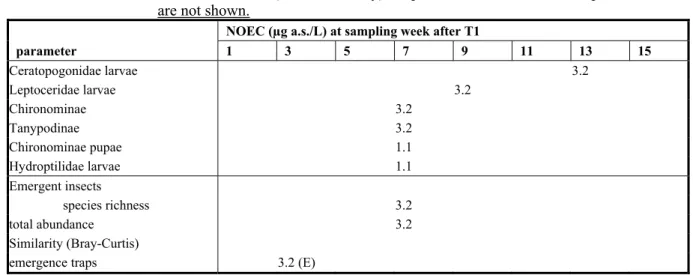
Macroinvertebrates
Non-benthic macroinvertebrates colonising artificial substrates were collected 4 days before the first application, and then biweekly beginning 4 days after the first application. Emerging adult insects were collected with floating emergence traps (one per tank), at the same time as artificial substrates.
Macroinvertebrates in all samples were identified and enumerated.
Crayfish
Carapace width and weight of each crayfish were recorded prior to introduction and biweekly until study end.
Fish
Fish mortality and abnormal behaviour were monitored daily from the time of stocking through one week after the second treatment, and fish length and weight were recorded at study end.
Data analysis
Results were based on the measured concentrations of the test substance (for justification see section Results; microcosm water). Data were log(ax+1) transformed. Univariate statistics using Dunnett's multiple t-test for differences at taxon or parameter level (p ≤ 0.05; one sided) and to calculate the NOEC. Effects on the diversity of the communities of zooplankton, artificial substrates, Ekman grab samples and emergence trap collections were analysed using the Bray-Curtis Percent Similarity (PS) index. Cluster analysis was performed on the PS values utilising the unweighted pair-group method using arithmetic averages. A non-parametrical statistical technique, utilizing a ‘bootstrap’ method, was then used to distinguish between statistically significant clusters and clusters that reflect only random variability within a community.
Procedure for evaluation
Data were evaluated and classified (classes 1-5B) according to De Jong FMW, Brock TCM, Foekema EM, Leeuwangh P.: Guidance for summarizing of higher Tier studies on aquatic organisms (to be published, 2008).
Results
Meteorological conditions
138 mm of rain falling between April 8 and September 8. No rain fell in July, and there were 12 days with a maximum air temperature of 37.8°C or higher in June through August.
Residue analysis
Application solutions
The levels of fenoxycarb in the dissolved and absorbed phase ranged between 84-114% of the
theoretical value, except for two samples, but this was probably due to sample inhomogeneity since the measured fenoxycarb levels in the tanks dosed with these two solutions were close to the expected values.
Microcosm hydrosoil
Levels were <1 µg/kg except for 2 isolated findings at the highest test dose: 1.7 µg/kg at 1 day after T1 in tank 55 and 1.3 µg/kg at 14 days after T1 in tank 63.
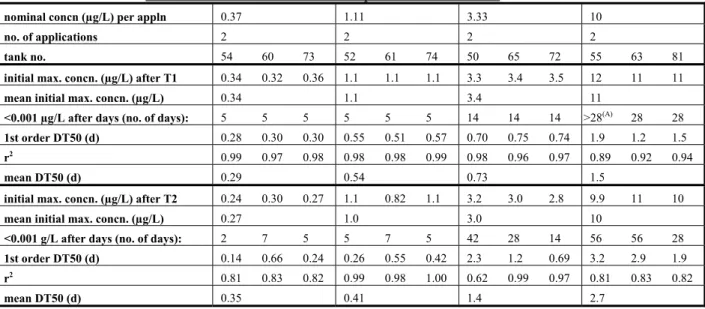
Microcosm water
A summary of the main results is shown in Tables 3-1 and 3-2 below. Residue values are not corrected for recoveries. The first order DT50 values were calculated by the author of the report by linear regression analysis on natural-log transformed concentration data versus time after treatment.