Environmental risk limits for
2,4-dichlorophenol
Report 601714007/2009
RIVM Report 601714007/2009
Environmental risk limits for 2,4-dichlorophenol
C.T.A. Moermond E.H.W. Heugens
Contact:
Caroline Moermond
Expertise Centre for Substances caroline.moermond@rivm.nl
This investigation has been performed by order and for the account of Directorate-General for Environmental Protection, Sustainable Production Directorate (DP), within the framework of the project ‘Standard setting for other relevant substances within the WFD’.
2 RIVM Report 601714007 © RIVM 2009
Parts of this publication may be reproduced, provided acknowledgement is given to the 'National Institute for Public Health and the Environment', along with the title and year of publication.
Abstract
Environmental risk limits for 2,4-dichlorophenol
The National Institute for Public Health and the Environment (RIVM) has derived Environmental Risk Limits (ERLs) for 2,4-dichlorophenol in fresh and marine surface waters. ERLs represent
environmental concentrations of a substance offering different levels of protection to man and
ecosystems. They serve as advisory values for the Dutch Steering Committee for Substances, which is appointed to set the final environmental quality standard.
Four different ERLs are distinguished in the Netherlands: a concentration at which effects are
considered negligible (NC); a concentration at which no harmful effects are to be expected (maximum permissible concentration, MPC); a maximum acceptable concentration for ecosystems specifically for short-term exposure (MACeco), and a concentration at which possible serious effects are to be expected
(serious risk concentration, SRCeco, water). Based on a preliminary screening of monitoring data, there is
no indication that any of the newly derived ERLs is exceeded.
RIVM used the methodology as required by the European Water Framework Directive for derivation and selection of the ERLs. Potential risks for humans as well as effects on the aquatic ecosystem are taken into account.
The environmental quality standards are to be set by the Steering Committee for Substances. The ERLs as presented in this report are thus preliminary values that do not have an official status.
This report is part of a series. The ERLs for 2-, 3-, and 4-chlorophenol, 4-chloro-methylphenol and aminochlorophenol and for trichlorophenols are reported separately.
Key words:
environmental risk limits, 2,4-dichlorophenol, maximum permissible concentration, maximum acceptable concentration
Rapport in het kort
Milieurisicogrenzen voor 2,4-dichloorfenol
Het RIVM heeft milieurisicogrenzen afgeleid voor 2,4-dichloorfenol in zoet en zout oppervlaktewater. Deze dienen als advieswaarden voor de Nederlandse Interdepartementale Stuurgroep Stoffen. De stuurgroep stelt de uiteindelijke milieukwaliteitsnormen vast.
Milieurisicogrenzen zijn maximale concentraties van een stof in het milieu om mens en ecosysteem op verschillende niveaus te beschermen tegen nadelige effecten. Nederland onderscheidt hierbij vier milieurisicogrenzen: een niveau waarbij het risico verwaarloosbaar wordt geacht (VR), een niveau waarbij geen schadelijke effecten zijn te verwachten (maximaal toelaatbaar risiconiveau, MTR), de maximaal aanvaardbare concentratie voor ecosystemen, specifiek voor kortdurende blootstelling (MACeco) en een niveau waarbij mogelijk ernstige effecten voor ecosystemen zijn te verwachten
(EReco). De nu afgeleide risicogrenzen lijken op basis van een eerste vergelijking met
monitoringsgegevens niet te worden overschreden.
Het RIVM heeft de afleiding en selectie van de milieurisicogrenzen uitgevoerd volgens de methodiek die is voorgeschreven door de Europese Kaderrichtlijn Water. Hierbij is zowel rekening gehouden met mogelijke risico’s voor de mens als met eventuele effecten op het ecosysteem.
Omdat de uiteindelijke milieukwaliteitsnormen worden vastgesteld door de Nederlandse Interdepartementale Stuurgroep Stoffen, zijn de milieurisicogrenzen zoals afgeleid in dit rapport voorlopige waarden zonder officiële status.
Dit rapport is onderdeel van een serie. De milieurisicogrenzen voor 2-, 3- en 4-chloorfenol, 4-chloor-3-methylfenol en aminochloorfenol en voor trichloorfenolen zijn in afzonderlijke rapporten opgenomen.
Trefwoorden:
milieurisicogrenzen, 2,4-dichloorfenol, maximaal toelaatbaar risiconiveau, maximaal aanvaardbare concentratie
Preface
The goal of this report is to derive risk limits that protect both man and the environment. This is done in accordance with the methodology of the Water Framework Directive (WFD) that is incorporated in the methodology for the project ‘International and National Environmental Quality Standards for Substances in the Netherlands’ (INS), following the Guidance for the derivation of environmental risk limits within the INS framework (Van Vlaardingen and Verbruggen, 2007).
Acknowledgements
Thanks are due to J.M.C. Appelman, M.Sc., who is contact person at the Ministry of Housing, Spatial Planning and the Environment (VROM-DP) and to Dr. M.P.M. Janssen who is program coordinator for the derivation of ERLs within the RIVM.
The results of the present report have been discussed in the scientific advisory group INS (WK INS). The members of this group are acknowledged for their contribution.
Contents
Summary 13 1 Introduction 15 1.1 Project framework 15 1.2 Selection of substances 15 2 Methods 172.1 Data collection, evaluation and selection 17
2.2 Derivation of ERLs 17
2.2.1 Drinking water 17
2.2.2 MACeco, marine 18
3 Derivation of environmental risk limits for 2,4-dichlorophenol 19 3.1 Substance identification, physico-chemical properties, fate and human toxicology 19
3.1.1 Identity 19
3.1.2 Use 19
3.1.3 Physico-chemical properties 19
3.1.4 Behaviour in the environment 20
3.1.5 Bioconcentration and biomagnification 20 3.1.6 Human toxicological treshold limits and carcinogenicity 21
3.2 Trigger values 21
3.3 Aquatic toxicity data 21
3.3.1 Toxicity data 21
3.3.2 Treatment of fresh- and saltwater toxicity data 23 3.4 Derivation of Environmental Risk Limits 24 3.4.1 Derivation of MPCwater and MPCmarine 24
3.4.2 Derivation of MACeco 25
3.4.3 Derivation of NC 25
3.4.4 Derivation of SRCeco 25
3.5 Sediment compartment 25
3.6 Comparison of derived ERLs with monitoring data 26
4 Conclusions 27
References 29
Appendix 1. Information on bioconcentration 31
Appendix 2. Detailed aquatic toxicity data 33
Appendix 3. Bird and mammal toxicity data 47
Summary
Environmental risk limits (ERLs) are derived using ecotoxicological, physico-chemical, and human toxicological data. They represent environmental concentrations of a substance offering different levels of protection to man and ecosystems. It should be noted that the ERLs are scientifically derived values. They serve as advisory values for the Dutch Steering Committee for Substances, which is appointed to set the Environmental Quality Standards (EQSs) from these ERLs. ERLs should thus be considered as preliminary values that do not have an official status.
In this report, the risk limits negligible concentration (NC), maximum permissible concentration (MPC), maximum acceptable concentration for ecosystems (MACeco), and serious risk concentration
for ecosystems (SRCeco) are derived for 2,4-dichlorophenol in water. No risk limits were derived for the
sediment compartment because the trigger value to derive such risk limits is not reached.
For the derivation of the MPC and MACeco for water, the methodology used is in accordance with the
Water Framework Directive. This methodology is based on the Technical Guidance Document on risk assessment for new and existing substances and biocides (European Commission, 2003), and is incorporated in the guidance for the project ‘International and National Environmental Quality Standards for Substances in the Netherlands’ (Van Vlaardingen and Verbruggen, 2007). An overview of the derived ERLs given in Table 1.
Based on a preliminary screening of monitoring data, there is no indication that any of the newly derived risk limits is exceeded.
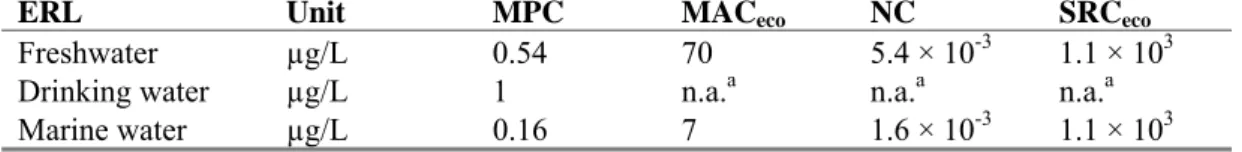
Table 1. Derived MPC, MACeco, NC, and SRCeco values for 2,4-dichlorophenol (in μg/L).
Unit MPC MACeco NC SRCeco
Freshwater µg/L 0.54 70 5.4 × 10⁻³ 1.1 × 10³ Drinking water µg/L 1 n.a.a n.a.a n.a.a Marine water µg/L 0.16 7 1.6 × 10⁻³ 1.1 × 10³
1
Introduction
1.1
Project framework
In this report, environmental risk limits (ERLs) for surface water (freshwater and marine) are derived for 2,4-dichlorophenol for the project ‘Standard setting for other relevant substances within the WFD’, which is closely related to the project INS (International and national environmental quality standards for substances in the Netherlands). The following ERLs are considered:
- negligible concentration (NC) – concentration at which effects to ecosystems are expected to be negligible and functional properties of ecosystems must be safeguarded fully. It defines a safety margin which should exclude combination toxicity. The NC is derived by dividing the MPC (see next bullet) by a factor of 100.
- maximum permissible concentration (MPC) – concentration in an environmental compartment at which:
1. no effect to be rated as negative is to be expected for ecosystems;
2a no effect to be rated as negative is to be expected for humans (for non-carcinogenic substances);
2b for humans no more than a probability of 10-6 per year of death can be calculated (for carcinogenic substances). Within the scope of the Water Framework Directive, a probability of 10-6 on a life-time basis is used.
Within the scope of the Water Framework Directive the MPC is specifically referring to long-term exposure.
- maximum acceptable concentration (MACeco) – concentration protecting aquatic ecosystems
for effects due to short-term exposure or concentration peaks.
- serious risk concentration (SRCeco) – concentration at which possibly serious ecotoxicological
effects are to be expected.
The results presented in this report have been discussed by the members of the scientific advisory group for the INS-project (WK-INS). It should be noted that the Environmental Risk Limits (ERLs) in this report are scientifically derived values, based on (eco)toxicological, fate and physico-chemical data. They serve as advisory values for the Dutch Steering Committee for Substances, which is appointed to set the Environmental Quality Standards (EQSs). ERLs should thus be considered as preliminary values that do not have any official status.
1.2
Selection of substances
ERLs are derived for 2,4-dichlorophenol (CAS number 120-83-2), which was selected by the Netherlands in the scope of the Water Framework Directive (WFD; 2000/60/EC). The derivation of environmental risk limits for monochlorophenols, trichlorophenols, aminochlorophenol and 4-chloro-3-methylphenol is reported in separate reports (Moermond and Heugens, 2009ab).
A current standard for 2,4-dichlorophenol is not available, the only standard available refers to unspecified individual dichlorophenols. Thus, a quantitative comparison with the newly derived standards is not possible.
2
Methods
The methodology for the data selection and derivation of ERLs is described in detail in Van Vlaardingen and Verbruggen (2007), further referred to as the ‘INS-Guidance’. This guidance is in accordance with the guidance of the Fraunhofer Institute (FHI; Lepper, 2005) and prepared within the context of the WFD.
The process of ERL-derivation contains the following steps: data collection, data evaluation and selection, and derivation of the ERLs on the basis of the selected data. Specific items will be discussed below.
2.1
Data collection, evaluation and selection
In accordance with the WFD, data of existing evaluations were used as a starting point. An on-line literature search was performed on TOXLINE (literature from 1985 to 2001) and Current Contents (literature from 1997 to 2007). In addition to this, all potentially relevant references in the RIVM e-tox base and EPA’s ECOTOX database were checked.
Ecotoxicity studies were screened for relevant endpoints (i.e. those endpoints that have consequences at the population level of the test species). All ecotoxicity and bioaccumulation tests were then thoroughly evaluated with respect to the validity (scientific reliability) of the study. A detailed description of the evaluation procedure is given in the INS-Guidance (see section 2.2.2 and 2.3.2).
After data collection and validation, toxicity data were combined into an aggregated data table with one effect value per species according to section 2.2.6 of the INS-Guidance. When for a species several effect data were available, the geometric mean of multiple values for the same endpoint was calculated where possible. Subsequently, when several endpoints were available for one species, the lowest of these endpoints (per species) is reported in the aggregated data table.
2.2
Derivation of ERLs
2.2.1
Drinking water
The INS-Guidance includes the MPC for surface waters intended for the abstraction of drinking water (MPCdw, water) as one of the MPCs from which the lowest value should be selected as the general
MPCwater (see INS-Guidance, section 3.1.6 and 3.1.7). According to the proposal for the daughter
directive Priority Substances, however, the derivation of the AA-EQS (= MPC) should be based on direct exposure, secondary poisoning, and human exposure due to the consumption of fish. Drinking water was not included in the proposal and is thus not guiding for the general MPCwater value. The exact
way of implementation of the MPCdw, water in the Netherlands is at present under discussion within the
framework of the ‘AMvB Kwaliteitseisen en Monitoring Water’. No policy decision has been taken yet, and the MPCdw, water is therefore presented as a separate value in this report. The MPCwater is thus
derived considering the individual MPCs based on direct exposure (MPCeco, water), secondary poisoning
18 RIVM Report 601714007 two depends on the characteristics of the compound. Although the MPCdw, water is not taken into account
for the derivation of the MPCwater, it is used for the derivation of the groundwater risk limit, MPCgw.
2.2.2
MACeco, marine
In this report, the MACeco, marine value is based on the MACeco,water value when acute toxicity data for at
least two specific marine taxa are available, using an additional assessment factor of 5 when acute toxicity data for only one specific marine taxon is available and an additional assessment factor of 10 when no acute toxicity data is available for specific marine taxa (analogous to the derivation of the MPC according to Van Vlaardingen and Verbruggen, 2007). It has to be noted that this procedure is currently not agreed upon. Therefore, the MACeco, marine value needs to be re-evaluated once an agreed
3
Derivation of environmental risk limits for
2,4-dichlorophenol
3.1
Substance identification, physico-chemical properties, fate and human
toxicology
3.1.1
Identity
Table 2. Identification of 2,4-dichlorophenol.
Chemical name 2,4-dichlorophenol CAS number 120-83-2
EC number 204-429-6
Annex I Index number 604-011-00-7 Structural formula OH
Cl
Cl Molecular formula C6H3Cl2OH
SMILES code Oc1ccc(Cl)cc1Cl
3.1.2
Use
The main use of chlorophenols in general, is as an intermediate for manufacturing pesticides, biocides, dyes and pharmaceuticals (Muller, 2008), but they have also been used as mothproofing agents, miticides, germicides, algicides, fungicides, biocides, and wood preservatives (National Pollutant Inventory, 2005). 2,4-dichlorophenol is a chemical intermediate used principally in the manufacture of the herbicide 2,4-dichlorophenoxyacetic acid (Muller, 2008).
3.1.3
Physico-chemical properties
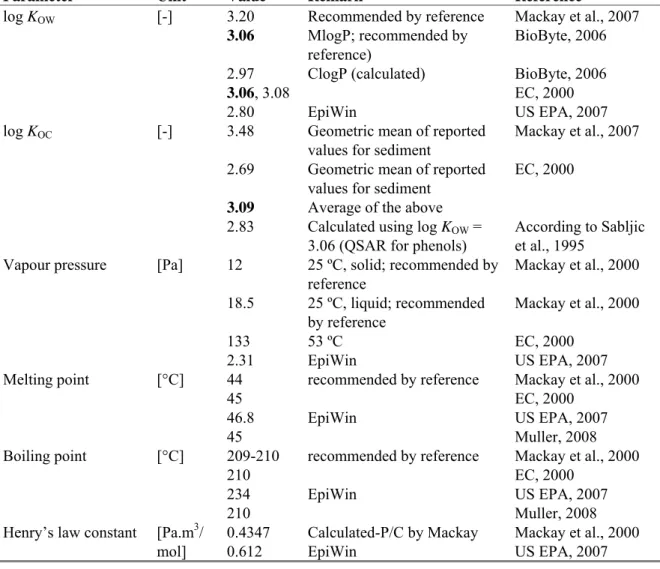
Table 3. Physico-chemical properties of 2,4-dichlorophenol. Bold values are used for ERL derivation.
Parameter Unit Value Remark Reference
Molecular weight [g/mol] 163.0 Water solubility [mg/L] 4500 4500 25 ºC; recommended by reference 20 ºC Mackay et al., 2000 EC, 2000 pKa [-] 7.68 7.85 7.85 Recommended by reference Recommended by reference 25 ºC Mackay et al., 2007 BioByte, 2006 EC, 2000
20 RIVM Report 601714007
Parameter Unit Value Remark Reference
log KOW [-] 3.20 3.06 2.97 3.06, 3.08 2.80 Recommended by reference MlogP; recommended by reference) ClogP (calculated) EpiWin Mackay et al., 2007 BioByte, 2006 BioByte, 2006 EC, 2000 US EPA, 2007 log KOC [-] 3.48 2.69 3.09 2.83
Geometric mean of reported values for sediment
Geometric mean of reported values for sediment
Average of the above Calculated using log KOW =
3.06 (QSAR for phenols)
Mackay et al., 2007 EC, 2000
According to Sabljic et al., 1995
Vapour pressure [Pa] 12 18.5 133 2.31 25 ºC, solid; recommended by reference 25 ºC, liquid; recommended by reference 53 ºC EpiWin Mackay et al., 2000 Mackay et al., 2000 EC, 2000 US EPA, 2007 Melting point [°C] 44 45 46.8 45 recommended by reference EpiWin Mackay et al., 2000 EC, 2000 US EPA, 2007 Muller, 2008 Boiling point [°C] 209-210 210 234 210 recommended by reference EpiWin Mackay et al., 2000 EC, 2000 US EPA, 2007 Muller, 2008 Henry’s law constant [Pa.m3/
mol] 0.4347 0.612 Calculated-P/C by Mackay EpiWin Mackay et al., 2000 US EPA, 2007
3.1.4
Behaviour in the environment
Table 4. Selected environmental properties of 2,4-dichlorophenol.
Parameter Unit Value Remark Reference
Hydrolysis half-life DT50 [d] No hydrolysable groups Mackay et al., 2000 Photolysis half-life DT50 0.8h -14d Mackay et al., 2000 Biodegradablity DT50 [d] 2.8-8.3
13.5-43
Aerobic lake die-away Anaerobic lake die-away
Mackay et al., 2000 Mackay et al., 2000 Relevant metabolites Unknown
Biodegradation of chlorophenols must be induced, because the antimicrobial activities of these products require that the bacteria adapt. Biodegradation is rapid when adapted bacteria are present (Muller, 2008).
3.1.5
Bioconcentration and biomagnification
Bioaccumulation data for 2,4-dichlorophenol are tabulated in Table 5. Detailed bioaccumulation data for 2,4-dichlorophenol are tabulated in Appendix 1.
Table 5. Overview of bioaccumulation data for 2,4-dichlorophenol.
Parameter Unit Value Remark Reference
BCF (fish) [L/kg] 340 Based on edible parts Kondo et al., 2005
BCF (mussel) [L/kg] 5.8 Verrengia Guerrero et al., 2007 BMF [kg/kg] 1 Default value for compounds with BCF < 2000 L/kg
3.1.6
Human toxicological treshold limits and carcinogenicity
2,4-dichlorophenol has the following R-phrases: R22, R24, R35, R51/53. Polychlorophenols in general are classified as being possibly carcinogenic to humans (group 2B) by the IARC (IARC, 1999). The TDI for 2,4-dichlorophenol of 3 μg/kgbw/day (US EPA, 1986) was considered to be valid for all mono-,
di-, tri-, and tetrachlorophenol compounds (Baars et al., 2001).
3.2
Trigger values
This section reports on the trigger values for ERLwater derivation (as demanded in WFD framework). Table 6. 2,4-dichlorophenol: collected properties for comparison to MPC triggers.
Parameter Value Unit Method/Source Derived at section
Log Kp,susp-water 2.09 [-] KOC × fOC,susp1 KOC: 3.1.3
BCF 340 [L/kg] 3.1.5
BMF 1 [kg/kg] 3.1.5
Log KOW 3.06 [-] 3.1.3
R-phrases R22, R24, R35, R51/53. [-] 3.1.6 A1 value 1 [μg/L] Mandatory for phenols
DW standard - [μg/L]
1 fOC,susp = 0.1 kgOC/kgsolid (European Commission (Joint Research Centre), 2003).
o 2,4-dichlorophenol has a log Kp, susp-water < 3; derivation of MPCsediment is not triggered.
o 2,4-dichlorophenol has a log Kp, susp-water < 3; expression of the MPCwater as MPCsusp, water is not required.
o 2,4-dichlorophenol has a BCF > 100 L/kg; assessment of secondary poisoning is triggered. o 2,4-dichlorophenol has a BCF > 100 L/kg and the R-phrases R22, R24, R35, R51/53, and is
classified as a possible carcinogenic. Therefore, an MPCwater for human health via
food (fish) consumption (MPChh food, water) has to be derived.
o For 2,4-dichlorophenol, no compound-specific A1 value or Drinking Water value standard is available from Council Directives 75/440, EEC and 98/83/EC, respectively. Therefore, the general mandatory A1 value of 1 µg/L for phenols applies.
3.3
Aquatic toxicity data
3.3.1
Toxicity data
An overview of the selected freshwater toxicity data for 2,4-dichlorophenol is given in Table 7. Marine toxicity data are given in Table 8. Detailed toxicity data for 2,4-dichlorophenol are tabulated in
22 RIVM Report 601714007 Table 7. 2,4-dichlorophenol: selected freshwater toxicity data for ERL derivation.
Chronica Acutea
Taxonomic group NOEC/EC10 (mg/L) Taxonomic group L(E)C50 (mg/L)
Bacteria 12 Bacteria 75 Bacteria 22 Bacteria 11 Bacteria 2 Bacteria 15i Algae 0.67 Bacteria 25j Algae 3.6 Bacteria 20 Algae 6.3b Cyanobacteria 2.0 Protozoa 1.5c Algae 9.2 Crustacea 0.39d Algae 8.2k Pisces 0.12e Algae 3.6 Pisces 1.5f Algae 12 Pisces 0.016g Protozoa 8.7l Pisces 3.3 Fungi 43 Pisces 0.29h Fungi 17 Crustacea 3.6 Crustacea 1.6 Crustacea 1.9m Pisces 7.8 Pisces 4.3n Pisces 2 Pisces 4.7 Pisces 1.8 Pisces 2.6 Pisces 3.4o Pisces 6.8p Pisces 3.4q Pisces 1.7 Pisces 2.3 Amphibia 17
a For detailed information see Appendix 2. Bold values are used for ERL-derivation. b Preferred endpoint (growth) for Scenedesmus subspicatus.
c Geometric mean of 1.5 and 1.6 mg/L, parameter growth inhibition of Uronema parduczi.
d Most sensitive endpoint, geometric mean of 0.79, 0.78, 0.74, and 0.052 mg/L, parameter reproduction for
Daphnia magna.
e Most sensitive endpoint (larval mortality) and most sensitive exposure duration (8 d), geometric mean of
0.14 and 0.10 mg/L for Carassius auratus.
f Most sensitive endpoint (larval mortality) and most sensitive exposure duration (8.5 d), geometric mean of
1.57 and 1.48 mg/L for Ictalurus punctatus.
g Most sensitive endpoint (larval mortality) and most sensitive exposure duration (27 d), geometric mean of
0.020 and 0.017 mg/L for Oncorhynchus mykiss.
h Most sensitive endpoint, parameter survival for Pimephales promelas.
i Most sensitive pH (< 6), geometric mean of 19.6, 12.1, and 15.9 mg/L, parameter bioluminescence for
Escherichia coli.
j Geometric mean of 27.7, 38.3, and 14.7 mg/L, parameter bioluminescence for Pseudomonas fluorescens. k Geometric mean of 14 and 4.8 mg/L; most relevant exposure duration, preferred endpoint, parameter
l Most sensitive endpoint, parameter population growth, geomean of 14.9, 14.1, 4.28, 4.47, 11.2, 4.93, 8.05,
17.1, 6.41, 9.37, 14.4, 6.13, 6.06, 14.3, and 9.21 mg/L for Tetrahymena pyriformis.
m Most relevant and sensitive exposure duration (48 h), geometric mean of 2.6, 1.4, 2.61, 5.1, 2.85, 2.85,
3.68, and 2.2 mg/L, parameter immobility/mortality for Daphnia magna.
n Geometric mean of 3.9 and 4.75 mg/L, parameter mortality for Danio rerio. o Most relevant exposure duration (96 h), parameter mortality for Oryzias latipes.
p Geometric mean of 6.5, 6.5, 3.82, 11.6, and 7.75 mg/L, parameter mortality for P. promelas.
q Most sensitive pH (6), geometric mean of 3.25 and 3.48 mg/L, parameter mortality for Poecilia reticulata.
Table 8. 2,4-dichlorophenol: selected marine toxicity data for ERL derivation.
Chronic a Acute a
Taxonomic group NOEC/EC10 (mg/L) Taxonomic group L(E)C50 (mg/L)
Algae 4.7b Bacteria 4.8e Algae 0.18c Algae 12f Algae 0.42d Algae 8.8 Algae 1.6 Algae 0.70g Algae 1.5h Algae 5.2 Crustacea 0.70i Crustacea 16 Crustacea 2.2j
a For detailed information see Appendix 2. Bold values are used for ERL-derivation. b Most sensitive endpoint, parameter photosynthesis for Dunaliella bioculata. c Most sensitive endpoint, parameter growth for Phaeodactylum tricornutum.
d Most sensitive endpoint, geometric mean of 0.93 and 0.19 mg/L, parameter photosynthesis for
Skeletonema costatum.
e Most relevant exposure duration (15-30 min.), geometric mean of 4.06, 5.52, 12.72, 1.55, 1.78, 3.00, 5.92,
21.02, 3.55, and 5.78 mg/L, parameter bioluminescence for Vibrio fisheri.
f Most sensitive endpoint, parameter photosynthesis for Dunaliella bioculata. g Most sensitive endpoint, parameter growth for Phaeodactylum tricornutum.
h Most sensitive endpoint, geometric mean of 1.71 and 1.36 mg/L, parameter photosynthesis for
Skeletonema costatum.
i Most sensitive life-stage (12 mm), parameter mortality for Allorchestes compressa. j Most sensitive life-stage (molting), parameter mortality for Palaemonetes pugio.
3.3.2
Treatment of fresh- and saltwater toxicity data
Following Lepper (2005), freshwater and marine datasets can be combined if it can not be shown that marine species are more sensitive than freshwater species. Thus, freshwater and marine datasets for 2,4-dichlorophenol are combined.
24 RIVM Report 601714007
3.4
Derivation of Environmental Risk Limits
3.4.1
Derivation of MPCwater and MPCmarine
3.4.1.1 MPCeco, water and MPCeco, marine
Acute toxicity data are available for eight taxonomic groups, amongst which algae, crustacea (Daphnia) and fish. Thus, the base set is complete. Chronic toxicity data are available for algae, crustacea and fish. The lowest NOEC for MPC derivation is 0.016 mg/L for the fish Oncorhynchus mykiss. For the freshwater environment, an assessment factor of 10 can be used on the lowest NOEC, which results in an MPCeco, water of 0.016 / 10 = 1.6 × 10⁻³ mg/L = 1.6 µg/L.
No chronic toxicity data are available for specific marine taxa. With an assessment factor of 100 the MPCeco, marine becomes 0.016 / 100 = 1.6 × 10⁻⁴ mg/L = 0.16 µg/L.
3.4.1.2 MPCsp, water and MPCsp, marine
2,4-dichlorophenol has a BCF > 100 L/kg, thus assessment of secondary poisoning is triggered. The lowest MPCoral is 2.8 mg/kg (see Table 9). Subsequently, the MPCsp, water can be calculated using a BCF
of 340 L/kg and a BMF of 1 kg/kg (section 3.1.5) and becomes 2.8 / (340 × 1) = 0.0083 mg/L = 8.3 µg/L.
For the marine environment, an extra biomagnification factor should be used. But since this factor is 1 by default for compounds with log KOW < 4.5, the MPCsp, marine equals the MPCsp, water and is also
8.3 µg/L.
Table 9. 2,4-dichlorophenol: selected mammal data for ERL derivation. Speciesa Exposure time Criterion Effect
concentration (mg/kg diet) Assessment factor MPCoral (mg/kg diet)
Rat 90 days NOAEL 15000b 90 167
Rat 90 days NOAEL 12000c 90 133
Rat 2 years NOAEL 2100d 30 70
Rat 2 years NOAEL 1200e 30 40
Rat 1 generation NOAEL 85f 30 2.8
a For detailed information see Appendix 3. b based on a NOAEL of 1500 mg/kg
bw/day with a conversion factor of 10. c based on a NOAEL of 1200 mg/kg
bw/day with a conversion factor of 10. d based on a NOAEL of 210 mg/kg
bw/day with a conversion factor of 10. e based on a NOAEL of 120 mg/kg
bw/day with a conversion factor of 10.
f based on a NOAEL of 30 mg/L (drinking water), which corresponds to 2-15 (average 8.5) mg/kg bw/day,
3.4.1.3 MPChh food, water and MPChh food, marine
Derivation of MPC hh food, water for 2,4-dichlorophenol is triggered (Table 6). With an ADI of
0.003 mg/kgbw/d for 2,4-dichlorophenol, a BCF of 340 L/kg and a BMF of 1 kg/kg (section 3.1.5), the
MPChh food becomes (0.1 × 0.003 × 70) / 0.115 = 0.183 mg/kg. Subsequently, the MPChh food, water and
MPChh food, marine become 0.183 / (340 × 1) = 0.00054 mg/L = 0.54 µg/L.
3.4.1.4 MPCdw, water
The MPCdw, water is 1 µg/L according to the general A1 value for phenols.
3.4.1.5 Selection of the MPCwater and MPCmarine
For the freshwater environment, the lowest MPC value is the value for human consumption of fishery products of 0.54 µg/L. Thus, the overall MPCwater is 0.54 µg/L.
For the marine environment, the lowest MPC value is the value for ecotoxicity of 0.16 µg/L. Thus, the overall MPCmarine is 0.16 µg/L.
3.4.2
Derivation of MAC
ecoThe base set is complete. LC50s are available for a large number of taxa. However, because the insects are missing, the requirements to perform an SSD are not met. For informative reasons, an SSD was calculated, which resulted in a HC5 of 0.9 mg/L.
The lowest LC50 is 0.7 mg/L for the alga Phaeodactylum tricornutum. Given the following arguments: - the bioconcentration factor is higher than 100 but for algae bioconcentration plays no role; - the mode of action (narcosis) is non-specific;
- the variation is not too high in view of the large number of data;
an assessment factor of 10 is used and the MACeco, water becomes 0.7 / 10 = 0.07 mg/L = 70 µg/L.
For the marine environment, no additional specific marine taxa are present and thus an additional assessment factor of 10 is used. The MACeco, marine then becomes 7 µg/L.
3.4.3
Derivation of NC
The NC is derived by dividing the final MPC by a factor of 100. NCwater = 5.4 × 10⁻³ µg/L.
NCmarine = 1.6 × 10⁻³ µg/L.
3.4.4
Derivation of SRCeco
The geometric mean of all chronic data is 1.13 mg/L. These data are normally distributed (significant at all levels using the Anderson-Darling test for normality). Because more than three NOECs are
available, no comparison has to be made with the geometric mean of the acute data. Thus, the SRCeco, water and SRCeco, marine are set at 1.13 mg/L = 1130 µg/L.
3.5
Sediment compartment
The log Kp, susp-water of 2,4-dichlorophenol is below the trigger value of 3, therefore, ERLs are not
26 RIVM Report 601714007
3.6
Comparison of derived ERLs with monitoring data
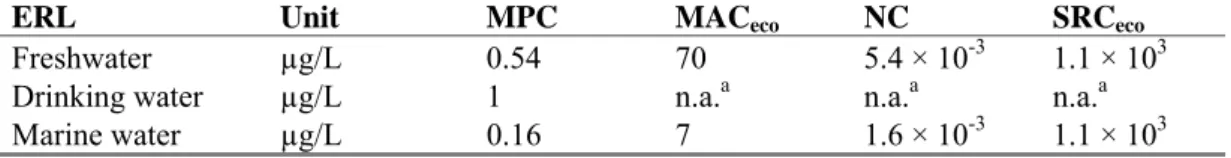
An overview of the derived ERLs is given in Table 10.Table 10. Derived MPC, NC, MACeco, and SRCeco values for 2,4-dichlorophenol (in μg/L).
ERL Unit MPC MACeco NC SRCeco
Freshwater µg/L 0.54 70 5.4 × 10⁻³ 1.1 × 10³
Drinking water µg/L 1 n.a.a n.a.a n.a.a
Marine water µg/L 0.16 7 1.6 × 10⁻³ 1.1 × 10³
a n.a. = not applicable.
Monitoring data for the river Rhine from the years 2001-2006 were obtained from RIWA (Association of River Waterworks). These data show that at all sampling occasions and locations, the concentration of 2,4-dichlorophenol in water was below detection limits (0.02 µg/L), except for one time in 2001 near Enschede where 0.25 µg/L was measured. This value should be compared with MACeco, water, and is
4
Conclusions
In this report, the risk limits negligible concentration (NC), maximum permissible concentration (MPC), maximum acceptable concentration for ecosystems (MACeco), and serious risk concentration
for ecosystems (SRCeco) are derived for 2,4-dichlorophenol in water. No risk limits were derived for the
sediment compartment because the trigger value to derive such risk limits is not reached. The ERLs that were obtained are summarised in the table below.
Table 11. Derived MPC, MACeco, NC, and SRCeco values (in μg/L) for 2,4-dichlorophenol.
ERL Unit MPC MACeco NC SRCeco
Freshwater µg/L 0.54 70 5.4 × 10⁻³ 1.1 × 10³ Drinking water µg/L 1 n.a.a n.a.a n.a.a Marine water µg/L 0.16 7 1.6 × 10⁻³ 1.1 × 10³
References
Baars AJ, Theelen RMC, Janssen PJCM, Hesse JM, van Apeldoorn ME, Meijerink MCM, Verdam L, Zeilmaker MJ. 2001. Re-evaluation of human-toxicological maximum permissible risk levels. Bilthoven, the Netherlands: National Institute for Public Health and the Environment (RIVM). Report no. 711701025.
BioByte. 2006. BioLoom [computer program]. version 1.0 (ClogP 4.0). Claremont, CA, USA: BioByte Corporation.
European Commission (European Chemical Bureau). 2000. IUCLID (International Uniform Chemical Information Database) on CD-ROM. European Chemicals Bureau, Ispra, Italy.
European Commission (Joint Research Centre). 2003. Technical Guidance Document in support of Commission Directive 93/67/EEC on Risk Assessment for new notified substances, Commission Regulation (EC) No 1488/94 on Risk Assessment for existing substances and Directive 98/9/EC of the European Parliament and of the Council concerning the placing of biocidal products on the market. Part II. Ispra, Italy: European Chemicals Bureau, Institute for Health and Consumer Protection. Report no. EUR 20418 EN/2.
IARC. 1999. Monographs on the Evaluation of Carcinogenic Risks to Humans. Volume 71. Re-Evaluation of Some Organic Chemicals, Hydrazine and Hydrogen Peroxide. International Agency for Research on Cancer, Lyon, France.
Kondo T, Yamamoto H, Tatarazako N, Kawabe K, Koshio M, Hirai NMM. 2005. Bioconcentration factor of relatively low concentrations of chlorophenols in Japanese medaka. Chemosphere 61: 1299-1304.
Lepper P. 2005. Manual on the Methodological Framework to Derive Environmental Quality Standards for Priority Substances in accordance with Article 16 of the Water Framework Directive
(2000/60/EC). 15 September 2005 (unveröffentlicht) ed. Schmallenberg, Germany: Fraunhofer-Institute Molecular Biology and Applied Ecology.
Mackay D, Shiu WY, Ma KC. 2000. Physical-chemical properties and environmental fate. Handbook. Chapman and Hall/ CRCnetBase.
Moermond CTA, Heugens EHW. 2009a. Environmental risk limits for trichlorophenols. Bilthoven, the Netherlands: National Institute for Public Health and the Environment (RIVM). Report no. 601714005.
Moermond CTA, Heugens EHW. 2009b. Environmental risk limits for monochlorophenols, 4-chloro-3-methyl-phenol and aminochlorophenol. Bilthoven, the Netherlands: National Institute for Public Health and the Environment (RIVM). Report no. 601714006.
Muller F. 2008. Chlorophenols. In: Ullmann’s Encyclopedia of Industrial Chemistry. John Wiley & Sons, Inc. (http://mrw.interscience.wiley.com/emrw/3527-306730/home/; feb 08).
National Pollutant Inventory. 2005. Department of the environment, water, heritage and the arts, Australia. (http://www.npi.gov.au/database/substance-info/profiles/90.html#common; feb 08). Sabljic A, Güsten H, Verhaar H, Hermens J. 1995. QSAR modelling of soil sorption. Improvements
and systematics of log Koc versus log Kow correlations. Chemosphere 31: 4489-4514.
US EPA.1986. Health Effects Assessment for Selected Chlorinated Phenols. Prepared by the Office of Health and Environmental Assessment, Environmental Criteria and Assessment Office, Cincinnati, OH for the Office of Emergency and Remedial Response, Washington, DC.
US EPA. 2007. EPI Suite™ [computer program]. version 3.2. Washington, DC, U.S.A.: U.S. Environmental Protection Agency (EPA) Office of Pollution Prevention Toxics and Syracuse Research Company (SRC).
30 RIVM Report 601714007 Van Vlaardingen PLA, Verbruggen EMJ. 2007. Guidance for the derivation of environmental risk
limits within the framework of the project ‘International and National Environmental Quality Standards for Substances in the Netherlands’ (INS). Bilthoven, the Netherlands: National Institute for Public Health and the Environment (RIVM). Report no. 601782001.
Verrengia Guerrero NR, Taylor MG, Simkiss KK. 2007. Modelling 2,4-dichlorophenol bioavailability and bioaccumulation by the freshwater fingernail clam Sphaerium corneum using artificial particles and humic acids. Environ Pollut 145: 238-244.
Appendix 1. Information on bioconcentration
Table A1.1 Bioconcentration data for 2,4-dichlorophenol.Species Species
properties Substancepurity Analysed Test type Test water pH Hardness CaCO3
[mg /L]
Temp. [ºC]
Exposure
time Exposure conc. [mg/L] BCF [L/kg] BCF type Calculation method Ri a Notes Reason Ri Reference Annelida
Nephelopsis obscura field collected,
0.826 ± 0.214g deriv GC-ECD R rw 7 60 4 7 d 0.01 282 whole body ww Cbiota/Cw 2 1 1 Hall and Jacob, 1988
Nephelopsis obscura field collected,
0.669 ± 0.160g deriv GC-ECD R rw 7 60 12 7 d 0.01 424 whole body ww Cbiota/Cw 2 1 1 Hall and Jacob, 1988
Nephelopsis obscura field collected,
0.845 ± 0.271g deriv GC-ECD R rw 7 60 22 7 d 0.01 980 whole body ww Cbiota/Cw 3 1 2 Hall and Jacob, 1988
Percymoorensis marmorata or Nephelopsis obscura
field collected,
1.35±0.37 g deriv GC-ECD R rw 7 60 22 24 h 0.01 40 whole body ww Cbiota/Cw 3 1 3 Hall and Jacob, 1988
Percymoorensis marmorata or Nephelopsis obscura
field collected,
1.35±0.37 g deriv GC-ECD R rw 7 60 22 24 h 0.02 40 whole body ww Cbiota/Cw 3 1 3 Hall and Jacob, 1988
Percymoorensis marmorata or Nephelopsis obscura
field collected,
1.35±0.37 g deriv GC-ECD R rw 7 60 22 24 h 0.03 54 whole body ww Cbiota/Cw 3 1 3 Hall and Jacob, 1988
Percymoorensis marmorata or Nephelopsis obscura
field collected,
0.079±0.006 g deriv GC-ECD R rw 5 60 4 24 h 0.01 73 whole body ww Cbiota/Cw 3 1 3 Hall and Jacob, 1988
Percymoorensis marmorata or Nephelopsis obscura
field collected,
0.079±0.006 g deriv GC-ECD R rw 7.5 60 4 24 h 0.01 88 whole body ww Cbiota/Cw 3 1 3 Hall and Jacob, 1988
Percymoorensis marmorata or Nephelopsis obscura
field collected,
0.079±0.006 g deriv GC-ECD R rw 9.2 60 4 24 h 0.01 42 whole body ww Cbiota/Cw 3 1 3 Hall and Jacob, 1988
Mollusca
Mytilus edulis obtained from
fish market ag GC-MS R nw (sea) 15 7 d 0.1 59.6 Soft body ww tissue (equilibrium) Cbiota/Cw or kinetic 2 4 Jennings et al, 1996
Sphaerium corneum 0.5±0.1 cm >98 LSC S dtw 8.5 64 h 0.00815 5.8 whole body
ww
Cbiota/Cw 3 2 5 Verrengia Guerrero et al., 2007
Pisces
Carassius auratus 2.2 g 100 deriv GC/ECD
(not in water) S tw 6 20-21 5 h 0.5 40 whole body Cbiota/Cw 3 6 Kishino Kobayashi, 1995 and
Carassius auratus 2.2 g 100 deriv GC/ECD
(not in water) S tw 8 20-21 5 h 0.5 33 whole body Cbiota/Cw 3 6 Kishino Kobayashi, 1995 and
Carassius auratus 2.2 g 100 deriv GC/ECD
(not in water) S tw 10 20-21 5 h 0.5 2.4 whole body Cbiota/Cw 3 6 Kishino Kobayashi, 1995 and
Carassius auratus 2 g colorimetric R 20 12- 24 h 8 34 whole body Cbiota/Cw 3 6 Kobayashi et al.,
1979
Carassius auratus 25 h 7.8 34 4 3 7 EC, 2000
Cyprinus carpio 25 25 d 0.03 7.1 -
69 2 3 8 EC, 2000
32
RIVM Report 601714007
Species Species
properties Substancepurity Analysed Test type Test water pH Hardness CaCO3
[mg /L]
Temp. [ºC]
Exposure
time Exposure conc. [mg/L] BCF [L/kg] BCF type Calculation method Ri a Notes Reason Ri Reference
(edible parts) 4.3±2.2% lipid HPLC-UV (water) ww
Oryzias latipes eggs to 60.4-102.8 mg
(edible parts) 4.3±2.2% lipid>98 deriv GC-MS (fish) HPLC-UV (water) CF 7.5±0.5 24±1 60 d 0.00284 150 edible ww parts Cbiota/Cw 2 4 Kondo et al., 2005
Oryzias latipes eggs to 60.4-102.8 mg
(edible parts) 4.3±2.2% lipid>98 deriv GC-MS (fish) HPLC-UV (water) CF
7.5±0.5 24±1 60 d 0.00892 130 edible parts
ww Cbiota/Cw 2 4 Kondo et al., 2005
Oryzias latipes eggs to 60.4-102.8 mg
(edible parts) 4.3±2.2% lipid>98 deriv GC-MS (fish) HPLC-UV (water) CF
7.5±0.5 24±1 60 d 0.0273 92 edible parts
ww Cbiota/Cw 2 4 Kondo et al., 2005
Pimephales promelas 9-11 mo; 0.68±0.31 g;
4.4±2.5% lipid >99 HPLC-UV S am 6.2 18.0-18.4 0.8 - 1.1 h 34.9 7.9 LBB Cbiota/Cw 3 5 9 Van Wezel et al., 1995
Pimephales promelas 9-11 mo; 0.68±0.31 g;
4.4±2.5% lipid >99 HPLC-UV S am 8.4 18.0-18.4 1.3 - 2.5 h 22.5 13 LBB Cbiota/Cw 3 5 9 Van Wezel et al., 1995
Salmo trutta 4.5 g 97 GC-ECD S 5 24 h 1.7 10 LBB Cbiota/Cw 3 10 Hattula et al., 1981
Trachurus novaezelandiae caught in Sidney Harbour ag GC-MS R nw
(sea) 21 7 d 0.1 107.7 muscles ww (equilibrium) Cbiota/Cw or kinetic 2 6 4 Jennings et al, 1996
fish 32 whole body Cbiota/Cw 4 7 Lu et al., 2000
Notes:
1 Analyses indicated that there was no significant volatilization or photodegradation of the chlorophenols after a 24h exposure period 2 BCF calculated using reported concentration in biota (290 pmol/g) and water (50 nmol/L)
3 Original source: Rhone-Poulenc Chimie Courbevoie Cedex, 1979 4 DMSO used as dispersant at concentrations below 0.01%
5 Measured concentrations during exposure remained within 5% of initial water concentrations 6 no bioconcentration detected in the liver
7 Review article; specific references per compound not specified Explanation Ri:
1 3 leaches per timepoint; steady state was reached within 5 days
2 3 leaches per timepoint; steady state wasnot reached during the experiment 3 only 1 leech used per experiment. May have been pre-exposed but probably not 4 steady state was reached after 40 hours
5 steady state was not reached at all
6 Exposure duration is short, equilbrium might not be fully reached; aquaeous concentration presumably not measured 7 Probably the same as Kobayashi, 1979; very little information on test procedures
8 According to OECD 305C 9 Lethal body burdens
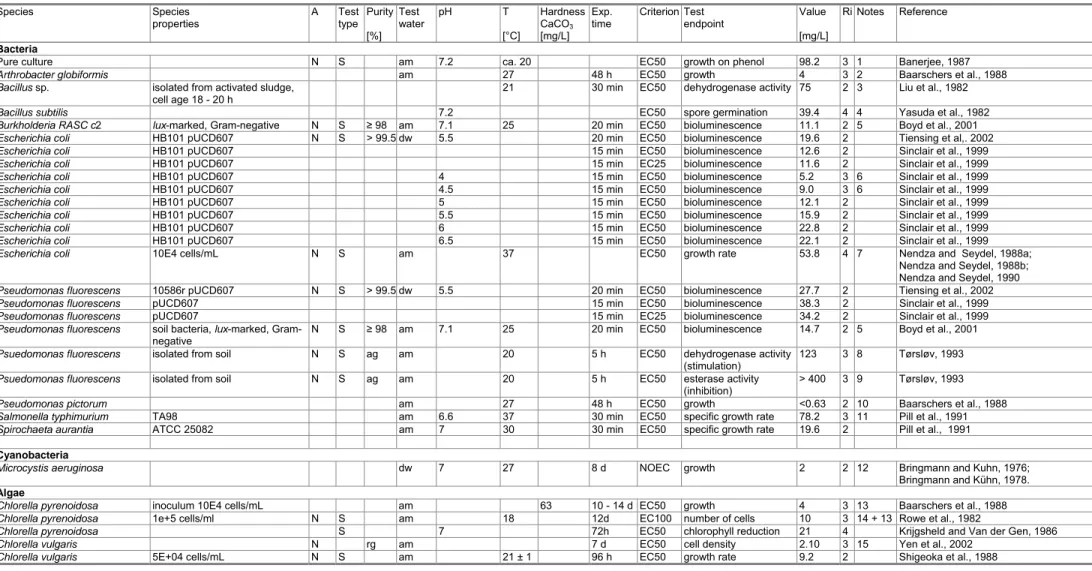
Appendix 2. Detailed aquatic toxicity data
Table A2.1 Acute toxicity of 2,4-dichlorophenol to freshwater organisms.Species Species properties A Test type Purity [%] Test water pH T [°C] Hardness CaCO3 [mg/L] Exp. time Criterion Test endpoint Value [mg/L] Ri Notes Reference Bacteria
Pure culture N S am 7.2 ca. 20 EC50 growth on phenol 98.2 3 1 Banerjee, 1987
Arthrobacter globiformis am 27 48 h EC50 growth 4 3 2 Baarschers et al., 1988
Bacillus sp. isolated from activated sludge,
cell age 18 - 20 h
21 30 min EC50 dehydrogenase activity 75 2 3 Liu et al., 1982
Bacillus subtilis 7.2 EC50 spore germination 39.4 4 4 Yasuda et al., 1982
Burkholderia RASC c2 lux-marked, Gram-negative N S ≥ 98 am 7.1 25 20 min EC50 bioluminescence 11.1 2 5 Boyd et al., 2001
Escherichia coli HB101 pUCD607 N S > 99.5 dw 5.5 20 min EC50 bioluminescence 19.6 2 Tiensing et al,. 2002
Escherichia coli HB101 pUCD607 15 min EC50 bioluminescence 12.6 2 Sinclair et al., 1999
Escherichia coli HB101 pUCD607 15 min EC25 bioluminescence 11.6 2 Sinclair et al., 1999
Escherichia coli HB101 pUCD607 4 15 min EC50 bioluminescence 5.2 3 6 Sinclair et al., 1999
Escherichia coli HB101 pUCD607 4.5 15 min EC50 bioluminescence 9.0 3 6 Sinclair et al., 1999
Escherichia coli HB101 pUCD607 5 15 min EC50 bioluminescence 12.1 2 Sinclair et al., 1999
Escherichia coli HB101 pUCD607 5.5 15 min EC50 bioluminescence 15.9 2 Sinclair et al., 1999
Escherichia coli HB101 pUCD607 6 15 min EC50 bioluminescence 22.8 2 Sinclair et al., 1999
Escherichia coli HB101 pUCD607 6.5 15 min EC50 bioluminescence 22.1 2 Sinclair et al., 1999
Escherichia coli 10E4 cells/mL N S am 37 EC50 growth rate 53.8 4 7 Nendza and Seydel, 1988a;
Nendza and Seydel, 1988b; Nendza and Seydel, 1990
Pseudomonas fluorescens 10586r pUCD607 N S > 99.5 dw 5.5 20 min EC50 bioluminescence 27.7 2 Tiensing et al., 2002
Pseudomonas fluorescens pUCD607 15 min EC50 bioluminescence 38.3 2 Sinclair et al., 1999
Pseudomonas fluorescens pUCD607 15 min EC25 bioluminescence 34.2 2 Sinclair et al., 1999
Pseudomonas fluorescens soil bacteria, lux-marked,
Gram-negative N S ≥ 98 am 7.1 25 20 min EC50 bioluminescence 14.7 2 5 Boyd et al., 2001
Psuedomonas fluorescens isolated from soil N S ag am 20 5 h EC50 dehydrogenase activity
(stimulation) 123 3 8 Tørsløv, 1993
Psuedomonas fluorescens isolated from soil N S ag am 20 5 h EC50 esterase activity
(inhibition) > 400 3 9 Tørsløv, 1993
Pseudomonas pictorum am 27 48 h EC50 growth <0.63 2 10 Baarschers et al., 1988
Salmonella typhimurium TA98 am 6.6 37 30 min EC50 specific growth rate 78.2 3 11 Pill et al., 1991
Spirochaeta aurantia ATCC 25082 am 7 30 30 min EC50 specific growth rate 19.6 2 Pill et al., 1991
Cyanobacteria
Microcystis aeruginosa dw 7 27 8 d NOEC growth 2 2 12 Bringmann and Kuhn, 1976;
Bringmann and Kühn, 1978.
Algae
34 RIVM Report 601714007 Species Species properties A Test type Purity [%] Test water pH T [°C] Hardness CaCO3 [mg/L] Exp. time Criterion Test endpoint Value [mg/L] Ri Notes Reference
Chlorella vulgaris inoculum 10E4 cells/mL am 63 10 - 14 d EC50 growth 9 3 13 Baarschers et al., 1988
Pseudokirchneriella subcapitata 5E+04 cells/mL N S am 21 ± 1 96 h EC50 growth rate 14 2 Shigeoka et al., 1988
Pseudokirchneriella subcapitata 72 h EC50 growth rate 4.8 2 15a CITI data
Pseudokirchneriella subcapitata 1E+06 cells/mL (exposure) and
2E+04 cells/mL (recovery) N am 7 (initial pH) 24 ± 2 96 h EC50 cell recovery (cell density) 112 2 16 Hickey et al., 1991
Pseudokirchneriella subcapitata N am 96 h EC50 cell density 34.3 /
101.6 4 17 Hickey et al., 1991
Scenedesmus quadricauda N S dw 7 27 55 8 d NOEC growth 3.6 2 18 Bringmann and Kühn, 1978
Scenedesmus subspicatus N S am 8.0 - 9.3 24 ± 1 48 h EC50 biomass (AUC) 11.5 2 Kühn and Pattard, 1990
Scenedesmus subspicatus N S am 8.0 - 9.3 24 ± 1 48 h EC50 growth rate 57 3 19 Kühn and Pattard, 1990
Protozoa
Tetrahymena pyriformis strain GL-C N S > 95 am 7.35 27 ± 1 75 40 h EC50 population growth
(cell density) 14.9 2 20 + 21 Schultz, 1997 Schultz, 1999
Tetrahymena pyriformis 48 h EC50 population growth
(density) 15 4* 20 Schultz, 1987
Tetrahymena pyriformis S 60 h EC50 population growth
(density) 15 4* 20 Schultz and Riggin, 1985 Schultz et al., 1986
Tetrahymena pyriformis strain GL, 2500 cells/mL from exponentially growing culture
N S am 7.35 28 46 h EC50 generation time 10.3 2 Larsen, 1996
Tetrahymena pyriformis strain GL, 2500 cells/mL from
exponentially growing culture N S am 7.35 28 46 h EC50 generation time 5.1 2 Larsen, 1996
Tetrahymena pyriformis strain GL, 2500 cells/mL from
exponentially growing culture N S am 7.35 28 46 h EC50 population density 14.1 2 Larsen, 1996
Tetrahymena pyriformis strain GL, 2500 cells/mL from
exponentially growing culture N S am 7.35 28 46 h EC50 population density 4.28 2 Larsen, 1996
Tetrahymena pyriformis strain GL, 2500 cells/mL from
exponentially growing culture N S am 7.35 28 46 h EC50 generation time 6.64 2 Larsen, 1996
Tetrahymena pyriformis strain GL, 2500 cells/mL from
exponentially growing culture N S am 7.35 28 46 h EC50 generation time 9.23 2 Larsen, 1996
Tetrahymena pyriformis strain GL, 2500 cells/mL from
exponentially growing culture N S am 7.35 28 46 h EC50 generation time 6.7 2 Larsen, 1996
Tetrahymena pyriformis strain GL, 2500 cells/mL from
exponentially growing culture N S am 7.35 28 46 h EC50 population density 4.47 2 Larsen, 1996
Tetrahymena pyriformis strain GL, 2500 cells/mL from
exponentially growing culture N S am 7.35 28 46 h EC50 population density 11.2 2 Larsen, 1996
Tetrahymena pyriformis strain GL, 2500 cells/mL from
exponentially growing culture N S am 7.35 28 46 h EC50 population density 4.93 2 Larsen, 1996
Tetrahymena pyriformis strain GL, 1000 cells/mL from
exponentially growing culture N S am 7.35 28 46 h EC50 generation time 8.4 2 Larsen, 1996
Tetrahymena pyriformis strain GL, 1000 cells/mL from
exponentially growing culture N S am 7.35 28 46 h EC50 generation time 10.8 2 Larsen, 1996
Tetrahymena pyriformis strain GL, 1000 cells/mL from
exponentially growing culture N S am 7.35 28 46 h EC50 population density 8.05 2 Larsen, 1996
Tetrahymena pyriformis strain GL, 1000 cells/mL from
exponentially growing culture N S am 7.35 28 46 h EC50 population density 17.1 2 Larsen, 1996
Tetrahymena pyriformis strain GL, 1000 cells/mL from
Species Species properties A Test type Purity [%] Test water pH T [°C] Hardness CaCO3 [mg/L] Exp. time Criterion Test endpoint Value [mg/L] Ri Notes Reference
Tetrahymena pyriformis strain GL, 1000 cells/mL from
exponentially growing culture N S am 7.35 28 46 h EC50 generation time 7.67 2 Larsen, 1996
Tetrahymena pyriformis strain GL, 1000 cells/mL from
exponentially growing culture N S am 7.35 28 46 h EC50 generation time 11.7 2 Larsen, 1996
Tetrahymena pyriformis strain GL, 1000 cells/mL from
exponentially growing culture N S am 7.35 28 46 h EC50 generation time 7.19 2 Larsen, 1996
Tetrahymena pyriformis strain GL, 1000 cells/mL from
exponentially growing culture N S am 7.35 28 46 h EC50 generation time 9.69 2 Larsen, 1996
Tetrahymena pyriformis strain GL, 1000 cells/mL from
exponentially growing culture N S am 7.35 28 46 h EC50 generation time 16.8 2 Larsen, 1996
Tetrahymena pyriformis strain GL, 1000 cells/mL from
exponentially growing culture N S am 7.35 28 46 h EC50 generation time 21.4 2 Larsen, 1996
Tetrahymena pyriformis strain GL, 1000 cells/mL from
exponentially growing culture N S am 7.35 28 46 h EC50 population density 6.41 2 Larsen, 1996
Tetrahymena pyriformis strain GL, 1000 cells/mL from exponentially growing culture
N S am 7.35 28 46 h EC50 population density 9.37 2 Larsen, 1996
Tetrahymena pyriformis strain GL, 1000 cells/mL from
exponentially growing culture N S am 7.35 28 46 h EC50 population density 14.4 2 Larsen, 1996
Tetrahymena pyriformis strain GL, 1000 cells/mL from
exponentially growing culture N S am 7.35 28 46 h EC50 population density 6.13 2 Larsen, 1996
Tetrahymena pyriformis strain GL, 1000 cells/mL from
exponentially growing culture N S am 7.35 28 46 h EC50 population density 6.06 2 Larsen, 1996
Tetrahymena pyriformis strain GL, 1000 cells/mL from
exponentially growing culture N S am 7.35 28 46 h EC50 population density 14.3 2 Larsen, 1996
Tetrahymena pyriformis strain GL, 1000 cells/mL from
exponentially growing culture N S am 7.35 28 46 h EC50 population density 9.21 2 Larsen, 1996
Macrophyta
Lemna minor N S 5.1 25 ± 1 48 h LC50 mortality (chlorosis) 56 3 22 Blackman et al., 1955
Lemna gibba Y S 27.8 10 d EC50 vegetative frond
reproduction
1.50 3 23 Ensley et al., 1994
Fungi
Pichia fermentative strain from
dinitrification stage of STP N S am 7 22 ± 2 12 h EC50 growth (turbidity) 42.5 2 24 Kwasniewska and Kaiser, 1983
Rhodotorula rubra oxidative strain from shore of
Lake Ontario N S am 7 22 ± 2 12 h EC50 growth (turbidity) 16.5 2 24 Kwasniewska and Kaiser, 1983
Saccharomyces cerevisiae N ag am 3.2 28 16 - 18 h EC20 fermentation 12.1 3 25 Weber et al., 2000
Cnidaria
Hydra vulgaris adult N R am 7 92 h LOEC tulip stage 10.00 2 26 Mayura et al., 1991
Mollusca
Fossaria cubensis 24 h EC100 10 4 European Commission
(European Chemical Bureau), 2000
Pseudosuccinea columella 24 h EC100 10 4 European Commission
(European Chemical Bureau), 2000
36 RIVM Report 601714007 Species Species properties A Test type Purity [%] Test water pH T [°C] Hardness CaCO3 [mg/L] Exp. time Criterion Test endpoint Value [mg/L] Ri Notes Reference
Daphnia 24 h EC50 7 4 IRCHA. 1981.
In: Bazin et al., 1987
Daphnia magna < 24 h old S am 24 h LC50 mortality 9.91 2 27 + 28 LeBlanc et al., 1988
Daphnia magna < 24 h old N S ≥ 80 rw 7.4 - 9.4 22 ± 1 173 ± 13 48 h LC50 mortality 2.6 2 27 LeBlanc, 1980
Daphnia magna < 24 h old N S ≥ 80 rw 7.4 - 9.4 22 ± 1 173 ± 13 48 h NOEC mortality 0.46 2 27 LeBlanc, 1980
Daphnia magna 8.25 - 8.35 24 h EC50 immobility 6.67 2 29 Trapido et al., 1997
Daphnia magna N Sc ag nw 24 h EC50 immobility 6 2 Bazin et al., 1987
Daphnia magna 6 - 24 h old N S am 8.0 ± 0.2 20 240 48 h EC50 immobility 1.4 2 30 Kühn et al., 1989
Daphnia magna 12 ± 12 h old S nw 18 ± 1 48 h LC50 mortality 2.61 2 Kopperman et al., 1974
Daphnia magna 48 h LC50 mortality 5.1 2 Kuiper and Hanstveit, 1984
Daphnia magna ≤ 24 h old S am 8.0 ± 0.2 20 or
25 ± 1 250 24 h EC50 immobility 3.9 2 Bringmann and Kühn, 1982; Kühn et al., 1989a
Daphnia magna Y 99.4 rw 4.7 20 ± 2 250 ± 25 24 h EC50 immobility 4.1 3 31 Tissot et al., 1985
Daphnia magna < 24 h old N S > 98 20 ± 1 48 h EC50 immobility 2.85 2 32 Steinberg et al., 1992
Daphnia magna < 24 h old N S > 98 20 ± 1 48 h EC50 immobility 3.12 3 33 Steinberg et al., 1992
Daphnia magna < 24 h old N S > 98 20 ± 1 48 h EC50 immobility 2.84 2 32 Steinberg et al., 1992
Daphnia magna < 24 h old N S > 98 20 ± 1 48 h EC50 immobility 2 3 34 Steinberg et al., 1992
Daphnia magna 6 - 24 h old N S > 95 am 22 ± 1 24 h EC50 immobility 3.25 2 Zhao et al., 1995
Daphnia magna < 72 h old N S > 95 rw 7.8 - 8.2 20 ± 1 200 24 h EC50 immobility 2.68 2 35 Devillers and Chambon, 1986a;
Devillers and Chambon, 1986b Devillers et al., 1987
Daphnia magna 48 h EC50 immobility 2.6 4 36 BASF AG. 1986.
In: Gesellschaft Deutscher Chemiker, 1989
Daphnia magna ≤ 24 h old, wild strain dtw 7.6 - 7.7 20 - 22 285 24 h EC50 immobility 11 2 Bringmann and Kühn, 1977
Daphnia magna 20-24h old 24h EC100 mortality 3 4 37 Klein, 2000
Daphnia magna 2-6h old 24h EC10 mortality <3 4 37 Klein, 2000
Daphnia magna <24h N S rw 8 25 150 48 h LC50 mortality 3.68 2 Kim et al., 2006
Daphnia magna 48 h EC50 immobility 2.2 2 OECD
202 CITI data
Orconectes propinquus S 7 d LC100 mortality 5 4 38 Telford, 1974
In: Krijgsheld and van der Gen, 1986
Orconectes immunis S 7 d LC100 mortality 5 4 38 Telford, 1974
In: Krijgsheld and van der Gen, 1986
Cambarus robustus S 7 d LC100 mortality 5 4 38 Telford, 1974
In: Krijgsheld and van der Gen, 1986
Pisces
Carassius auratus 1.0 ± 0.1 g S ± 100 tw 7.0 ± 0.1 27 - 28 5 h LC50 mortality 7.8 3 39 + 40 Kishino and Kobayashi, 1996
Carassius auratus 1.0 ± 0.1 g N S ± 100 tw 7.0 ± 0.1 27 - 28 2.5 h LC50 mortality 8.00 3 39 Kishino and Kobayashi, 1996
Carassius auratus 2.2 ± 0.2 g ± 100 tw 6 20 - 21 5 h LC50 mortality 5 - 7 3 39 Kishino and Kobayashi, 1995
Carassius auratus 2.2 ± 0.2 g ± 100 tw 8 20 - 21 5 h LC50 mortality 7 - 10 3 39 + 40 Kishino and Kobayashi, 1995
Carassius auratus 2.2 ± 0.2 g ± 100 tw 10 20 - 21 5 h LC50 mortality > 100 3 39 + 40 Kishino and Kobayashi, 1995
Carassius auratus 2 g R 20 24 h LC50 mortality 7.8 2 Kobayashi et al., 1979
Carassius auratus fingerlings < 10.2 cm 7 12.8 300 24 h NOEC mortality ≥ 5 3 41 Wood, 1953
Carassius auratus fingerlings < 10.2 cm 7 12.8 300 24 h NOEC mortality 5 3 41 Hollis and Lennon, 1954
Danio rerio S 7.5 ± 0.3 96 h LC50 mortality 3.9 2 Wellens, 1982
Danio rerio 160 - 185 mg N > 95 am 22 ± 1 24 h LC50 mortality 4.75 2 Devillers and Chambon, 1986
Species Species properties A Test type Purity [%] Test water pH T [°C] Hardness CaCO3 [mg/L] Exp. time Criterion Test endpoint Value [mg/L] Ri Notes Reference
Lepomis macrochirus fingerlings < 10.2 cm 7 12.8 300 24 h NOEC mortality ≥ 5 3 41 Wood, 1953
Lepomis macrochirus fingerlings < 10.2 cm 7 12.8 300 22 h LOEC mortality 5 3 41 Hollis and Lennon, 1954
Lepomis macrochirus fingerlings, ca. 10 cm N S nw 7.5 - 8.2 13 12 h LOEC mortality/obvious
distress 5 3 41 + 43 Applegate et al., 1957
Lepomis macrochirus fingerlings, ca. 10 cm N S nw 7.5 - 8.2 13 24 h NOEC mortality/obvious
distress ≥ 5 3 41 + 43 Applegate et al., 1957
Leuciscus idus melanotus 1.5 ± 0.3 g, 5 - 7 cm S 7 - 8 20 ± 1 267 ± 53 48 h LC50 mortality 5 2 Juhnke and Lüdemann, 1978
Leuciscus idus melanotus S 7-8 20 267 48 h LC50 mortality 4.5 2 43a Rübelt et al., 1982
Notropis cornutus larvae, 0.75 - 3.5 mg dw;
fertilisation occurred in the field Y R 99 dtw 20 133 7 d EC50 growth (dw) 1.820 2 44 Borgmann and Ralph, 1986
Oncorhynchus ishawytscha 7.2 - 7.6 0 - 1 h LOEC mortality 5 4 45 MacPhee and Ruelle, 1969
in: Lipnick et al. 1985.
Oncorhynchus kisutch 7.2 - 7.6 0 - 1 h LOEC mortality 10 4 45 MacPhee and Ruelle, 1969
in: Lipnick et al. 1985.
Oncorhynchus mykiss 4.6 - 6.4 cm, 1.2 - 3.8 g Y CF rg tw 7.60 - 8.19 14.1 -
16.5 96 h LC50 mortality 2.61 2 46 Hodson et al., 1984
Oncorhynchus mykiss fingerlings, ca. 10 cm N S nw 7.5 - 8.2 13 3 h LOEC mortality/obvious
distress 5 3 41 + 43 Applegate et al., 1957
Oncorhynchus mykiss fingerlings, ca. 10 cm N S nw 7.5 - 8.2 13 6 h LOEC mortality/obvious
distress 5 3 41 + 43 Applegate et al., 1957
Oryzias latipes S 25 ± 2 48 h LC50 mortality 8.4 2 CITI data
Oryzias latipes 96 h LC50 mortality 3.4 2 OECD
203
CITI data
Petromyzon marinus larvae, 7.6 - 13 cm, collected
from the field N S nw 7.5 - 8.2 13 12 h LOEC mortality/obvious distress 5 3 41 + 43 Applegate et al., 1957
Petromyzon marinus larvae, 7.6 - 13 cm, collected
from the field N S nw 7.5 - 8.2 13 24 h NOEC mortality/obvious distress ≥ 5 3 41 + 43 Applegate et al., 1957
Pimephales promelas 30 - 35 d old Y F nw ca. 7.5 25 ± 2 43.3 -
48.5 96 h LC50 mortality 8.3 2 47 Phipps et al., 1981
Pimephales promelas 30 - 35 d old Y F nw ca. 7.5 25 ± 2 43.3 -
48.5 96 h LC50 mortality 8.2 2 48 Phipps et al., 1981
Pimephales promelas 30 - 35 d old Y F nw ca. 7.5 25 ± 2 43.3 -
48.5 192 h LC50 mortality 6.5 2 47 Phipps et al., 1981
Pimephales promelas 30 - 35 d old Y F nw ca. 7.5 25 ± 2 43.3 -
48.5 192 h LC50 mortality 6.5 2 48 Phipps et al., 1981
Pimephales promelas 30 - 35 d old Y S nw ca. 7.5 21.6 -
25.4 43.3 - 48.5 48 h LC50 mortality 8.4 2 49 Phipps et al., 1981
Pimephales promelas larvae Y R 99.9 nw 7.0 - 8.1 24.0 -
26.0 73 - 79 7 d MATC mortality 3.48 1 50 Mayes et al., 1988
Pimephales promelas larvae Y R 99.9 nw 7.0 - 8.1 24.0 -
26.0 73 - 79 7 d LC50 mortality 3.82 1 51 Mayes et al., 1988
Pimephales promelas larvae Y R 99.9 nw 7.0 - 8.1 24.0 -
26.0
73 - 79 7 d EC50 weight > 4.85 1 50 Mayes et al., 1988
Pimephales promelas larvae Y R 99.9 nw 7.0 - 8.1 24.0 -
38 RIVM Report 601714007 Species Species properties A Test type Purity [%] Test water pH T [°C] Hardness CaCO3 [mg/L] Exp. time Criterion Test endpoint Value [mg/L] Ri Notes Reference
Pimephales promelas 31 d old, 0.11 g Y F nw 7.57 - 9.08 25 ± 1 46.2 24 h LC50 mortality 1.1 3 53 Holcombe et al., 1980
Pimephales promelas 26 - 34 d old (juveniles),
laboratory-cultured Y CF > 95 nw 7.8 25 45 96 h LC50 mortality 7.75 4* 54 Veith and Broderius, 1987; Broderius et al., 1995
Pimephales promelas 26 - 34 d old (juveniles),
laboratory-cultured Y CF > 95 nw 7.8 25 45 96 h LC50 mortality 11.6 2 54 Broderius et al., 1995
Pimephales promelas 30 d, 0.029 g Y F nw/dtw 7.38 25.4 45.2 96 h LC50 mortality 7.75 1 Geiger et al., 1985
Poecilia reticulata 2 - 3 mo R am or
rw 6.1 22 ± 1 25 7 or 14 d LC50 mortality 3.25 2 55 Könemann and Musch, 1981
Poecilia reticulata 2 - 3 mo R am or
rw 7.3 22 ± 1 25 7 or 14 d LC50 mortality 4.19 2 55 Könemann and Musch, 1981
Poecilia reticulata 2 - 3 mo R am or
rw 7.7 - 7.9 22 ± 1 25 7 or 14 d LC50 mortality 5.92 2 55 Könemann and Musch, 1981
Poecilia reticulata 40 - 60 mg Y R dtw 7 25-27 96 h LC50 mortality 5.5 2 56 Salkinoja-Salonen et al., 1981
Poecilia reticulata 40 - 60 mg R 6 26 ± 1 96 h LC50 mortality 3.48 2 Saarikoski and Viluksela, 1982
Poecilia reticulata 40 - 60 mg R 7 26 ± 1 96 h LC50 mortality 5.52 4* Saarikoski and Viluksela, 1982
Poecilia reticulata 40 - 60 mg R 8 26 ± 1 96 h LC50 mortality 7.62 2 Saarikoski and Viluksela, 1982
Poecilia reticulata 2 - 3 mo old males rg tw 7.7 ± 0.1 24 h LC50 mortality 2.93 4 57 Benoit-Guyod et al., 1984
Ptychochelilus oregonensis 7.2 - 7.6 0 - 1 h LOEC “sublethal effects” 10 4 45 MacPhee and Ruelle, 1969
in: Lipnick et al., 1985.
Ptychochelilus oregonensis 7.2 - 7.6 1 - 3 h LOEC mortality 10 4 45 MacPhee and Ruelle, 1969
in: Lipnicket al., 1985.
Salmo trutta average 4.5 g ≥ 97 ca. 5 24 h LC50 mortality 1.7 2 Hattula et al., 1981.
Tilapia zilli 2 - 6 cm N R rg 6.6 25 ± 1 215 LC50 mortality 2.30 2 58 Yen et al., 2002
Salmo trutta fingerlings < 10.2 cm 7 12.8 300 5 h LOEC mortality 5 3 41 Wood, 1953
Salvelinus fontinalis fingerlings < 10.2 cm 7 12.8 300 7 h LOEC mortality 5 3 41 Hollis and Lennon, 1954
Amphibia
Rana japonica tadpoles from eggs collected in
the field, 2.5 ± 0.1 cm, 0.09 ± 0.01 g
R ag nw 22-25 24 h LC50 mortality 16.5 2 59 Wang et al., 2000
Notes:
1 Species unknown; exposure during exponential growth phase; endpoint not relevant; grown in medium with phenol as pure carbon source; growth is not supported by chlorophenols 2 Soil bacteria
3 Species is relevant to the aquatic compartment 4 Mean of three determinations; test duration not clear
5 Test result is average of three replicates; soil bacteria which also occurs in water 6 irrelevant pH
7 original reference unclear; test duration not reported
8 No clear dose-response curve. Significance of stimulation for population is unclear.
9 Stimulation at concentrations where growth was depressed or stopped; inhibition only at high concentrations. No clear dose-response relationship 10 EC50 is below the concentration range used.
11 Mutant, which is more sensitive to toxicants than natural strain.
12 Significant effect defined as ≥ 3% effect. Testing conditions described in other Bringmann and Kuhn articles 13 Test duration too long.
14 In accordance with US EPA method.
15 Test duration > 96 h and unclear if cells are still in exponential growth phase. 15a OECD 201