RIVM Letter report 2017-0097 M. J. Mangen et al.
Disease burden of food-related pathogens
in the Netherlands, 2016
RIVM Letter report 2017-0097 M. J. Mangen et al.
Colophon
© RIVM 2017
Parts of this publication may be reproduced, provided acknowledgement is given to: National Institute for Public Health and the Environment, along with the title and year of publication.
DOI 10.21945/RIVM-2017-0097
M. J. Mangen (auteur),RIVM I. H.M. Friesema (auteur),RIVM J. A. Haagsma (auteur),RIVM W. van Pelt (auteur),RIVM Contact:
Marie-Josee Mangen CIb
marie-josee.mangen@rivm.nl
This investigation has been performed by order and for the account of Ministerie van VWS, within the framework of Programma 5
This is a publication of:
National Institute for Public Health and the Environment
P.O. Box 1 | 3720 BA Bilthoven The Netherlands
Synopsis
Disease burden of food-related pathogens in the Netherlands, 2016
The Ministry of VWS has requested RIVM to present an annual update on the number of illnesses, disease burden and cost-of-illness caused by 14 enteric pathogens. These pathogens can be transmitted by food, the environment, animals and humans. The disease burden is expressed in DALYs (Disability Adjusted Life Years), a metric integrating morbidity and mortality into one unit. Furthermore, the cost-of-illness (COI) related to the 14 food-related pathogens was estimated and expressed in euros. The COI estimate includes healthcare costs, the costs for the patient and / or his family, such as travel expenses, as well as costs in other sectors, for example due to productivity losses. The total disease burden caused by the 14 pathogens decreased slightly from around 12,190 DALYs in 2015 to 12,020 DALYs in 2016. The share of foodborne transmission in this estimated burden was comparable to earlier years, mounting to 4,708 DALYs in 2016. The total COI caused by the 14 pathogens decreased slightly from 435 €M in 2015 to 430 €M in 2016. The food-related COI was with 171 M€ in 2016, which is slightly lower than in 2015 (i.e. 172 €M). The differences in DALYs and COI between 2015 and 2016 are largely due to fluctuations in the type of infections that occur, the burden of disease they cause and the varying costs per infection.
The research presented in this report results in more insight in the true incidence of foodborne diseases and the associated disease burden and costs-of-illness and enables researchers and policy-makers to monitor trends in time for these 14 pathogens.
Keywords: food-related disease, disease burden, DALY, cost-of-illness, costs, trend
Publiekssamenvatting
Ziektelast van via voedsel overdraagbare ziekteverwekkers in Nederland in 2016
Het RIVM onderzoekt jaarlijks hoeveel mensen ziek worden van 14 ziekteverwekkers die via voedsel in het menselijk lichaam terechtkomen (darmpathogenen). Deze voedsel-gerelateerde ziektelast wordt
uitgedrukt in DALY’s (Disability Adjusted Life Year), een internationaal gehanteerde maat voor het aantal gezonde levensjaren dat verloren gaat aan ziekte of vroegtijdig? overlijden. Het aantal DALY’s als gevolg van de 14 ziekteverwekkers is in 2016 geschat op 4.708, en is daarmee iets hoger dan in 2015 (4.642 DALY’s).
Daarnaast wordt geschat welke kosten hieraan verbonden zijn (cost-of-illness). Deze omvatten directe medische kosten, maar ook de kosten voor de patiënt en/of zijn familie, zoals reiskosten, als ook de kosten binnen andere sectoren, bijvoorbeeld door werkverzuim. De kosten die verbonden zijn aan de 14 ziekteverwekkers die mensen via voedsel opliepen bedroegen 171 miljoen euro. Dit is evenveel als de kosten in 2015 (172 miljoen euro).
De onderzochte ziekteverwekkers kunnen niet alleen via voedsel aan de mens worden overgedragen (circa 40 procent), maar ook via het milieu (bijvoorbeeld via oppervlaktewater), dieren, en van mens op mens. Het verschilt per ziekteverwekker hoe groot het aandeel in de
blootstellingsroute is. De totale ziektelast van alle ‘routes’ is geschat op 12.020 DALY’s, en is daarmee iets lager dan in 2015 (12.190 DALY’s). De totale kosten zijn geschat op 430 miljoen euro en waren daarmee iets lager dan in 2015 (435 miljoen). De verschillen in DALY’s en kosten zijn grotendeels een gevolg van schommelingen in het aantal infecties dat de 14 ziekteverwekkers veroorzaakten, net als de daaruit volgende ziektelast en kosten.
Het ministerie van VWS is de opdrachtgever van dit onderzoek. De resultaten bieden handvatten om meer zicht te krijgen op het
daadwerkelijker aantal voedselinfecties dat mensen jaarlijks oplopen, de bijbehorende ziektelast en de blootstellingsroutes.
Kernwoorden: voedsel-gerelateerde ziekte, ziektelast, DALY, kosten, trend
Contents
1 Introduction — 9 2 Methods — 11 2.1 Trend information — 11 2.2 Disease burden — 12 2.3 Cost of illness — 13 3 Results — 15 3.1 Trend information — 15 3.2 Disease incidence — 183.3 Disease burden by pathogen — 19 3.4 Cost-of-illness by pathogen — 22 3.5 Attribution — 25
3.6 Model update effect — 28 3.6.1 Updated incidences — 28
3.6.2 New disability weights and new life tables — 28 3.6.3 New reference prices — 29
4 Discussion — 31
5 References — 33
6 Annex I: Adapted model parameters — 35
1
Introduction
Since 2008, RIVM regularly publishes estimates of the incidence, disease burden and costs-of-illnesses of food-related disease on its web pages1
and since 2010 in publicly available reports (e.g. [1-6]).
The health impact of food-related disease is expressed in Disability Adjusted Life Years (DALY) and cost-of-illness (COI). The methodology that is used to estimate the DALYs is described in detail in a
peer-reviewed paper [7]. The COI is expressed in euros for all 14 food-related pathogens was calculated for the first time in 2011 [8]. The economic module was subsequently integrated to the existing disease burden model, and annual updates of both, disease burden and COI have followed [1-6].
In the current report, trend information from surveillance, demographic information and consumer price index (a measure for changes in price levels of consumer goods and services) were used to update the information to the year 2016. And in contrast to previous estimates [1-8], we used available RIVM laboratory surveillance for Hepatitis-E virus and Cryptosporidum spp., no negative trend correction for Giardia spp., newly available European disability weights by Haagsma et al. [9] and recent life tables, when updating DALY and COI estimates for the year 2012 until 2016 and presented in the current report.
2
Methods
2.1 Trend information
Data on the size and age distribution of the Dutch population, as well as mortality risks and the number of live births and stillbirths were
obtained from Statistics Netherlands2.
Table 1. Population in the Netherlands by age group, 2012-2016
Age group 2016 2015 2014 2013 2012 0 170,341 174,681 170,953 175,587 179,653 1-4 706,513 713,641 726,716 736,615 739,083 5-11 1,313,978 1,324,894 1,338,448 1,354,657 1,378,914 12-17 1,225,749 1,215,977 1,206,685 1,196,634 1,189,120 18-64 10,477,231 10,463,848 10,467,463 10,491,7378 10,527,210 65+ 3,085,308 3,007,685 2,919,024 2,824,345 2,716,368 Total 16,979,120 16,900,726 16,829,289 16,779,575 16,730,348 Table 2. Live births by age of mothers in the Netherlands, 2012-2016
Age of mother 2016* 2015 2014 2013 2012 -19 1,104 1,109 1,276 1,360 1,592 20-24 13,363 13,125 14,213 14,581 15,206 25-29 49,266 48,724 50,307 49,342 50,371 30-34 66,303 66,373 68,120 65,925 67,489 35-39 33,237 34,070 33,797 32,939 33,725 40-44 6,740 6,733 7,046 6,836 7,212 45+ 397 376 422 358 364 Total 170,410 170,510 175,181 171,341 175,959 * Estimates based on observed trend from 2011-2015
Trend information on the incidence of gastro-enteritis (GE) by pathogen in the general population and consulting the general practitioner was obtained from the following sources:
• Thermophilic Campylobacter spp.: RIVM laboratory surveillance; • Non-typhoidal Salmonella spp.: RIVM laboratory surveillance; • Shiga-toxin producing Escherichia coli O157 (STEC O157):
mandatory notification and active laboratory surveillance; • Norovirus: estimated norovirus-associated hospitalized cases
derived from RIVM laboratory surveillance; • Rotavirus: RIVM laboratory surveillance;
• Hepatitis-A virus and perinatal and acquired listeriosis: mandatory notification and active laboratory surveillance;
• Hepatitis-E virus: RIVM laboratory surveillance data; Note this is different with earlier reports [1-8] where a stable incidence based on Borgen et al.[10] was assumed.
• Cryptosporidium spp.: RIVM laboratory surveillance data since 2013. Note this is different with earlier reports [1-8] where a stable incidence was assumed since 2003.
• Giardia spp.: a stable incidence was assumed since 2007 (i.e. the last year of RIVM laboratory surveillance data for Giardia spp.).
Note this is different with earlier reports [1-8] where a continuing decrease with the rate of -1.03% per year observed between 2001 and 2007 was assumed.
• No trend information was available for the GE toxin-producing bacteria (Bacillus cereus, Clostridium perfringens and
Stapylococcus aureus), and toxoplasmosis. For the latter, trends in reported fatalities are included.
Trends in hospitalizations for gastro-enteritis as primary case (ICD codes 20-93; 558.9) were obtained from the National Medical Register up until 2010 and from the Dutch Hospital Data (DHD) for 2011-2014. Since 2015 the number of hospitalized patients are indirectly estimated from the observed time series of RIVM laboratory surveillance data (i.e. primarily tested faeces) of rotavirus, norovirus, campylobacteriosis and salmonellosis.
Excess mortality risks from campylobacteriosis and salmonellosis were assumed constant across the years. Fatalities due to listeriosis and STEC O157 were obtained from active surveillance. Age-specific case fatality ratios for norovirus and rotavirus, originally obtained from German surveillance data, and for protozoan pathogens, originally obtained from the international literature, were assumed constant throughout the years (changes in years of life lost therefore reflect changes in incidence on which mortality is based).
2.2 Disease burden
The disease burden estimates were updated by using more recent life expectancy tables from the Global burden of disease (GBD) 2010 study[11] and newly available European disability weights by Haagsma et al. [9].
The life expectancy table as determined for the GBD 2010 study[11] is the projected frontier remaining life expectancy in 2050 per age group, whereby equal life expectancies are assumed for men and women. In the previous reports and papers [1-8] the life expectancy tables determined for the GBD 1990 study were used with different life
expectancies for men and women. In Table A.1 in Annex I, old and new life tables are presented.
A further applied adaptation is the use of the newly available European disability weights by Haagsma et al. [9]. Contrary to the earlier disability weights, which were derived from several studies using various
methodologies were these disability weights derived from a single study using a survey of 30,660 European citizens (one-quart of them being Dutch), who had to rank health states using a systematic developed for the GBD 2010 study. These disability weights were incorporated in the disease burden model. The selection of the different disability weights per health state was discussed with experts at RIVM. A full overview of the updated disability weights and durations is presented in Table A.2 in Annex I.
2.3 Cost of illness
Contrary to earlier estimates [1-6, 8] we used the newly available reference prices for health economic evaluations from the Dutch healthcare institute [12, 13]. And in order to better reflect the current situation of the labour market, and following the most recent guideline [12, 13], the friction period (i.e. the period needed to replace a sick, invalid or dead worker) was changed from 23 weeks [14] to 12 weeks [12, 13]. The previous references prices and friction period were from 2009 [14], for full details see Table A.3 in Annex I.
All costs were expressed in 2016 euros using Dutch consumer price indices as provided by Statistics Netherlands3, where necessary.
3
3
Results
3.1 Trend information
Trend information for specific pathogens is presented in Table 3. A summary of trends (in comparison with 2015) is discussed below:
• The incidence of campylobacteriosis (laboratory confirmed cases) decreased from 42.8 to 38.3 cases per 100,000 inhabitants, showing a continuously decreasing trend since 2011.
• The incidence of salmonellosis (laboratory confirmed cases) is with 10.7 cases per 100,000 inhabitants slightly higher than in 2015 (9.0 per 100,000 inhabitants), an increase mainly due to the European outbreak of Salmonella Enteritidis in eggs[15]. • The incidence of cryptosporidiosis (laboratory confirmed cases) is
increasing since the start of the surveillance in 2013 and was in 2016 12.4 per 100,000 inhabitants compared to 10.5 per 100,000 inhabitants in 2015.
• The incidence of gastroenteritis by rotavirus (laboratory confirmed cases) was 10.5 per 100,000 inhabitants, which is about half of the cases in 2015 (20.4 per 100,000 inhabitants), but similar to the number of cases reported in 2014 (9.3 per 100,000 inhabitants).
• The incidence of gastroenteritis by norovirus (laboratory confirmed cases) was with 32.2 cases per 100,000 inhabitants higher than in earlier years (e.g. 26.5 per 100,000 inhabitants in 2015).
• The incidence of acquired listeriosis (laboratory confirmed cases, active surveillance) increased from 72 cases in 2015 to 89 cases in 2016, and was similar to 2014 (92 cases). However, the recorded fatalities decreased markedly from 15 in 2015 to 8 in 2016, and were similar to earlier years (i.e. 2012-2014). • In 2016 the incidence of perinatal listeriosis (laboratory
confirmed cases, active surveillance) was 7 cases with 4 fatalities. This was the highest number of fatalities so far ever recorded. Higher incidences were only reported in 2011 (9 laboratory confirmed cases).
• The incidence of diseases caused by STEC O157 (laboratory confirmed cases, active surveillance) was 64 laboratory
confirmed cases with 21 hospitalized cases (of 60 cases for which this information is known). The number of STEC O157 cases, including the number of hospitalized cases, is slightly lower than in previous years (76 cases and 27 hospitalized cases in 2015). The incidence of HUS cases was with 3 in 2016 similar to 2015. • The incidence of hepatitis-A virus (notified cases) was 81
reported cases and 22 hospitalized cases. These numbers are similar to those in 2015 (80 reported cases and 23 hospitalized cases).
• With 3.1 cases per 100,000 inhabitants was the incidence of hepatitis-E virus (laboratory confirmed cases) similar to 2015, but higher than in 2014 (2.2 cases per 100,000 inhabitants) or in 2013 (0.9 cases per 100,000 inhabitants).
• The number of patients that were admitted to hospital due to GE was estimated to be 20,796 in 2016, and therefore slightly lower than in 2015 (22,064), but similar to 2014 (20,345). The
observed decrease in 2016 was mainly driven by the far lower number of rotavirus infections in 2016 compared to 2015.
Table 3. Trends in incidence per 100,000 inhabitants of food-related pathogens, 1999-2016 Year Caa Saa Crypa RVa NVa aLmb aLm
fata b pLm b pLm fatal b O157 b O157 hosp b HAV b HAV hosp b HEV a 1999 38.7 21.1 19.2 14.2 32 2000 42.1 20.3 15.7 12.8 43 2001 44.3 20.4 17.5 11.2 41 2002 40.8 15.4 16.5 11.8 49 2003 33.3 20.7 17.5 12.6 57 2004 40.0 15.6 15.4 13.2 37 2005 43.8 12.9 21.4 15.6 85 15 6 53 2006 40.0 16.0 25.5 17.3 59 17 5 1 40 258 39 2007 40.7 11.9 20.1 14.5 60 12 6 1 83 168 27 2008 39.2 15.7 27.1 18.1 51 6 1 1 45 183 35 2009 44.1 11.6 30.9 17.7 76 4 3 1 57 21 176 29 2010 50.2 13.8 35.2 23.1 73 13 4 1 51 21 262 52 0.8 2011 51.3 12.2 23.7 21.0 79 4 9 1 65 18 d 125 25 0.9 2012 48.8 20.7 20.1 26.3 c 71 8 6 0 85 31 e 121 28 1.0 2013 48.0 9.3 5.8 23.3 25.8 c 76 7 3 0 90 36 f 109 30 0.9 2014 47.54 9.2 5.9 9.45 25.3 c 92 9 4 2 79 31 g 105 23 2.2 2015 42.80 9.0 10.5 20.4 26.5 c 69 15 3 1 76 27 h 80 23 3.1 2016 38.31 10.7 12.4 10.5 32.9 c 89 8 7 4 64 21 i 81 22 3.1 Used abbreviations:
Ca: Campylobacter spp. ; Sa: Salmonella spp.; Cryp: Cryptosporidium spp.; RV: rotavirus; NV: norovirus; aLm: acquired listeriosis; pLm: perinatal listeriosis: O157: STEC o157; HAV: hepatitis-A-virus; hosp: hospitalized; HEV: hepatitis-E-virus.
Notes:
a).per 100,000 inhabitants; b) reported cases; c) : estimated norovirus-associated hospitalized cases derived from RIVM laboratory surveillance data and therefore not directly comparable to numbers from before 2012; d) known for 57 of the 65 cases; e) known for 77 of the 85 cases; f) known for 84 of the 90 cases; g) known for 71 of the 79 cases; h) known for 68 of the 76 cases; i) known for 60 of the 64 cases.
3.2 Disease incidence
Ten of the selected pathogens (i.e. Campylobacter spp.; STEC O157; Salmonella spp.; all three toxin-producing bacteria; norovirus;
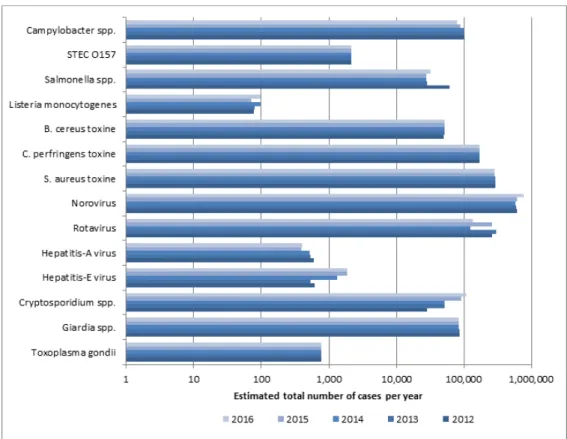
rotavirus; Cryptosporidium spp.; Giardia spp.) cause GE. The other four pathogens (i.e. Listeria monocytogenes; Toxoplasma gondii; hepatitis-A virus; hepatitis-E virus) cause other diseases (e.g. listeriosis, hepatitis, toxoplasmosis). The incidence of gastroenteritis by pathogen in 2016 is presented in Table 4. The incidence of diseases by non-gastrointestinal pathogens in 2016 is presented in Table 5. The incidence by the 14 pathogens for the years 2012-2016 is presented in Figure 1 and in Table A.4 in Annex II.
There was an overall increase of the estimated total number of
foodborne diseases due to the 14 pathogens from 1,682,000 in 2015 to 1,721,000 in 2016. The salmonella outbreak associated with
contaminated eggs in 2016 resulted in a slightly higher incidence compared to 2015. But also the incidence of gastroenteritis due to norovirus and cryptosporidiosis, and the incidence of listeriosis increased in 2016 compared to 2015. The incidence of gastroenteritis due to rotavirus and Campylobacter decreased. The estimated incidence of the remaining pathogens did not changed, mostly because no trend
information based on surveillance data was available.
Table 4. Mean incidence and 95% uncertainty interval (between brackets) of gastroenteritis by pathogen in the Netherlands, 2016
Pathogen General population
(x 1,000) (x 1,000) GP visit Hospitalised (x 1,000) Fatal cases
All causes 4,812 222 21 NA#
(3986-5720) (71-522) - Bacteria – infectious Campylobacter spp. 79 19 1.1 57 (10-219) (9-35) (0.4-2.1) (38-79) STEC O157 2 0 0.02 4 (0-9) (0-0) (0.02-0.02) (2-7) Salmonella spp. 32 4.9 1.0 32 (3-98) (3-8) (0.4-2) (28-37)
Bacteria – toxin producing
Bacillus cereus 52 7.3 0.2 0 (19-121) (2-20) (0.1-0.5) - Clostridium perfringens 171 31 0.3 5 (60-355) (8-80) (0.1-0.6) (0-20) Staphylococcus aureus 287 40 1.5 7 (134-517) (11-95) (0.6-2.8) (0-28) Viruses Norovirus 765 18 1.8 82 (527-1096) (10-29) (0.9-3.1) (35-155) Rotavirus 138 8 5.2 23 (72-240) (5-12) (3.7-6.9) (7-51) Protozoa Cryptosporidium spp. 109 7 0.5 7 (37-270) (3-12) (0.2-1.1) (0-30)
Table 5. Mean incidence and 95% uncertainty interval (between brackets) of non-gastrointestinal pathogen in the Netherlands, 2016
Pathogen Incidence
mean (95% CI) mean (95% CI) Fatal cases Listeria monocytogenes Perinatal 7 * 4 * Acquired 89 * 8 * Hepatitis-A virus 397 (254-637) 1 (1-2) Hepatitis-E virus 1863 (1099-2830) 21 (7-47) Toxoplasma gondii Congenital 344 (179-603) 12 (7-21) Acquired# 423 (201-722) 0
*No uncertainty because Listeria cases were acquired through surveillance; # chorioretinitis only
Figure 1. Comparison of mean incidence of food-related pathogens, 2012- 2016 * The estimates that are presented here for 2012-2015 cannot be compared with previous estimates due to: new incidence estimates for hepatitis-E virus, Cryptosporidium spp. and Giardia spp..
The total number of deaths due to foodborne disease decreased from 276 in 2015 to 266 in 2016 (see Table A.5 in Annex II).
3.3 Disease burden by pathogen
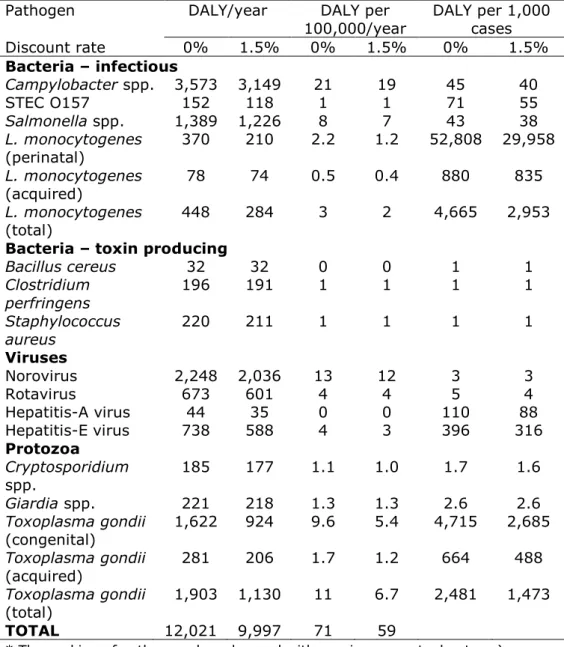
Table 6 presents the burden of disease by pathogen for the year 2016 for the total Dutch population, as DALY per 100,000 inhabitants and as DALY per 1,000 cases, both undiscounted and discounted.
The total burden of disease of the 14 pathogens decreased by 170 DALY from 12,190 DALY in 2015 (Table A.6 in Annex II) to 12,020 in 2016, but was higher than in 2014 (11,790 DALYs) - the year with the lowest disease burden in the past five years. Large differences in burden of disease between 2015 and 2016 were found for rotavirus (-600 DALYs), Campylobacter (-450 DALYs), norovirus (+450 DALYs), Listeria (+200 DALY) and Salmonella infections (+200 DALYs). The largest burden at population level was caused by Campylobacter spp. (3,570 DALY) and norovirus (2,250 DALYs) followed by Toxoplama gondii (1,900 DALYs). Perinatal listeriosis was the disease outcome with the highest individual burden among all pathogens (53 DALY per case), followed by congenital toxoplasmosis (4.7 DALY per case).
Table 6 Mean total DALY per year, DALY per 100,000 inhabitants and DALY per 1000 cases of illness in the Netherlands, 2016
Pathogen DALY/year DALY per
100,000/year DALY per 1,000 cases Discount rate 0% 1.5% 0% 1.5% 0% 1.5% Bacteria – infectious Campylobacter spp. 3,573 3,149 21 19 45 40 STEC O157 152 118 1 1 71 55 Salmonella spp. 1,389 1,226 8 7 43 38 L. monocytogenes (perinatal) 370 210 2.2 1.2 52,808 29,958 L. monocytogenes (acquired) 78 74 0.5 0.4 880 835 L. monocytogenes (total) 448 284 3 2 4,665 2,953
Bacteria – toxin producing
Bacillus cereus 32 32 0 0 1 1 Clostridium perfringens 196 191 1 1 1 1 Staphylococcus aureus 220 211 1 1 1 1 Viruses Norovirus 2,248 2,036 13 12 3 3 Rotavirus 673 601 4 4 5 4 Hepatitis-A virus 44 35 0 0 110 88 Hepatitis-E virus 738 588 4 3 396 316 Protozoa Cryptosporidium spp. 185 177 1.1 1.0 1.7 1.6 Giardia spp. 221 218 1.3 1.3 2.6 2.6 Toxoplasma gondii (congenital) 1,622 924 9.6 5.4 4,715 2,685 Toxoplasma gondii (acquired) 281 206 1.7 1.2 664 488 Toxoplasma gondii (total) 1,903 1,130 11 6.7 2,481 1,473 TOTAL 12,021 9,997 71 59
In Figure 2 we show per pathogen the contribution of years lived with disability (YLD) associated with acute infections, YLD associated with sequelae and years of life lost (YLL) due to premature mortality to total DALY. YLD associated with acute infections contributed 13% to the total disease burden; YLD associated with sequelae/residuals contributed 38% and YLL 49% of the total disease burden. The distribution between the different categories varied between pathogens, see Figure 2 for details.
Figure 2. Mean DALY per year of food-related pathogens in 2016, split up into YLD associated with acute infections; YLD associated with sequelae and YLL. To enable comparison of the burden of disease estimates from 2012 and onwards we re-estimated the disease burden by pathogen and total for the years 2012 to 2016 using the new disability weights and new life tables. The results of this re-estimation are presented in Figure 3 and in Table A.6 in Annex II.
Figure 3. Comparison of disease burden (undiscounted DALYs) of food-related pathogens in 2012-2016
* The estimates that are presented here for 2012-2015 cannot be compared with previous estimates due to: a) new incidence estimates for hepatitis-E virus, Cryptosporidium spp. and Giardia spp.; and b) new disability weights [9] (see Table A.2 in Annex I) and life tables (see Table A.1 in Annex I).
3.4 Cost-of-illness by pathogen
The total COI was 4.5 €M lower in 2016 compared to 2015 (see Table A.7-b in Annex II) and was estimated at 430 M€ (discounted at 4%) in 2016 (Table 7 and Figure 5). The three pathogens causing the largest COI are norovirus (130 M€), Campylobacter spp. (63 M€) and GE due to Staphylococcus aureus toxin (59 M€). The lowest contribution to the COI was by hepatitis-A virus (0.6 M€). Predominated changes compared to 2015 were for rotavirus (-28 M€), Campylobacter (-7 M€), norovirus (+25 M€), Cryptosporidium (+3 M€) and Salmonella infections (+2 M€). The average cost per case were largest for perinatal Listeria gondii infections (0.14 €M/1000 cases).
Table 7 Estimated mean total costs of illness (COI), mean COI per 100,000 inhabitants and mean COI per case of illness in the Netherlands, 2016
Pathogen COI/year
(M€) 100,000 (k€) COI per COI per 1,000 cases (k€)
Discount rate 0% 4% 0% 4% 0% 4% Bacteria – infectious Campylobacter spp. 68 63 401 370 862 795 STEC O157 11 5 63 32 5,013 2,560 Salmonella spp. 23 21 134 125 708 659 L. monocytogenes (perinatal) 2.5 1.0 15 6 364,255 137,311 L. monocytogenes (acquired) 2.4 2.2 14 13 26,775 25,270 L. monocytogenes (total) 4.9 3.2 29 19 51,383 33,439
Bacteria – toxin producing
Bacillus cereus 11 11 63 63 205 205 Clostridium perfringens 28 28 167 167 166 166 Staphylococcus aureus 59 59 349 349 207 207 Viruses Norovirus 130 130 767 767 170 170 Rotavirus 44 44 259 259 320 320 Hepatitis-A virus 0.6 0.6 3.7 3.7 1,568 1,568 Hepatitis-E virus 8 8 49 49 4,500 4,500 Protozoa Cryptosporidium spp. 25 25 149 149 232 232 Giardia spp. 16 16 93 93 190 190 Toxoplasma gondii (congenital) 43.1 13.7 254 81 125,202 39,962 Toxoplasma gondii (acquired) 1.1 1.1 7 7 2,694 2,685 Toxoplasma gondii (total) 44 15 260 88 57,645 19,405 TOTAL 473 430 2,787 2,533
Used abbreviations: million € (M€); *1000 € (k€).
In Figure 4 the mean COI per year was split up in healthcare costs, patient/family costs and costs in other sectors. The latest were mostly productivity losses of patients and caregivers being absent from work. Healthcare costs accounted for 21% of the total costs for the 14 pathogens, patient/family costs for 3% and costs in other sectors accounted for 77%. The distribution between the different cost categories varied between pathogens, as can be seen in Figure 4.
Figure 4. Mean cost-of-illness (discounted) per year of food-related pathogens in 2016, split up into healthcare costs, patient costs and costs in other sectors. The mean COI estimates - by pathogen and total - for the years 2012 to 2016 were re-estimated because of the use of new references prices and are presented in Figure 5 and in Table A.7 in Annex II.
Figure 5. Comparison of cost-of-illness (M€, discounted at 4% and expressed in 2016 euros) of food-related pathogens in 2012-2016*
* The estimates that are presented here for 2012-2015 cannot be compared with earlier estimates due to: a) new incidence estimates for hepatitis-E virus, Cryptosporidium spp. and Giardia spp.; and b) new reference prices (see Table A.3 in Annex I, and a shorter friction period (i.e. 12 weeks vs 26 weeks).
3.5 Attribution
The attribution results for DALYs and COI of foodborne diseases in 2016 are presented in Table 8 for the main pathways and in Table 9 for the different food groups. More details can be found in the Tables A.8 – A.15 in Annex II. Foodborne disease burden accounted for 39% of the total burden (i.e. 4,710 DALYs per year), and 40% of the total COI (i.e. 171 M€). About 53% of the foodborne burden was associated with meat (i.e. poultry, pork, beef & lamb). These foods caused 31% of all food-related cases, indicating that the pathogens associated with these foods tend to cause more severe infections than pathogens associated with other foods. 00 20 40 60 80 100 120 140 Toxoplasma gondii Giardia spp. Cryptosporidium spp. Hepatitis-E virus Hepatitis-A virus Rotavirus Norovirus S. aureus toxine C. perfringens toxine B. cereus toxine Listeria monocytogenes Salmonella spp. STEC O157 Campylobacter spp.
COI (in €M and expressed in 2016 euros)/ year 2016 2015 2014 2013 2012
transmission pathways in the Netherlands, 2016
Main pathway Food Environment Human Animal Travel Total
Incidence ( per year) 672,785 218,294 584,132 95,048 150,385 1,720,644
Deaths (per year) 90 46 71 24 35 266
Disease burden (DALY, undiscounted)) 4,708 2,399 2,250 1,183 1,480 12,021 Disease burden (DALY, discounted (1.5%)) 3,803 1,910 2,014 1,022 1,248 9,997
Cost of illness (M€, undiscounted)b 194 77 122 34 46 473
Cost of illness (M€, discounted (4%)) b 171 64 120 31 43 430
a) Due to the 14 pathogens included in this study
b) Costs are expressed in 2016 euros and in million € (M€).
Table 9 Attribution of the mean incidence, fatalities, disease burden and cost-of-illness of foodlborne diseasea to food group in the
Netherlands, 2016
Food groups Beef &
Lamb Pork Poultry Eggs Dairy shellfish Fish& Produce Beverages Grains Other foods Humans & animals
Total Incidence ( per year) 109,521 45,073 56,156 21,974 54,903 56,069 39,395 15,785 40,175 120,883 112,851 672,785
Deaths (per year) 9.5 11.6 18 5.6 7.3 7.9 6.1 2.1 3.4 5.5 13 90
Disease burden (DALY,
undiscounted)) 586 874 1,035 248 364 345 304 88 137 249 479 4,708
Disease burden (DALY,
discounted (1.5%)) 446 606 895 217 291 283 247 77 119 216 407 3,803
Cost of illness (M€,
undiscounted)b 29 25 26 7 16 14 12 4 9 26 26 194
Cost of illness (M€,
discounted (4%)) b 24 16 23 7 14 13 10 4 9 26 24 171
a) Due to the 14 pathogens included in this study
The foodborne disease burden increased by 66 DALYs from 4,642 DALYs in 2015 to 4,708 DALYs in 2016, whereas the COI slightly decreased by 0.5 M€ from 171.8 M€ in 2015 to 171.3 M€ in 2016, see Tables 10 and 11 for food-related DALY and COI estimates for the years 2012-2016. Table 10 Disease burden (DALY per year, undiscounted) attributed to food in the Netherlands from 2012 to 2016, total and by pathogen
Pathogen Disease burden (DALY) per year*
2012 2013 2014 2015 2016 Campylobacter spp. 1951 1917 1869 1691 1501 STEC O157 61 61 61 61 61 Salmonella spp. 1486 670 649 643 757 Listeria monocytogenes 94 68 191 165 310 B. cereus toxin 28 28 28 28 28 C. perfringens toxin 176 176 177 177 177 S. aureus toxin 194 194 193 192 192 Norovirus 297 286 285 301 375 Rotavirus 161 186 78 165 88 Hepatitis-A virus 7 7 6 5 5 Hepatitis-E virus 34 30 73 103 102 Cryptosporidium spp. 6 11 11 19 22 Giardia spp. 29 29 29 29 29 Toxoplasma gondii 1093 1068 1088 1063 1062 Total 5618 4732 4738 4642 4708
* The estimates that are presented here for 2012-2015 cannot be compared with previous estimates due to: a) new incidence estimates for hepatitis-E virus, Cryptosporidium spp. and Giardia spp.; and b) new disability weights [9] (see Table A.2 in Annex I) and life tables (see Table A.1 in Annex I).
Table 11– Attribution of mean COI (M€/year discounted at 4% and expressed in 2016 euros) to food in the Netherlands for 2012-2016, total and by pathogen
Pathogen COI per year ( million €/year)*
2012 2013 2014 2015 2016 Campylobacter spp. 33.3 32.6 32.2 29.4 26.4 STEC O157 2.2 2.2 2.2 2.2 2.2 Salmonella spp. 20.1 10.6 10.1 10.4 11.6 Listeria monocytogenes 2.4 1.9 2.0 1.7 2.2 B. cereus toxin 9.3 9.4 9.4 9.5 9.5 C. perfringens toxin 25.5 25.5 25.5 25.6 25.6 S. aureus toxin 52.4 52.2 51.9 51.7 51.7 Norovirus 17.7 17.0 16.7 17.6 21.7 Rotavirus 9.3 10.4 5.2 9.3 5.7 Hepatitis-A virus 0.1 0.1 0.1 0.1 0.1 Hepatitis-E virusa 0.4 0.3 0.8 1.2 1.2 Cryptosporidium spp. a 1.1 1.6 1.6 2.6 3.0 Giardia spp. a 2.1 2.1 2.1 2.1 2.1 Toxoplasma gondii 8.6 8.4 8.6 8.4 8.3 Total 184.6 174.5 168.5 171.8 171.3
* The estimates that are presented here for 2012-2015 cannot be compared with earlier estimates due to: a) new incidence estimates for hepatitis-E virus, Cryptosporidium spp. and Giardia spp.; and b) new reference prices (see Table A.3 in Annex I) and a shorter friction period (i.e. 12 weeks vs 26 weeks).
3.6 Model update effect 3.6.1 Updated incidences
Using available RIVM laboratory surveillance for hepatitis-E virus and Cryptosporidum spp., and assuming no negative trend correction for Giardia spp. but a stable incidence since 2007 (i.e. the last year of RIVM laboratory surveillance data for Giardia spp.) resulted in far higher incidence estimates than presented in earlier reports (see Table 12), and hence higher disease burden and higher COI estimates for these years. Table 12– Updated incidences and old estimates for 2012-2015
Incidences in population 2012 2013 2014 2015
Hepatitis-E virus Old 53 53 53 53
New 617 540 1,335 1,878 Cryptosporidum spp Old 27,941 27,689 27,583 27,806
New 28,125 52,137 51,752 91,898 Giardia spp. Old 57,163 48,695 48,524 40,608 New 85,766 85,217 84,495 83,784 3.6.2 New disability weights and new life tables
The application of the new disability weights - all derived from a single study among citizens of four European countries, including the
Netherlands - resulted in lower disability weights for mostly all acute infections with as consequences lower YLD estimates than compared to disability weights derived with older methodology (see Table 13). For some of the chronic sequelae, in particular all the sequelae related to congenital Toxoplasma infections disability weights were also lower, resulting in lower YLD estimates (Table 13). Only mild gastro-enteritis (GE) cases not requiring medical help with a disability weight of 0 in the old methodology, were valued higher with the new methodology, what in particular for norovirus resulted in higher YLD (Table 13).
The new life tables have impacted mostly the YLL estimates, resulting in either slightly higher estimates, or no difference.
In short, the application of the new disability weights resulted in lower non-fatal burden of disease for some of the pathogens (i.e. all three toxin-producing bacteria; rotavirus, hepatitis-E and hepatitis-A virus; Cryptosporidium spp., Toxoplasma gondii), and in higher estimates for other pathogens (i.e. Campylobacter spp., STEC O157, Salmonella spp., Listeria monocytogenes and norovirus). The new ranking of pathogens is therefore slightly different compared to rankings of previous iterations. In 2016, Campylobacter infections had the highest disease burden, followed by norovirus and Toxoplasma gondii. In previous years Toxoplasma gondii ranked second, except for the year 2012 (a large salmonella outbreak).
Table 13. Estimated mean YLD, YLL and total DALY per year using old disability weights with corresponding durations, and old life tables (i.e. old methodology) and estimated mean YLD, YLL and total DALY per year using new disability weights with corresponding durations and new life tables (i.e. new methodology) by pathogen in the Netherlands, 2016*
Pathogen DALY/year
Old methodology New methodology
YLD YLL DALY YLD YLL DALY Bacteria – infectious
Campylobacter spp. 2,361 627 2,989 2,806 766 3,573
STEC O157 23 115 138 37 115 152
Salmonella spp. 748 311 1,059 998 392 1,389 L. monocytogenes 47 379 425 41 407 448 Bacteria – toxin producing
Bacillus cereus 118 0 118 32 0 32 Clostridium perfringens 484 60 544 136 60 196 Staphylococcus aureus 661 94 755 126 94 220 Viruses Norovirus 338 1,634 1,972 616 1,634 2,248 Rotavirus 335 502 837 171 502 673 Hepatitis-A virus 24 42 66 2 42 44 Hepatitis-E virus 137 716 853 21 716 738 Protozoa Cryptosporidium spp. 123 88 211 97 88 185 Giardia spp. 131 30 161 190 30 221 Toxoplasma gondii 2,453 981 3,434 875 1,027 1,903
* For details on life tables – old and updated values - see Table A.1 in Annex I and for disability weights and durations – old and updated values - see Table A.2 in Annex I.
3.6.3 New reference prices
The application of more recent reference prices and a shorter friction period (12 weeks vs 26 weeks) had only a marginal impact on the results (see Table 14), and had no impact at all on the ranking of the pathogens itself.
Table 14. Estimated mean health care costs, costs in other sectors and total costs per year using old reference prices and a 26-week friction period (i.e. old methodology) and new reference prices and a 12-week friction period (i.e. new methodology) by pathogens in the Netherlands, 2016
Pathogen Cost-of-illness per year
(Million €, discounted at 4% and expressed in 2016 euros)
Old methodology New methodology
Health care cost Costs in other sectors Total
costs* Health care cost Costs in other sectors Total costs* Bacteria – infectious Campylobacter spp. 23.3 37.7 62.8 22.8 38.5 62.8 STEC O157 4.5 1.0 5.5 4.5 1.0 5.5 Salmonella spp. 9.6 11.1 21.2 9.6 11.1 21.2 L. monocytogenes 3.0 0.2 3.2 3.0 0.2 3.2 Bacteria – toxin producing
Bacillus cereus 1.0 9.5 10.7 1.0 9.5 10.7 Clostridium perfringens 4.3 23.3 28.3 4.3 23.3 28.3 Staphylococcus aureus 4.9 53.1 59.3 4.9 53.1 59.3 Viruses Norovirus 6.4 121.0 130.2 6.4 121.0 130.2 Rotavirus 10.9 32.4 44.0 10.9 32.4 44.0 Hepatitis-A virus 0.2 0.4 0.6 0.2 0.4 0.6 Hepatitis-E virus 3.9 4.4 8.4 3.9 4.4 8.4 Protozoa Cryptosporidium spp. 2.8 22.0 25.2 2.8 22.0 25.2 Giardia spp. 2.0 13.4 15.8 2.0 13.4 15.8 Toxoplasma gondii 13.9 0.9 14.9 13.9 0.9 14.9 TOTAL 90.3 331.4 430.1 90.3 331.4 430.1
* Note the total costs included healthcare costs, costs for the patient and / or his family (~3% of total costs and not shown) and costs in other sectors (e.g. productivity losses).
4
Discussion
Although we observed an increasing trend in incidence, disease burden and cost-of-illness for norovirus, hepatitis-E virus and Cryptosporidium spp., the overall estimated disease burden of 14 enteric pathogens in 2016 is slightly lower than in 2015 (12,020 versus 12,190 DALYs), confirming a continuing decrease since 2012. The share of foodborne transmission is about 40%, and was slightly higher in 2016 than in 2015 (4,708 versus 4,642 DALYs), but lower than the years 2012-2014. Both the overall COI and the foodborne-related COI show a decreasing trend over the years, and were lowest since 2012. However, to what extent/in how far/whether this trend will continue is speculative as the increase of norovirus-associated COI was in 2016 partly compensated by a sharp decrease in rotavirus-associated costs-of-illnesses. Whether the two-year cycle observed in recent two-years for rotavirus will also apply to 2017 - low rotavirus incidence in 2016, thus high rotavirus incidence in 2017 –and there is no drastic reduction of norovirus incidences (and it seems like there is an increase for rotavirus, but no decrease in norovirus) than we might expect an increase in both costs and DALYs in 2017. These data will be shown in the next update of the burden estimates. In the past years several surveillance and registrations systems have been started, have been changed or were available but were so far not used in previous reports [1-6]. We made use of these data for hepatitis-E virus, Cryptosporidium spp., and norovirus, and re-estimated disease burden and COI from previous years (i.e. 2012-2015) using these new data. This is why burden of disease and COI estimates for these three pathogens presented in previous reports [1-6] cannot be compared to the results presented in the current report
In the current report, we used new disability weights and a more recent life table. Both changes had an impact on the estimated disease burden. This is why burden of disease estimates presented in previous reports [1-6] cannot be compared to the results presented in the current report. We therefore have re-estimated the disease burden from 2012 onwards. The currently used disability weights are, opposite to the older ones, derived from a single study among 30,660 citizens of four European countries including the Netherlands. The older ones were derived from different studies using partly varying methodologies and were derived in different populations. The new disability weights are well applicable to the Netherlands and are an important improvement to the comparability across diseases (e.g. for example all diseases presented in the 2017 “State of Infectious Diseases in the Netherlands, 2016” [29]).
Furthermore, ECDC use the same disability weights in their burden of disease toolkit, a toolkit freely available and accessible to everybody, including all member states of the European Union [16]. The application of the new disability weights resulted in lower YLDs for almost all health states associated with acute infections, except for mild gastro-enteritis which was previously weighted with zero. But also for some of the chronic sequelae, in particular all the sequelae related to congenital Toxoplasma infections, had lower disability weights. The new life tables that were used in this study resulted mostly in higher YLL estimates
compared to the YLL estimates with old life tables. The application of the new disability weights resulted in lower disease burden for some of the pathogens (i.e. all three toxin-producing bacteria; rotavirus, hepatitis-E and hepatitis-A virus; Cryptosporidium spp., Toxoplasma gondii), whereas for other pathogens higher disease burden estimates were obtained (i.e. Campylobacter spp., STEC O157, Salmonella spp., Listeria monocytogenes and norovirus). These changes had an impact on the ranking with Campylobacter infections presenting the highest disease burden, and Toxoplasma gondii mostly only second place. In previous iterations this used to be the other way around.
A last methodological change was the use of new references prices and a shorter friction period representing the current labour market [12, 13]. These adaptations had only a marginal impact on the calculated cost-of-illness estimates. However, for comparison reason we also re-estimated all COI estimates for the years 2012-2016 and presented them in the current report.
5
References
1. Havelaar, A.H., I.H. Friesema, and W. Van Pelt, Disease burden of food-related pathogens in the Netherlands, 2010. 2012, National Institute of Public Health and the Environment: Bilthoven. RIVM Letter report 330331004/2012
2. Bouwknegt, M., et al., Disease burden of food-related pathogens in the Netherlands, 2011. 2012, National Institute of Public Health and the Environment: Bilthoven. RIVM Letter Report 330331006/2013
3. Bouwknegt, M., et al., Disease burden of food-related pathogens in the Netherlands, 2012. 2013, National Institute of Public Health and the Environment: Bilthoven. 330331009/2013
4. Bouwknegt, M., et al., Disease burden of food-related pathogens in the Netherlands, 2013. 2017, National Institute of Public Health and the Environment: Bilthoven. RIVM Letter Report 2014-0115.
5. Bouwknegt, M., et al., Disease burden of food-related pathogens in the Netherlands, 2014. 2017, National Institute of Public Health and the Environment: Bilthoven. RIVM Letter Report 2017-0061.
6. Mangen, M.J.J., et al., Disease burden of food-related pathogens in the Netherlands, 2015. 2017, National Institute of Public Health and the Environment: Bilthoven. RIVM Letter Report 2017-0060.
7. Havelaar, A.H., et al., Disease burden of foodborne pathogens in the Netherlands, 2009. Int J Food Microbiol, 2012. 156(3): p. 231-8.
8. Mangen, M.J., et al., Cost-of-illness and disease burden of food-related pathogens in the Netherlands, 2011. Int J Food Microbiol, 2015. 196: p. 84-93.
9. Haagsma, J.A., et al., Assessing disability weights based on the responses of 30,660 people from four European countries. Popul Health Metr, 2015. 13: p. 10.
10. Borgen, K., et al., Non-travel related Hepatitis E virus genotype 3 infections in the Netherlands; a case series 2004 - 2006. BMC Infect Dis, 2008. 8: p. 61.
11. WHO, WHO methods and data sources for global burden of disease estimates 2000-2011. 2013, World Health Organization (WHO) - Department of Health Statistics and Information Systems: Geneva.
12. ZIN, Richtlijn voor het uitvoeren van economische evaluaties in de gezondheidszorg. 2015, Zorginstituut Nederland.
13. ZIN, Kostenhandleiding: Methodologie van kostenonderzoek en referentieprijzen voor economische evaluaties in de
gezondheidszorg. 2015, Zorginstituut Nederland (ZIN). 14. Hakkaart- van Roijen, L., S.S. Tan, and C.A.M. Bouwmans,
Handleiding kostenonderzoek - Methoden en standaard
kostprijzen voor economische evaluaties in de gezondheidszorg - Geactualiseerde versie 2010. 2011, College voor
15. European Centre for Disease Prevention and Control and the European Food Safety Authority, Multi-country outbreak of Salmonella Enteritidis phage type 8, MLVA type 9-7-3-2 and 2-9-6-3-2 infections, 27 October 2016. 2016, ECDC: Stockholm. 16. Colzani, E., et al., A Software Tool for Estimation of Burden of
Infectious Diseases in Europe Using Incidence-Based Disability Adjusted Life Years. PLoS One, 2017. 12(1): p. e0170662. 17. Mangen, M.J.J., et al., The costs of human Campylobacter
infections and sequelae in the Netherlands: a DALY and cost-of-illness approach. Food Economics - Acta Agriculturæ
Scandinavica C, 2005. 2: p. 35-51.
18. Kemmeren, J.M., et al., Priority setting of foodborne pathogens - Disease burden and costs of selected enteric pathogens. 2006, National Institute of Public Health and the Environment: Bilthoven.
19. Havelaar, A.H., et al., Disease burden in The Netherlands due to infections with Shiga toxin-producing Escherichia coli O157. Epidemiol Infect, 2004. 132(3): p. 467-84.
20. Vijgen, S.M., et al., Disease burden and related costs of cryptosporidiosis and giardiasis in the Netherlands. 2007, National Institute of Public Health and the Environment: Bilthoven. RIVM report 330081001
21. Haagsma, J., et al., Disease burden and costs of selected foodborne pathogens in the Netherlands, 2006. 2009, National Institute of Public Health and the Environment: Bilthoven. RIVM Report 330331001/2009
22. Ruzante, J.M., et al., Hospitalization and deaths for select enteric illnesses and associated sequelae in Canada, 2001-2004.
Epidemiol Infect, 2011. 139(6): p. 937-45.
23. Bos, J.M., et al., Health economics of a hexavalent
meningococcal outer-membrane vesicle vaccine in children: potential impact of introduction in the Dutch vaccination program. Vaccine, 2001. 20(1-2): p. 202-7.
24. van Leeuwen, N., et al., Hospital Admissions, Transfers and Costs of Guillain-Barre Syndrome. PLoS One, 2016. 11(2): p.
e0143837.
25. van der Maas, N.A., et al., Guillain-Barre syndrome: background incidence rates in The Netherlands. J Peripher Nerv Syst, 2011. 16(3): p. 243-9.
26. McPherson, M., et al., Economic costs of Shiga toxin-producing Escherichia coli infection in Australia. Foodborne Pathog Dis, 2011. 8(1): p. 55-62.
27. Jenssen, G.R., et al., Clinical features, therapeutic interventions and long-term aspects of hemolytic-uremic syndrome in
Norwegian children: a nationwide retrospective study from 1999-2008. BMC Infect Dis, 2016. 16: p. 285.
28. Torgerson, P.R., et al., World Health Organization Estimates of the Global and Regional Disease Burden of 11 Foodborne Parasitic Diseases, 2010: A Data Synthesis. PLoS Med, 2015. 12(12): p. e1001920.
6
Annex I: Adapted model parameters
Table A.1 - Standard loss functions used – old and updated life expectanciesa
Age-group
(years) (i.e. old life expectancies) GBD 1990 (i.e. new life GBD 2010 expectancies)
Males Females Persons
0 79.94 82.43 85.68 1-4 77.77 80.28 83.63 5-9 72.89 75.47 78.76 10-14 67.91 70.51 73.79 15-19 62.93 65.55 68.83 20-24 57.95 60.63 63.88 25-29 52.99 55.72 58.94 30-34 48.04 50.83 54.00 35-39 43.1 45.96 49.09 40-44 38.2 41.13 44.23 45-49 33.38 36.36 39.43 50-54 28.66 31.68 34.72 55-59 24.07 27.1 30.10 60-64 19.65 22.64 25.55 65-69 15.54 18.32 21.12 70-74 11.87 14.24 16.78 75-79 8.81 10.59 12.85 80-84 6.34 7.56 9.34 85+ 3.82 3.59 5.05 a) Source: [11]:
Pathogen Health state Old parameters Updated parameters Disability
weight Duration (in years) Disability weightb Description of used disability weight Duration (in years) Source (duration) Campylobacter spp.
GE - mild (i.e. not visiting
a GP) 0 - 0.073 Diarrhea, mild 0.01 [17, 18]
GE - moderate (i.e.
visiting a GP) 0.015 1 0.149 Diarrhea, moderate 0.03 [17, 18]
GE - severe (i.e.
hospitalized) 0.041 1 0.239 Diarrhea, severe 0.04 [17, 18]
GBS - Clinical phase, mild 0.09 1 0.012 Derived from motor impairment,
mild & moderated 1.00 [7] GBS - Clinical phase,
severe 0.28 1 0.229 Derived from intensive care unit admission; motor impairment, moderate & severe e
1.00 [7] GBS - Residual symptoms 0.16 41 0.110 Derived from motor impairment,
mild, moderate & severe f 41.00 [7] ReA - mild (i.e. not
visiting a GP) 0.023 1 0.034 Derived from musculoskeletal problems, upper limbs, mild & musculoskeletal problems, lower limbs, mild g
0.61 [17, 18]
ReA - moderate (i.e.
visiting a GP) 0.115 1 0.116 Derived from musculoskeletal problems, upper limbs, moderate & musculoskeletal problems, lower limbs, moderate g
0.61 [17, 18]
ReA -severe (i.e.
hospitalized) 0.186 1 0.344 Musculoskeletal problems, generalized, moderate h 0.61 [17, 18]
Irritable bowel syndrome 0.042 5 0.062 IBS 5.00 [7]
Pathogen Health state Old parameters Updated parameters Disability
weight Duration (in years) Disability weightb Description of used disability weight Duration (in years) Source (duration) disease
STEC O157
GE - mild (i.e. not visiting
a GP) 0 - 0.073 Diarrhea, mild 0.01 [19]
GE - moderate (i.e.
visiting a GP) 0.015 1 0.149 Diarrhea, moderate 0.02 [19]
GE - severe (i.e.
hospitalized) 0.041 1 0.239 Diarrhea, severe 0.02 [19]
EDRD 0.154 49 0.279 Derived from generic uncomplicated
disease: worry and daily medication and ESRD, on dialyse
49.00 [7]
HUS 0.123 1 0.258 Derived from intensive care unit
admission & infectious disease, acute episode, severe j
0.06 [19] Salmonella spp.
GE - mild (i.e. not visiting
a GP) 0 - 0.073 Diarrhea, mild 0.02 [18]
GE - moderate (i.e.
visiting a GP) 0.015 1 0.149 Diarrhea, moderate 0.03 [18]
GE - severe (i.e.
hospitalized) 0.041 1 0.239 Diarrhea, severe 0.04 [18]
ReA - mild (i.e. not
visiting a GP) 0.023 1 0.034 Derived from musculoskeletal problems, upper limbs, mild & musculoskeletal problems, lower limbs, mild g
0.61 [17, 18]
ReA - moderate (i.e.
Disability
weight Duration (in years) Disability weightb Description of used disability weight Duration (in years) Source (duration) musculoskeletal problems, lower
limbs, moderate g ReA -severe (i.e.
hospitalized) 0.186 1 0.344 Musculoskeletal problems, generalized, moderate h 0.61 [17, 18]
Irritable bowel syndrome 0.042 5 0.062 IBS 5.00 [7]
Inflammatory bowel
disease 0.13 Rem. LE 0.221 Crohn's disease or ulcerative colitis Rem. LE [7] Norovirus
GE - mild (i.e. not visiting
a GP) 0 - 0.073 Diarrhea, mild 0.01 [18]
GE - moderate (i.e.
visiting a GP) 0.015 1 0.149 Diarrhea, moderate 0.02 [18]
GE - severe (i.e.
hospitalized) 0.041 1 0.239 Diarrhea, severe 0.02 [18]
Rotavirus
GE - mild (i.e. not visiting
a GP) 0 - 0.073 Diarrhea, mild 0.01 [18]
GE - moderate (i.e.
visiting a GP) 0.015 1 0.149 Diarrhea, moderate 0.02 [18]
GE - severe (i.e.
hospitalized) 0.041 1 0.239 Diarrhea, severe 0.02 [18]
Cryptosporidium spp.
GE - mild (i.e. not visiting
Pathogen Health state Old parameters Updated parameters Disability
weight Duration (in years) Disability weightb Description of used disability weight Duration (in years) Source (duration) GE - moderate (i.e.
visiting a GP) 0.015 1 0.149 Diarrhea, moderate 0.02 [20]
GE - severe (i.e.
hospitalized) 0.041 1 0.239 Diarrhea, severe 0.05 [20]
Giardia spp.
GE - mild (i.e. not visiting
a GP) 0 - 0.073 Diarrhea, mild 0.03 [20]
GE - moderate (i.e.
visiting a GP) 0.015 1 0.149 Diarrhea, moderate 0.03 [20]
GE - severe (i.e.
hospitalized) 0.041 1 0.239 Diarrhea, severe 0.08 [20]
B. cereus toxin
GE - mild (i.e. not visiting
a GP) 0 - 0.073 Diarrhea, mild 0.01 [21]
GE - moderate (i.e.
visiting a GP) 0.015 1 0.149 Diarrhea, moderate 0.01 [21]
GE - severe (i.e.
hospitalized) 0.041 1 0.239 Diarrhea, severe 0.04 [21]
C. perfringens toxin
GE - mild (i.e. not visiting
a GP) 0 - 0.073 Diarrhea, mild 0.01 [21]
GE - moderate (i.e.
visiting a GP) 0.015 1 0.149 Diarrhea, moderate 0.01 [21]
GE - severe (i.e.
Disability
weight Duration (in years) Disability weightb Description of used disability weight Duration (in years) Source (duration) S. aureus toxin
GE - mild (i.e. not visiting
a GP) 0 - 0.073 Diarrhea, mild 0.01 [21]
GE - moderate (i.e.
visiting a GP) 0.015 1 0.149 Diarrhea, moderate 0.01 [21]
GE - severe (i.e.
hospitalized) 0.041 1 0.239 Diarrhea, severe 0.03 [21]
Listeria moncytogenes Acquired infection
Acquired listeriosis 0.041 1 0.231 Derived from Intensive care unit admission & infectious diseases, acute episode, severe k
0.06 [22] Permanent disability due
to meningitis 0.25 13 0.266 From lowest to highest motor and cognitive difficultiesc 13.00 [7] Perinatal infection
Symptomatic
infection/meningitis 0.31 1 0.302 Derived from Intensive care unit admission & infectious diseases, acute episode, severe k
0.04 [23] Permanent disability due
to meningitis 0.25 Rem. LE 0.266 From lowest to highest motor and cognitive difficultiesc 13.00 [7] Hepatitis-A virus
Hepatitis - mild (i.e. not
visiting a GP) 0.011 1 0.007 Infectious disease, acute epsiode, mild 0.04 [21] Hepatitis - moderate (i.e.
visiting a GP) 0.058 1 0.051 Infectious disease, acute epsiode, moderate 0.08 [21] Hepatitis - severe (i.e.
Pathogen Health state Old parameters Updated parameters Disability
weight Duration (in years) Disability weightb Description of used disability weight Duration (in years) Source (duration) Hepatitis-E virus
Hepatitis - mild (i.e. not
visiting a GP) 0.011 1 0.007 Infectious disease, acute epsiode, mild 0.08 [21] Hepatitis - moderate (i.e.
visiting a GP) 0.058 1 0.051 Infectious disease, acute epsiode, moderate 0.08 [21] Hepatitis - severe (i.e.
hospitalized) 0.353 0.3 0.125 Infectious disease, acute epsiode, severe 0.16 [21] Toxoplasma gondii
Acquired infection
Chorioretinitis 0.08 Rem. LE 0.015 Conjunctivitis without corneal scarc Rem. LE [7] Congenital infection
Chorioretinitis 0.08 Rem. LE 0.015 Conjunctivitis without corneal scarc Rem. LE [7] Post-1 year chorioretinitis 0.08 Rem. LE 0.015 Conjunctivitis without corneal scarc Rem. LE [7] Intracranial calcification 0.01 Rem. LE 0.088 Derived from intellectual disability,
mild & moderatec Rem. LE [7] hydrocephalus 0.36 Rem. LE 0.232 Derived from motor plus cognitive
impairments, from mild to severec Rem. LE [7] CNS abnormalities 0.36 Rem. LE 0.097 Derived from intellectual disability,
mild & severe m Rem. LE [7]
Used abbreviations: GBS (Guillain-Barré Syndrom); ReA (Reactive arthritis); LE (life expectancy); Rem. LE (remaining life expectancy); CNS (central nervous system); GE (gastroenteritis).
a) For details see Havelaar et al. [7]. b) Source: Haagsma et al. [9].
c) Same description as described in Colzani et al. [16] to be used in the BCoDE model.
d) Assuming that in the first 3 months 50% have an F-score of 1 (motor impairment, mild) and 50% F-score of 2 (motor impairment, moderate). After 3 months 50% have an F-score of 0 (=recovered) and the remaining cases have an F-score of 1 [17, 24]. e) Assuming that 25% require ventilation (= intensive care unit admission) during 0.25 years and severe motor impairment for the
remaining days during the clinical phase. Further assuming that 75% have severe motor impairment for 0.25 years and moderate motor impairment for the remaining days during the clinical phase [17, 25].
remaining cases that 50% have an F1-score (motor impairment, mild) and 50% have an F2-score (Motor impairment, moderate). [17]. g) Assuming 50% and 50%.
h) Same as Colzani et al. [16], but only for the severe ReA cases.
i) Average length on dialyze before transplantation is age-depending and is, acording to Havelaar et al.[19], for 0-15 years; 16-44 years; 45-64 years and 65 years and older ESRD patients on average 2.1 years; 3.4 years; 9.9 years and remaining LE, respectively; graft survival is according to the same authors 19.8 years. But taking into account that some ESRD patients die during dialyze and/or due to transplantation, we assume for simplification that it is 50% ESRD on dialyse and 50% Generic uncomplicated disease: worry and daily medication
j) According to McPherson et al. [26] were all HUS cases admitted at ICU. Jenssen et al. [27] finds severe complications most of them probably requiring intensive care as well. No information on length of ICU is scarce. Hospital duration is according to Ruzante et al. [22], 13.3 days on average; Jenssen et al. [27] reported that HUS patients were sick for 5 to 6 days before hospital admission. For
simplification, we therefore assume 25% ICU and 75% infectious disease, acute episode, severe.
k) According to Ruzante et al.[22] average duration in hospital is 23 days, and according to Haagsma et al. [21], patients stay on average 5 days at ICU; therefore assuming 1/5 ICU and 4/5 infectious diseases, acute episode, severe.
l) According to Bos et al. [23] average duration in hospital is 15 days, and according to Haagsma et al. [21], patients stay on average 5 days at ICU; therefore assuming 1/3 ICU and 2/3 infectious diseases, acute episode, severe
m) Average between mild and severe; Same description as Colzani et al. [16] but with severe as the worst health state rather than moderate as chosen by Colzani et al.[16]. This is more in line with Torgerson et al.[28] and Havelaar et al.[7], who considered CNS abnormalities to be more severe than intracranial calcification.
Table A.3 – Unit cost prices (in 2016 euros) – old and updated values
Unit costs (in 2016 euros) Old unit
costa New unit cost Source
Healthcare costs
Delivery fee for pharmacy (per medication) 6.12 6.08 [13] Additional fee for first time delivery 3.34 6.08 [13]
GP visit/consultation 31.18 33.43 [13]
GP house visit/per consultation 47.88 50.65 [13] GP phone call/consultation 15.59 17.22 [13] Outpatient clinic visit (weighted
mean)/consultation 80.17 81.04 [13]
Emergency department visit/consultation 168.12 262.36 [13] Hospital admission adults in general
ward(weighted mean)/day 508.83 482.18 [13] Hospital admission child in general ward
(weighted mean)/day 661.48 635.14 [13]
Intensive care unit/day 2430.57 2041.16 [13] Revalidation – inpatient/day 378.56 465.97 [13]
Revalidation/hour 122.48 154.99 [13]
Physiotherapy/visit (~0.5 hours) 40.08 33.43 [13] Mentally/physically disabled institutional
care/day 268.99 211.71 [13]
Elderly nursing home/day 268.99 170.18 [13] Transport by ambulance to hospital
(urgent)/trip 561.16 620.96 [13]
Transport by ambulance to revalidation
center or nursing home/trip 270.56 275.53 [13]
Patient/family costs
Car/public transport (per km) 0.22 0.19 [13]
Parking fees (per visit) 3.34 3.04 [13]
Costs in other sectors
Additional costs for special education primary school & kindergarten
(student/year) 18,692 18,692
b secondary school (student/year) 23,804 23,804 b PL due to work absence from unpaid work
(per hour) 13.92 14.18 [13]
PL due to work absence from paid work (per hour)
for average working person 33.42 35.20 [13] for working person between 15-19 years 10.32 9.50 [13]c for working person between 20-24 years 19.50 18.46 [13]c for working person between 25-29 years 26.64 26.19 [13]c for working person between 30-34 years 32.07 32.30 [13]c for working person between 35-39 years 35.91 37.19 [13]c for working person between 40-44 years 37.77 40.30 [13]c for working person between 45-49 years 38.82 41.47 [13]c for working person between 50-54 years 39.65 41.88 [13]c for working person between 55-59 years 40.49 42.10 [13]c for working person between 60-64 years 40.54 41.56 [13]c for average working parenting caregiver 29.22 32.34 [13]d PL due for a fatal case (per death person)
between 20-24 years 6,941 3,071 [13]e between 25-29 years 14,374 7,022 [13]e between 30-34 years 18,283 9,247 [13]e between 35-39 years 19,675 10,458 [13]e between 40-44 years 20,430 10,986 [13]e between 45-49 years 21,179 11,375 [13]e between 50-54 years 20,045 11,026 [13]e between 55-59 years 17,937 9,752 [13]e between 60-64 years 9,086 6,164 [13]e
Used abbreviations: General practitioner (GP); productivity losses (PL)
a) For the details see Mangen et al.[8] Appendix B. Note unit costs were updated to 2016 euros using Dutch consumer price indices
(http://statline.cbs.nl/Statweb/publication/?DM=SLNL&PA=71905ned&D1=a&D2 =0,95-115&HDR=T&STB=G1&VW=T)
b) Same as in Mangen et al.[8], but updated to 2016 euros.
c) Derived based on the average person productivity losses as given by ZIN [13] and age-specific hour earnings as published by Statistic Netherlands (Available at:
http://statline.cbs.nl/Statweb/publication/?DM=SLNL&PA=81431NED&D1=2&D2= 0-15&D3=0&D4=6-7&HDR=G3,G1,T&STB=G2&VW=T).
d) Based on PL estimates presented in the table, on data from Statistics Netherlands for 2014 (Available at:
http://statline.cbs.nl/Statweb/publication/?DM=SLNL&PA=71958ned&D1=0-1,4&D2=a&D3=0,29-30&D4=55,60,65,70,l&HDR=T&STB=G1,G2,G3&VW=T; accessed on: 27-09-2016) and assuming, similar as Mangen et al.[8], that apart from single father households (3.2% in 2014) in all other households the mother is the primary caregiver.
e) Productivity losses for fatal cases were estimated assuming a friction period of 12 weeks [13]. Furthermore productivity losses were based on average working hours as reported by Statistics Netherlands (Available online at:
http://statline.cbs.nl/Statweb/publication/?DM=SLNL&PA=71958ned&D1=0-1,4&D2=a&D3=0,2-11&D4=l&HDR=T&STB=G1,G2,G3&VW=T; accessed on: 26-09-2016) in the corresponding age-groups; but corrected by 18% for bank holidays, vacation, schooling etc. [13] and corrected for the proportion of the population not working in that age-group as reported by Statistics Netherlands (Available online at:
http://statline.cbs.nl/Statweb/publication/?DM=SLNL&PA=71958ned&D1=0-1,4&D2=a&D3=0,2-11&D4=l&HDR=T&STB=G1,G2,G3&VW=T; accessed on: 26-09-2016).
7
Annex II: Detailed results
Table A.4 – Mean incidences by pathogen in the Netherlands, 2012-2016
Pathogen Incidences/year 2012 2013 2014 2015 2016 Campylobacter spp. 101,719 99,575 98,156 88,582 78,968 STEC O157 2,137 2,137 2,137 2,137 2,137 Salmonella spp. 61,358 28,083 27,509 27,371 32,212 Listeria monocytogenes 77 79 96 72 96 B. cereus toxine 50,829 51,277 51,530 51,867 52,119 C. perfringens toxine 169,822 169,795 169,880 170,152 170,625 S. aureus toxine 291,399 290,021 288,473 287,504 286,970 Norovirus 617,374 591,505 584,689 614,517 764,658 Rotavirus 258,234 297,078 124,186 260,719 137,618 Hepatitis-A virus 593 534 514 392 397 Hepatitis-E virusa 617 540 1,335 1,878 1,863 Cryptosporidium spp. a 28,125 52,137 51,752 91,898 108,888 Giardia spp. a 85,766 85,217 84,495 83,784 83,328 Toxoplasma gondii 780 769 776 767 767 Total 1,668,830 1,668,748 1,485,528 1,681,641 1,720,646
a) The estimates that are presented here for 2012-2015 cannot be compared with
earlier estimates due to: new incidence estimates for hepatitis-E virus,
Cryptosporidium spp. and Giardia spp.
Table A.5 – Mean number of fatal cases by pathogen in the Netherlands, 2012-2016
Pathogen Fatal cases/year
2012 2013 2014 2015 2016 Campylobacter spp. 78 77 72 65 57 STEC O157 4 4 4 4 4 Salmonella spp. 67 30 28 28 32 Listeria monocytogenes 8 7 11 16 12 B. cereus toxine 0 0 0 0 0 C. perfringens toxine 5 5 5 5 5 S. aureus toxine 7 7 7 7 7 Norovirus 60 59 60 65 82 Rotavirus 40 47 20 43 23 Hepatitis-A virus 2 2 2 1 1 Hepatitis-E virusa 7 6 15 22 21 Cryptosporidium spp. a 2 3 3 6 7 Giardia spp. a 2 2 2 2 2 Toxoplasma gondii 13 12 12 12 12 Total 294 262 241 276 266
a) The estimates that are presented here for 2012-2015 cannot be compared with
earlier estimates due to: new incidence estimates for hepatitis-E virus,