RIVM report 728001024/2004
Evaluating voluntary climate change initiatives by US business and industry compared with the Dutch experience
R Dave, HE Elzenga, APG de Moor
This research was conducted for the Dutch Ministry of Environment as part of the RIVM International Climate Policy Programme (M/728001 Internationaal Klimaatbeleid)
Abstract
On February 14, 2002 (Valentines Day) President Bush launched the Climate Change Initiative as a new approach on climate change. This approach was completely based on voluntary emission reductions. Voluntary efforts can be an effective approach in
environmental policy and it is a regular policy instrument to be considered. However,
voluntary efforts do require certain conditions and key factors to be successful and efficient.
This report evaluates voluntary climate change initiatives by US business and industry geared to reducing greenhouse gases. We conclude that most of them do not even meet the minimum requirements to be qualified as serious efforts. They lack sufficient information, ambition and direction. Targets are unclear, and in most cases, the information and data fail to assess or even calculate the impact of these initiatives on greenhouse gases. The lack of good
governance and transparency at governmental and industrial levels points to a serious gap in the US climate policy framework.
Experiences with voluntary approaches in the Netherlands demonstrate several lessons and success factors for improving the effectiveness and feasibility of the US voluntary efforts. Besides clear and unambiguous targets and timetables, a more formal and explicit agreement between the federal government, and business and industrial organisations, would offer a sound starting point and framework. An explicit system for measuring, monitoring and reporting is also essential. Such a monitoring system and database would also allow actions by various companies to be registered and lead to the building of an infrastructure for a future emissions trading regime. A compliance regime would also be appropriate, for instance, with upper and lower limits for each sector or company, with public accountancy on progress and compliance, including publicity on non-compliant companies. An annual assessment, or an official mid-term review in 2007, can contribute to further assessment of progress and make the US voluntary efforts more credible. Following the Dutch experience, these tasks can be effectively delegated to an independent organisation. Finally, a political option to induce compliance is to have the (federal) government develop fall-back policies, including alternative policy instruments or, as a last resort, introduction of financial penalties as punitive measures.
Preface
This study was conducted at the RIVM National Institute for Public Health and the
Environment for the Dutch Ministry of Environment within the International Climate Policy Programme (M/728001 Ondersteuning Klimaatbeleid). We would like to thank Kevin Baumert of WRI for providing us with useful information on the voluntary business
initiatives. We would also like to thank our colleagues at the RIVM, in particular Bert Metz, Joop Oude Lohuis and Detlef van Vuuren, for their comments and inputs.
Contents
SAMENVATTING 5
1 INTRODUCTION 6
2 THE BUSH CLIMATE CHANGE INITIATIVE 7
3 POLICY FRAMEWORK AND VOLUNTARY CLIMATE CHANGE EFFORTS BY US BUSINESS
AND INDUSTRY 9
4 DUTCH EXPERIENCE WITH VOLUNTARY EFFORTS 13
5 EVALUATION OF US VOLUNTARY CLIMATE CHANGE EFFORTS 15
REFERENCES 18
Samenvatting
Op Valentijnsdag 2002 presenteerde President Bush zijn Climate Change Initiative. Dit plan berustte voor een groot deel op vrijwilligheid, waaronder vrijwillige emissiereducties door het bedrijfsleven. Vrijwillige inspanningen kunnen zeker effectief zijn en vormen daarom een regulier instrument in milieubeleid. Maar ze vereisen wel een aantal randvoorwaarden en succesfactoren om effectief te zijn.
Deze rapportage evalueert de vrijwillige initiatieven van het Amerikaanse bedrijfsleven om invulling te geven aan het Climate Change Initiative van President Bush. Het merendeel van deze vrijwillige initiatieven voldoet niet aan het minimum voorwaarden om als effectief te kunnen worden beschouwd. Zoals die kunnen worden afgeleid van ervaringen in Nederland en andere OESO landen. Er is een groot gebrek aan transparantie, ambitie en structuur. Doelstellingen zijn onduidelijk en in de meeste gevallen is er geen of onvoldoende informatie om het effect op de broeikasgasemissies te kunnen berekenen. Dit gebrek aan transparantie en goed bestuur op zowel overheids- als bedrijfsniveau is een ernstige belemmering voor de inzet van vrijwillige inspanningen.
Naast heldere en eenduidige doelen en tijdpaden ontbreekt bijvoorbeeld een formele en expliciete overeenkomst tussen de federale overheid en bedrijfsleven die het beleidskader bekrachtigt. Bovendien is er geen expliciet systeem voor het meten, monitoren en rapporteren over de voortgang. Dat zou juist in de Amerikaanse situatie van belang kunnen zijn om reductie- inspanningen en resultaten van bedrijven te registreren en daarmee de basis te leggen voor een eventueel toekomstig systeem van emissiehandel. Tevens ontbreekt een nalevingregime met onder- en bovengrenzen voor individuele bedrijven. Openbare rapportage over de geleverde prestaties van bedrijven is van groot belang evenals een tussentijdse evaluatie van de vrijwillige initiatieven met de mogelijkheid om bij te sturen. Tot slot zijn terugvalopties voor beleid, zoals energie belastingen, als stok achter de deur belangrijk om naleving van vrijwillige afspraken door het bedrijfsleven te bevorderen.
1
Introduction
On February 14, 2002 (Valentine’s Day) President Bush launched the Climate Change Initiative as a new approach on climate change (White House, 2002b). The philosophy behind this new approach was that economic growth is not so much the problem, but rather the solution. In this paradigm, safeguarding growth would enable the development of new, clean technologies for de-linking economic growth and greenhouse gas emissions in the long term. The Bush Climate Change Initiative, therefore, aims to cut greenhouse gas emissions relative to economic output, adopting a voluntary target of 18 per cent reduction in the greenhouse gas intensity of the US economy in a 10-year period.1
Voluntary emission reductions by business and industry were among the set of policies and measures included in the Bush Climate Change Initiative. Recently, several major initiatives by US business and industry were presented as a contribution to meeting the US greenhouse gas intensity target (US Fact Sheet, 2003). The note, in which the US federal government acknowledges these initiatives, reports various voluntary targets across large companies and in the energy, manufacturing, transport and forest sectors. Here, we aim to shed some light on the initiatives presented by the US business and industry as being sufficiently substantive and credible in meeting the US intensity target, with the objective of answering the following questions:
• What can be said about the quantitative implications of the sector targets on greenhouse gas emissions (Section 3)?
• What are the conditions and lessons from experiences with voluntary approaches in environmental policy in the Netherlands (Section 4)?
• Learning from experience, what can we say about the effectiveness of US business and industry voluntary programmes (Section 5)?
Initially, we aimed at examining all US business and industry initiatives. However, as it turned out, the information and data were clearly insufficient for a proper assessment. For this reason, we have focused specifically on such sectors as electricity generation, semiconductor manufacture, chemical production and automobiles where sufficient information is provided. An earlier RIVM assessment of the Bush Climate Change Initiative has served as a
background for this evaluation (De Moor et al., 2002).
1 The greenhouse gas intensity of the US economy is defined as the total amount of greenhouse gas emissions
2
The Bush Climate Change Initiative
The Bush Climate Change Initiative aims to reduce the greenhouse gas intensity of the US economy by 18 per cent between 2002 and 2012.2 An earlier RIVM evaluation by De Moor et al. (2002) characterises this policy target as modest in quantitative terms on the basis of the two following comparisons:
• Comparing to the historical (autonomous) trends, the 18 per cent policy target set by the Bush administration is close to the 23 per cent improvement in the greenhouse gas intensity in the 1980s and 17 per cent in the 1990s.
• From the policy target angle, it appears that no additional policies are needed to meet the US policy target. This can be observed at the upper boundary of baseline projections made by official US sources e.g. the Department of Energy (see Figure 1). Other baseline projections from the IMAGE model also forecast an autonomous improvement in the greenhouse gas intensity, ranging from 14-20 per cent.
140 160 180 200 220 1995 2000 2005 2010 2015 C -i n t (tC -e q /M $20 01 ) Historic Bush BL Bush Initiative AEO-h AEO-l 183
Figure 1: Development of carbon equivalent intensity under the baseline and target scenarios of the Bush Initiative compared to the high and low economic growth scenarios of the Annual Energy Outlook (EIA, 2001). Source: De Moor et al. (2002).
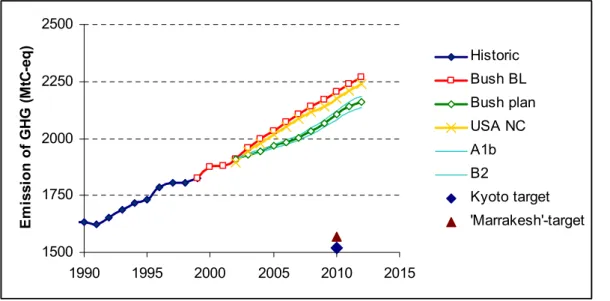
According to the RIVM evaluation, the policy target in the Bush Climate Change Initiative is by far insufficient in realising an absolute decrease in US greenhouse gas emissions.3 Instead, US 2010 emissions, including the effort of policies to meet the intensity target, will still come out 32 per cent above the 1990 level, with only a modest 7 per cent decrease in relation to the baseline emissions (see Figure 2).4 WRI (2002) confirms this evaluation, indicating that the US policy target is similar to past emission growth rates. In fact, according to the WRI
2 This target translates into a reduction from 183 ton carbon equivalents (tC-eq) per million US$2001 in 2002 to
151 tC-eq in 2012.
3 Historically, US greenhouse gas emissions (excluding sinks) have been growing continuously at an average
rate of 1.3 per cent per year since 1990, resulting in greenhouse gas emissions of 1874 MtC in 2000. This is an increase of 14 per cent above 1990 levels.
4 This is far above the original Kyoto target for the US of –7 per cent in 2010 (or –3 per cent corrected for
conclusions, US emissions will rise nearly 30 per cent in 2010 compared to 1990 levels, taken into account in the Bush Initiative.
1500 1750 2000 2250 2500 1990 1995 2000 2005 2010 2015 E m is si on of G H G ( M tC -e q) Historic Bush BL Bush plan USA NC A1b B2 Kyoto target 'Marrakesh'-target
Note: A1b: refers to IMAGE/IPCC scenario B2 refers to IMAGE/IPCC scenario
Figure 2: US historical and projected greenhouse gas emissions under different baselines (excluding sinks). The rhombus shaped figure indicates the original 7 per cent emission reduction target for the US under the Kyoto Protocol and the single triangle the target after the Marrakech Accords. Two IMAGE baseline scenarios, A1b and B2, have also been included. Source: De Moor et al. (2002).
The Bush Climate Change Initiative can be viewed as an important positive political signal. It explicitly accepts the importance of the climate change problem and the long-term objective of the Climate Change Convention. It is, however, mainly of political significance, falling short in quantitative terms. In addition, the earlier RIVM evaluation by De Moor et al. (2002) also indicated serious flaws and risks associated with the Bush Climate Change Initiative. First of all, there is the risk of failing to meet an intensity target in times of economic downturn or recession. Experience shows that business and industry support for climate policy may disappear in times of economic slowdown. Companies may be unwilling to make the necessary investments and the intensity target may then be out of reach. Another risk for policy failure concerns non-compliance by business and industry, simply because clear rules for corporate participation or penalties in case of non-compliance are lacking. The entire Initiative is based on voluntary participation but without any guarantee or financial
consequences if the target is not met. Voluntary approaches, including those in environmental policy, can indeed form useful policy instruments, but require, at the very least, strict rules and monitoring to assess whether actions are real or would have occurred anyway (see also Sections 4 and 5). Finally, the Bush Climate Change Initiative explicitly anticipates the moment for evaluating US progress in meeting the policy target; however, this moment doesn’t dawn until the end of 2012. By that time it is too late to induce additional action if needed.
3
Policy framework and voluntary climate change
efforts by US business and industry
The Bush Climate Change Initiative includes various policies and measures to meet the US policy target.5 Among other factors, it aims to promote voluntary emission reduction measures by establishing performance agreements and partnerships with business and industry.
The Energy Policy Act of 1992, directed to the US Department of Energy (DoE), together with the Energy Information Administration (EIA) as the implementing agency, provides for development of a programme to document voluntary actions that reduce emissions of
greenhouse gases or remove them from the atmosphere.6 A result was the Voluntary
Reporting of Greenhouse Gases Programme, developed in co-operation with the DoE Office of Policy and International Affairs and the US Environmental Protection Agency (EPA). In addition to providing recognition for entities that reduce greenhouse gas emissions or
sequester carbon voluntarily, the Programme serves to identify innovative and effective ways of reducing emissions (EIA, 2000).
There are several voluntary initiatives taking place at the federal level, including the Clean Cities Project, Building America and RESOLVE. The Clean Cities Programme is
administered by the US DoE and includes an initiative that encourages the purchase of
Alternative Fuel Vehicles. The targets for this initiative is to gradually increase the number of light duty vehicles running on alternative fuel and bought at a federal, state or utility level. For example, the target for state vehicles would increase from 25 per cent of the total in 1999, to 50 per cent in 2000 and to 75 per cent in 2001 (Clean Cities, 2003).
The mission of Building America is to work with the residential building industry to produce communities of homes that use 30 to 50 per cent less energy than the average residential community. In addition to reducing consumer energy bills, Building America helps homebuilders reduce construction time and waste by as much as 50 per cent. A “systems engineering” approach is used to design and construct homes and to implement innovative energy- and material-saving technologies. Building America is a joint effort using DoE funding for the research and development of new technologies, with the National Renewable Energy Laboratory providing technical support and the Oak Ridge National Laboratory co-ordinating Research & Development outreach and implementation support (Building America, 2003).
Within the Bush Climate Change Initiative, the US Business Roundtable has launched Climate RESOLVE7, an initiative to mobilise the resources and expertise of the 150 member companies and enhance voluntary actions towards reducing the greenhouse gas intensity of the US economy. Climate RESOLVE favours voluntary actions as it regards this as the best way to deliver continued economic growth while minimising the risks of climate change’.
5 The initiative points, for example, to an increase of federal funding for climate change policies through tax
incentives for renewable energy, transportation policies supporting the promotion of research, and development of fuel-efficient and clean vehicles. Furthermore, the plan aims to improve the registration of emission
reductions and offer better prospects for using registered credits to comply with future climate policies. This would render early action by business and industry economically (more) attractive.
6 See also the discussion on The Energy Policy Act of 1992, Sections 1605(b) and (c). 7 Responsible Environmental Steps, Opportunities to Lead by Voluntary Efforts.
Although the US Business Roundtable will release its first annual public performance report by mid-2004, we have taken first steps towards assessing the actual feasibility of the targets set by the various US businesses and industries. This evaluation draws heavily on a report by the World Resources Institute (WRI, 2003).
Table 1. Voluntary initiatives by US business and industry: overview and feasibility
Industry What is the objective? Share of US emissions
Quantitative Implication (as interpreted by the authors)
Oil & gas production, transportation &
refining
60% of US refining capacity aimed at increasing aggregated
energy efficiency by 10% by 2012
2.9 % incl. natural gas
flaring8
GHG impact can not be determined as it is defined in energy efficiency (impact partly
depends on carbon content of fuels) Electricity
generation
Reducing carbon intensity in this decade by 3 – 5%
33.6% 5% target still leads to 17.7% increase in CO2 emissions over the decade.
Coal production
& mining 70% primary electric fuel producers achieving 10% increase in efficiency
0.9% direct methane emissions
Not possible to evaluate as information, data and details are lacking Cement
manufacture production process, product and 3-part programme to enhance application
0.6 % direct and
1.1% indirect GHG impact can not be determined (depends on cement manufacture projections)
Iron & steel
production 75% of steel producing capacity to achieve 10% increase in sector-wide average efficiency
0.9% direct 2.9% incl.
indirect
Not possible to evaluate as information; data and details are lacking (use of metric,
activities and emissions) Semiconductor
Industry potent GHG emissions by 10% Reducing 10% of the most 0.1% Emissions have been steadily declining by 7.3%, hence the need for an additional 2.7%
Magnesium coalition
Phasing out SF6 in production by 2010, 80% reduction in
casting & recycling
0.05% Important greenhouse gas, still overall impacts of SF6 on US emissions negligible Chemical
production reduce GHG intensity reduction 90% of chemical industry to by 18% by 2012 from 1990
4.7% Not possible to evaluate as information; data and details are lacking (use of metric,
activities and emissions) Aluminium
production EPA partnership to reduce sector-wide GHGs 1% incl. indirect 0.1% PFCs only No new commitment (already announced voluntary efforts to reduce PFCs) Railroads ReducingGHG intensity by 18%
in the 10 years. Not reported Not possible to evaluate as information; data and details are lacking Automobiles Reducing GHG emissions from
manufacturing facilities by 10% by 2012 (based on US vehicle production with a 2002 baseline) 25.6% of total transportation- manufacture
Target applies to the manufacture of cars, not emissions from cars
Forests and
paper Reducing GHG intensity by 12% by 2012 unclear sector Unknown, boundaries
Not possible to evaluate as information, data and details are lacking (use of metric,
activities and emissions)
Source: primarily based on WRI (2003).
Table 1 demonstrates that most US voluntary initiatives are rather poorly defined and lack concrete data and detail:
• In most cases the information on baselines is lacking.
• There are no clear boundaries between the sector targets; some overlap while others call for counter measures in other sectors. An example of this is the oil and gas industry; counteracts are felt in electricity generation due to the interdependence of common goods. • Targets are set but no concrete steps are being taken (there is no information about what
the sector is going to do).
• The greenhouse gas impact of any intensity-based target will depend on future activity levels, but as these baseline levels are mostly unknown, the impact can not be estimated.
Without meaningful accounting systems and more specific information, it is not possible to properly evaluate the voluntary initiatives or even reasonably estimate the greenhouse gas impact of the targets. The foregoing specifically applies to initiatives and targets in the oil and gas sector, coal production and mining, cement manufacture, iron and steel production, chemical production, railroads and the forest and paper sector. Together, these sectors account for roughly 15 to 20 per cent of total US emissions.
The largest contributor to US emissions is electricity generation (33.6 per cent). In this sector, the proposed target is to improve carbon intensity by 3-5 per cent by 2010, which is fairly close to the 1.2 per cent autonomous improvement per year. Even with an effective
implementation of the initiative, greenhouse gas emissions are projected to grow by between 17.7 and 20.1 per cent above 2002 levels in 2012.
Transportation is the second largest emitting sector (25.6 per cent). Here, voluntary action may turn out hardly effective in reducing greenhouse gas emissions as the target is directed at the car manufacturing process and not at emissions from cars. Furthermore, the commitment also states that members of the Automobile Alliance are in a research partnership with DoE to accelerate the development of “inherently clean” fuel cell technology. However, no timetable for introduction of such technologies on the market is given.
In other sectors like semiconductors and magnesium, the targets are laudable, although they represent small fractions of total US emissions.
The voluntary climate change initiatives by US business lack sufficient information, ambition and direction. Just as the Bush Climate Change Initiative lacks key elements of good
governance, US business and industry have failed to clearly define targets and timetables. Hence, they do not meet the minimum information requirements to be qualified as serious efforts.
Additional insights into the overall US climate change initiatives show that the case is not as dire as what was derived from the examining the US Business Roundtable and the Bush Climate Change Initiative. Some of the other initiatives taking place in the United States (not yet found at the federal level) could have a powerful impact on the way climate change initiatives are looked upon and dealt with at a federal level. These initiatives include: a) Initiatives at state and community level
b) Initiatives by individual companies such as DuPont
c) Activities carried out under the hat of the Rockefeller Brothers Fund
d) A proposal by the Senators McCain and Lieberman – “Climate Stewardship Act of 2003”
Firstly, the Rockefellers Brothers Fund is undertaking activities supporting strategies to combat global warming. It seeks to contribute to international cooperation on this issue.
Strategies:
• Advancing cost-effective energy efficiency and renewable energy-based approaches to reducing greenhouse gas emissions.
• Building public and policymaker understanding of the threat of global warming and support for a range of actions to address this problem.
• Supporting efforts to strengthen and advance co-ordinated international action and policy, which are particularly critical to the mitigation of global warming.
The unique qualities of the strategy of the Rockefeller Brothers Fund can be seen by the various conferences it hosts to bridge the gap in the combat of global warming between various parts of the society, and between the US and the European perspectives.
Recently, the Rockefeller Brothers Fund hosted a conference to initiate a dialogue between companies and governments from various European countries, Canada, Australia and different states in the US that have made a beginning in reducing greenhouse gas (GHG) emissions successfully. Many are discovering that it is cost effective, even profitable, to do so. At a first-of-its-kind meeting of leading corporate and government greenhouse gas reducers from the US, Canada, Europe and Australia, speakers offered upbeat descriptions of their efforts.
The Climate Stewardship Act of 2003, the legislation proposed by Senators John McCain and Joseph Lieberman, suggests an alternative to the existing approaches for addressing climate change in the United States, and cased on a new broad, flexible and domestic framework. The McCain-Lieberman approach will require domestic, mandatory and
economy-wide emission reductions. While specific emission limits will likely be the subject of lengthy debate, the architecture of the emission-trading programme is viewed in this bipartisan bill to be a significant step forward (Pizer et al., 2003).
Experience with voluntary initiatives elsewhere, for example in the Netherlands, provide a basis to identify in more detail the differences in US voluntary initiatives; this will be further explained in Chapter 4.
4
Dutch experience with voluntary efforts
Since the beginning of the 1990s, voluntary agreements have been used in several European countries, mostly in the industry and waste management sectors. Over 300 were established in 1996.9 The Netherlands and Germany are front runners; other countries that employ this instrument are usually small countries with a tradition of decentralisation, negotiation and striving for consensus. In theory, voluntary efforts can be effective policy instruments if there is support from participants and the necessary measures to comply are not too costly. The degree of success is also dependent on the extent to which business sectors or “covenants” are organised. Finally, voluntary approaches are also able to raise awareness and create commitment from management.
In the Netherlands, voluntary efforts, entitled “agreements”, have been a widely used policy instrument in the 1990s. In many sectors and for a variety of environmental problems, the Dutch government has often chosen to follow an approach based on voluntary agreements rather than the classical command-and-control approach. In some cases, these agreements have resulted in a serious absolute emission reduction. For example, “Hydrocarbons 2000” in the chemical industry resulted in a 70 per cent reduction in VOC emissions in the period 1981–2000. An important factor in explaining the success of this covenant is that VOC emissions in the chemical industry are closely related to expensive product losses. Other voluntary agreements, like the Long Term Agreements on Energy Efficiency (LTAs) and the packaging agreement, have also demonstrated their success in meeting targets.10 In other cases, agreements have failed, primarily due to a lack of support from industry (RIVM, 2002).
The Long Term Agreements on Energy Efficiency (LTA) are a formally signed agreement between the Ministry of Economic Affairs and the sector organisations committed Dutch industries to improve energy efficiency (energy use per unit of production) by an average of 20 per cent over the period 1989-2000.11 Key features of the LTA are:
• the basic principle of “no regret”: companies are only expected to take measures that match their regular cost-effectiveness criteria for investments. In general, companies require a pay-back-period of three years or less. New installations should be state-of-the-art, assuming they are economically sound.
• targets set for sectors as a whole, not for individual companies. Companies contribute according to their ability, but in most cases, the target has been 20 per cent efficiency improvement. This number is the result of a (rough) ex ante assessment of the energy-saving potential based on regular investment criteria.
• the voluntary basis: although companies are committed to meeting their targets, there are no legal sanctions (like fines) for non-compliance.
• that an independent organisation (Novem) acts as facilitator by giving information on technological options and by supplying financial support for research, development and demonstration projects. This independent organisation is also responsible for monitoring
9 OECD, 1999, RIVM 2002.
10 These targets were defined relative to production and the improvements were outweighed by economic
growth. Hence, in absolute terms the environmental burden has still increased.
progress, with the companies themselves supplying the necessary information and data on an annual basis.12
• confidentiality of company data as a key condition for companies. Annual progress reports by Novem are published on a sector level only. Company data are not available to third parties.
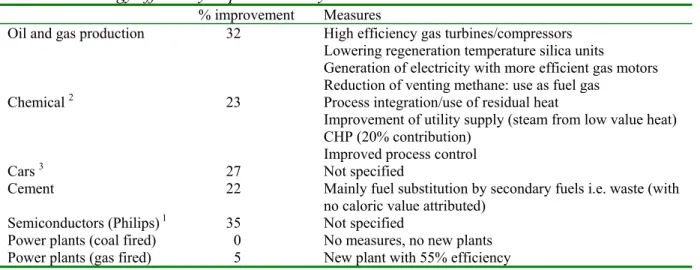
Table 2 shows the actual energy efficiency improvement in the period 1989-1999 (LTA sectors) or 1990-2000 (power plants).13 It also shows that, apart from power plants, energy efficiency of Dutch business sectors has improved by more than 20 to 30 per cent based on expert opinion, the firm’s own perceptions and in comparison with historical developments. Rietbergen (1999) has estimated that, on average, one-third to one-half of the energy savings can be attributed to the LTA.
Table 2. Energy efficiency improvement by Dutch sectors in the last decade
% improvement Measures
Oil and gas production 32 High efficiency gas turbines/compressors Lowering regeneration temperature silica units
Generation of electricity with more efficient gas motors Reduction of venting methane: use as fuel gas
Chemical 2 23 Process integration/use of residual heat
Improvement of utility supply (steam from low value heat) CHP (20% contribution)
Improved process control
Cars 3 27 Not specified
Cement 22 Mainly fuel substitution by secondary fuels i.e. waste (with no caloric value attributed)
Semiconductors (Philips) 1 35 Not specified
Power plants (coal fired) 0 No measures, no new plants Power plants (gas fired) 5 New plant with 55% efficiency
1 Philips produces not only semiconductors; the sectors, Semiconductors and Lighting, dominate energy use. 2 This concerns only energy carriers for energetic purposes (no feedstock).
3 Calculation for the period 1996-2001: primary energy use per car. Sources: Ministry of Economic Affairs (2000) and Ecofys (2003).
The principle reason for most sectors to join the LTA was that the Dutch government was seriously contemplating the introduction of an energy tax to stimulate industrial energy savings.
Signing up to the LTA was seen as a way to avert this tax. Another important reason was that the LTA allowed participants to benefit from the active support from Novem. This can be advantageous, especially for small companies. Another success factor is that the sector is well-organised with a strong and sector branch organisation. Finally, the reason that most sectors take serious efforts to meet their LTA targets is the annual and public reporting of their progress. Sectors want to avoid negative publicity resulting from failing to meet their targets.
As can be observed the “good practice” system of voluntary agreements found in the Netherlands is fairly different from the approach adapted by the US. This also applies to comparable efforts in other OECD countries (OECD, 1999).
12 The choice of Novem was based on their years of experience with implementing subsidy and information
programmes on such topics as energy saving in industry.
5
Evaluation of US voluntary climate change efforts
The key question is whether the success factors for effective Dutch agreements will apply to the US situation. Based on theory and the Dutch experience, the success factors for voluntary agreements are:
a) clear definition of targets;
b) a formal policy framework between the government and the participating organisations; c) commitment from management;
d) targets that can be met with measures that fulfil regular investment criteria, without impinging too much on competitiveness;
e) support by an independent, qualified organisation; f) regular monitoring of progress and publication;
g) the possibility of government intervention through tougher regulation or taxation as a fallback option.
The previous chapters have indicated that the voluntary initiatives by US business fail to meet most of the above success factors. The US effort lacks clear definitions (a), a formal policy framework(b),and an independent organisation to monitor and facilitate the efforts (e and f). Furthermore, a potentially more vigorous policy intervention (g) as an alternative “stick” to motivate compliance by US business is not considered by the US government.
These conclusions are directly in line with the recommendation of the OECD for devising voluntary approaches (OECD, 1999).
We further conclude that as several fundamental success factors are not realised, it is likely that the US initiatives will fail to meet their (even modest) targets, especially in the current times of economic downturn (see Chapter 2).
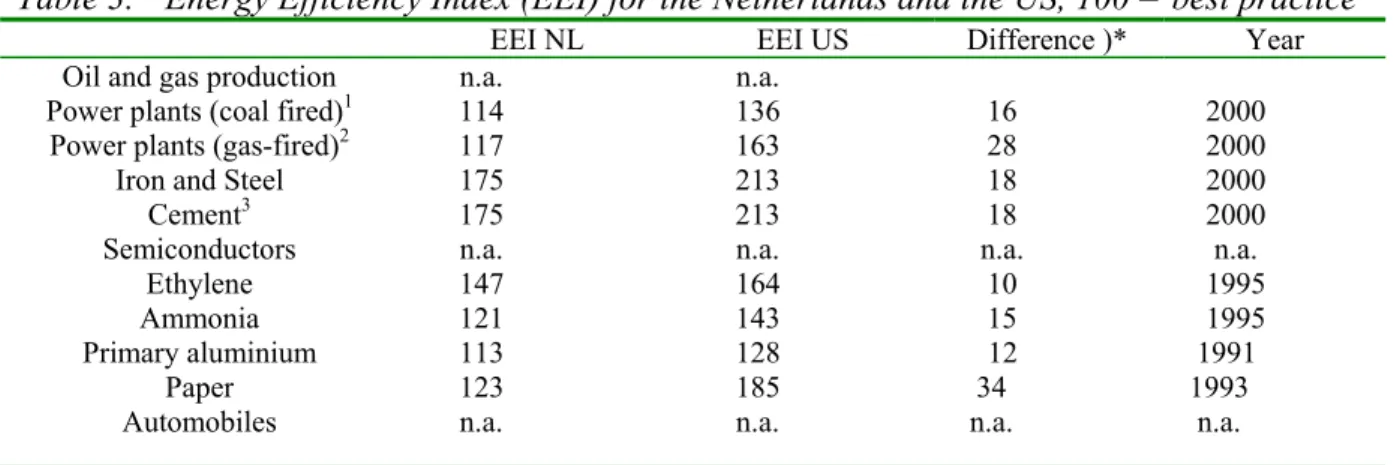
As regards success factor “d”: meeting targets with measures that fulfil regular investment criteria), the starting point of US industry is relevant. If, for example, US sectors are already highly energy-efficient, further improvement may be very costly. However, the data in Table 3 on energy efficiency indexes for the US and the Netherlands suggest that this is not the case. On average, the US industrial sectors are between 10 to 34 per cent less energy-efficient than their Dutch counterparts.14 In fact, the efficiency of US sectors is comparable to the Dutch situation in the early 1990s. The Dutch experience with the LTA programme suggests that US energy efficiency can be further improved with measures that meet regular
investment criteria. However, US criteria, on payback periods might be different from the Dutch business sectors. The payback period is generally longer in the Netherlands compared to the US, commonly 3–4 years versus 2–3 years. This is partly reflected with lower interest rats you can accept longer payback periods.
Table 3. Energy Efficiency Index (EEI) for the Netherlands and the US, 100 = best practice
EEI NL EEI US Difference )* Year Oil and gas production n.a. n.a.
Power plants (coal fired)1 114 136 16 2000
Power plants (gas-fired)2 117 163 28 2000
Iron and Steel 175 213 18 2000
Cement3 175 213 18 2000
Semiconductors n.a. n.a. n.a. n.a.
Ethylene 147 164 10 1995
Ammonia 121 143 15 1995
Primary aluminium 113 128 12 1991
Paper 123 185 34 1993
Automobiles n.a. n.a. n.a. n.a.
1 EEI calculated reference to 45% (best practice). 2 EEI calculated reference to 55% (best practice). 3 Including waste fuels
n.a. = not available
)* Note: The difference is a gap between the Dutch and US industry in percentage points, for example, the
difference for coal-fired power plants, is calculated by:
114/136 * 100 = 83.8, 100-83.8 = 16.2 and therefore given a value of 16 per cent. Source: Ecofys (2003) for 2000 and Groenenberg (2002) for 1995.
The Dutch experience shows that a strict and explicit compliance regime, including financial penalties, is not necessarily required to be successful. However, some formal public framework is required to guide the voluntary efforts. This can be in the form of threats of alternative policy instruments, e.g. taxes, or in compliance measures. Certainly, when most criteria for successful application are absent, strong compliance measures seem appropriate. As De Moor et al. (2002) have argued, compliance of voluntary initiatives can be increasingly difficult in times of economic downturn. As the current growth projections for the medium term indicate that the next four years might be economically slow, the voluntary initiatives by US business will probably face a difficult couple of years with serious risks of non-compliance.
References
Building America, May 20, 2003, see http://www.nrel.gov/docs/fy02osti/30858.pdf
Clean Cities Program, May 22, 2003, see http://www.ccities.doe.gov
Ecofys, 2003, International comparisons of energy efficiency, results for iron & steel, cement and electricity generation, Ecofys, Utrecht, March 2003.
Groenenberg, H., 2002, Development and convergence, a bottom-up analysis for the differentiation of future commitments under the Climate Convention. PhD thesis, Utrecht University, Utrecht, the Netherlands 2002
IMF, April 24, 2003, Statistical Appendix, see
http://www.imf.org/external/pubs/ft/weo/2002/02/pdf/appendix.pdf
Meerjarenafspraken energie-efficiency, resultaten 1999. Ministry of Economic Affairs, The Hague (in Dutch), 2000.
Moor, A.P.G. de, Berk, M.M., Elzen, M.G.J. den, Vuuren, D.P. van, 2002. Evaluating the Bush Climate Change Initiative. National Institute for Public Health and the Environment (RIVM), RIVM-report no. 728001019, Bilthoven, the Netherlands, 2002
OECD, 1999, Voluntary Approaches for Environmental Policy- An Assessment, Paris, France
Pizer, W.A. and Kopp, J. 2003, Summary and Analysis of McCain-Lieberman- Climate Stewardship Act of 2003, Resources For the Future, Washington, D.C. USA, see
http://www.rff.org/rff/News/Features/Understanding-the-McCain-Lieberman-Stewardship-Act.cfm
Rietbergen, M. et al., 1999, The environmental performance of voluntary agreements on industrial energy efficiency improvement. Department of Science, Technology and Society, Utrecht University, Utrecht, the Netherlands, 1999.
RIVM, 2002, Het Nederlandse milieu verklaard. RIVM Milieu- en Natuurplanbureau, (in Dutch), Bilthoven, the Netherlands, 2002.
Voluntary Reporting of Greenhouse Gases 2001, May 20, 2003, see
http://www.eia.doe.gov/oiaf/1605/vrrpt/chapter1.html
US information, March 1, 2003, Fact Sheet: US Industry Initiatives Aims to Reduce
Greenhouse Gas Emissions, see http://usinfo.state.gov/topical/global/climate/03021302.htm
White House, 2002a, Executive Summary of Bush Climate Change Initiative, see
White House, 2002b, Transcript of the speech of President Bush delivered at NOAA in Silver Spring, 14 February 2002, see http://www.whitehouse.gov/news/releases/2002/02/20020214-5.html
World Resources Institute, 2003, Quick Evaluation of Business and Industry Voluntary Targets. WRI, Washington D.C.
Mailing list
RIVM
1. Dhr. N.D. van Egmond 2. Dhr. F. Langeweg 3. Dhr. R. Maas
4. Dhr. A. van der Giessen 5. Dhr. B. Metz
6. Dhr. O.J. van Gerwen
VROM 7. Mw. T. Fogelberg 8. Mw. H. Bersee 9. Mw. T. Zwartepoortte 10. Dhr. J. Lenstra 11. Dhr. E. Mulders 12. Dhr B. Borst 13. Dhr. H. Nieuwenhuis 13. Dhr. H. de Waal 14. Dhr Y. de Boer 15. Dhr H. Baaijen 16. Dhr. R. Brieskorn 17. Dhr. C. Moons 18. Dhr. H. Sips 19. Dhr. F. Vlieg EZ 20. Dhr. H. Brouwer 21. Dhr. P. Tops 22. Dhr. H. de Groene 23. Dhr. H. Heijkers 24. Mw. L. de Maat 25. Dhr. D. Pietermaat 26. Dhr. P. van Slobbe 27. Dhr M. Blanson Henkemans 28. Bibliotheek 33-50. Team KMD 51-60. Team NMD 61-70. Team LED 71-100. Auteurs
101. M. Nothrop- Rockerfeller Brothers Fund
102. Depot Nederlandse Publicaties en Nederlandse Bibliografie 103. SBC/ Communicatie
104. Bureau Rapportenregistratie RIVM 105. Bibliotheek RIVM
106-110. Bureau Rapportenbeheer RIVM 111-151. Reserve exemplaren