Environment and health within the OECD-region: lost health, lost money | RIVM
59
0
0
Hele tekst
(2) page 2 of 59. RIVM report 402101 001. Abstract This study assessed the environmental health impact within the OECD region, both in terms of lost health and lost money. 2-5% of the total Burden of Disease (BoD) was attributed to environmental factors. Environmental health loss in the OECD high income subregion was monetary valued at US$45-140 billion (or US$53-160 per capita, central estimate). First, environment attributable fractions of the BoD of 16 diseases with high disease burdens were assessed and total environmental BoD was estimated at: OECD region 2-5% (nonOECD 8-12%, world 7.5-11%). Second, an economic valuation of the environmental health impact was performed. Applying the above percentages to the total health expenditure resulted in OECD environmental health costs of 45-110 billion US$ (40-100 $/capita). However, since health expenditures only apply to morbidity, morbidity and mortality costs were also estimated separately. Environmental morbidity costs were obtained using diseasespecific direct costs of illness, environmental mortality costs were based on a monetary valuation of the years of life lost, first as GDP per capita and second by using willingness-topay values for death divided by lost life expectancy. This finally lead to three different estimates of environmental health costs in the OECD high income region: a lower estimate of US$30-95 billion (US$35-105 per capita), a central estimate of US$45-140 billion (US$53160 per capita), and an upper estimate of US$215-680 billion (US$240-775 per capita)..
(3) RIVM report 402101 001. page 3 of 59. Preface We wish to thank our colleagues of the Environment Health and Safety Division of the Environment Directorate of the OECD for their co-operation, close reading, worthwhile suggestions and welcoming spirit in springtime Paris, especially Niels Schenk and Robert Visser. We also thank our RIVM colleagues who valuably commented, especially Jan Bakkes, Paul Fischer, Rudolf Hoogenveen, Danny Houthuijs, Fred Langeweg, Erik Lebret and Marten Marra..
(4) page 4 of 59. RIVM report 402101 001. Contents Samenvatting. 5. Summary. 6. 1.. Introduction. 7. 2.. Transitions in environmental risks and health. 9. 3.. Concepts and measures of health and environment. 4.. 5.. 6.. 13. 3.1. What is health?. 13. 3.2. What is environmental health?. 14. 3.3 The relation between health and environment 3.3.1 Determinants of health: complex relations and interactions 3.3.2 How much ill health can be attributed to the environment: ‘attributable risk’. 16 16 18. 3.4 Measuring environmental health impact 3.4.1 Indicators of morbidity 3.4.2 Indicators of mortality 3.4.3 An aggregate health impact indicator. 20 20 21 22. 3.5. 24. Monetary valuation of environmental health impact. Environmental health impact in the OECD. 27. 4.1 Estimating the environmental burden of disease 4.1.1 Burden of disease in the OECD 4.1.2 Estimating the environmental burden of disease in the OECD 4.1.3 Disease specific estimates of environment attributable risk. 27 27 28 29. 4.2 Estimating environmental health costs 4.2.1 Environmental burden of disease costs as estimated by total health expenditure 4.2.2 Estimating costs of environmental morbidity and mortality burden separately. 36 36 37. Selected environmental health issues and monetary studies. 43. 5.1 Selected environmental health issues 5.1.1 Chemicals 5.1.2 Specific groups 5.1.3 Changing global environment and effects upon human health. 43 43 43 44. 5.2 Selected studies concerning environmental health costs and benefits 5.2.1 Health costs due to road traffic-related air pollution 5.2.2 Costs and benefits of environmental interventions. 45 45 46. Implications for environmental health policy. References. 49 51.
(5) RIVM report 402101 001. page 5 of 59. Samenvatting Dit rapport schat het effect van blootstelling aan milieufactoren op de gezondheid in de OESO regio, in termen van verloren gezondheid en geld. Geschat werd dat 2-5% van de totale ziektelast gerelateerd is aan blootstelling aan milieuverontreiniging, vergeleken met 812% voor de niet-OECD landen. Voor de rijkste OECD landen werd dit gezondheidsverlies economisch gewaardeerd op 45-140 miljard $ of 53-160 $ per capita (centrale schatting). Dit onderzoek vond plaats in het kader van de recente ‘Environmental Outlook’ van de Organisatie voor Economische Samenwerking en Ontwikkeling (hoofdstuk 21 Human Health and the Environment). Eerst wordt geschetst hoe economische en demografische transities gepaard gaan met transities in (volks-)gezondheid en omgevingsrisico’s, waarna enkele concepten en maten voor gezondheid, milieu effecten en monetaire waardering besproken worden. Vervolgens is eerst de totale ziektelast in de OECD-regio geschat, op basis van gegevens uit het World Health Report 1999 gecorrigeerd voor regiogrenzen en bevolkingsgroottes. Ziektelast of gezondheidsverlies (‘burden of disease’) werd uitgedrukt in ‘disability adjusted life years’ (DALYs) of ziektejaarequivalenten. De totale ziektelast per capita in de OECD regio is ongeveer de helft kleiner dan in niet-OECD landen. Daarna is voor 16 ziekte(groepe)n met hoge ziektelast op basis van literatuuronderzoek bepaald welk deel van hun ziektelast toe te schrijven is aan milieufactoren. Voor de OECD-regio werd geschat dat 2-5% van de totale ziektelast gerelateerd is aan blootstelling aan milieuverontreiniging (1,5-4% voor landen met een hoog inkomen, 4-7% voor de lagere inkomens); voor de niet-OECD landen en de wereld werden deze percentages geschat op resp. 8-12% en 7,5-11%. Vervolgens is gepoogd deze verliezen van gezondheid in geld uit te drukken. Wanneer de bovenstaande percentages worden toegepast op de totale gezondheidsuitgaven binnen de OECD regio, dan kunnen de milieu-gerelateerde gezondheidskosten geschat worden op US$45-110 miljard ($40-100 per capita). Echter, dergelijke uitgaven hebben vrijwel alleen betrekking op morbiditeit. Daarom zijn vervolgens de kosten van milieugerelateerde gezondheidverliezen voor morbiditeit en mortaliteit apart geschat. Voor de eerste is dit gedaan door middel van ziektegroepspecifieke kosten die echter alleen voor enkele landen met hoger inkomens beschikbaar bleken; dit resulteerde in ongeveer dezelfde kosten als bovenstaande benadering, maar nu alleen voor morbiditeit. Milieugerelateerde mortaliteit is in dit onderzoek uitgedrukt in verloren levensjaren, waarvan de monetaire waarde ten eerste is geschat door het Bruto Nationaal Product te delen door de bevolkingsgrootte, en ten tweede door ‘willingness-to-pay’ waarden voor sterfte onder en boven de 65 jaar te delen door de verloren resterende levensverwachting. Dit leidde tot drie verschillende schattingen van de kosten -en de potentiële opbrengsten van interventies- van milieugerelateerde gezondheidsverliezen in de rijkere landen van de OECD: een lage schatting van 30-95 miljard dollar ($35-105 per capita) met potentiële opbrengsten van een ziektelastreductie van 5 % van 1,5-4,5 miljard dollar ($1,7-5,3 per capita), een middenschatting van $45-140 miljard ($53-160 per capita) en $2,5-7 miljard ($2,7-8 per capita), en tot slot een hoge schatting van resp. $215-680 miljard ($240-775 per capita) en $11-35 miljard ($12-40 per capita). Geconcludeerd wordt, na een korte bespreking van enkele hot issues en kosten(-baten) onderzoeken, dat de invloed van het milieu op de gezondheid zowel in gezondheidsverlies als in geld aanzienlijk is wordt, en dat potentiële opbrengsten van interventies waarschijnlijk groter zullen zijn dan de kosten ervan..
(6) page 6 of 59. RIVM report 402101 001. Summary This study assessed the environmental health impact of environmental factors in the OECD region, both in terms of lost health and lost money. 2-5% of the total Burden of Disease was attributed to environmental factors, compared to 8-12% in non-OECD countries. The environmental health loss in the high income region was monetary valued at US$45-140 billion or US$53-160 per capita (central estimate). The study took place within the framework of the recent Environmental Outlook of the Organisation for Economic Co-operation and Development (OECD; chapter 21 ‘Human Health and the Environment’). First a short description is given of major economic and demographic transitions and corresponding transitions in health and environmental risks, followed by a concise discussion of concepts and measures of (environmental) health, attributable risk and economic valuation. Secondly, the impact of environmental exposures upon population health within the OECD region was assessed, both in terms of lost health as well as lost money. The total burden of disease (BoD) in the OECD regions was estimated using data from the World Health Report 1999 adjusted for region differences in regions and population. Burden of disease or health loss or was expressed in disability-adjusted life years (DALYs). The total BoD per capita within the OECD region is approximately half that of non-OECD countries. Subsequently environment attributable fractions (lower and upper estimates) of the burden of disease of 16 diseases causing high disease burdens were assessed based on the literature. Within the OECD region it was estimated that 2-5% of the total BoD is associated with environmental factors (high income countries 1.5-4%, lower income 47%), for non-OECD countries this is 8-12% and for the world 7.5-11%. Thirdly, an economic valuation of the environmental health loss was performed. Applying the above environment attributable percentages of the total burden of disease to the total health expenditure, we estimated that within the OECD region environmental health costs range between 45-110 billion US$ (40-100 $/capita). However, health expenditures concern morbidity only. Therefore we divided the (environmental) burden of diseases into their morbidity and mortality parts. Environmental morbidity costs were estimated using diseasespecific direct costs of illness (available for some OECD higher income countries only), resulting in only slightly different costs compared to the first approach, but now for morbidity alone. Environmental mortality had been expressed as lost years of life, of which the monetary value was estimated first as OECD high income region GDP per capita, and second by using willingness-to-pay values for death under and over 65 divided by lost life expectancy. This finally lead to three different estimates of OECD high income region environmental health costs -and potential intervention benefits-: a lower estimate of US$3095 billion (US$35-105 per capita) with potential benefits of a 5% reduction in environmental BoD of US$1.5-4.5 billion (US$1.7-5.3 per capita); a central estimate of US$45-140 billion (US$53-160 per capita) with a 5% reduction benefits of US$2.5-7 billion (US$2.7-8 per capita); and an upper estimate of US$215-680 billion (US$240-775 per capita) and 5% benefits of US$11-35 billion (US$12-40 per capita). Finally, after a brief discussion of selected environmental issues (chemicals, specific groups, global environmental change) and cost(-benefit) studies, it is concluded that the health impact of environmental factors appears to be quite substantial, both in terms of health as well as in monetary terms, and that the potential benefits of intervention policies may well exceed costs..
(7) RIVM report 402101 001. 1.. page 7 of 59. Introduction. Health is regarded by many as one of the most important assets of the human life. Health concerns have therefore traditionally underlain much of the political priority given to environmental issues in countries taking part in the Organisation for Economic Co-operation and Development (OECD). The threat of global warming, decreasing biodiversity and the urgency for sustainable growth constitute other reasons for political involvement, even though the immediate effects of these developments on health might be less visible. In the recent OECD Environmental Outlook1 ample attention is given to the human health dimension of environmental issues, to which this document provides background information. The relation between environmental conditions and human health has since long been established. As early as the seventeenth century, the considerable influence of sanitary conditions on human mortality was demonstrated by Sir William Petty in his investigations on ‘Political Arithmeticks’2. The removal of the Broad Street pump handle in 1854 by John Snow to stop the outbreak of cholera is a story of nearly mythical proportions amongst epidemiologists3, marking the beginning of current public health practices in which environmental factors are regarded as major determinants for the health status of a population. Ranging from e.g. lung cancer mortality to aggravation of asthma to wide spread severe noise annoyance, the impact of environmental risk factors upon health shows a large and complex variety in severity and clinical significance. At the same time, the concepts of environment and (public) health reflect social and cultural beliefs and values and therefore differ from era to era and from region to region. The OECD Environmental Outlook starts with describing the underlying drivers of environmental change, such as economic development, globalisation, demography, consumption patterns and technological change. It then depicts a number of production sectors and environmental issues, and subsequently the integration with social and economic issues, amongst which is human health. Such a sequence might suggest a causal chain from economy to environment to health. Although not untrue, the relation between economy, environment and health is complex and certainly not unidirectional. Environmental quality is just one of the many determinants of health, other important factors being water supply and sanitation, food quantity and quality, public hygiene, socio-economic status, literacy, lifestyle etc. Also, health itself can be a key determinant for economic circumstances and progress, both on the individual and community level. Within an economic perspective, health can be viewed as a return from investments in environmental and human capital, but also as capital itself, returning e.g. happiness and healthy time to be used for production, recreation etc4. Health as capital goes well with recent thinking on sustainable development, defined as leaving future generations at least as many opportunities as we have had ourselves5. Developing social and human, rather than material, resources will contribute towards sustainability. Expenditures on environmental interventions and in health care are therefore not only costs, but also investments with valuable and worthwhile returns, both in health and money. Moreover, the health care sector has become an important economic sector (within OECD 4-14% of GDP in 1997, compared to 2-5% in 1960), providing income and meaningful work to many (up to 10% of total employment)6. Besides, it should be stressed that health to many is valuable as such and worth protecting and paying for..
(8) page 8 of 59. RIVM report 402101 001. This document provides background information to Chapter 21 Human Health and the Environment of the OECD Environmental Outlook. Similar to Chapter 21, it starts with a brief overview of the socio-economic transitions within much of the OECD region and the accompanying transitions in health and environmental risks. Secondly, the concepts of (environmental) health and how it can be measured and monetarized are shortly explored. The next section describes how the environmental health impact in the OECD region has been estimated, using a burden of disease approach together with attributable risks. It also describes the efforts to provide a first indication of the costs of these environmental health effects. Subsequently a selection of pressing environmental concerns is presented, together with some studies on environmental costs and benefits from the literature. This document concludes with suggesting some tentative policy implications, based on the combined evidence of the previous sections..
(9) RIVM report 402101 001. 2.. page 9 of 59. Transitions in environmental risks and health. Patterns of environmental risks and their effect upon public health show considerable changes over time and place, and can be considered as the outcome of historic economic developments. Different stages in the socio-economic transition of societies from traditional to contemporary, also show differences in the nature and size of environmental challenges and corresponding health effects. Table 2.1 sketches the economic transition from agricultural societies to contemporary globalizing economy, together with the transitions in both environmental issues and health effects, and also identifies the sectors producing the environmental health threats, being of course potential intervention targets at the same time. The transition from 19th century traditional, pre-industrial to 21st century (post)-modern societies has had and still has a major impact on population health status. For example, in Western Europe life expectancy has doubled from around 35 to over 75 years of age. This socalled health transition consists of two components: an epidemiological transition determining death rates, and a fertility transition determining birth rates. Together with the changes in both the environment and the organization of social and health-related services, these epidemiological and fertility transitions lead to effects on the population size and structure. This ‘demographic transition’ refers to a development from a pyramidal population structure to a situation with less children and more elderly. In most developing countries these transitions are clearly underway, while in the developed regions they have reached the stage in which chronic diseases -particularly from old age- have become predominant7,8. The economic development within the OECD has lead to longer and healthier lives for more people, although major health differences between high and low income groups still exist. An improved economic situation not only lead to changed nature and magnitude of environmental risks (as described in Table 2.1), but also significantly reduced other important risks and promoted improvements beneficiary for health, such as food amount and diversity, water management, better occupational circumstances, improved health care etc. In traditional societies, environmental problems chiefly concern access to clean water, appropriate housing and protection against natural disasters, and are primarily related to infectious diseases, maternal and perinatal conditions and nutritional deficiencies. Although economic progress has provided the means to reduce these risks to acceptable minimum levels in much of the OECD region, it also lead to new risks, mostly linked to modern large scale rationalised production. Industrial and agricultural emissions of chemicals in water, air and food have been associated with respiratory diseases and various types of cancer, while (the possibilities of) large industrial accidents cause societal disruption and severe health effects and threaten basic trust. Within the established market economies or late-capitalist, post-modern societies, emphasis is now shifting from industrial production to escalated levels of consumption of goods and services from all over the world. Knowledge and tourism overruling all geographical and cultural divisions9 are increasingly important economic factors10,11. Although the environmental risks of much of modern industry have largely been regulated, greatly increased transportation and energy use produce large scale transboundary air pollution (particulate matter, ozone). This results in increasing numbers of traffic accidents and noise pollution and reduces liveability in many urban areas, leading to e.g. higher levels of cardiopulmonary disease. Substantial environmental and health effects also occur in regions outside of the OECD, where much of the production of OECD-destined goods takes place..
(10) page 10 of 59. RIVM report 402101 001. The future health impact of climate change is as yet unknown, but expected to be significant. Still fast growing world population, the ageing of western populations and its effects upon the use of resources and energy, and the globalisation of western economic high consumption system can be expected to increasingly disrupt the biosphere’s life supporting systems, of which climate change and the loss of biodiversity are already observable signs. These unprecedented large-scale environmental changes might reshape human health risks, e.g. in adversely changing patterns of new and known infectious diseases (malaria, cholera, aids, Ebola etc) 12. Since current levels of population health have been acquired through economic progress often detrimental for the environment, more sustainable development seems urgent and inevitable both within as well as outside the OECD, in order to sustain and enhance the world’s population health. Besides ‘greening’ technologies and decoupling economy and environmental pressure, this may also include a shift from produced assets and natural resources to human and social capital. Finally, important changes may also occur in the field of governing and regulation. Up till now nation states have played an indispensable role in regulating polluting activities and cleaning up acknowledged sources of environmental health risks. Present risks and challenges however appear to be either supranational and global, or regional and even local. Noticeable changes can be expected in institutional structures and environmental actors, both at a global level (such as multinational corporations, international institutions and consumer organisations), as well as the local level (citizen committees, neighborhood watch groups and local governments fostering sustainable development)..
(11) • • • • •. Various cancers Respiratory diseases Neurological disorders Large accidents Gastrointestinal disorders • Allergies • Reproductive disorders Industrial processes Agriculture (fertilizers and pesticides) • Waste disposal • Use of ozone depleting substances (cfc’s). •. Communicable diseases • Maternal and perinatal conditions • Nutritional deficiencies. Public hygiene and sanitation • Housing • Land and water management. Health effects. Sectors (pollution sources and/or intervention opportunities) • •. Chemical emission and exposure in water, food and air (pesticides, heavy metals, POPs, VOCs, etc) • UV-radiation • Food (microb.). Clean water scarcity Food quantity and quality • Indoor air • Disease vectors. •. •. • •. Industry and services (focus on production). Agriculture and early industry. Environmental issues. Economic transition. Table 2.1. Transitions from traditional to (post-)modern economies.. RIVM report 402101 001. • • • • •. •. Global warming (disrupted carbon and nitrogen-cycles) Natural disasters Increased disease vector spread Overpopulation Land degradation Water scarcity. The Future: Sustainable Development or Endangered Global Life Support Systems?. • •. World ecological system Possible intervention areas: -technology (greening) -consumption (altered patterns) -population (size and composition). Respiratory diseases (acute and • 'Return' of known and new commu(aggrevation of) of chronic) nicable diseases (eg. malaria, aids, Gastrointestinal disorders dengue) Mortality harvesting effects • Heat/coldstress (cardiopulmonary disorders) • Natural disasters Psychosocial effects Neurocognitive dysfunction Reduced quality of life. Transboundary air pollution (particulate matter, ozone, etc.) Local urban air pollution Urban noise Urban liveability Food (microb.) Decreasing exposure to chemicals. Transportation (mainly road and air) • Energy generation and use • Tourism •. • • •. • •. •. • • • • •. •. ICT and economic globalization (focus on consumption). page 11 of 59.
(12) page 12 of 59. RIVM report 402101 001.
(13) RIVM report 402101 001. 3.. page 13 of 59. Concepts and measures of health and environment. Nearly two centuries of successful preventive medicine and public health policy have stretched life expectancy in many developed societies almost to the limit13. Public health focus has gradually shifted from life expectancy to health expectancy. Or in other words: postponing as long as possible or mitigating the physical, mental or social limitations brought about by the chronic diseases of older age14,15,16. Within the framework of assessing the health impact of environmental factors, this chapter first discusses the concepts of (environmental) health together with a model of public health in orde to clarify the relation between health and the environment. The meaning of ‘attributable fraction’ is elaborated upon, after which a method to measure the environmental health impact in the OECD is proposed. The chapter concludes with suggesting methods to tentatively assess the environmental health costs in monetary terms. As a result of the described epidemiological, health and demographic transitions, health impacts of environmental exposures no longer only involve clear mortality risks or loss of life expectancy, but also aspects of the quality of life in a broad sense17. Some examples of these aspects are aggravation of pre-existing disease symptoms (e.g. asthma, chronic bronchitis, cardiovascular or psychological disorders), severe annoyance, sleep disturbance, as well as a reduced ability to concentrate, communicate or perform normal daily tasks, and maybe even feelings of insecurity or alienation, unfavourable health perception and stress in relation to poor quality of the local environment and perceived danger of large fatal accidents18. There are also several indications that social responses to environmental interventions, such as the extension of an airport may lead to an increase of medical consumption, such as medication use, GP-visits or hospital admission19,20,21. Furthermore, several authors have pointed out the important role of socio-economic inequalities and social position within societies with regard to public health status. Independent of the absolute level of income, material insecurity, social exclusion, lack of self-esteem, loss of social cohesion may lead to a higher prevalence of health problems among the more deprived22,23,24,25. Obviously, health is not (anymore, if ever) a welldefined entity, and the same counts for environment. Both concepts may differ from era to era, from region to region, since they reflects changes or differences in social and cultural beliefs, knowledge and technology, and economic conditions. Key questions in any attempt to evaluate health impacts associated with environmental exposures are therefore ‘what is health’ and ‘what is environmental health’?. 3.1. What is health?. Several authors conceptualise health as an optimum dynamic equilibrium between individual capabilities and exogenous circumstances, enabling individuals to deal with external disturbances and pressures13. In such an approach health is looked upon as an individual’s ability to cope with the demands of everyday life26,27,28. Successful adaptation to environmental circumstances in the broadest sense implies living an independent and productive life, maintaining optimal economic conditions and social interactions in all stages of life, and thus health may very well refer to well-adjusted people with physical handicaps29. In the context of environmental health impact assessment health problems may arise among those who lack the mental and physical resources to adapt to certain exposures, such as noise, air pollution, lack of open space, traffic density or the threat of a large accident30..
(14) page 14 of 59. RIVM report 402101 001. Health as ‘a state of complete physical, mental and social well-being and not merely the absence of disease and infirmity’ is the far-reaching definition given by the World Health Organisation in its founding charter in 194631. An important merit of this definition is the explicit appreciation of the subjective experience of health, and the inclusion of psychological and social dimensions. However, some argue that such a state of complete well-being corresponds much closer to happiness than to health32,33. As the quest for happiness is often regarded as essentially boundless, the quest for health becomes boundless as well. Alternatively health may be viewed as ‘a condition of being free of disease and infirmity and a basic and universal human right’, but at the same time be linked to appropriate indicators of mortality, morbidity and (health-related) quality of life32. Also, well-being and coping with everyday life requires much more than good health alone. It is not very likely that the contribution of public health policy would be the most efficient in such a broad field. This would limit the definition of health even more: ‘the absence of disease and other health problems of a physical or psychological nature’, as recently advocated by the Scientific Council for Governmental Policy in the Netherlands 34. Of course, these views bear first and foremost on controlling the costs of health care and cure in ageing populations. However, in the field of environmental health protection one is confronted with similar needs for effective and efficient allocation of resources (including opportunity costs)35,36. Other conceptualisations of health, implicitly as well as explicitly, can be found in the large number of methods for measuring health status, either to be used at an individual level to compare quality of life after different options for medical intervention (e.g. quality adjusted life years: QALY's), or applied at the level of populations to measure the burden of disease, primarily to support the planning of public health programs (e.g. to assess the efficiency of different options)26. Some important concepts within these instruments are opportunity (cultural and socio-economic disadvantages, loss of resilience), health perception (expectations and satisfaction about health (and health care), reflecting of course the cultural images of health37), and functional status (physical, psychological and social functioning, for instance the ability to perform ‘activities of everyday life’)38. However, this again poses the question of what goes into health; does one take the perspective of the observer, the patient, and/or the effects upon society as a whole? 26,27. Considering these points of view, we conclude here to a more or less conservative approach in which people are considered healthy until they are diagnosed not to be so (preferably by a medical doctor). The health status of specific (exposed) populations can then be assessed by means of a range of comparative population measures of mortality, morbidity, and impairment. One might rely on routinely available health statistics, such as mortality rates or the use of health services, or one might conduct surveys to reveal specific exposureattributable response variables, such as lung function measurements or specific reported symptoms. But once again one will be confronted with the difficulty of defining ‘disease’ at the margins; the question remains whether a clear distinction can be made between clinical depression and anxiety on the one hand and anger, annoyance, irritation, or loss of morale on the other30.. 3.2. What is environmental health?. As with health, the question ‘what is environment’ can be approached from a number of different perspectives, such as biological, ecological, medical, social, chemical, economical.
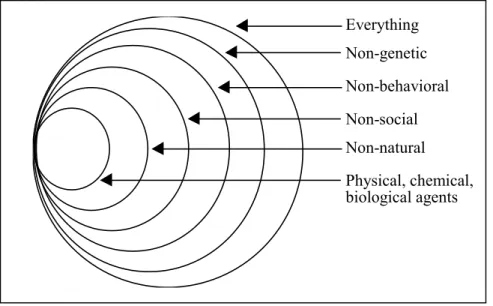
(15) RIVM report 402101 001. page 15 of 59. etc. Within a human health perspective, defining environmental causes of disease based on the classic nature-nurture dichotomy would imply that all factors that are not genetic are to be regarded as environmental39, or as Einstein put it: ‘environment is everything that isn’t me’. When the time scale is however taken large enough and evolutionary mechanisms are taken into account, even current genetic conditions might be seen as the result of past environments and therefore all diseases could be regarded as environmental. The common perception of environmental causes appears to emphasize another distinction, i.e. the extent to which exposure is voluntarily and subject to personal action. Behavioural and life-style factors are consequently not viewed as environmental, although the existence of a ‘social’ environment and resulting pressure may cast doubt on the voluntariness of such factors. Figure 3.1 sketches how various definitions of ‘environmental’ from a human health perspective may be related and emphasizes the overlap between the various groupings. Everything Non-genetic Non-behavioral Non-social Non-natural Physical, chemical, biological agents. Figure 3.1 Different definitions of ‘Environmental Factors’ (Reproduced from Smith et al.39). Up till now, environmental concerns in a health context have generally been with overt human-made hazards in the ambient environment. Today however, global environmental changes such as climate change and loss of biodiversity are increasingly requiring attention. Population growth, world wide mass urbanization together with high production and consumption levels are apparently affecting environmental quality and therefore human health and wellbeing40. To deal with these issues, concepts and attitudes concerning environmental influences on human population might need to be expanded. Instead of viewing the environment as a repository of potential hazards that have to be eliminated, the world around us might also be thought of and experienced as our habitat. This way health is not only a dearly-won asset to be protected against detrimental influences, but also a historically contingent state resulting from and supported by a number of complex and intertwined systems. A sustainable population health from an environmental perspective requires therefore a sustainable economic development protecting and maintaining a global life supporting environment and not only -though necessary- efforts to eliminate or control environmental risk factors12. Such an approach of environment and health corresponds to some extent to current economic thinking in e.g. the recent World Bank report ‘Expanding the Measure of Wealth: Indicators of Environmentally Sustainable Development 41. This document is one of many in which an.
(16) page 16 of 59. RIVM report 402101 001. increasing emphasis on sustainable development takes shape, based on a concept of sustainability as opportunity. That would define sustainability as leaving future generations as many opportunities as, if not more than, we have had ourselves5. In economic terms one could use for opportunity the concept of capital, with its returns as income4. Income based on depletion of capital is not sustainable and should therefore not be considered as income. The wealth of a nation would then not only consist of the produced assets (economic capital) but also of natural capital (amongst which environmental conditions) and human resources (social and human capital, e.g. health and education); different types of capital might to a certain extent be complemetary. Again, environment may be regarded not only biologically as a risk factor of health and disease; it can also be approached economically as a (part of the natural) capital with health as one of its returns. Other economists would take the position that environmental issues are those that occur to a group other than the decision-making group (resp. externalities vs. internalities). For example, outdoor air pollution would be environmental, but household indoor air pollution would be excluded, since it is under the influence of the affected individuals. This approach however assumes that the household can use all the necessary information (ie detect and understand the risks), makes rational decisions and is able to solve the problem of indoor air pollution by itself; clearly assumptions that are very seldom met in real life. Since the prevailing tradition in public health is to find and reduce all threats to health no matter where they occur and who bears responsibility for them, the externalities vs. internalities approach is hardly appropriate39. The definition of environmental health of the World Health Organization echoos this broad scope of the public health tradition: ‘Environmental health comprises those aspects of human health, including quality of life, that are determined by physical, chemical, biological, social, and psychosocial factors in the environment. It also refers to the theory and practice of assessing, correcting, controlling, and preventing those factors in the environment that can potentially affect adversely the health of present and future generations.’42. In practice, these factors have been classified into ‘targets’: air pollution, water pollution (both drinking and wastewater), hazardous waste, human ecology and settlements (incl. indoor air), food safety, monitoring, occupational health and safety43. For use in this document we propose that environmental health effects should focus primarily on outcomes that are significant to mortality, morbidity and health-related quality of life. Obviously this includes all clear intermediate risk indicators, such as lung function deficits, aggravation of asthma, or sleeping problems, as well as ‘derivative’ indicators like the use of medical services or self-medication. ‘Environmental’ refers to physical, chemical and biological human made or influenced exposures, excluding occupational health and safety, the majority of traffic, war etc. of which the ‘environmentalness’ is disputable. We also exclude important life-style determinants of health such as smoking behaviour and dietary patterns.. 3.3. The relation between health and environment. 3.3.1. Determinants of health: complex relations and interactions. To evaluate the manner in which environmental exposure may influence public health we consider a conceptual model that was developed in the framework of the Dutch Public Health.
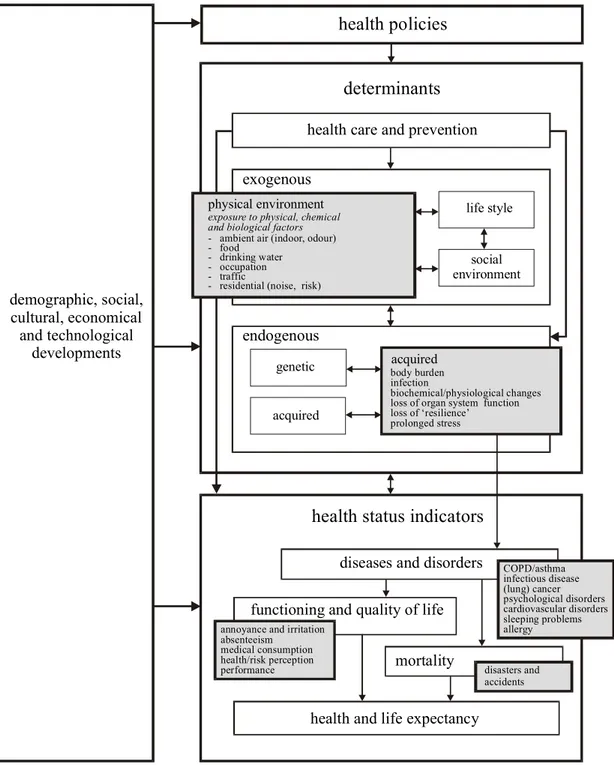
(17) RIVM report 402101 001. page 17 of 59. Status and Forecasts13 report (see Figure 3.2; the model elaborates on previously published models, in particular the model proposed by the Canadian Minister of Health Lalonde in 1974).. health policies determinants health care and prevention exogenous physical environment. demographic, social, cultural, economical and technological developments. life style. exposure to physical, chemical and biological factors - ambient air (indoor, odour) - food - drinking water - occupation - traffic - residential (noise, risk). social environment. endogenous genetic. acquired. acquired body burden infection biochemical/physiological changes loss of organ system function loss of ‘resilience’ prolonged stress. health status indicators diseases and disorders functioning and quality of life annoyance and irritation absenteeism medical consumption health/risk perception performance. mortality. COPD/asthma infectious disease (lung) cancer psychological disorders cardiovascular disorders sleeping problems allergy. disasters and accidents. health and life expectancy. Figure 3.2 The Physical Environment as a determinant of Health Status. The model illustrates that health status can be contemplated as a function of many (interacting) determinants (a complex of causality), including the quality of the physical environment. Endogenous as well as exogenous determinants are involved, which may explain why the response to environmental exposures may vary substantially from one individual to the other19,33,44. Furthermore it shows that health status may provide directions to health policy, which will in turn influence health status via determinants. This whole.
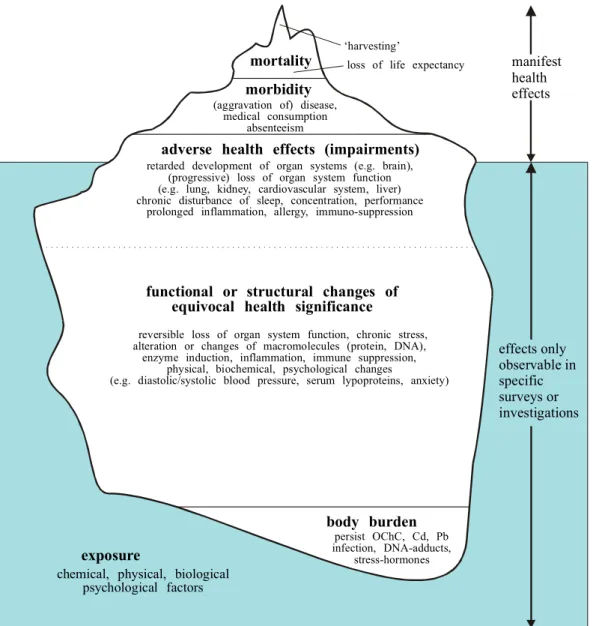
(18) page 18 of 59. RIVM report 402101 001. dynamic process is influenced by autonomous developments in demographic, socio-cultural, economic and technological areas. Endogenous determinants may be genetic or acquired in the course of life. Gender, for example, is a genetic factor that may affect a person’s state of health. In the Netherlands e.g. women live about 6 years longer; most of those extra years are however lived in reduced health as on average women suffer more from chronic diseases45. Genetic predisposition may involve clear abnormalities such as haemophilia or colour blindness. A particular feature in a population may nevertheless show a more complex genetically determined distribution, reflecting differences in susceptibility to pathogenic factors. Examples are variations in the ability to detoxify harmful substances, susceptibility to carcinogenic substances, or skin pigmentation in connection with damage caused by UV radiation (genetic polymorphism). Probably most endogenous determinants develop through interactions between genes and environmental factors and thus have both a genetic and an acquired component, for example length, blood pressure, blood lipoprotein composition (familial risk factors), and personal (psychological) attributes46,47,48. Acquired attributes are built up in the course of life, for instance immunity acquired through vaccination or prior infection, reduced lung function as a result of an earlier respiratory infection, many years of smoking or adverse occupational exposures. An important endogenous ‘acquired’ determinant of health is of course age. Many health problems occur later on in life, often in connection with the effect of exogenous determinants earlier in life. Regarding exogenous determinants, a disctinction can be made between the physical environment, life-style factors and the social environment. The physical environment includes radiation, noise and heat (physical factors); oxygen supply, nutrients, hazardous substances in the outdoor and indoor environment, including the working environment (e.g. chemicals); bacteria, viruses and other (micro)organisms which may have both positive as well as negative effects on health status (biological factors). Life-style factors include diet, smoking, drug abuse, sexual habits, physical (in)activity and such. The social environment includes the pattern of social networks and socio-economic status. A concept of health as a dynamic equilibrium emphasizes interaction between determinants, resulting in a particular state of health. While exogenous determinants act on endogenous ones, there are also many interactions within the group of exogenous determinants. Life-style for instance, is to a considerable extent determined by social environment (e.g. family situation). Aspects of lifestyle or behaviour, such as sunbathing, smoking and personal hygiene may on the other hand largely determine exposure to factors from the physical environment such as UV radiation, carcinogenic substances, or pathogenic organisms.. 3.3.2. How much ill health can be attributed to the environment: ‘attributable risk’. Environmental risk factors are often addressed as to their direct effect in causing disease. Maybe more importantly however, they also play a significant role in disease aggravation and prognosis by influencing other exogenous or endogenous determinants. In general, the extent to which a certain phenomenon causes diseases can be characterized by the ‘attributable risk’, indicating the percentage of a particular disease category that would be eliminated if the influence of this phenomenon were reduced to its lowest value 39,49. Nearly every disease has multiple risk factors of which the environment is but one. Figure 3.3 shows how the various adverse health outcomes can be envisaged, with environmental (and most other) risk factors often forcing an upward movement of pre-existing cases towards more severe symptoms and.
(19) RIVM report 402101 001. page 19 of 59. disease stages, with some deaths as the top of the iceberg or pyramid. Only the more severe responses end up at a doctor's practice, in hospitals and thus in official health statistics (above the surface), while responses beneath the surface are only seen in special surveys. Moreover, apart from rare exceptions, responses are not specific for environmental exposures but often dominated by life-style, genetic and socio-demographic factors.. ‘harvesting’. mortality. loss of life expectancy. morbidity (aggravation of) disease, medical consumption absenteeism. manifest health effects. adverse health effects (impairments) retarded development of organ systems (e.g. brain), (progressive) loss of organ system function (e.g. lung, kidney, cardiovascular system, liver) chronic disturbance of sleep, concentration, performance prolonged inflammation, allergy, immuno-suppression. functional or structural changes of equivocal health significance reversible loss of organ system function, chronic stress, alteration or changes of macromolecules (protein, DNA), enzyme induction, inflammation, immune suppression, physical, biochemical, psychological changes (e.g. diastolic/systolic blood pressure, serum lypoproteins, anxiety). effects only observable in specific surveys or investigations. body burden exposure. persist OChC, Cd, Pb infection, DNA-adducts, stress-hormones. chemical, physical, biological psychological factors. Figure 3.3 Diagram representing the Public Health relevance of disease end-points following various exposures (Reproduced from Hollander et al50). Thus, most important risk factors do not directly create a certain number of new disease cases but merely enlarge the existing number; they are therefore not independent from each other and changes in one will affect others. Although this complicates understanding the disease web of causation, it also expands the number of possible intervention paths. Combining this with the above-mentioned definition of attributable risk implies that the percentages of attributable risk of each of the various risk factors of a disease may well add up to more than 100%39. For example, saying that large fractions of acute respiratory infections are attributable to air pollution, poor housing etc, is not incompatible with the statement that also large fractions may be due to e.g. malnutrition and lack of immunocompetence. Each risk.
(20) page 20 of 59. RIVM report 402101 001. factor must therefore be considered in the light of others and reducing one risk factor will influence the remaining attributable risk of others. Whether a risk factor is defined as environmental also depends on the interdependent choices of time period and baseline. As discussed above, when a sufficiently long period is taken, all diseases can be regarded as environmental, while taking a rather short time horizon would exclude long term environmental health threats and effects, such as climate change effects and skincancer due to ozone layer reduction. Because humans have never lived without (environmental) risks, it can be argued that a certain level of risk and health effects is unavoidable, tolerable or even acceptable. A baseline of a zero exposure level might therefore be suitable for e.g. synthetic chemicals, but not for airborne particles, inonizing radiation etc. A baseline can also be seen as a ‘counterfactual’ or alternative scenario, to which the current level of risk factor is compared. Murray and Lopez (1999) distinguished three counterfactual scenarios51: the theoretical minimum represents a scenario where the exposure distribution is associated with the least population risk, the plausible minimum risk is described by the distribution with minimum population risk that is imagined to be plausible, while the feasible miniumum risk corresponds to the scenario with the minimal population risk that has been achieved somewhere in the world with current technologies and in optimal conditions.. 3.4. Measuring environmental health impact. Previous paragraphs have dealt with definitions and concepts of (public) health, to what extent it may be ‘environmental’, and how the different risk factors and endogenous and exogenous determinants of health might be brought together into one model. The next step is to discuss how the impact of current environmental exposures upon health in existing populations can actually be measured or estimated. As mentioned earlier, the impact of hazardous environmental exposures on human health can take numerous shapes of various severity and clinical significance. Among the many responses that have been attributed to environmental exposures are disturbed cognitive development in children, several types of cancer, reduced fertility, immune-suppression, severe noise annoyance and sleep disturbance52,53,54. During air pollution episodes wellstudied human responses range from slight reversible lung function deficits in virtually everyone exposed, to aggravation of symptoms among asthmatics, and from hospital admission of patients with cardiopulmonary disease to the premature death of some of the very weak55,56,57,58. Some effects occur soon after the onset of exposure; others emerge after long term cumulative exposure, including a latency period. The public health significance of any biochemical, physiological or psychological response to an environmental insult depends on many endogenous and exogenous factors. Whether or not an environmentally induced change affects individual health may be a function of its reversibility, individual possibilities of compensation or level of resilience. At the population level, these effects are combined into possibly elevated rates of health status indicators such as morbidity and mortality, characterizing a population’s health and the public health impact of environmental factors.. 3.4.1. Indicators of morbidity. Functional or structural changes attributable to environmental exposures may (temporally) affect the normal function of organ systems or disturb mental or social functioning, in the end initiating disease or aggravating symptoms of pre-existing disease (frequency, intensity and duration). Whether disease indeed occurs depends largely on the individual vulnerability.
(21) RIVM report 402101 001. page 21 of 59. (genetic susceptibility, lifestyle, disease history, gender or age). Carcinogenesis may e.g. be initiated by environmental carcinogens in some unfortunate individuals, given an unfavourable genetic. Only when specific (not necessarily environmental) conditions for tumour promotion and progression are met in all stages the tumour might become clinically manifest. It is therefore often impossible to attribute individual cases to specific exposures. Wheteher the high exposure levels in occupational studies bear much significance to substantially lower everyday environmental levels is also subject of an ongoing debate59,60. Another example of disease prevalence affected by environmental exposure is asthma among young children, predominantly those who are constitutional atopic. There is an established association with exposure to indoor dampness, and associated bio-allergens (house mite excrements, compounds of bacteria or fungi)61. At the population level one would expect morbidity to be reflected in absenteeism, use of health services, and medication (including self-medication). In a recent survey of populations in the vicinity of Amsterdam Airport Schiphol for example, indications were found of increased use of medication for hypertension, cardiovascular disorders, allergy and asthma, tranquillisers and sedatives. (Self) perceived health is another ‘aggregate’ measure to evaluate a population’s health status. In general perceived or self-rated health measures are not very specific, as many determinants are involved, among which social-demographic factors (age, gender, ethnicity), prevalence of chronic disease and functional limitations, as well as socialpsychological well being. Some examples of indicators to describe morbidity associated with environmental pollution are: • exposure specific morbidity (e.g. prevalence of cardiovascular disease, sleep disturbance, asthma, lung cancer etc.) • accelerated decrease in lung function, resulting in earlier onset of chronic obstructive pulmonary disease • aggravation of respiratory or cardiovascular symptoms (resulting in absenteeism, medical consumption, see next) • absenteeism from work or school • medical consumption, such as GP- and emergency room visits, and hospital admission rates • medication use, in particular with respect to disorders which can be related to a specific exposure (e.g. medication for cardiovascular disease, sleeping problems, sedatives and tranquillisers in relation to noise, or inhalers in relation to air pollution) • disturbed intellectual development in children as a result of chronic lead poisoning • self-rated health. 3.4.2. Indicators of mortality. Mortality is the ultimate irreversible outcome of ageing or pathological processes. Agespecific overall mortality is an important and frequently used indicator to describe the public health status of the population. Since everybody dies at some point, the age at which death occurs or the years of life lost (reduction of life expectancy) are important attributes of mortality. ‘Precipitated’ mortality during particulate air pollution episodes involving predominantly the old and frail may cost up to several months of unhealthy life62,63, while the impact associated with fatal accidents involving individuals with a ‘random’ age distribution may amount to a loss of many healthy years64..
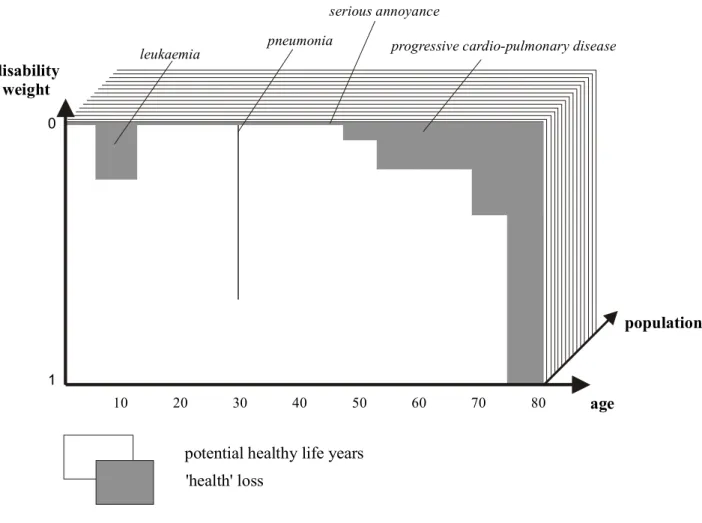
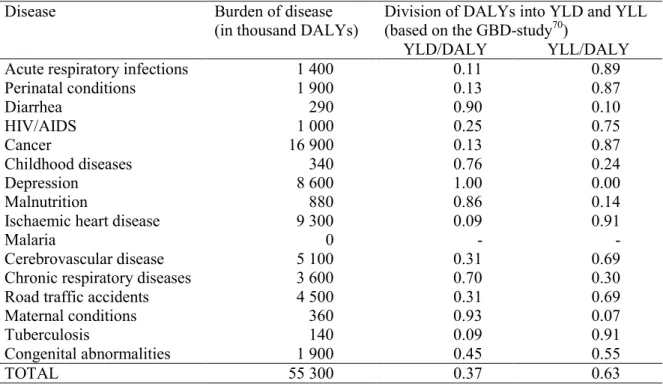
(22) page 22 of 59. RIVM report 402101 001. Regarding the case of large accidents, it is obvious that the general public does not perceive these risks, such as an aircraft crash in a residential area, simply in terms of annual death toll or even loss of life expectancy. For instance a calculated average so-called third party mortality risk of around 1 death annually is fairly insignificant compared to the total of annual deaths in a population or the deaths attributable to smoking. It is clearly not the public health burden per se, but the involvement of tens or hundreds of victims at the same time, the social disruption that results from large accidents and the involuntariness of exposure that might legitimate the high position of third party risk on the societal agenda35,65. To describe mortality in a population, age-, sex- and cause-specific figures are the indicators of choice, e.g.: • annual respiratory and cardiovascular mortality associated with particulate air pollution; • cancer mortality in relation to exposure to carcinogens (chemicals or radiation) • loss of life expectancy (life table analysis).. 3.4.3. An aggregate health impact indicator. Although common risk measures such as the previously mentioned morbidity and mortality indicators are informative and widely used, they often fail to adequately address the large diversity of environmental health impacts, since they are primarily geared to probability rather than to the nature and magnitude of adverse health consequences66. The annual mortality risk associated with a certain exposure for example appears unambiguous and easy to comprehend, but will in some instances be inadequate as it does not cover the full range of relevant health dimensions associated with a certain environmental health problem. It also gives no attention to e.g. age and previous health status of the deceased. Incorporating various relevant health attributes may therefore improve the quantitative risk assessment and subsequently the decision making process67,68,69. In recent years several integrative indicators have been constructed to aggregate health losses on the level of populations. An important one was developed within the World Health Organization - World Bank Global Burden of Disease project led by Murray and Lopez70. To assess the global disease burden and consequently the health policy priorities in different regions in the world, they applied disability-adjusted life years (DALYs). This health impact measure combines years of life lost and years lived with disability that are standardized by means of severity weights; it thus measures health using time as the metric. The adaptation of the DALY-concept in this document was inspired by the notion that the multiform health loss due to environmental exposure is reasonably well characterized by three dominant aspects of public health, viz. quantity of life (measured by life expectancy and duration of disease), quality of life (expressed through a disease severity weight), and social magnitude (or number of people affected)71. Thus, environmental health loss is defined as time spent with reduced quality of life, aggregated over the population involved. The diagram in Figure 3.4 sketches the basic idea behind this and comparable approaches. Time is the unit of measurement. Public health loss is defined as time spent with reduced quality of life, aggregated over the individuals involved, and combining years of life lost (combining mortality and age of death data) and years lived with disability that are standardised by means of severity weights70,72..
(23) RIVM report 402101 001. page 23 of 59. serious annoyance pneumonia. leukaemia. disability weight. progressive cardio-pulmonary disease. 0. population 1 10. 20. 30. 40. 50. 60. 70. 80. age. potential healthy life years 'health' loss. Figure 3.4 Diagram of the concept of Disability Adjusted Life Years (Reproduced from 71 Hollander et al. ). Important issues in a calculation of the burden of disease in DALYs are the estimation of the number of people affected, the duration of disease and the numbers of years of life lost through death, and the question of how to determine the severity weight for each disorder. To estimate the number of people affected, two basic approaches may be used: the exposurebased and the outcome-based approach73. The first assesses the exposure in the population and combines those data with dose-response relationships, resulting in the number of people showing an adverse health outcome. The second collects data on relevant disease outcomes and then determines which fraction of ill health can be attributed to certain environmental risk factors. Obviously the two methods require quite different sets of data. The duration of disease and the ‘duration’ of mortality can often be derived from clinical data, diseasespecific mortality figures and life tables. Weighting the severity of a disease condition or the reduction in quality of life caused by it has been the subject of much reasearch and debate. The Global Burden of Disease (GBD) project initially applied disability weight definitions which were primarily based on functionality, the (dis)ability to perform ‘activities of everyday life’ in four domains: procreation, occupation, education and recreation15. The approach was received with a fair amount of criticism, some involving the procedures of attributing weights, other the fact that the definitions did not fully comprise important dimensions of health such as pain, distress, discomfort, anxiety and depression. Aggregated scores would not adequately reflect.
(24) page 24 of 59. RIVM report 402101 001. preferences of various ‘stakeholders’. To meet these objections in their revision of the DALY-approach Murray et al. applied the concept of ‘indicator conditions’74. Using formal instruments to measure health preferences, 22 indicator conditions were given weights in series of consensus meetings involving physicians and public health scientists from different regions. These states reflected several distinct attributes of non-fatal health outcomes, such as large physical manifestations or limitations, psychological ands social limitations, pain, as well as disturbed sexual and reproductive functions. These indicator conditions were used subsequently to attribute disability weights to most other states. Recent Dutch (Environmental) Burden of Disease Studies71,75 applied rather similar approaches for a different set of diseases and environment related health outcomes. Two other -somewhat controversial70,76- features of the DALY measure as developed by Murray and Lopez in the Global Burden of Disease study are weighting for age and discounting of loss of healthy life in the future. Age weighting gives some ages more impact in the DALY estimates than others because of the economic and societal impact and justified by the idea that everyone may eventually pass through all ages. Applying a certain discount rate for future costs and benefits compared to present ones is common practice among economists -though not so much in the public health field-, because otherwise interventions would nearly always be postponed to the future. Of course, there are many questions about concepts and methods underlying indicators such as the DALY, of which those concerning procedures and values for the weights for severity appear amongst the most pressing ones. The use of composite health outcome measures implies several normative choices, such as the reference life table to be used, the valuation procedures, etc. These choices have been extensively discussed in the literature77,78,79,80,81. However, key advantages of the DALY are its aggregate nature combining both quantity and quality of life, as well as its transparency and explicit appreciation of many of its assumptions, allowing for open discussion and trying out other other preferences. Wellestablished public health indicators such as mortality and morbidity on the other hand, also rest upon a number of rather implicit assumptions (e.g. implicitly valuing death at young and old ages equally), which however often go unnoticed.. 3.5. Monetary valuation of environmental health impact. Using a burden of disease approach allows to express a wide range of health outcomes into one measure whatever their cause or nature is. Within economic thinking, money is the usual metric to express and compare both material and immaterial goods. Therefore, to be able to prioritize interventions and their expected benefit-cost ratios, health effects of both environmental problems and interventions should be compared on the same basis as financial costs and benefits in other areas. Since for environmental benefits such as health and clean air no markets exist or just very imperfect ones, these goods are not priced and their monetary values can not be readily observed. Monetary values of health effects have thus to be derived trough other means82. Two of the most widely applied approaches are: 1. measuring people’s willingness-to-pay (WTP) for an environmental benefit (the welfare cost to an individual) or conversely their willingness to accept compensation for environmental degradation; 2. estimating the (avoided) cost-of-illness (CoI) related to environmental causes or interventions (costs for the society, e.g. health care costs, loss of productivity or income). WTP-measuring does not take into account costs borne collectively, while the CoI-approach excludes intangible costs such as disability and decreased quality of life borne by the individual, resulting in mostly much lower values compared to WTP. Willingness to pay values appear.
(25) RIVM report 402101 001. page 25 of 59. reasonably stable in Western societies, but CoI-values may vary largely since they depend on economic situation, the GDP share going to the health sector and the structure and size of the health system in that particular region. A number of studies have collected data on people’s willingness to pay for a reduction in their risk of death -it is important to note that it is not lives being valued, but a reduction in risk; observable also when someone e.g. accepts a riskier job but with higher wages- or other adverse health outcomes83. This integration of economics with health science requires matching as closely as possible the starting point of the valuation analysis to the health end point - such as a health response (e.g. a symptom day or an increase in mortality risk) or a health consequence (e.g. a hospitalization or bed-disability day). To provide an overview, Table 3.1 contains unit values for air pollution health outcomes as used in several major studies or models taken from Davis et al., who also offer a lucid and in depth discussion of the credibility and uncertainties of the willingness to pay methods within the framework greenhouse gas mitigation83. The values for mortality risk, chronic lung disease risk, and acute symptoms all are derived from a willingness-to-pay approach that may be thought of as measuring the full value to the individual of reducing the risk or the symptom. The other values are however only partial, mainly relying on cost of illness techniques. They are meant to capture the more severe manifestations of either acute events or chronic states and may, without proper adjustments, double count WTP benefits or provide significant underestimates of the WTP to reduce such effects. Although such CoI estimates are sometimes multiplied by a factor to bring them up to a WTP estimate so as to eliminate such underestimation, ‘the evidentiary basis for the generality of this adjustment across endpoints is quite weak’ 83. Since within this document the primary focus is on the assessment of the environmental burden of disease, we will not deal here with all the conceptual and methodological issues and uncertainties involved in the monetary valuation of health impacts. However, we think it useful to provide at least a first indication of the environmental health costs in monetary terms and therefore of potential benefits of possible interventions. Because the environmental burden of disease has been expressed in DALYs, a monetary value per unit burden of disease would be required. Unfortunately, no WTP value for such an aggregate measure of health loss has yet been derived. Since a disease burden of one DALY is by definition equal to the full loss of one year of healthy life, the WTP value for one DALY might be tentatively estimated through deviding the WTP value for mortality by the average number of years lost with each death. The relation between DALYs and WTP methods remains to be studied and uncertainties such as differences in dimensions measured can not be ruled out. The same counts for the cost of illness approach. CoI values per unit burden of disease have not yet been studied. We assume that CoI-values based on health care costs might be correlated to some extent with the morbidity part of the burden of disease (the Years Lived with Disability), but much less so with the mortality part (Years of Life Lost). Since often only data on total DALYs are published, this causes an extra reason to regard calculating the environmental cost of illness as proposed above as rather tentative..
(26) RIVM report 402101 001. Notes: a. Low and high estimates are estimated to be 1 standard deviation below and above the -mean of the Weibull distribution for mortality. For other health outcomes they are the minimums and maximums of a judgmental uniform distribution (US-Environmental Protection Agency. The benefits and costs of the clean air act1990 to 2010. USEPA Report nr. EPA-410-R-99-001). b. Low, central, and high estimates are given respective probabilities of 33%, 34%, and 33% (Air Quality Valuation Model Documentation, Stratus Consulting for Health Canada). c. Low and high estimates are the 5% and 95% tails of the distribution (Tracking and Analysis Framework, developed by a consortium of U.S. institutions, including RFF). d. Uncertainty bounds are set by dividing (low) and multiplying (high) the mean by the geometric standard deviation (2) (ExternE. Externalities of energy, vol.7. EU,1999).. Mortality Chronic Bronchitis Cardiac Hosp. Admissions Resp. Hosp. Admissions ER Visits Work Loss Days Acute Bronchitis Restricted Activity Days Resp. Symptoms Shortness of Breath Asthma Child Bronchitis. US - EPAa US - TAFb Canada - AQVMc Europe – ExternEd Low Central High Low Central High Low Central High Central 1560000 4800000 8040000 1584000 3100000 6148000 1680000 2870000 5740000 3031000 260000 59400 260000 523100 122500 186200 325500 102700 9500 9300 2940 5880 8820 7696 6900 6647 2310 4620 6860 7696 144 194 269 188 203 399 602 218 83 13 45 77 16 38 61 54 26 51 77 73 5 15 33 12 5 11 15 7 0 5.3 10.60 7 12 32 54 33 12 32 53 36 45 105 217 322 -. Table 3.1 Comparison of unit values used in several major studies or models (in $1990; reproduced from Davis et al83).. page 26 of 59.
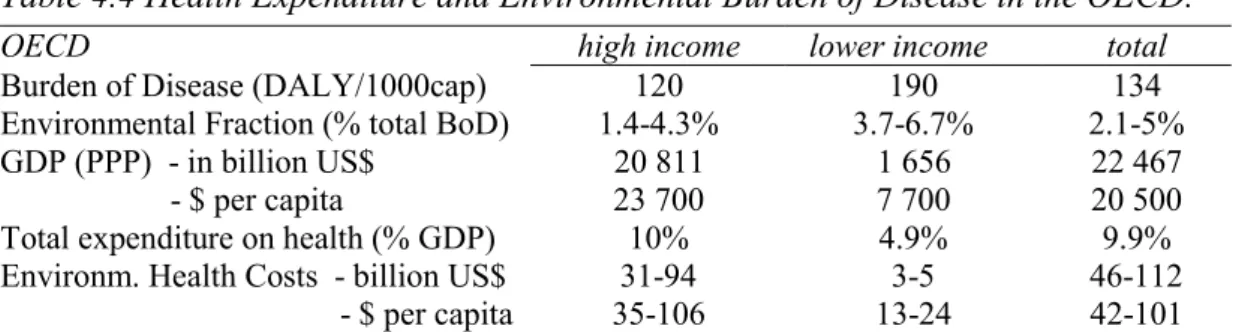
(27) RIVM report 402101 001. 4.. Environmental health impact in the OECD. 4.1. Estimating the environmental burden of disease. page 27 of 59. The burden of disease in a certain population, or the health status of a population, is often characterized through mortality, life expectancy, disease prevalence and incidence etc. As discussed in chapter 3, these measures do not provide an overall picture of a population’s state of health. A recently developed composite measure of the burden of disease, the disability-adjusted life years (DALYs) however, expresses different diseases and their detrimental consequences to both quality and quantity of life into one measure – time70,84. One lost disability-adjusted life year (DALY) equals the complete loss of one healthy year of life. Because of its ability to combine different population health effects and dimensions, this approach appears also suitable to represent and quantify the large variety in severity and clinical significance of environmental health outcomes71. The following paragraphs first present estimates of the total burden of disease for the OECD and its income regions, then assess how much of the burden of disease might be attributed to environmental problems, and finally estimate the monetary costs of health lost to environmental exposures.. 4.1.1. Burden of disease in the OECD. Burden of disease estimates in DALYs for 1998 were taken from the WHO World Health Report 199984. This report provides DALYs (age-weighted and future-discounted only) for the world and by 11 geographical and income regions: the Americas (high and low/middle income), Africa, Europe (high and low/middle income), Eastern Mediterranean, South-East Asia (India, other low/middle income) and the Western Pacific (high income, China, other low/middle income). Causes of disease burden are divided in three major disease categories (communicable diseases, non-communicable diseases and injuries) with numerous disease subcategories. Burden of disease estimates in the World Health Report 1999 were derived trying different models dealing with missing data, a number of variables and various types of epidemiological data, resulting in a final model that produced results for 16 major (clusters of) causes of death (WHR Statistical annex p.87-88 84). Although these estimates are associated with many substantial uncertainties, without much doubt they represent the most comprehensive summary of health status available on a global scale. The applied DALY formula with age weights and future discount rate, and the age-specific disability/severity weights have been described in the Global Burden of Disease and Injury Series volume I70. Figures for OECD (high and middle income) and non-OECD were derived using the World Bank country income division85 and OECD 1998 country population data, under the assumption that the country’s or region’s share in the burden of disease of its corresponding WHO and income subregion is equal to its share in the subregion’s population. The total burden of disease in the OECD compared to non-OECD and the world is presented in Table 4.1. Contrasting more and less developed regions, both within the OECD and between OECD and non-OECD, clearly demonstrates that the burden of disease is considerably higher in the less developed countries, with non-OECD regions bearing nearly twice the burden of disease per capita compared to OECD countries. The health transition as described in chapter 2 can to some extent be observed when the diseases causing the loss of health are divided into three large groups, although differences between regions at a certain point in time should not be confused with historic changes and transitions occurring within the same region. The table shows that the burden of disease in less developed countries can be attributed to a larger extent to communicable (infectious, maternal, perinatal, nutritional) disorders, while in more.
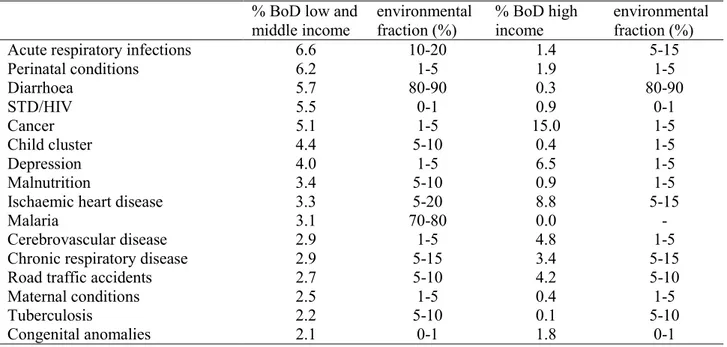
(28) page 28 of 59. RIVM report 402101 001. prosperous regions health is lost primarily through the non-communicable (chronic, degenerative) diseases. At the same time, when compared in absolute terms per capita, the non-communicable diseases cause approximately the same burden of disease for all regions. Table 4.1 (Environmental) Burden of Disease in OECD and the World. Population in millions (%) Burden of Disease (in DALY/1000 cap) Communicable diseases Non-communicable dis. Injuries Environmental Fraction. high income 884 (80% of OECD) 120. OECD lower income 224 (20% of OECD) 190. 8 (7%) 97 (81%) 14 (12%) 1.4-4.3%. 41 (22%) 115 (60%) 34 (18%) 3.7-6.7%. total. non-OECD total. World total. 1 108 (19%). 4 797 (81%). 5 905 (100%). 134. 258. 235. 15 (11%) 101 (75%) 18 (14%) 2.1-5%. 115 (44%) 101 (39%) 42 (16%) 8-12%. 96 (41%) 101 (43%) 38 (16%) 7.4-11%. Note: OECD lower income countries: Czech Republic, Hungary, Mexico, Poland, Turkey. Sources: OECD6, WHO 84, World Bank85; data edited by RIVM.. 4.1.2. Estimating the environmental burden of disease in the OECD. Table 4.1 also presents by region the fraction (with lower and upper limits) of the burden of disease that might be attributed to unfavorable environmental conditions, based on the attributtable fraction for a number of assumedly environment related diseases (see below, Table 4.2 and Table 4.3). World-wide estimates can be up to 11% of the total burden of disease, while the environment related health losses within the lower income OECD region can still be as high as 6.7%. Differences in environmental fraction of the burden of disease between high and lower income areas are again substantial. The following paragraphs describe in more detail how the environmental fractions of the burden of disease of selected diseases were derived, show the difference in size and nature between richer and poorer countries of the world and finally give the etimated environmental burden of disease within the OECD (Table 4.3) The fraction of the total burden of disease that might be attributed to detrimental environmental exposures was estimated as follows. To give a robust indication of environmental disease burden on the level of the OECD, we used the World Health Report 199984 burden of disease estimates for the most important disease categories (causing more than 2% of burden of disease in developing countries). For each category of diseases we made an explicit assessment of the environmental attributable fraction. As briefly discussed in par. 3.3.2, attributable environmental risk refers to the fraction of disease that is eliminated if environmentally exposure was reduced to the lowest feasible level. Of course this lowest feasibly level can not always be defined very sharply as it may depend on available technology, degree of development etc51. Its limits are somewhere between plausible or conceivable and feasible defined as the most favourable level observed. We will avoid in depth discussions on whether attributable fraction refers to etiological, excess or rate fractions, future disease burden or past exposures. Our purpose is simply to come up with a rough estimate of the fraction of disease that will be avoided by feasible and conceivable reductions of environmental exposures86. We accept the fact that attributable fractions added up may account for an attributive percentage well above 100%, appreciating the multi-causal nature of disease aetiology, and the interaction (or interdependency) between different.
Afbeelding
+7


GERELATEERDE DOCUMENTEN
samengewerkt met ouders. Thema-avonden vanuit verschillende organisaties zijn belangrijk om ouders te informeren en met hen af te stemmen over de ontwikkeling van
We present a model that focuses on the relationship between three different aspects: user properties, game mechanics, and learning objectives.. In two example cases, we
al., 2005; Costa‐Black, et al., 2013; Bos, et al., 2004). To prevent chronic fatigue and maintain
When separating AKI patients into groups with and without sepsis, we observed that patients with sepsis-associated AKI had lower levels of albumin-adjusted free thiol levels (6.8
Delayed intensive care unit admission is associated with increased mortality in patients with cancer with acute respiratory failure. Antimicro‑ bial Stewardship in
7KHERDUGPHPEHUV 7KH ERDUG PHPEHUV ZLOO FRQWULEXWH ZLWK WKHLU H[SHUWLVH DQG H[SHULHQFH LQ RUGHU WR UHYLHZ UHFHQW GHYHORSPHQWV RI WKH ,0$* PRGHO ,Q WKLV UHYLHZ WKH\ ZLOO
Again, on most farms, positive results for vaginal swabs in goats and/or sheep were accompanied by positive results for the surface area swabs taken on the same farm, and vice
In the duplicate analysis study each laboratory had to send a selection of 60 meat juice samples to the CRL-Salmonella, who collected all meat juice samples and sent them to the
