Noise monitor 2008
Measurements and validation of environmental noise
Report 680740002/2009
RIVM report 680740002/2009
Noise monitor 2008
Measurements and validation of environmental noise
E.M. Schreurs E.N.G. Verheijen C.J.M. Potma J. Jabben Contact: Eric Schreurs
Centre for Environmental Monitoring eric.schreurs@rivm.nl
This investigation has been performed by order and for the account of the Ministry of Housing, Spatial Planning and the Environment (VROM DGR-LOK), within the framework of the project ‘Monitoring Geluid’, project number M/680740/08/SB
© RIVM 2009
Parts of this publication may be reproduced, provided acknowledgement is given to the 'National Institute for Public Health and the Environment', along with the title and year of publication.
Abstract
Noise monitor 2008
Measurements and validation of environmental noise
The road traffic noise levels at the A12 motorway near Voorburg were lower in 2008 than in 2007. This decrease results from the repaving of the road surface with a double porous asphalt layer (DLPA) in September 2007. The reduction in noise level realized at this time was sustained in 2008.
The noise level at the A10 motorway near Amsterdam, however, was found to have increased slightly over the course of 2008. Measurements taken in 2006 indicated that most of the noise reduction effect of the porous asphalt layer installed in 2001 had disappeared. This decreased capacity to reduce noise is likely due to silting up of the pores and texture wear due to intensive traffic.
These are the main results of Noise monitor 2008. The monitoring programme was initiated in 1999 with the aim of monitoring trends in environmental noise levels due to road and rail traffic. Noise measurements in 2008 were carried out at locations along the A2 (Breukelen), A10-west (Amsterdam), A12 (Voorburg) and N256 (Noord-Beveland) motorways. Measurement results provided by ProRail at Esch and Willemsdorp were used for the analysis of railway noise. Results of sample measurements of urban traffic carried out by the RIVM in Utrecht in 2009 are also presented. The noise emission levels measured for road traffic at the monitoring sites with standard pavement (DAC) were found to be a few decibels higher than the reference value of the Dutch computation method, while those at the
monitoring sites for railway noise were fairly consistent with the predicted value. The computation methods are provided by the Dutch Ministry of Housing, Spatial Planning and the Environment to calculate noise due to road and railway traffic.
Key words:
Rapport in het kort
Geluidmonitor 2008
Trend- en validatiemetingen omgevingsgeluid
De gemiddelde geluidbelasting op de A12 bij Voorburg is in 2008 lager dan in 2007. De geluidreductie is bereikt door de aanleg van dubbellaags zeer open asfaltbeton (DZOAB) als deklaag in september 2007. De afname die in september 2007 werd gerealiseerd bleef in 2008 behouden.
Op de A10-west bij Amsterdam is in 2008 wederom een kleine geluidtoename gemeten ten opzichte van het jaar ervoor. In 2006 bleek al dat geluidreducerende werking van het wegdek op deze locatie vrijwel geheel is verdwenen. Oorzaak is waarschijnlijk de vervuiling en slijtage tengevolge van het intensieve verkeer. Het poreuze asfalt op deze locatie stamt uit 2001.
Dit zijn de belangrijkste resultaten uit de Geluidmonitor 2008. Het meetprogramma bestaat sinds 1999 en registreert ontwikkelingen in omgevingsgeluid door wegverkeer en railverkeer. Voor
wegverkeersgeluid zijn in 2008 metingen verricht langs de A2 bij Breukelen, de A10-west bij
Amsterdam, de A12 bij Voorburg en de N256 in Noord-Beveland. Voor railverkeer is gebruikgemaakt van meetresultaten van ProRail uit 2008 bij Esch en Willemsdorp. Ten slotte zijn resultaten toegevoegd van steekproefmetingen in stedelijk verkeer die het RIVM in 2009 heeft uitgevoerd in Utrecht. De gemeten geluidemissies op locaties met standaard wegdek (Dicht Asfalt Beton, DAB) bleken enkele decibellen hoger dan het Nederlandse Reken- en Meetvoorschrift voorspelt. De gemeten geluidemissies aan railverkeer zijn overwegend consistent met het Nederlandse rekenvoorschrift. Deze voorschriften worden door het ministerie van VROM uitgegeven om de geluidbelasting door weg- en railverkeer te berekenen.
Trefwoorden:
Contents
Summary 9 Samenvatting 11 1 Introduction 13 1.1 Goal 13 1.2 Monitor locations in 2008 132 Road Traffic Noise 15
2.1 Motorway A2 Breukelen 15
2.2 Motorway A10-west Amsterdam 18
2.3 Motorway A12 Voorburg 20
2.4 N256 Motorway Noord-Beveland 24
3 Urban road noise measurements 31
3.1 Goal 31
3.2 Measurement method and locations 31
3.3 Comparison with national computation method 32
3.4 Noise emission versus year of construction 33
3.5 Noise emission versus cylinder volume 34
3.6 Measured and registered noise emission 34
3.7 Conclusion 35
4 Railway noise 37
4.1 Monitoring stations ProRail 37
4.2 Results 37
4.3 Causes of the differences 39
4.4 Conclusion 39
5 Conclusions 41
References 43
Appendix 1 Measurement sites for road noise 45
Appendix 2 Description of measurement equipment 49
Appendix 3 Measured vs calculated noise N256 50
Appendix 4 Emission railway vehicles 51
Appendix 5 Emission and roughness for railways 52
Summary
This report gives the results of the noise monitoring programme at the RIVM obtained in 2008 and 2009. The programme aims at monitoring noise emissions from road and railway traffic under various meteorological conditions, by use of continuously operating measurement sites.
Roadway traffic noise
In 2008 results were obtained and analyzed for four measurement sites: the A2 motorway at Breukelen (near Utrecht), the A10 motorway at the west side of Amsterdam, the A12 motorway near Voorburg (the Hague) and the N256 in the province of Zeeland. In addition to these continuous measurements, sample measurements were performed in 2009 on urban roads.
A2 Breukelen 2008
The measured noise levels over 2008 have increased slightly with respect to the noise levels from previous years. This is possibly due to construction works in 2008, broadening the A2 motorway. In 2008 the construction of a new road was finished, followed by a redirection of the traffic to this new road. In 2010 work at the motorway will be finished. The development over the past five years is shown in Figure 2.1 on page 16.
A10-west Amsterdam 2008
Ever since measurements started in 2003, the measured noise levels have increased at this measurement site, with the exception of 2006. This was caused by a reduction of the maximum speed from 100 km/h to 80 km/h. The speed reduction however could not prevent further deterioration in 2008. For the past five years, the average noise level has increased with 3 dB. This is probably caused by silt up and texture wear of the road surface. Figure 2.3 on page18 shows the development of the noise levels at this site.
A12 Voorburg 2008
In July 2005 the RIVM set up a third measurement site near the A12 motorway at Voorburg, in the vicinity of The Hague. Since the measurements started two measures have been taken at the site that caused a decrease in the noise levels. The first was a speed reduction, implemented in November 2005. The second was a repaving of the road surface with double layer porous asphalt in September 2007. The repaving caused a considerable decrease of noise levels in 2008, as shown in Figure 2.4 on page 21.
N256 Noord-Beveland (Colijnsplaat)
Measurements at this site started in December 2004, a road with Dense Asphalt Concrete (DAC) surface. Apart from noise levels, for each car pass-by the type of vehicle and its speed can be registered using an automated counting device. This allows for further differentiation of noise emissions for three different categories: light vehicles, middleweight trucks and heavy weight trucks. After a small decrease in 2006, the sound power levels for passenger cars as well as trucks in 2008 were at
approximately the same level as in 2004 and 2005. The measured levels here are 3 to 4 dB higher than the calculated values from the Dutch computation method for a reference paving (VROM, 2006a) and are more in agreement with the emissions specified by the NORD 2000 calculation method (Jonasson, 2007).
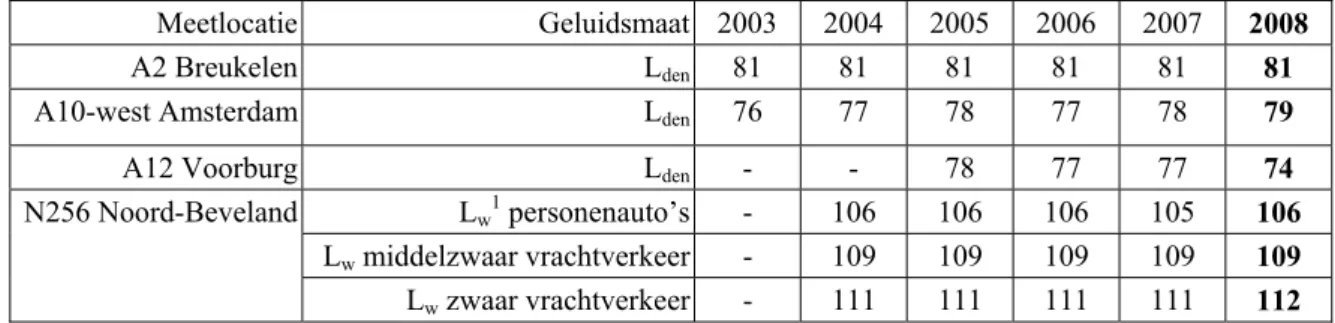
The monitoring results for road traffic noise are summarized in Table S1.
Table S1 Monitoring results from road traffic noise 2000-2006 in dB(A).
Measurement site Noise indicator 2003 2004 2005 2006 2007 2008 A2 motorway Breukelen Lden 81 81 81 81 81 81 A10-west motorway Amsterdam Lden 76 77 78 77 78 79 A12 motorway Voorburg Lden - - 78 77 77 74 LW passenger cars - 106 106 106 105 106 LW light trucks - 109 109 109 109 109 N256 motorway Noord-Beveland LW heavy trucks - 111 111 111 111 112 Sound power level per vehicle in dB(A) ref 10 12 Watt, averaged over 24 hour
Urban road traffic noise
In 2008 and 2009 the RIVM performed sample measurements at urban roads in order to gain an insight into urban road traffic noise. In 2009 the measurements were performed at the Moezeldreef and the Donaudreef in Utrecht, which were both paved with Dense Asphalt Concrete (DAC). Using the license plate numbers the vehicles can be differentiated from type, and also an indicative speed measurement was performed for each vehicle. With this information, comparisons with the Dutch computation method can be done, yet the results are only indicative because of the relatively small amount of measurements.
The sample measurements showed that for light vehicles travelling with speeds above 45 km/h the measured values exceeded the reference values according to the Dutch calculation method. Additionally it is shown that there is no correlation between the measured noise emissions and emissions gained with an environmental type testing method (VCA, 2009). Meanwhile, a new test procedure has become available that better reflects noise emissions in urban areas.
Railway traffic noise
With regards to the noise emissions of railway stock, measurement data were provided by the Dutch track manager ProRail (Kenniscentrum Geluid). These data were gathered at two sites along Dutch railway lines: Esch (between Den Bosch and Eindhoven) and Willemsdorp (between Dordrecht and Breda). The RIVM compared the data with standard noise emission data from Dutch calculation models (VROM, 2006b). The results are shown in Figure 4.2 on page 38.
The differences between measurements and models are smaller than 2 dB. As for technical reasons the analysis was restricted to passenger trains, the results may not be representative for lines where freight trains dominate the noise emission.
Samenvatting
De onderhavige rapportage betreft de resultaten van geluidmetingen aan weg- en railverkeer uit 2008 en deels uit 2009. De metingen zijn gericht op het signaleren van trends in geluidemissies,
onafhankelijk van modelveronderstellingen.
Wegverkeer
In 2008 zijn metingen verricht en geanalyseerd voor de volgende vaste locaties: de A2 bij Breukelen, de A10-west bij Amsterdam, de A12 bij Voorburg en de N256 op Noord-Beveland. Verder zijn opnieuw steekproefmetingen uitgevoerd in een stedelijke omgeving.
A2 Breukelen 2008
De meetresultaten langs de A2 zijn in 2008 licht gestegen ten opzichte van de voorgaande jaren. Dit is mogelijk veroorzaakt door stoorgeluid van wegwerkzaamheden in 2008. In dat jaar is de A2 ter hoogte van Breukelen namelijk tijdelijk iets naar het westen verlegd in verband met een wegverbreding. Naar verwachting zal de wegverbreding in 2010 voltooid zijn, waarbij de rijbaan richting Amsterdam weer dichter bij het meetstation komt te liggen. Het verloop van de jaargemiddelde geluidniveaus voor de afgelopen vijf jaar is weergegeven in Figuur 2.1 op bladzijde 16.
A10-west Amsterdam 2008
Vanaf de start van de metingen in 2003 is de geluidemissie toegenomen op de meetlocatie langs de A10. Alleen in 2006 was er een kleine afname, vanwege de snelheidsverlaging van 100 naar 80 km/u. Het effect daarvan op de emissie was echter onvoldoende om verdere toename van in 2007 te
compenseren. De geluidsgroei bedraagt ongeveer 3 dB in 5 jaar tijd en is waarschijnlijk het gevolg van een verslechtering van de kwaliteit van het wegdek, deels ZOAB en deels dubbellaags ZOAB.
Het verloop van de jaargemiddelde geluidniveaus is weergegeven in Figuur 2.3 op bladzijde 18.
A12 Voorburg 2008
In juli 2005 is het RIVM gestart met metingen langs de A12 bij Voorburg. Sindsdien zijn twee maatregelen genomen die van invloed waren op de gemeten geluidsniveaus. De eerste was een
snelheidsverlaging in november 2005. De tweede maatregel betrof de aanleg van dubbellaags ZOAB in september 2007. Vooral het nieuwe asfalt veroorzaakte een aanzienlijke daling van de gemeten
geluidniveaus. Figuur 2.4 op bladzijde 21 laat het verloop van de jaarsgemiddelde geluidniveaus zien voor deze locatie.
N256 Noord-Beveland (Colijnsplaat)
De meetpost is in bedrijf sinds december 2004. Bij elke voertuigpassage worden met een speciale tellus de rijsnelheid en het type voertuig gedetecteerd. Hierdoor kan op deze meetlocatie de geluidemissie van lichte, middelzware en zware motorvoertuigen op een Dicht Asfalt Beton (DAB) wegdek worden gevolgd. Na een lichte afname in 2006 zijn de emissies van personenauto’s en vrachtwagens in 2008 weer terug op het niveau van 2004 en 2005. Opvallend is dat de emissies voor dit type wegdek structureel hoger zijn dan die in het Nederlandse Reken- en meetvoorschrift geluidhinder (VROM, 2006a) en lijken meer overeen te stemmen met emissies die het NORD 2000 model voorschrijft (Jonasson, 2007).
De meetresultaten van alle vier de locaties zijn samengevat in Tabel S1.
Tabel S1 Meetresultaten voor wegverkeersgeluid 2003-2008 in dB(A).
Meetlocatie Geluidsmaat 2003 2004 2005 2006 2007 2008
A2 Breukelen Lden 81 81 81 81 81 81
A10-west Amsterdam Lden 76 77 78 77 78 79
A12 Voorburg Lden - - 78 77 77 74
Lw1personenauto’s - 106 106 106 105 106
Lwmiddelzwaar vrachtverkeer - 109 109 109 109 109
N256 Noord-Beveland
Lwzwaar vrachtverkeer - 111 111 111 111 112 1 in dB(A), 24-uursgemiddelde over personenauto’s en vrachtauto’s
Stedelijk wegverkeer
In 2008 en 2009 zijn een aantal (bemande) steekproefmetingen verricht aan wegverkeer in een stedelijke omgeving. De metingen zijn in 2009 in Utrecht verricht langs de Moezeldreef en de
Donaudreef. Beide locaties zijn voorzien van Dicht Asfalt Beton (DAB). Aan de hand van het kenteken kon onderscheid naar voertuigtype worden gemaakt. Ten opzichte van voorgaande jaren (Schreurs et al., 2008) is de steekproef dit jaar uitgebreid met een snelheidsbepaling, zodat het mogelijk wordt de metingen te vergelijken met het Reken- en meetvoorschrift geluidhinder. Ook zijn correlaties op voertuigkenmerken verricht. Omdat de steekproefomvang relatief klein is, zijn de conclusies slechts indicatief. De steekproef gaf voor personenauto’s bij snelheden boven 45 km/u hogere waarden dan de referentiewaarden in het Reken- en meetvoorschrift geluidhinder. Verder is duidelijk dat de
geluidemissie die bij de typekeuringsmetingen wordt opgegeven, niet duidelijk correleert met de bij de steekproef gemeten geluidemissie. Inmiddels is de internationale meetmethode voor typekeuringen overigens herzien om de representativiteit voor stadsverkeer te verbeteren.
Railverkeer
Net als voorgaande jaren maakt deze Geluidmonitor gebruik van de geluidmeetposten van ProRail. Deze meetposten staan op verschillende vaste en tijdelijke locaties langs het spoor. In 2008 betreft het metingen op de vaste locaties Esch (Den Bosch-Eindhoven) en Willemsdorp (Dordrecht-Breda). Het RIVM heeft deze metingen vergeleken met waarden volgens het Reken- en meetvoorschrift
geluidhinder (VROM, 2006b). De resultaten zijn weergegeven in Figuur 4.2 op bladzijde 38. De verschillen tussen de metingen en berekeningen liggen binnen 2 dB. Omdat de analyse om technische redenen slechts betrekking heeft op reizigerstreinen, zijn de resultaten niet representatief voor spoorlijnen waar veel goederentreinen rijden.
1
Introduction
1.1
Goal
This report gives the results of the noise monitoring programme at the RIVM obtained in 2008. The programme aims at monitoring noise emissions from road and railway traffic under various
meteorological conditions, by use of continuously operating measurement sites. The measurements can be used to analyze trends in sound emissions, and validate the noise propagation models which are used to support the Dutch National noise policies.
1.2
Monitor locations in 2008
Road traffic
The measurements of road traffic noise by the RIVM take place at several locations, and monitoring at these locations is almost continuous. The topographic details of the measurement sites are given in Appendix 1, and on the website http://www.rivm.nl/milieukwaliteit/geluid/ measurement data can be downloaded. The four current measurement locations are as follows:
Motorway A2 Breukelen
This is a measurement site at nearly 15 meters distance of the A2 motorway near Breukelen. The A2 connects two of the largest cities in the Netherlands, Utrecht and Amsterdam, and subsequently is one of the busiest motorways in the Netherlands. The site is also used by the Dutch National Air Quality Monitoring Network (LML in Dutch), and the noise monitor shares its power supply and housing with the air quality monitors. Measurements at this site started in 1999, and since February 2000 the measurements are performed continuously.
Motorway A10-west Amsterdam
This measurement site is located east of the A10-West, which is the western part of the Amsterdam beltway, and measurements are performed since 2003. In 2001, the road at this site was paved with a double layer porous asphalt concrete (DLPA), a sound reducing paving. Consequently the
measurements at this site concern the sound reducing qualities of the DLPA paving over the course of time. Additionally the maximum speed at this site was lowered to 80 km/h in November 2005.
Motorway A12 Voorburg
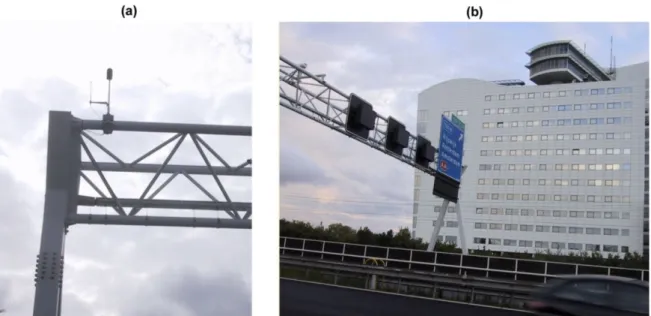
In June 2005 monitoring started at the A12 motorway near Voorburg. The A12 is the principal arterial road for the city of The Hague. The noise monitor was placed at the north side of the A12, on top of a signaling bridge. As with the A10-West, a speed reduction was implemented in November 2005, and in September 2007 the road was resurfaced with a DLPA paving.
Provincial road N256 Noord-Beveland (Colijnsplaat)
This site aims at monitoring the noise emission of the three vehicle categories. The noise monitor is operational since December 2004. A counting device is used here to determine the vehicle type and pass-by speed. During night time the vehicle flow rate is low enough to measure separate pass-by
events. These are used to assess the speed-dependency of the noise emission per vehicle category and to compare the results with the national computation method.
Urban road traffic
Since 2005 sample measurements of motor vehicles driving on urban roads have been analyzed. The objective was to find out if certain vehicle types have a higher noise emission than other types. Also the variation in low frequency noise was investigated. The sample measurements have now been extended in size and also the driving speed is measured. This enables a comparison of the relationship between noise emission and speed with the reference curves of the national computation method. In addition, the correlation between the measured noise emission and the relevant registered vehicle features can be determined (cylinder volume, car lifetime, noise emission from type test). Chapter 3 shows the results.
Railway traffic
Since 2006 the measurement results of the ProRail monitoring stations have been used to evaluate the noise emission of trains. In this report the results of two locations referring to the three main categories of passenger trains have been analyzed in chapter 4.
2
Road traffic noise
2.1
Motorway A2 Breukelen
2.1.1
Description
The topographic details of the location are shown in Appendix 1. The measurement site is located at a distance of approximately 15 m east of the motorway, and is part of a measurement site of the Dutch National Air Quality Monitoring Network. The road is paved with dense asphalt concrete (DAC), with maximum 16 mm chippings. The maximum speed is 120 km/h, and the road is divided in three traffic lanes for each direction. For some time however, work on the road is present at this site in order to broaden it to five lanes in each direction. In 2006 construction started on an entirely new road west from the current A2 motorway. Since the measurement site was located at the east site of the A2, the work did not interfere with the measurements ever since the work had begun (Schreurs et al., 2008. In December 2008 the new road was finished, and subsequently work began on the old road, where our monitor was located. Traffic was redirected to the new road, which will have its consequences for the monitor results in 2009. As shown in the photo below, the monitor located on the east side of the road is further away from the traffic now making use of the new road on the west side. In combination with the added sand wall, the noise from the traffic is heavily reduced. Therefore for the analysis of the 2008 monitor results, only the period up to December 2008 was considered.
The situation at the A2 near Breukelen in January 2009, with on the right side the concrete housing of the noise monitor, and on the left side traffic on the newly constructed road.
2.1.2
Monitor results 2008
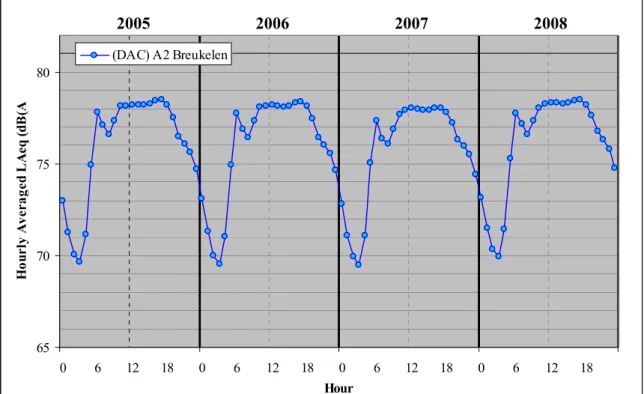
The yearly averaged 24-hour noise level distribution in 2008 is shown in Figure 2.1. By way of comparison, this figure also shows the 24-hour noise level distributions of the LAeq since 2005. 24-hour noise level distributions since 2000 can be found in one of the earlier Noise monitor reports of the RIVM (Schreurs et al., 2008).
2005 2006 2007 2008 65 70 75 80 0 6 12 18 0 6 12 18 0 6 12 18 0 6 12 18 Hour H ou rl y A ve rage d L A eq (d B (A (DAC) A2 Breukelen
Figure 2.1 Average 24-hour noise level distributions, measured at the A2 motorway near Breukelen over the years 2005-2008.
Table 2.1 shows the equivalent noise levels for the day, evening and nighttime periods, as well as the Lden, which is a daily averaged noise level with penalties for evening and nighttime periods.
Table 2.1 Equivalent noise levels LAeq en Lden, A2 Breukelen 2000-2008.
2000 2001 2002 2003 2004 2005 2006 2007 2008 LAeq, 7-19h 77.6 77.8 77.7 77.9 78.0 78.0 77.9 77.6 78.0 LAeq, 19-23h 75.8 76.4 76.2 76.6 76.6 76.5 76.4 76.3 76.7 LAeq, 23-7h 73.3 73.4 73.2 73.7 73.7 73.7 73.7 73.5 73.8 Lden 80.8 81.0 80.8 81.2 81.3 81.2 81.2 81.0 81.4
2.1.3
Evaluation
Over the years, the difference between the maximum and minimum yearly averaged noise levels is 0.6 dB(A). This means that no significant changes in the noise emission and wear of the road surface have taken place. For 2008, a slight increase of the noise levels with respect to the year before is observed, yet this is probably due to the work on the road which has started in 2008.
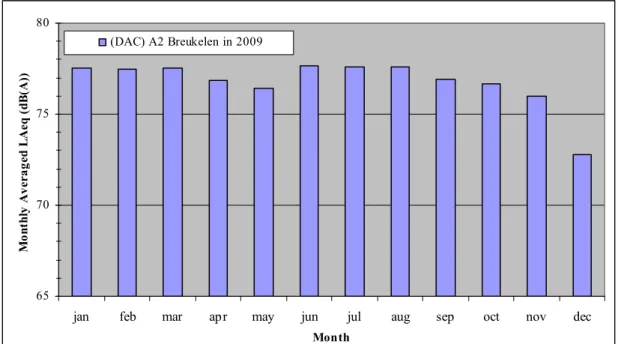
For the next years, the work on the road will influence the monitor results, as Figure 2.2 shows that when the traffic was redirected to the newly built road, noise levels measured by the monitor dropped with almost 4 dB. When in 2010 the work on the road will be finished, it will be interesting to compare the current results with the new situation.
65 70 75 80
jan feb mar apr may jun jul aug sep oct nov dec
Month M ont hly A ve ra ge d L A eq (dB (A )) (DAC) A2 Breukelen in 2009
Figure 2.2 Progress of the monthly averaged LAeq at the A2 Breukelen in 2008. Before averaging the noise levels have been compensated for the influence of temperature according to Ct=-0.1(T-10) when T>10 °C and Ct=0 when T<10 °C.
2.2
Motorway A10-west Amsterdam
2.2.1
Description
A second RIVM noise monitor site is located at the east side of the A10-west in Amsterdam, where monitoring started in 2003. The details of the location of this site are given in Appendix 1. The noise monitor is located between the A10-west motor way and an apartment building, so the monitor can not be considered to be in the free field. A 2 dB reduction is therefore needed to compensate for the façade reflection.
The motorway itself is divided in ten traffic lanes, of which two on each side are exits for joining and leaving the motorway. The road surface consists of a DLPA layer, and maximum speed is 80 km/h, which is strictly enforced using a traffic monitor system since November 2005.
2.2.2
Monitor results 2003-2008
Figure 2.3 shows the yearly averaged 24-hour noise level distributions from 2003 until 2008.
2003 2004 2005 2006 2007 2008 60 65 70 75 80 0 6 12 18 0 6 12 18 0 6 12 18 0 6 12 18 0 6 12 18 0 6 12 18 Hour H ou rl y Av er ag ed L A eq ( d B (A) )
(DLPA) A10-West Amsterdam
Figure 2.3 Average 24-hour noise level distributions, measured at the A10-west motorway in Amsterdam over the years 2003-2008.
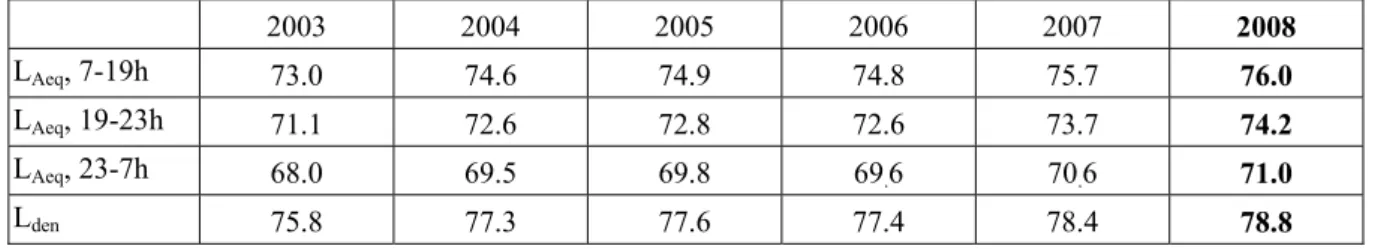
Table 2.2 shows the equivalent noise levels for the day, evening and nighttime periods and the Lden.
Table 2.2 Equivalent noise levels LAeq and Lden measured at the A10-west in Amsterdam
2003 2004 2005 2006 2007 2008
LAeq, 7-19h 73.0 74.6 74.9 74.8 75.7 76.0
LAeq, 19-23h 71.1 72.6 72.8 72.6 73.7 74.2
LAeq, 23-7h 68.0 69.5 69.8 69.6 70.6 71.0
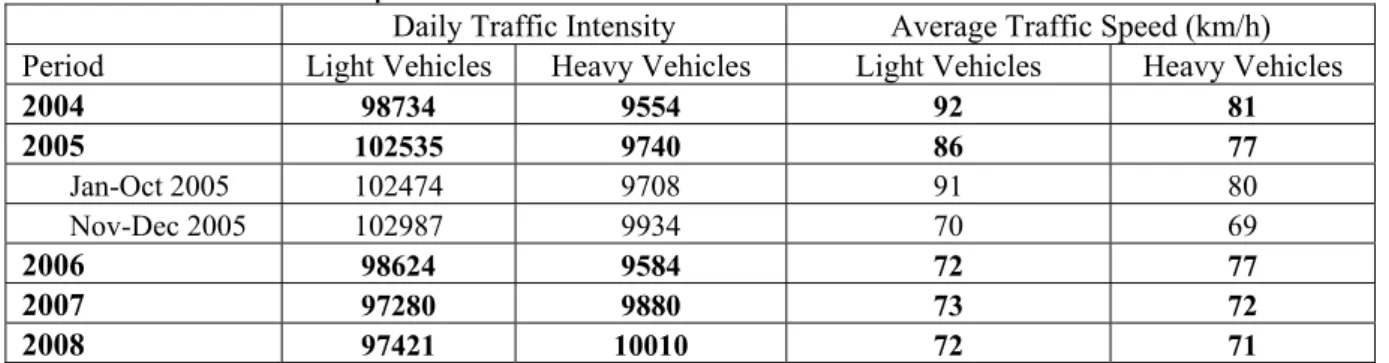
Table 2.3 shows the number of vehicles and their speeds measured at the site, using data provided by ‘Rijkswaterstaat’, the Dutch agency concerned with construction and maintenance of the motorways.
Table 2.3 Traffic numbers and speeds at the A10-west Amsterdam since 2005.
Daily Traffic Intensity Average Traffic Speed (km/h) Period Light Vehicles Heavy Vehicles Light Vehicles Heavy Vehicles
2004 98734 9554 92 81 2005 102535 9740 86 77 Jan-Oct 2005 102474 9708 91 80 Nov-Dec 2005 102987 9934 70 69 2006 98624 9584 72 77 2007 97280 9880 73 72 2008 97421 10010 72 71
Source: Rijkswaterstaat-DVS (counting point 35675 Geuzeveld)
2.2.3
Evaluation
Figure 2.3 shows how the LAeq develops at the A10-west since 2003. In contrast with the A2, the 24-hour noise level distributions clearly show an increase over the years. Only in 2006 was this increase with respect to the year before. This is probably due to the decrease in maximum speed form 100 km/h to 80 km/h, which has been enforced since November 2005. This decrease in traffic speed seems to have compensated the increase of the noise due the deterioration of traffic speed. The average 24-hour noise level distributions of 2007 and 2008 however show an increase of the noise exposure with about 1 dB and 0.5 dB respectively, which is probably caused by further pollution and
deterioration of the paving. Comparisons with Dense Asphalt Concrete-emissions and close proximity measurements at the site (Schreurs et al., 2008) have shown that the DLPA paving at this site does not provide the sound reduction with respect to a DAC layer anymore.
2.3
Motorway A12 Voorburg
2.3.1
Description
In July 2005, the RIVM established a noise monitor site along side the A12 motorway at Voorburg, near The Hague. The monitor was place on a traffic portal, as shown in the photo below. The A12 at this site consists of six traffic lanes, three in each direction. At the time when monitoring at this started, the maximum speed was 100 km/h, and the paving on the northern traffic lanes was DLPA, and on the southern lanes PAC. Subsequently two measures were taken at this site which influenced the noise monitoring. First in November 2005, the maximum speed was lowered to 80 km/h, and this was enforced using a traffic monitor system as with the A10-West. Finally in September 2007, all of the paving was replaced with a DLPA layer, in both directions.
The microphone (Larson-Davis 870) as it is placed on the portal (a) and the portal itself at the A12 (b).
2.3.2
Monitor results 2005-2008
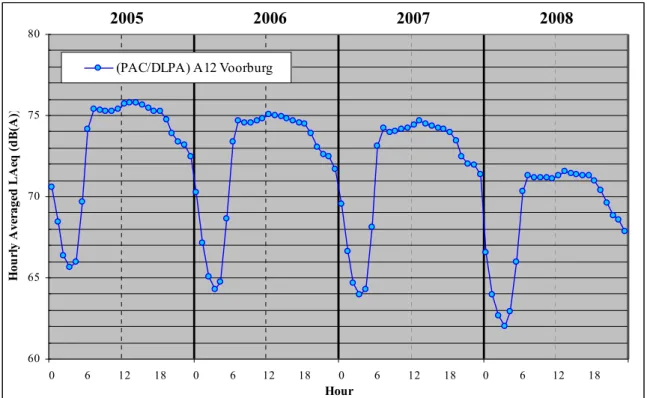
Figure 2.4 shows the yearly averaged 24-hour noise level distributions from July 2005 until 2008. It should be noted that the yearly averaged noise level distribution for 2005 is technically half-yearly averaged, as monitoring started in July 2005.
2005 2006 2007 2008 60 65 70 75 80 0 6 12 18 0 6 12 18 0 6 12 18 0 6 12 18 Hour Ho u rly A ver ag ed L A eq ( d B (A ))
(PAC/DLPA) A12 Voorburg
Figure 2.4 Average 24-hour noise level distributions, measured at the A12 motorway in Voorburg over the years 2005-2008.
Table 2.4 shows the equivalent noise levels for the day, evening and nighttime periods and the Lden.
Tabel 2.4 Equivalent noise levels LAeq and Lden measured at the A12 in Voorburg.
2005 2006 2007 2008 LAeq, 7-19u 75.5 74.7 74.2 71.3 LAeq, 19-23u 73.8 73.0 72.5 69.4 LAeq, 23-7u 70.2 69.3 68.9 66.2 Lden 78.1 77.3 76.9 74.0
2.3.3
Evaluation
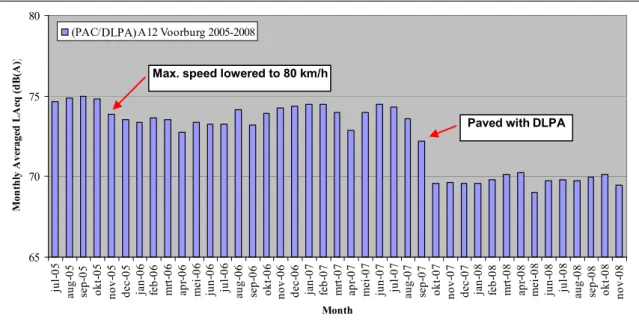
Figure 2.4 and Table 2.4 show a considerable decrease of the noise at this site over the years, at first with 0.8 dB and 0.4 dB, and subsequently a decrease of 3 dB from 2007 to 2008. This is caused by the decrease of the maximum speed at this site in November 2005, and subsequently the repaving with DLPA in September 2007. The influence of these measures can be observed more clearly in Figure 2.5, where the monthly averaged equivalent noise levels are shown from July 2005 up until November 2008. The red arrows in this figure show at what time the two measures came into effect.
65 70 75 80 ju l-05 aug-05 se p-05 okt -05 nov-05 dec-05 ja n-06 fe b-06 mr t-06 ap r-0 6 me i-06 jun-06 ju l-06 aug-06 se p-06 okt -06 nov-06 dec-06 ja n-07 fe b-07 mr t-07 ap r-0 7 me i-07 jun-07 ju l-07 aug-07 se p-07 okt -07 nov-07 dec-07 ja n-08 fe b-08 mr t-08 ap r-0 8 me i-08 jun-08 ju l-08 aug-08 se p-08 okt -08 nov-08 Month M ont hl y Av er ag ed L A eq ( d B (A) )
(PAC/DPAC) A12 Voorburg 2005-2008
Max. speed lowered to 80 km/h
Paved with DPAC
DLPA)
DLPA
Figure 2.5 Progress of the monthly averaged LAeq from July 2005 until November 2008. Before averaging the noise levels have been compensated for the influence of temperature according to Ct=-0.1(T-10) when T>10 °C and Ct=0 when T<10 °C.
The speed reduction in November 2005 caused at first a sound reduction of around 2 dB, yet in 2006 this reduction seems to have faded slightly. The effect of the DLPA paving however is far more substantial, as the monthly averaged LAeq decreases with 4 dB in October 2007. Considering that the paving before the renewal already was a combination of DLPA and PAC (therefore already more silent than DAC), it can be concluded that the new DLPA layer satisfies as a ‘silent road’. Also taking into account the monthly averaged levels in 2008, no signs of wear of the new DLPA paving is noticeable.
2.3.4
Influence of precipitation on the noise emission
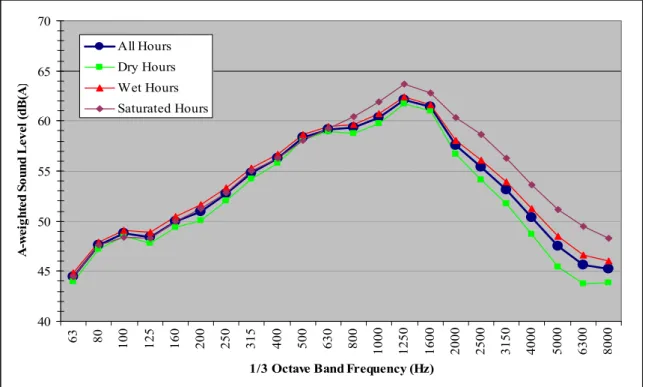
In Noise Monitor 2007 it is described that the noise levels perceived by the monitor at the A12 are dependent on the amount of rain that falls or has fallen in the previous hours (Schreurs et al., 2008). This was done for the A12. This year however the yearly averaged noise levels have decreased due to the new DLPA layer present at this site, and this has also its effect on the precipitation dependency of the measured noise levels. The results are shown in Figure 2.6, which shows the measured spectra for four different situations:
− the dry hours from the measurements, meaning the hours for which in the previous 48 hours less than 1 mm of rain has fallen;
− the wet hours from the measurements, meaning the hours for which in the previous 48 hours more than 1 mm of rain has fallen;
− the saturated hours from the measurements, meaning the hours for which in the previous 12 hours more than 8 mm of rain has fallen;
− all hours for the measurement, included for comparison.
The information on the amount of precipitation was provided by the Dutch Meteorological institute (KNMI).
40 45 50 55 60 65 70 63 80 100 125 160 200 250 315 400 500 630 800 1000 1250 1600 2000 2500 3150 4000 5000 6300 8000
1/3 Octave Band Frequency (Hz)
A -w ei ght ed So und L ev el (dB (A ) All Hours Dry Hours Wet Hours Saturated Hours
Figure 2.6 Influence of precipitation on the spectrum measured at A12 Voorburg in 2008.
From Figure 2.6 it can be concluded that in the wet hours the noise emission from the road are higher. For the saturated hours, when the amount of precipitation is substantial, the noise emission peaks. The figure also shows that this increase in noise emission is present for the frequencies above 630 Hz, yet also for the lower frequencies between 125 Hz and 400 Hz. At the frequencies around 500 Hz, the noise emission might consist more of propulsion noise than the tyre/road noise, and propulsion noise does not depend on the amount of precipitation. The fact that tyre/road noise does depend on the amount of precipitation, is probably caused by the rain filling the porous cavities of the DLPA surface, decreasing the amount of the acoustic absorption by the road surface. The Noise Monitor 2007 showed that the difference in noise levels between a dry road surface and a saturated road surface can be as much as 2.5 dB(A) (Schreurs et al., 2008).
Before September 2007 however, the road surface consisted of a PAC and a DLPA surface of which the drainage capacity was not optimal due to age and wear. In September 2007 the road was resurfaced with DLPA, and Table 2.5 shows that the yearly averaged noise levels differ only 1.2 dB(A) between the dry and the saturated hours. For the wet hours, which applies to 46 % of the measurements, the increase of the measured noise level is only 0.4 dB(A). This shows that precipitation together with the drainage capacity of the road surface are major factors on the noise emission, and that drainage capacity should be considered when designing silent road surfaces.
Table 2.5 Hourly Averaged LAeq levels measured at the A12 Voorburg in 2008.
Dry hours All Hours Wet hours Saturated Hours
Averaged LAeq (dB(A)) 69.5 69.8 69.9 70.7
Difference with All hours -0.3 - 0.1 0.9
2.4
N256 Motorway Noord-Beveland
2.4.1
Measuring site
In August 2004 a noise monitor site was set up at the N256 motorway Noord-Beveland near Colijnsplaat in the province of Zeeland.
RIVM monitoring site at N256 motorway (Noord-Beveland).
At the site, apart from noise levels, also for each car pass-by the type of vehicle and its speed are registered using an automated counting device. This allows for further differentiation of noise
emissions for three different categories: light vehicles, middleweight trucks and heavyweight trucks. At the other road traffic sites (A2 and A12), this differentiation is only possible using a multiple regression technique, which contains a relatively large uncertainty. Due to this uncertainty, small changes in the emission per category cannot be monitored accurately.
At the site along the N256, noise levels are only registered during the night time from 02:00 to 04:00 h. Furthermore, only noise events with a separation time over 30 seconds are registered, so that the chance of measuring two or more events simultaneously is minimized.
The road surface constists of a Dense Asphaltic Concrete layer with stone chipping from 0-11 mm (DAC 0-11). The pavement is shown in the picture below. The microphone is placed at 7.5 m from the road centreline and at a height of 4 m. Appendix 1 shows a map of the surroundings. Further
Pavement of N256 near the RIVM monitoring site.
2.4.2
Measured results 2008
Only the noise events that could be matched unambiguously with the registered pass-by times and with a minimum separation time of 30 seconds (approximately 650 m at 80 km/h) were used in the analysis. Sufficient events complying with this condition could only be obtained during the night time from 02:00 to 04:00 h.
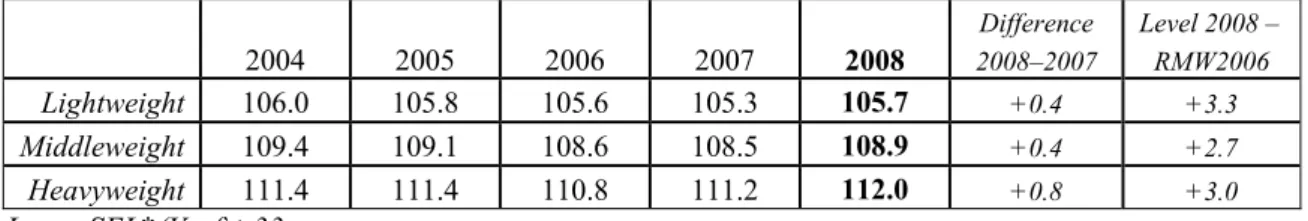
Table 2.6 shows the average measured sound power levels of the different vehicle categories over the years 2004 up to 2008. These levels are valid for a reference speed of 80 km/h for light vehicles and 70 km/u for middleweight and heavyweight trucks. Also the difference between the average measured sound power level and the value according to the Dutch standard calculation model (VROM, 2006a) is given.
Table 2.6 Sound power levels LWA 2004-2008 as measured at the N256 Noord-Beveland. All levels are valid for passages between 02:00 and 04:00 h.
2004 2005 2006 2007 2008 Difference 2008–2007 Level 2008 – RMW2006 Lightweight 106.0 105.8 105.6 105.3 105.7 +0.4 +3.3 Middleweight 109.4 109.1 108.6 108.5 108.9 +0.4 +2.7 Heavyweight 111.4 111.4 110.8 111.2 112.0 +0.8 +3.0 LWA = SEL*(Vref)+33
As compared with 2007, the noise emissions of all categories have increased slightly. A small
seemingly decreasing trend as appeared over 2004-2007 is no longer present. Most notable is the rather large difference of approximately 3 dB for all categories between the measured levels and the values deduced from the Dutch computation method.
A seasonal trend, due to varying temperature is depicted in Figure 2.7. The levels during the summer months May-August is lower. This effect is well known, for example described in chapter 12 of (Sandberg and Ejsmont, 2002).
-2 -1.5 -1 -0.5 0 0.5 1 1.5 2 Jan -08 Fe b-08 Ma r-08 Ap r-08 Ma y-08 Ju n -08 Ju l-08 Au g -0 8 Se p -0 8 O ct-0 8 N o v-08 De c-08 month m o n th ly aver ag e m in u s ye ar ly aver ag e [ d B ]
Light vehicles middle weight trucks heavy weight trucks
Figure 2.7 Seasonal influence on noise levels due to temperature variation. Difference are plotted with respect to year average(LW dB(A)) as shown in Table 2.6.
Influence of Speed
Figure 2.8 - 2.10 show the scatter diagrams in which the normalize SEL* value is plotted versus the relative speed V/Vref. The diagrams contain 5509, 1258 and 1525 pass-by events of respectively light vehicles, middleweight and heavy weight vehicles. All measured results were obtained between 02:00 and 4:00 h. In each scatterplot a regression line and its coefficients are given for the measurements. The regression line can be compared with the calculated values according to the Dutch calculation method (VROM, 2006a), which is also shown in the diagrams.
Figure 2.8 Normalized SEL* values measured from passages of light vehicles between 02:00 and 4:00 h in 2008 versus the relative speed V/Vref; Vref = 80 km/h for light vehicles.
Figure 2.9 Normalized SEL* values measured from passages of middleweight trucks between 02:00 and 4:00 h in 2008 versus the relative speed V/Vref; Vref = 70 km/h middleweight trucks.
Figure 2.10 Normalized SEL* values measured from passages heavyweight trucks between 02:00 and 4:00 h in
2.4.3
Evaluation
ase in 2006, the sound power levels for passenger cars as well as trucks in 2008 se
MW.
r passenger cars, the normalized SEL* levels were also y
2008 versus the relative speed V/Vref; Vref = 70 km/h for heavyweight trucks.
After a small decre
were at approximately the same level as in 2004 and 2005. Therefore no trend is present and the noi emissions over 2004-2008 can be considered constant for all categories. The rather large difference between the measured levels and the calculated values from (VROM, 2006a) shows that the latter cannot be considered to be valid in general for all DAC road surfaces. Also the noise levels as measured at the A2 motorway (also DAC) are approximately 2.5 dB higher than according to R These results seem to indicate that the standard reference DAC in 2002 can give an underestimation of noise emission from DAC-type roads.
To further investigate this possibility, fo
compared to the Nord2000 model and Harmonoise method for the reference case, as published b Jonasson (2007). This is shown in Figure 2.11.
50 55 60 65 70 75 80 85 90 0 0.5 1 1.5 2 2.5 V/Vref SE L * [ dB ] RMW2006-I RMW2006-II Nord2000 N256-2008 Harmonoise
Figure 2.11 Validation of measured noise emission N256-2008 vs calculation according to VROM, (2006a), Nord 2000 (Jonasson, 2007) and Harmonoise (Jonasson, 2007) for light vehicles.
The measured regression curve at N256 is best predicted by the Nord2000 method that assigns
considerably more noise emission to a standard DAC 0-11 pavement than the Dutch calculation method and Harmonoise. Nord2000 would also give a better fit with the measurements at the A2 motorway at Breukelen.
It should be mentioned that these results on two monitoring sites cannot be regarded as valid for DAC in general. Apparently, the noise emission may deviate considerably in practice.
3
Urban road noise measurements
3.1
Goal
In Noise monitor 2005 and 2007 we have evaluated sample measurements of motor vehicles driving on urban roads. The objective was to find out if certain vehicle types (SUVs, cars with modified exhausts) have a higher noise emission than other types. Also the variation in low frequency noise was
investigated. Because of the limited sample size and the simple set-up of the (SPB type) measurements, only rough conclusions could be drawn.
In this Noise monitor we have kept the measurement set-up simple but we extended the sample size slightly. A basic improvement is that an estimation of the vehicle pass-by speed is made. This allows for mutual comparisons of the emission of the various vehicles. It also enables us to compare the relationship between noise and speed with the reference of the national computation method (VROM, 2006a). In addition, the correlation between the measured noise emission and the relevant registered vehicle features can be determined (cylinder volume, car lifetime, noise emission from type test).
3.2
Measurement method and locations
The measurement method is based on the SPB-method. The main difference is the microphone placement. The microphone is placed behind the car with measurement equipment, that was parked alongside the street. This will introduce some disturbance due to reflections and shielding. However, in this way changes in driving behaviour are avoided while the number of measurements with just one microphone is doubled as cars on two lanes are measured. For the purpose of these sample
measurements, a deviation of a few decibels in Lmax with respect to SPB requirements is considered acceptable.
Besides the Lmax spectrum also the SEL was recorded. The noise level meter was in the position ‘fast’. The pass-by speed is assessed using a stop watch, rendering an accuracy of about 5 km/h. By means of the licence plate number the database of RDW1 on the internet is used to manually look-up the vehicle
features (make + type, engine features, year of first registration).
Finally a ranking is made per vehicle category based on the A-weighted source power, which was calculated from the SEL and the distance of the lane. In order to evaluate the low frequency power, the linear Lmax spectrum between 20 and 100 Hz is used.
In total 14 busses, 12 trucks, 100 passenger cars and 21 delivery vans have been measured. The measurements took place on 2 June 2009, at 23 °C and dry weather, on two locations in a residential area (Overvecht) of Utrecht, see Figure 3.1. The speed limit of the roads is 50 km/h and the road surface is DAC.
The measurement results, sorted on acoustical source power, are displayed in Appendix 6. The results in these graphs are not corrected for the speed, which varies between 40 and 60 km/h. Regarding the A-weighted levels, there is about 12 dB difference between the noisiest pass-by and the quietest pass-by of the passenger cars. The diesel engines of the passenger cars can easily be distinguished by there low frequency content (‘D’=diesel, ‘B’=petrol). On average there is about 7 dB difference between diesel
and petrol cars regarding their low frequency power. The low frequency content, however, has no influence on the total A-weighted sound power: diesel engines are found also among the quietest cars. This conclusion also applies to the busses (‘L’=LPG). In the following sections further statistical examinations are made.
0 100 200 m
N
Figure 3.1 The two measurement locations in Utrecht Overvecht, June 2009.
3.3
Comparison with national computation method
In Figure 3.2 the SEL* of the passenger cars is shown as a function of the driving speed. The SEL* denotes that the SEL has been normalized in order to make it directly comparable to the reference curve for light motor vehicles from (VROM, 2006a), see Appendix 3.
The passenger cars as well as the delivery vans in our sample belong to the category of light motor vehicles. The delivery vans, however, appear to be 3 dB louder than the reference curve for this category. Also the passenger cars are louder at speeds above 45 km/h. Though the sample size is too small to draw final conclusions, it is emphasized that also at the N256 measurement site reveals that light motor vehicles on standard pavement are louder than the reference curve (see section 2.4).
50 55 60 65 70 75 20 30 40 50 60 70 80 speed [km/h] SE L * [ d B( A) ]
passenger cars delivery vans RMW reference fit (passenger cars) fit (delivery vans)
Figure 3.2 The measurements are compared with the reference curve for light motor vehicles.
3.4
Noise emission versus year of construction
In the Dutch noise legislation takes into account that cars will become quieter in the future. It is interesting to see if this development towards quieter cars can already be observed in the sample. For this purpose, we use the date of registration of each passenger car. Figure 3.3 plots the SEL** against the date of admission. The SEL** denotes that the SEL* has been corrected for the driving speed using the reference curve for light motor vehicles.
50 55 60 65 70 75 1980 1985 1990 1995 2000 2005 2010 year of admission S E L **[ d B (A )]
The sample contains 18 ‘old’ cars that were registered between 1985 and 1995 and 23 ‘new’ cars that were registered between 2005 and 2009. On average, the old cars are 0.5 dB louder than the new cars. But as the variation within the emission is much larger, while the sample size is rather small, this difference will not be statistically significant.
3.5
Noise emission versus cylinder volume
In the previous sections it was shown that delivery vans are louder than normal passenger cars (Figure 3.2). Figure 3.4 shows that if only normal passenger cars with petrol engines are considered, there is hardly any relationship between cylinder volume and noise emission. If the car’s weight would be plotted against noise emission, the graph would not change much. Therefore it can be said that large petrol cars do not necessarily produce more noise in urban conditions than small petrol cars.
For diesel cars, there is some correlation between noise and cylinder volume above 2 liter. However, this needs further observations as the number of cars in this range is rather small.
50 55 60 65 70 75 0 500 1000 1500 2000 2500 3000 3500 4000 cylinder volume [cc] SEL ** [d B (A )]
petrol diesel least squares fit petrol least squares fit diesel
Figure 3.4 Noise emission (normalized to 50 km/h) versus cylinder volume.
3.6
Measured and registered noise emission
Environmental type testing results for passenger cars are available at VCA, 2009). This enables us to compare the registered noise emission with the measured noise emission. Figure 3.5 shows the results of this comparison. Before interpreting this graph, it should be noted that the type testing method (Directive 70/157/EC) does not aim to represent the average noise emitted under urban conditions. This test method was originally developed to reflect worst-case conditions, as it consists of a pass-by measurement with fully-opened throttle. The test results will thus be dominated by propulsion noise (under extraordinary circumstances), while our sample measurements will mainly represent tyre-road
noise. It is then clear that there is hardly any correlation (coefficient <0.3) between our measured results and the test results.
Meanwhile, a new test procedure has become available that better reflects the car’s noise emission in urban areas (ISO362:2007). The benefits of this method will only be turned into practice as soon as new European limit values are set (Sandberg and Glaeser, 2008).
55 60 65 70
65 70 75 80
type testing noise level [dB(A)]
S E L**[ dB (A )]
Figure 3.5 Measured SEL (at constant speed, normalized to 50 km/h) compared to registered noise emission (Lmax, car accelerating from 50 km/h with fully-opened throttle in low gear).
3.7
Conclusion
In the Noise monitor of 2005 and 2007 we have examined if certain vehicle types are louder than others, the main conclusion being that SUVs are clearly louder than the average. In the present sample, emphasis is put on correlations between noise and registered vehicle features. For this purpose the pass-by speed has been measured, which enables us to normalize the emission to 50 km/h. The older cars in the sample (1985-1995) appear not to be significantly louder than the newest cars (2005-2009). If noise as a function of speed is regarded, passenger cars appear to be louder than the reference curve (light vehicles on standard pavement) in the Dutch computation method. The same conclusion is drawn at the N256 road, with a much larger samples size, see section 2.4. As research carried out elsewhere has revealed similar results, a government working group is now considering to prepare a revision of the reference parameters in the computation method (Peeters, 2009).
The sample measurement shows that there is some correlation between the diesel engine size and noise emission of passenger cars (for cylinder volume >2000 cc).
Finally it is shown that there is hardly any relationship between the measured noise emission and the formal noise emission registered with the vehicle type. This is a well-known problem, which has recently lead to a revision of the type testing standard (ISO362:2007). The benefits of this method will only be turned into practice as soon as new European limit values are set (Sandberg and Glaeser, 2008).
4
Railway noise
4.1
Monitoring stations ProRail
Just like the previous years, this Noise Monitor uses ProRail’s monitoring stations to evaluate the railway noise emissions. These monitoring stations are located at different continuous and temporary sites along the network. This year’s evaluation is carried out using pass-by measurements from the continuous sites at Willemsdorp and Esch, see Figure 4.1. The mobile monitoring station of ProRail has been transferred from site Hakkelaarsbrug to Tilburg in 2008. Due to the transfer, this station was not operational in 2008.
Esch Willemsdorp
Tilburg
Figure 4.1 Measurement sites of ProRail. Esch and Willemsdorp were operational during 2008.
The monitoring stations are equipped with one microphone at 7.5 m form each track. Train recognition is provided by a tag-reading. Only passenger wagons can be identified by this means as these are marked with RFID-tags. The stations render the SEL spectrum of the whole train pass-by as well as SEL spectrum of the separate vehicles. In this report, only the A-weighted SEL of the whole train pass-by is used. A detailed description of the monitoring stations is given in (Verheijen et al., 2008).
4.2
Results
The measurement data from the time periods given in Table 3.1 have been made available by ProRail to the RIVM. Due to a technical problem no data from track B at Willemsdorp were available.
The monitoring stations do not allow for a direct calculation of the Lden. This is because not all pass-bys are measured: measurements are rejected if trains cross at both tracks just in front of the microphone. Besides this, unfavourable (weather) conditions should be avoided. This means that only measurements that fulfill the following requirements are used: dry weather, wind speed below 8 m/s and stable train speed during pass-by. The choice of measurement periods in Table 4.1 is based on periods in which the stations were fully operational.
Table 4.1 Measurement period and track.
Site Track Line Period (in 2008)
Esch A Eindhoven – Utrecht 1 Jan. - 31 Mar. Esch B Utrecht– Eindhoven 13 Oct. - 9 Nov. Willemsdorp A Breda – Dordrecht 1 Jan. - 31 Mar.
Instead of evaluating the Lden, the railway noise is evaluated by comparing the measured normalized so-called emission number E* with the value that it should have according to the national Computation Method (VROM, 2006b) and the Emission Register2. The relationship between E* and the SEL is
shown in Appendix 4.
The measured noise emission has been corrected for rail roughness. This is necessary in order to generalize the measurement results3. For this purpose a rail roughness spectrum measured in December
2006 has been used, which is the most recent one available. The pass-by measurements of each relevant train category (out of the eleven categories distinguished in the national computation method) are averaged and then compared to the value given by the Emission Register for that category, see Appendix 5. In this comparison the categories 4 (freight) and 9 (high-speed) are excluded as the web application of the monitoring systems does not (yet) allow for their direct selection. The results are summarized in Table 4.2 en Figure 4.2.
Table 4.2 Normalized emission number E* in dB(A) according to the Emission Register (Aswin) and its deviation from measurement (measurement minus computation) in Esch (Es) and Willemsdorp (Wd).
E*Aswin Without roughness correction With roughness correction
Category* Es, Wd Es Wd Es Wd
1 65.5 -0.3 -0.3 0.3 0.3
2 66.7 -1.1 0.6 -0.7 1.1
8 60.3 -0.5 -4.1 1.6 -1.4
*1. Mat64, 2. ICR/ICM3/DDM1, 8. DDM2/ICM4/IRM. Train speed 140 km/h.
2 The Emission Register is a yearly database published by ProRail under the name of Aswin which contains the traffic
parameters and the noise emission number E along the railway network.
3 Rail roughness may vary along the track quite rapidly, e.g. on a scale of about 50 m. It may also varies in time, on a scale of
Normalized Emission Number E* (1 vehicle per hour) in dB(A) 50 55 60 65 70
1. Mat64 2. ICR/ICM3 8. DDM2/ICM4/IRM
Aswin Esch Willemsdorp
Figure 4.2 Comparison of the emission number E* (normalized at 1 vehicle per hour) according to Aswin and the monitoring stations at Esch and en Willemsdorp (with rail roughness correction).
4.3
Causes of the differences
The differences observed between measurements and calculations are mainly caused by:
• the local rail roughness. Rail roughness tends to grow slowly until ProRail commissions the rails to be ground. Although the measurements have been corrected for roughness, the rail roughness spectra used are somewhat outdated. Therefore the measured results may be up to 1 dB higher than if they were corrected for the actual state of roughness.
• the actual pass-by speed. The Emission Register gives only the maximum speed, not the average actual speed. The actual speeds are usually slightly lower. The average speed at these sites appeared to be about 10 km/h less than maximum. The noise emission at these sites is therefore between 0.4 and 1.1 dB lower than if all trains would run at maximum speed. • deviations due to features related to the rolling stock. For instance, the wheel roughness may
vary slightly during the seasons. Variations of a few decibels on a seasonal scale are not exceptional (Verheijen et al., 2007).
4.4
Conclusion
Just like previous years, the 2008 results show that the measured emission is in reasonable agreement with the calculated emission according to the national calculation method. This conclusion is based on the results from two measurement sites during a limited period. As for technical reasons the analysis was restricted to passenger trains, the results may not be representative for lines where freight trains dominate the noise emission.
5
Conclusions
Road noise
- The noise reduction obtained in 2007 at the A12 motorway near Voorburg sustains in 2008. This reduction is caused by repavement with double layered porous asphalt and by a speed limit reduction.
- The noise level at the A10-west site in Amsterdam has been increasing since the start of the monitoring in 2005. Already in 2006 it was concluded that the noise reduction of the porous asphalt layer, which was installed in 2001, had disappeared. This is probably caused by silt up and texture wear.
- The noise emission of the N256 site in Noord-Beveland (DAC road surface) is substantially higher than predicted by the Dutch calculation method. Similarly, the A2 site and the sample measurement sites of chapter 3, all paved with DAC, exhibit higher noise emissions.
Apparently, noise emission on DAC may deviate considerably from the reference values.
Railway noise
- The differences between the noise emissions measured at sites Esch and Willemsdorp in 2008 and the emissions as calculated using the national computation method (VROM, 2006b) are within 2 dB. Higher deviations are found if the measurements are not corrected for rail roughness.
- Part of the differences can be explained by the fact that the passenger trains run at lower speeds than those listed in the Emission Register (‘Aswin’).
- As the analysis was restricted to passenger trains, the results may not be representative for lines where freight trains dominate the noise emission.
References
Jonasson, H. G., 2007: Acoustical Source Modelling of Road Vehicles, Acta Acustica United With Acustica Vol 93 (2007), 173-184.
Peeters, B., 2009: Actualisering emissiegetallen wegverkeer in het RMW, Proceedings national congress GTL2009, November 2009 (in preparation).
Sandberg, U., Ejsmont, J.A., 2002: Tyre/Road Noise Reference Book, INFORMEX, Sweden 2002. Sandberg U., Glaeser, K.-P., 2008: Improved regulation policy for noise emission from the vehicle/tyre/road interaction, SILENCE-project, Deliverable C.D7, September 2008.
Schreurs, E.M., Verheijen E.N.G., Potma, C.J.M., Jabben, J., 2008: Geluidmonitor 2007 (Noise monitor 2007), RIVM report number 680740001, RIVM, Bilthoven.
VCA, 2009: VCA car fuel database, http://www.vcacarfueldata.org.uk/downloads/
Verheijen, E.N.G., Roovers, M.S., van den Brink, J.W., 2007: Statistical analysis of railway noise: trackside monitoring of individual trains, Proceedings of the International Workshop on Railway Noise and Vibrations, Paper S5.1, Munich, September 2007.
Verheijen, E.N.G., Roovers, M.S., van den Brink, J.W., 2008: Railway Noise Statistics by Monitoring Stations – Input for Dutch Prediction Method RMR and Track Access Charging, Noise and Vibration Mitigation for Rail Transportation Systems NNFM 99, pp. 165-171, 2008.
VROM, 2006a: Ministry of Housing, Spatial Planning and the Environment, Appendix III to chapter 3 on Road Noise of the Reken- en meetvoorschrift geluidhinder 2006.
VROM, 2006b: Ministry of Housing, Spatial Planning and the Environment, Appendix IV to chapter 4 on Railway Noise of the Reken- en meetvoorschrift geluidhinder 2006.
Appendix 1 Measurement sites for road noise
Site A2, Breukelen
36 m 17 m 3.5 m 1.5 m A2 Breukelen
A2
Utrecht
Amsterdam
Appendix 2 Description of measurement equipment
Figure B2.1 Measurement system on monitoring locations.
Figure B2.1 shows how the measurement system is used as noise monitor. One noise monitor consists of:
- microphone stand+pre-amp, manufactory Larson-Davis, type 2100K; - microphone, manufactory Larson-Davis, type 2541;
- statistical Analyzer, manufactory Larson-Davis, type 870; - gsm-modem with antenna;
- battery and charger; - container.
This type of microphone stand is useful for measurements outside. The microphone itself is equipped with a rain cover and heating. The pre-amp has a heating to prevent the amp from moisture. The microphone is covered with a wind screen. The microphone stand comes with built-in pre-amp to amplify to the signal. To prevent the microphone and the pre-amp from moisture, silica gel is used and will be replaced every three months. The statistical analyzer measures the signal of the microphone and calculates various statistical parameters like A-weighted level LAeq.
The analyzer has an internal GSM modem with antenna, which is connected to the microphone. A computer attached with a standard modem has to connect to the GSM modem, in order to retrieve the measurement data. On this computer is a NMS (Noise Monitoring System) application of Larson-Davis installed. On monthly base the measurements collected from all locations are stored on a NMS
database. Power supply battery charger container Microphone stand antenna cover Microphone
Appendix 3 Measured versus calculated noise N256
In order to make a direct comparison with the noise emissions of the legal computation method, the normalized SEL values (SEL*) measured at the N256 motorway have been plotted against the ratio V/Vref. The measured SEL* is defined as:SEL*meas = SEL meas + 10·log(V/3600) + 10·log(R) + Dground + Dair (B3.1) where:
SEL = sound exposure level (dB(A)) of the measured vehicle pass-by V = speed (km/h)
Vref = reference speed (80 km/h for light vehicles and 70 km/h for middleweight and heavy
vehicles)
R = distance lane – receiver (6.7 en 9.2 m for nearest and farthest lane, respectively)
Dground = ground attenuation according to (VROM, 2006a) (1.4 and 0.5 dB for nearest and farthest lane, respectively)
Dair = air attenuation ~ 0.1 dB
According to the RMW 2006 the SEL* value is given by:
SEL*RMW06 = a + b·log (V/Vref) (B3.2)
If the measured SEL*meas corresponds with the calculated SEL*RMW06 , the curve given in (B3.2) should co-incide with the best-fit to the logaritmic curve A+B·log(V/Vref) through the measurements. Thus the coefficients A and B (per category) that are derived from the measurements can be compared with the coefficients a and b from (VROM, 2006a).
Appendix 4 Emission railway vehicles
Table B4.1 gives an overview of the present acoustical categorization of the rolling stock.
Tabel B4.1 Categorisation scheme of rolling stock according to VROM (2006b).
Category Description (braking system) Train types
1 passenger (cast-iron block) Mat64
2 passenger (disc + additional cast-iron blocks) ICR; ICM-III; DDM1
3 passenger (disc) SGM II/III
4 freight (cast-iron block) Cargo
5 passenger diesel-electr. (cast-iron block) DE
6 passenger diesel-hydraulic (disc) DH
7 metro (disc) (metro)
8 modern intercity and regional (disc) DDM2+LOC1700; DDM2+mDDM; ICM-IV; IRM; SM90
9 high speed (mainly disc) Thalys; ICE
10 light rail (reserved)
11 silent freight (reserved)
The normalized emission number E*, that is judged in this research for a number of the above categories, is based on a vehicle flow of 1 vehicle per hour.
The relationship between the Sound Exposure Level and the normalized emission number E* is:
E* = SEL – 10 lg T + 10 lg a + Dground + Dair + Dmeteo – 10 lg Q where:
E* = normalized emission number in dB(A) based on 1 vehicle per hour
Q = vehicle flow [#vehicles/hour]
SEL = Sound Exposure Level
T = duration of the pass-by from buffer to buffer [seconds] a = distance to heart of track (7.5 m)
Dbodem = ground attenuation (0.7 dB(A))
Dmeteo = meteocorrection (0 dB(A))
Dlucht = air attenuation (0.3 d(A))
The monitoring stations also give the number of vehicles within one pass-by. This number is used to normalize the emission. In this way, the resulting emissions can be compared mutually, independent of the vehicle flow Q.
Appendix 5 Emission and roughness for railways
Table B5.1 Normalized emission numbers [dB(A)] from the Emission Register (Aswin).
Category Speed Esch Willemsdorp
1 140 km/h 65.5 65.5
2 140 km/h 66.7 66.7
8 140 km/h 60.3 60.3
Table B5.2 Normalized emission numbers based on the measurements.
Esch Willemsdorp
Cat A B A&B E*_meet E*_crr B E*_meet E*_crr 1 0.5 0.6 0.5 65.3 65.8 0.6 65.2 65.9 2 0.4 0.4 0.4 65.5 65.9 0.4 67.3 67.7 8 2.2 2.1 2.1 59.8 61.9 2.8 56.1 58.9