Downloaded from https://journals.lww.com/ccejournal by IJFFeEaHn1fgkWTfbpXO9qxDw/OoCsG7D3+UX0TZeOGqhtaFHcy0CVwKm1vT4K8PEECTu6QKzNQSD8eEPxMzFR9EgKPtuVPy3WmxvLb9YvnxGURW7sElW68bmIXhU/n9V+poInO4LnA= on 02/16/2021 Downloadedfrom https://journals.lww.com/ccejournalby IJFFeEaHn1fgkWTfbpXO9qxDw/OoCsG7D3+UX0TZeOGqhtaFHcy0CVwKm1vT4K8PEECTu6QKzNQSD8eEPxMzFR9EgKPtuVPy3WmxvLb9YvnxGURW7sElW68bmIXhU/n9V+poInO4LnA=on 02/16/2021 DOI: 10.1097/CCE.0000000000000335
Copyright © 2021 The Authors. Published by Wolters Kluwer Health, Inc. on behalf of the Society of Critical Care Medicine.This is an open-access article distributed under the terms of the Creative Commons Attribution-Non Commercial-No Derivatives License 4.0 (CCBY-NC-ND), where it is permissible to download and share the work provided it is properly cited. The work cannot be changed in any way or used commercially without permission from the journal.
OBJECTIVES: The aim of this pilot study was to compare the amount of
“mechanical power of ventilation” under adaptive support ventilation with nonautomated pressure-controlled ventilation.
DESIGN: Single-center, observational prospective pilot study adjoining
unitwide implementation of adaptive support ventilation in our department.
SETTING: The ICU of a nonacademic teaching hospital in the Netherlands. PATIENTS: Twenty-four passive invasively ventilated critically ill
patients expected to need of invasive ventilation beyond the following calendar day.
MEASUREMENTS AND MAIN RESULTS: In patients under adaptive
support ventilation, only positive end-expiratory pressure and Fio2 were
set by the caregivers—all other ventilator settings were under control of the ventilator; in patients under pressure-controlled ventilation, maximum airway pressure (Pmax), positive end-expiratory pressure, Fio2, and
res-piratory rate were set by the caregivers. Mechanical power of ventilation was calculated three times per day. Compared with pressure-controlled ventilation, mechanical power of ventilation with adaptive support ventila-tion was lower (15.1 [10.5–25.7] vs 22.9 [18.7–28.8] J/min; p = 0.04). Tidal volume was not different, but Pmax (p = 0.012) and respiratory rate (p = 0.012) were lower with adaptive support ventilation.
CONCLUSIONS: This study suggests adaptive support ventilation may
have benefits compared with pressure-controlled ventilation with respect to the mechanical power of ventilation transferred from the ventilator to the respiratory system in passive invasively ventilated critically ill patients. The difference in mechanical power of ventilation is not a result of a difference in tidal volume, but the reduction in applied pressures and respiratory rate. The findings of this observational pilot study need to be confirmed in a larger, preferably randomized clinical trial.
KEY WORDS: closed-loop ventilation; critical care medicine; mechanical
power; mechanical ventilation
T
he mechanical power of ventilation (MP) is the amount of energy per time transferred from the ventilator to the respiratory system. Although this energy is mainly used to overcome airway resistance (Raw) and res-piratory system compliance (CRS), part of it acts directly on lung tissue, poten-tially causing ventilator-induced lung injury (VILI) (1, 2). MP has been shownLaura A. Buiteman-Kruizinga, BSc1
Hassan E. Mkadmi, MSc2
Marcus J. Schultz, MD, PhD3–6
Peter L. Tangkau, MD1
Pim L. J. van der Heiden, MD, PhD1
Comparison of Mechanical Power During
Adaptive Support Ventilation Versus
Nonautomated Pressure-Controlled
Ventilation—A Pilot Study
to be associated with important patient-centered out-comes in critically ill patients in need of invasive ven-tilation (3, 4).
MP is a summary variable that includes all compo-nents suggested to play a role in VILI (5), including tidal volume (VT), peak pressure (Ppeak) and driv-ing pressure (ΔP), and the respiratory rate (RR). The complex interplay between these components makes it difficult to set a ventilator so that the least amount of energy per time is transferred from the ventilator to the respiratory system in an individual patient.
Adaptive support ventilation (ASV) is a closed-loop ventilation mode that provides pressure-controlled ventilation (PCV) or pressure-support ventilation (PSV) depending on patient’s activity. With ASV, all components that considered important in preven-tion of VILI are under control of the ventilator, and it adapts breath-by-breath to the Raw and CRS (6). We hypothesized ASV delivers ventilation with less MP than nonautomated PCV.
MATERIALS AND METHODS
This was an observational prospective pilot study ad-joining unitwide implementation of ASV in the ICU of the Reinier de Graaf Hospital in Delft, the Netherlands. Ethical approval was given by the Medical Ethics Review Committee South-West Holland (number 19-031). The need for informed consent was waived. Before implementation of ASV, PCV and PSV were the standard modes. Ventilator settings were adjusted by caregivers with extensive experience in invasive ven-tilation, with normocapnia and sufficient oxygenation as the targets.
MP was calculated from ventilator variables col-lected in 12 consecutive patients directly before unitwide implementation of ASV and 12 consecu-tive patients after implementation. In both periods, patients were eligible if: 1) ≥ 18 years old and 2) ex-pected to receive controlled ventilation for at least 24 hours. In the first group, PCV was used exclusively when patients were passive, and maximum airway pressure (Pmax), positive end-expiratory pressure (PEEP), Fio2, and RR were set by the caregivers— meaning that VT and ΔP were set indirectly. In patients in the second group, ASV was used when patients were passive or active, and ΔP, VT, and RR were under con-trol of the ASV algorithm—meaning that only PEEP and Fio2 were adjustable by the caregivers. At all times,
during collection of ventilator data for calculating MP, patients had to be passive.
MP was calculated three times a day and at least one time per nursing shift that lasted 8 hours, between 07:00 am and 24:00 am, when a patient was in a stable condition, and for a maximum of 96 hours. If a patient became active, or when a patient was weaned from the ventilator, data collection stopped.
MP, expressed in J/min, was calculated using the following equation (5):
0.098 * VT * RR * (Ppeak – ½ * ΔP)
VT was in liters and ΔP was calculated using the fol-lowing equation:
ΔP = Pmax – total PEEP
Pmax was determined by performing an inspiratory hold, and total PEEP was determined by performing an expiratory hold.
MP, the primary end point, and other ventilation parameters were expressed as medians. A Mann-Whitney U test was used for the comparison, as data were not normal distributed and because of the small sample size. A linear mixed-model regression was used to assess the association between ventilation mode and MP. The model was adjusted for the following covari-ates: gender, time, and APACHE IV score. A possible interaction effect between ventilation mode and time was tested including the interaction (ventilation * time) in the model. Linear mixed model was chosen because of the repeated measures in the study and to account for the small amount of missing data and dif-ferent time intervals between the repeated measures.
Cumulative distribution plots (Fig. 1; and eFigs. 1 and 2, http://links.lww.com/CCX/A500) and box plots (eFigs 3 and 4, http://links.lww.com/CCX/A500) were used to visualize differences in MP and other ventilator parameters. A p value of less than 0.05 was considered statistically significant.
RESULTS
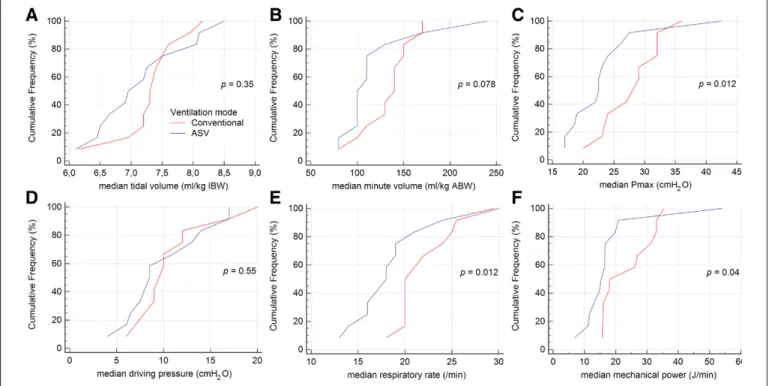
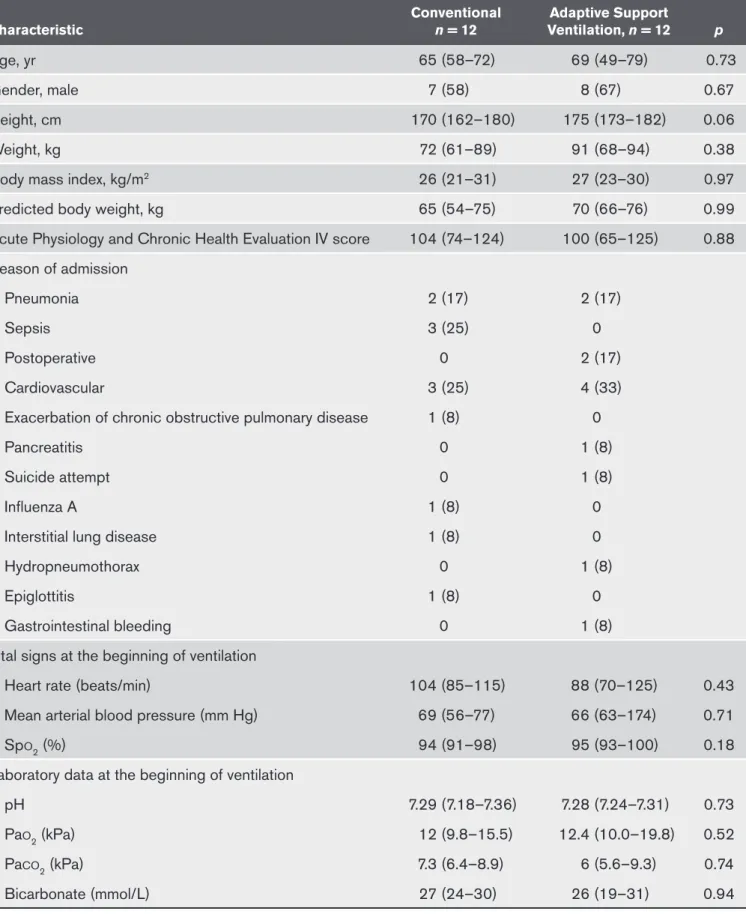
Twenty-four patients were studied; the two groups were comparable with regard to baseline character-istics (Table 1). Data were collected median 6 hours (5–8 hr) apart. Compared with PCV, median MP was lower with ASV (15.1 J/min [10.5–25.7 J/min] vs 22.9 J/ min [18.7–28.8 J/min]; p = 0.04) (Fig. 1; and eFigures 1 and 2, http://links.lww.com/CCX/A500). Median VT was not different (7.1 mL/kg [6.7–7.6 mL/kg] vs 7.3 mL/kg
[7.0–7.7 mL/kg] predicted body weight; p = 0.35), but median Pmax (23 cm H2O [19–28 cm H2O] vs 28 cm H2O [25–31 cm H2O]; p = 0.012), and median RR (18 [16–22] vs 23 [20–25]; p = 0.012) were lower with ASV. At all time points and in all patients, MP was lower with ASV (eTable 1, http://links.lww.com/CCX/ A500; and eFigures 3 and 4, http://links.lww.com/ CCX/A500). Linear mixed-model regression analysis showed that the variable “ventilation mode” was sta-tistically significant (effect estimate = 6.2 J/min; 95% CI = 1.06–11.29; p = 0.019). Time as well as interaction effect between ventilation mode and time were not sig-nificant (p = 0.493 and p = 0.998, respectively).
DISCUSSION
In this observational study, ASV was found to deliver a lower MP compared with PCV. Of the other ventila-tion parameters, Pmax and RR, but not VT was lower with ASV. ASV was able to provide ventilation at a lower MP, probably because its algorithm is based on the minimal work of breathing principle, as described by Otis et al (7), and the minimal force of breathing, as described by Mead (8). ASV adapts, breath-by-breath, RR and ΔP to Raw and CRS to achieve these two goals.
Our findings are in line with a recently published randomized clinical trial in postcardiac surgery patients (9). That study showed a decrease in MP with INTELLiVENT-ASV, an automated ventilation mode that uses similar algorithms as ASV. The current findings add to our knowledge by showing that ASV reduces MP also in sicker critically ill patients.
This pilot study has strengths and limitations. Strength is the prospective analysis, in which we pre-defined the analysis plan from which we did not de-viate. However, the study was small and performed in only one center, and patients were not random-ized or crossed over. Another limitation is the un-adjusted analysis presenting median MP. Therefore, the effect of ventilation mode on MP was assessed by means of linear mixed-model method. In addi-tion, missing values occur in both groups (17 out of a possible total amount of 144 values in the conven-tional group and 28 out of 144 in the ASV group). Although a linear mixed model accounts for miss-ing values, the greater amount of missmiss-ing values in the ASV group may have affected the result. MP was calculated using the simplified equation; there are other ways to calculate MP (10), but we did not col-lect sufficient data to use those other formulas. Last
Figure 1. Cumulative frequency distribution plots for ventilation parameters used for calculation of mechanical power. A, Tidal volume
in mL/kg ideal body weight (IBW), (B) minute volume in mL/kg actual body weight (ABW), (C) Pmax in cmH2O, (D) driving pressure in cmH2O, (E) the respiratory rate per minute and (F) the mechanical power in J/min. Per each patient, the median for the ventilation parameter of interest was calculated and plotted. ASV = adaptive support ventilation.
TABLE 1.
Baseline Characteristics
Characteristic Conventional n = 12 Ventilation, n = 12Adaptive Support p
Age, yr 65 (58–72) 69 (49–79) 0.73
Gender, male 7 (58) 8 (67) 0.67
Height, cm 170 (162–180) 175 (173–182) 0.06
Weight, kg 72 (61–89) 91 (68–94) 0.38
Body mass index, kg/m2 26 (21–31) 27 (23–30) 0.97
Predicted body weight, kg 65 (54–75) 70 (66–76) 0.99
Acute Physiology and Chronic Health Evaluation IV score 104 (74–124) 100 (65–125) 0.88 Reason of admission
Pneumonia 2 (17) 2 (17)
Sepsis 3 (25) 0
Postoperative 0 2 (17)
Cardiovascular 3 (25) 4 (33)
Exacerbation of chronic obstructive pulmonary disease 1 (8) 0
Pancreatitis 0 1 (8)
Suicide attempt 0 1 (8)
Influenza A 1 (8) 0
Interstitial lung disease 1 (8) 0
Hydropneumothorax 0 1 (8)
Epiglottitis 1 (8) 0
Gastrointestinal bleeding 0 1 (8)
Vital signs at the beginning of ventilation
Heart rate (beats/min) 104 (85–115) 88 (70–125) 0.43
Mean arterial blood pressure (mm Hg) 69 (56–77) 66 (63–174) 0.71
Spo2 (%) 94 (91–98) 95 (93–100) 0.18
Laboratory data at the beginning of ventilation
pH 7.29 (7.18–7.36) 7.28 (7.24–7.31) 0.73
Pao2 (kPa) 12 (9.8–15.5) 12.4 (10.0–19.8) 0.52
Paco2 (kPa) 7.3 (6.4–8.9) 6 (5.6–9.3) 0.74
Bicarbonate (mmol/L) 27 (24–30) 26 (19–31) 0.94
but not least, the exact and causative role of MP, and the effects of a reduction in MP to prevent VILI are still not yet fully understood.
CONCLUSIONS
Findings of this pilot study suggest ASV may have benefits compared with conventional ventilation with respect to the MP transferred from the venti-lator to the respiratory system of critically ill passive patients. This effect is not achieved by a limitation of VT, but by a reduction in applied pressures and RR. The findings of this observational pilot study need to be confirmed in a larger, preferably randomized clinical trial.
ACKNOWLEDGMENTS
The research was made possible thanks to the support of the Scientific Research Foundation Reinier de Graaf Groep, Delft.
1 Department of Intensive Care, Reinier de Graaf Hospital, Delft, the Netherlands.
2 Department of Research, Reinier de Graaf Hospital, Delft, the Netherlands.
3 Department of Intensive Care, Academic Medical Center, Amsterdam, the Netherlands.
4 Laboratory of Experimental Intensive Care and
Anesthesiology (L·E·I·C·A), Academic Medical Center, Amsterdam, the Netherlands.
5 Mahidol–Oxford Tropical Medicine Research Unit (MORU), Mahidol University, Bangkok, Thailand.
6 Nuffield Department of Medicine, University of Oxford, Oxford, United Kingdom.
Supplemental digital content is available for this article. Direct URL citations appear in the printed text and are provided in the HTML and PDF versions of this article on the journal’s website (http://journals.lww.com/ccxjournal)
Dr. Schultz attended a workshop organized by Hamilton, expenses for lodging was covered for the invited experts, and participants from abroad had their travel expenses reimbursed and speakers received a speaker’s fee of CHF 800. The re-maining authors have disclosed that they do not have any poten-tial conflicts of interest.
For information regarding this article, E-mail: l.kruizinga@rdgg.nl
REFERENCES
1. Protti A, Andreis DT, Monti M, et al: Lung stress and strain dur-ing mechanical ventilation: Any difference between statics and dynamics? Crit Care Med 2013; 41:1046–1055
2. Cressoni M, Gotti M, Chiurazzi C, et al: Mechanical power and development of ventilator-induced lung injury. Anesthesiology 2016; 124:1100–1108
3. Serpa Neto A, Deliberato RO, Johnson AEW, et al; PROVE Network Investigators: Mechanical power of ventilation is associated with mortality in critically ill patients: An analysis of patients in two observational cohorts. Intensive Care Med 2018; 44:1914–1922
4. Urner M, Jüni P, Hansen B, et al: Tivarying intensity of me-chanical ventilation and mortality in patients with acute res-piratory failure: A registry-based, prospective cohort study.
Lancet Respir Med 2020; 8:905–913
5. Gattinoni L, Tonetti T, Cressoni M, et al: Ventilator-related causes of lung injury: The mechanical power. Intensive Care
Med 2016; 42:1567–1575
6. Arnal JM, Wysocki M, Nafati C, et al: Automatic selection of breathing pattern using adaptive support ventilation. Intensive
Care Med 2008; 34:75–81
7. Otis AB, Fenn WO, Rahn H: Mechanics of breathing in man. J
Appl Physiol 1950; 2:592–607
8. Mead J: Control of respiratory frequency. J Appli Physiol 1960; 15:325–336
9. De Bie AJR, Neto AS, van Meenen DM, et al: Fully automated postoperative ventilation in cardiac surgery patients: A ran-domized clinical trial. Br J Anaesth 2020; 125:739–749 10. Silva PL, Ball L, Rocco PRM, et al: Power to mechanical power
to minimize ventilator-induced lung injury? Intensive Care Med