Letter report 320126001/2010
C.W. Noorlander | J.D. te Biesebeek | S.P.J. van Leeuwen | M.J. Zeilmaker
Intake of PFOS and PFOA from food and
drinking water in The Netherlands
1
Intake of PFOS and PFOA from food and drinking
water in The Netherlands
Autors: dr. C.W. Noorlander (RIVM/SIR) ing. J.D. te Biesebeek (RIVM/SIR) dr. S.P.J. van Leeuwen (VU/IVM) dr. M.J. Zeilmaker (RIVM/SIR)
Date: July 2010
Reviewed by: dr. B.G.H. Bokkers (RIVM/SIR) dr. M.I. Bakker (RIVM/SIR)
VWA Question: 9.1.31 Determine the dietary exposure to perfluorinated compounds in The Netherlands (based on monitoring results anno 2009)
Commissioned by: dr. M.J.B. Mengelers (VWA)
Project: V/320126 Perfluorinated compounds in food
2
Summary
This study presents intake calculations from food and drinking water of the perfluorinated contaminants PFOS and PFOA. The intake was determined by the ‘total diet method’: a combination of a food consumption survey, concentration measurements in pooled samples of specific food categories and drinking water, and statistic modelling.
The concentrations of PerFluorinated Compounds (PFCs) in food were analyzed in pooled samples of foodstuffs randomly purchased in several Dutch retail store chains with nation-wide covering. As concentrations in drinking water in The Netherlands are missing indicative values (7 pg/g for PFOS and 9 pg/g for PFOA) as reported by EFSA (2008) were used in the intake calculations.
In food six out of fourteen analysed PFCs (PFHpA, PFOA, PFNA, PFDA, PFHxS and PFOS) could be detected in the majority of the food categories. Of these toxicological evaluations are only available for PFOS and PFOA. As such evaluations are crucial for a meaningful interpretation of intake calculations these calculations were confined to PFOS and PFOA.
The median long-long intake for PFOS and PFOA is around 0.3 ng/kg bw/day. The corresponding high level intakes (99th percentile) were around 0.6 ng/kg bw/day. These intakes are well below the TDIs of PFOS (150 ng/kg bw/day) and PFOA (1500 ng/kg bw/day).
Though based on indicative values of PFOS and PFOA drinking water appeared a dominant source of PFOS and PFOA intake, accounting for 33% and 55% of the intake, respectively. As these percentages are prone to considerable uncertainty with respect to the actual situation in Dutch drinking water this result warrants a pilot study on the PFC content in this matrix.
Other contributors of PFOA intake were vegetables/fruit and flour. Milk, beef and lean fish were contributors of PFOS intake.
3
Contents
1. Introduction 4
2. Material and Methods 5
2.1 Food samples 5 2.2 Drinking water 5 2.3 Analytical method 5 2.4 Limit of detection 6 2.5 Intake calculations 7 3. Results 8
3.1 Concentrations of PFCs in food categories 8 3.2 Individual intake: contribution of food categories 11 3.3 Long-term intake calculations 12 3.4 Comparison of dietary intake with the TDI 16
4. Discussion and Conclusions 17
5. Recommendations 20 Acknowledgements 21 References 22 Appendix A 26 Appendix B 28
4
1. Introduction
Perfluorinated compounds (PFCs) have been produced since the 1950s and are widely used in consumer and industrial products, including protective coatings for fabrics and carpets, paper coatings, insecticides, paints, cosmetics, and fire-fighting foams. The widespread use of PFCs is due to their physico-chemical characteristics such as resistance to degradation, thermal stability, and various surfactant properties (Hekster et al., 2003; Lehmler, 2005). The most commonly studied PFCs are the perfluorinated sulfonates and the perfluorinated carboxylates. Among these, perfluorooctane sulfonate (PFOS) and perfluorooctanoate (PFOA) are of greatest concern, because these compounds have persistent, bioaccumulative and toxicological properties (Fromme et al., 2009; EFSA, 2008). PFOS and PFOA do not typically accumulate in lipids in contrast to the classical more lipophilic persistent organic pollutants like dioxins, furans or polychlorinated biphenyls (Andersen et al., 2006; EFSA, 2008). Regarding the human health risk of PFCs, the persistent nature of these compounds in the human body (Olsen et al., 2007) the long-term exposure to these compounds will lead to their accumulation in the body. As with other Persistent Organic Pollutants (POPs) like dioxins and Poly Brominated Diphenyl Ethers (PBDEs) this warrants for the accumulated amount in the body (“body burden”) as the starting point for the risk assessment of PFCs (WHO, 1998; SCF, 2000; 2001; JECFA/WHO, 2002, 2005, Bakker et al., 2008). The calculation of the latter, of course, needs the calculation of the long-term intake of these compounds.
For the assessment of the human exposure to PFCs, different pathways have to be considered. Exposure via inhalation may result from outdoor air and indoor air and from house dust. Oral exposure is mainly determined by contamination of food and drinking water. Furthermore, the ingestion of dust and soil due to hand-to-mouth activities may also contribute to the oral exposure for children. However, in this context, the dietary exposure seems to be dominant intake pathway (see f.e. Fromme et al., 2009).
This report primarily focuses on the exposure modelling of the intake of PFOS and PFOA in The Netherlands from food and drinking water. Food products from relevant food categories purchased in 2009 in The Netherlands were analyzed for PFCs. Indicative concentrations in drinking water were obtained from European wide data as presented by EFSA (2008). In combination with consumption data of the third Dutch National Food Consumption Survey 1997/1998 (DNFCS-3), the concentration data were used to derive the short term as well as the long-term intake of PFOS and PFOA. These two PFCs were chosen because their long-term intakes can be compared with a Tolerable Daily Intake (TDI).
5
2. Materials and Methods
2.1
Food samples
In The Netherlands RIVM’s dietary exposure assessment of POPs has a long tradition, starting with the exposure assessment of dioxins in 1990 (Liem et al., 1991) to, most recently, PBDEs (Bakker et al., 2008). Regarding fat soluble POPs like dioxins and PBDEs food products covering more than 95% of the dietary fat intake in the Netherlands are collected at the retail level (note that does not exclude the inclusion of food products low in fat as separate food categories. In fact fruit and vegetables constitute separate food categories). The collected food products are then attributed to a distinct number of food product categories (cheese, beef, etc.) after which one single pooled sample for each food category is made. The pooled sample, being collected at retailers which all provide food products on a nation-wide scale in The Netherlands, is considered to be representative for the POP amount in a particular food category. The reason for the preparation of only one pooled food sample of course stems from the analytical chemical tension in either analyzing all food products which have been collected in a certain category or only their constituting pools. In this context using single pooled samples of a limited number of food categories has proven to suffice as input material for dietary intake calculations of POPs (Liem et al., 1991; Bakker et
al., 2008; de Mul et al., 2005; 2008).
In the case of PFCs food products of 15 food categories (see Appendix A) were collected by RIVM employees in Dutch supermarkets. Of each food product category, 15 individual items were purchased. The food samples were transported to the laboratory of the Food and Consumer Product Safety Authority (VWA Zutphen, The Netherlands) where the sample pretreatment (grinding, homogenization) and pooling was performed. The pooled food samples represent a certain food category. For example the sample of the food category ‘cheese’ consisted of a weighed pool of all sorts of cheese as consumed in DNFCS-3 by the Dutch population (see De Mul et al., 2005).
2.2
Drinking water
Drinking water may be a significant source of PFCs (Skutlarek et al., 2006; Ericson et al., 2008, 2009; Eschauzier and de Voogt, 2010). For this reason drinking water was incorporated next to food in the intake calculation (note that, from a regulatory point of view, drinking water is not considered a food commodity in The Netherlands). Unfortunately, concentrations of PFOS and PFOA in Dutch drinking water are not available. As indicative values for the concentrations of PFOS and PFOA in drinking water, European wide data as presented by EFSA (2008) were therefore used in this report, i.e. 7 pg/g for PFOS and 9 pg/g for PFOA.
2.3
Analytical Method
The analysis of PFCs in the different food categories was performed by the Institute for Environmental Studies (IVM VU, Amsterdam, The Netherlands). The analysis allowed for the following fourteen PFCs: perfluorobutanoic acid (PFBA), perfluoropentanoic acid (PFPeA), perfluorohexanoic acid (PFHxA),
6
perfluoroheptanoic acid (PFHpA), perfluorooctanoic acid (PFOA), perfluorononanoic acid (PFNA); perfluorodecanoic acid (PFDA), perfluoroundecanoic acid (PFUdA), perfluorododecanoic acid (PFDoA), perfluorotridecanoic acid (PFTrDA), perfluorotetradecanoic acid (PFTeDA), potassium perfluoro-1-butanesulfonate (PFBS), potassium hexanesulfonate (PFHxS) and potassium perfluoro-1-octanesulfonate (PFOS). IVM developed new extraction and clean-up techniques, based on extraction with a mixture of tetrahydrofuran and water (based on Ballesteros-Gomez et al., 2010). The method gives a sufficient analytical sensitivity to detect PFCs in the food samples. Detection was done by liquid chromatography coupled with electrospray ionisation triple quadrupole mass spectrometry. PFCs were analysed in the 15 pooled food samples, each representing a food category. For more details on the analytical method see Van Leeuwen et al. (2010).
2.4
Limit of Detection
The limits of detection (LOD) were determined as three times the signal-to-noise ratio. The limit of quantification (LOQ) is defined as 3.3 times the LOD, equaling 10 times the signal-to-noise ratio.
LODs en LOQs for PFOS and PFOA (pg/g product)
PFOS PFOA
Food category LOD (pg/g) LOQ (pg/g) LOD (pg/g) LOQ (pg/g)
Flour 9 30 2 7 Fatty fish 4 13 4 13 Lean fish 4 13 3 10 Pork 7 23 8 26 Eggs 18 59 32 106 Crustaceans 7 23 4 13 Bakery products 3 10 4 13 Vegetables/fruit 47 155 4 13 Cheese 85 281 19 63 Beef 6 20 5 17 Chicken/poultry 5 17 5 17 Butter 14 46 6 20 Milk 2 6.6 1 3.3 Vegetable oil 3 10 3 10 Industrial oil 12 40 6 20
All samples below the LOD were clearly non detectable and hence were assigned a “zero” value. Concentrations above the LOQ were quantified accurately and precisely
and were assigned their measured concentration.
Samples containing PFOS/PFOA concentrations equal or above the LOD, but below the LOQ, were quantified more accurately and precisely than samples below the LOD but less accurately and precisely than samples above the LOQ. To incorporate this uncertainty in the intake calculations these samples were assigned a value of either of the following three scenarios:
7
Equal to LOD (Low scenario) Their measured concentration (Middle scenario) Equal to LOQ (High scenario).
2.5
Intake Calculations
The intake calculations were performed following the following four steps:
1) Measurement of food consumption
Food consumption data were obtained from DNFCS-3 (Kistemaker et al., 1998). This database contains information on the food products consumed by 6250 individuals (including the amounts) on two consecutive days. In total 1207 different consumed food products are listed in the DNFCS-3. For each of these products a comprehensive description is available from the Netherlands Food Composition table (NEVO-table).
2) Linking PFC concentrations with food products and drinking water
Where possible, the consumed foods were directly linked to PFC concentrations. For example, industrial oils (e.g. cooking fat), vegetable oils (e.g. cooking fat fluid), cheese (e.g. Cheese Edam 40+) and bakery products (e.g. cakes) were linked to the PFC concentrations as determined in the corresponding food category. For the other (more complex) food products, a conversion model for primary agricultural products (CPAP, Van Dooren et al., 1995) was used to split food products into their constituting primary agricultural products (including their mass fractions). The PFC concentrations of all the separate ingredients, corrected for their fraction, were added to get the PFC concentration in the consumed food.
PFOS and PFOA in drinking water was directly linked to European wide data as presented by EFSA (2008).
3) Individual daily intake assessment
The individual daily intake was derived by coupling the food consumption data with the corresponding 2009 PFC concentrations for each individual in DNFCS-3.
4) Long-term intake assessment
Deriving the long term intake from the individual daily intakes requires statistical analysis. We applied the Beta-Binomial-Normal (BBN) model as implemented in the Monte Carlo Risk Assessment software (MCRA) release 6.2 (De Boer and Van der Voet, 2007; de Boer et al., 2009). The BBN model allows for the calculation of a long-term intake distribution as a function of age and sex. From the long-term intake distribution a life-long averaged intake is derived, by integrating the intake over each age and then dividing by age. The BBN method not only allows for the calculation of statistical intake characteristics as percentile values but also for their corresponding confidence intervals.
8
3. Results
3.1
Concentrations of PFS in food categories
One or more PFCs could be detected in all food categories examined. Out of 14 PFCs, most PFCs were detected in crustaceans (11), followed by lean and fatty fish (10), and butter and flour (8). Five or less PFCs were detected in the other food categories. The concentrations of the 14 PFCs are presented in Table 1. Only PFHpA, PFOA, PFNA, PFDA, PFHxS and PFOS could be detected in the majority of the food categories. The short chain PFCs, PFPeA and PFBS were not detected in any food category and PFBA only in three categories. The long chain PFCs, PFUnA, PFDoA, PFTrA and PFTeA, were observed in only 6 food categories.
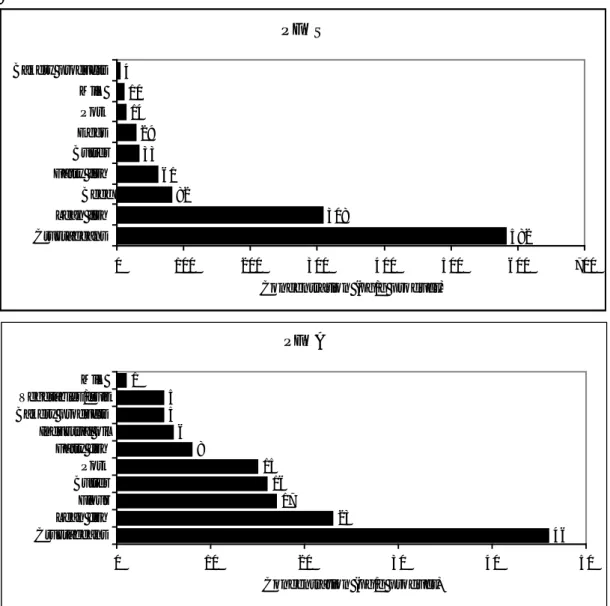
The concentrations of the separate PFCs in the examined food categories are very low (< 1 ng/g product). Highest concentrations are observed in crustaceans and lean fish. In particular, PFOS showed high concentrations in those categories. The food categories cheese, pork, chicken/poultry, bakery products, flour, vegetable oil and industrial oil contained the lowest concentrations (< 0.02 ng/g food category for each PFC). Since intake calculations are only performed for PFOS and PFOA in this study, concentrations of those PFCs are presented separately in Figure 1. Highest concentrations of PFOS and PFOA are found in crustaceans and lean fish. Nevertheless, the concentrations of PFOS are 13 times higher than the PFOA levels.
Table 1. Concentrations of PFCs (ng/g product) in food categories sampled in 2009 measured by IVM (values >LOD are printed bold)
Food category PFBA PFPeA PFHxA PFHpA PFOA PFNA PFDA PFUnA PFDoA PFTrA PFTeA PFBS PFHxS PFOS
Fatty fish <0.043 <0.044 <0.005 0.003 0.008 1 0.005 0.004 0.036 0.01 0.041 0.003 <0.001 0.009 0.061 Lean fish <0.03 <0.028 <0.003 0.002 0.023 2 0.077 0.048 0.177 0.056 0.229 0.024 <0.001 0.023 0.308 2 Crustaceans 0.031 <0.034 <0.004 0.005 0.046 2 0.058 0.090 0.157 0.045 0.268 0.045 <0.001 0.044 0.582 2 Butter <0.031 <0.043 0.020 0.005 0.016 1 0.002 0.006 <0.003 0.002 <0.019 <0.001 <0.003 0.016 0.033 1 Cheese <0.099 <0.089 <0.009 0.007 <0.019 0.007 0.008 <0.016 <0.011 <0.092 <0.005 <0.012 <0.025 <0.085 Milk 0.043 <0.023 <0.006 <0.003 0.0011,2 <0.001 0.001 <0.0005 <0.0005 <0.0005 <0.002 <0.004 <0.002 0.010 2 Eggs <4 <0.512 <0.054 <0.002 <0.032 0.006 0.011 <0.019 <0.013 <0.107 <0.005 <0.003 <0.006 0.029 1 Pork <0.112 <0.104 <0.011 0.006 0.015 1 0.002 0.002 <0.004 <0.003 <0.023 <0.001 <0.003 <0.005 0.014 1 Beef <0.048 <0.044 <0.005 <0.0002 <0.005 0.004 0.006 0.002 <0.002 <0.014 <0.0007 <0.002 <0.004 0.082 Chicken/poultry <0.091 <0.067 <0.007 0.001 <0.005 0.001 <0.001 <0.003 <0.002 <0.017 <0.0008 <0.002 0.003 <0.005 Bakery products <0.345 <0.089 <0.009 <0.0002 0.005 1 0.001 0.001 <0.001 <0.0007 <0.006 <0.0003 <0.001 0.006 0.004 1 Vegetables/fruit 0.13 <0.034 <0.004 <0.0002 0.005 1 0.001 0.002 <0.002 <0.002 <0.014 <0.0007 <0.006 <0.012 <0.047 Flour <0.057 <0.028 0.011 0.014 0.017 0.015 0.009 0.004 0.004 <0.009 <0.0004 <0.001 0.018 <0.009 Vegetable oil <0.032 <0.028 <0.003 0.001 <0.003 <0.0001 <0.0006 <0.002 <0.001 <0.011 <0.0006 <0.0009 <0.002 <0.003 Industrial oil <0.054 <0.052 <0.005 0.003 0.006 1 <0.0003 0.002 <0.003 <0.002 <0.016 <0.0008 <0.003 0.007 <0.012 1
Value between LOD and LOQ
2
Figure 1. Concentrations of PFOS and PFOA in food categories. Only values > LOD are presented. PFOS 582 308 82 61 33 29 14 10 4 0 100 200 300 400 500 600 700 Crustaceans Lean fish Beef Fatty fish Butter Eggs Pork Milk Bakery products Concentration (pg/g product) PFOA 46 23 17 16 15 8 6 5 5 1 0 10 20 30 40 50 Crustaceans Lean fish Flour Butter Pork Fatty fish Industrial oil Bakery products Vegetables/fruit Milk Concentration (pg/g product)
3.2
Individual daily intake: contribution of food categories
The “total diet” method allows for the analysis of the contribution of various food categories and drinking water to the individual daily intake (as obtained from the DNFCS-3). Table 2 presents these contributions of the intake calculations for PFOS and PFOA.
Given indicative concentrations for PFOS and PFOA in Dutch drinking water resulted in drinking water to account for 33% and 55% of the intake, respectively. Next to drinking water, vegetables/fruit (19%), flour (15%) and pork (6%) were found important contributors to the PFOA intake. The remaining percentage of intake of PFOA was divided over other food categories, with none of them contributing more than 2% of the total exposure. For PFOS, drinking water contributed for 33%, followed by milk (25%), beef (21%), lean fish (9%) and pork (4%). The other categories showed a contribution of less than 2%.
12
Table 2. The contribution of various food categories to the individual daily intake (as
obtained from the DNFCS-3) of PFOS and PFOA
Food category PFOA PFOS Concentration (pg/g product) Intake (pg/kg bw/day) Percentage of individual daily intake Concentration (pg/g product) Intake (pg/kg bw/day) Percentage of individual daily intake Fatty fish 8 0.4 0.2 61 3.1 1.0 Lean fish 23 2.2 0.9 308 29.5 9.2 Crustaceans 46 0.7 0.3 582 8.5 2.6 Butter 16 0.6 0.3 33 1.3 0.4 Cheese 0 0 0 0 0 0 Milk 0.5 3.9 1.6 10 78.8 24.5 Eggs 0 0 0 29 7.7 2.4 Pork 15 14.9 5.9 14 13.9 4.3 Beef 0 0 0 82 68.1 21.2 Chicken/poultry 0 0 0 0 0 0 Bakery products 5 3.7 1.5 4 3.0 0.9 Vegetables/fruit 5 47.4 18.9 0 0 0 Flour 17 38.4 15.3 0 0 0 Vegetable oil 0 0 0 0 0 0 Industrial oil 6 0.7 0.3 0 0 0 Drinking water 9* 137.9 55.0 7* 107.3 33.4
Measured concentration are used when values are between LOD and LOQ (middle scenario) Values < LOD are assigned 0, values above the LOQ their measured values.
Concentrations in drinking water are based on calculations provided by EFSA, 2008
3.3
Long-term intake
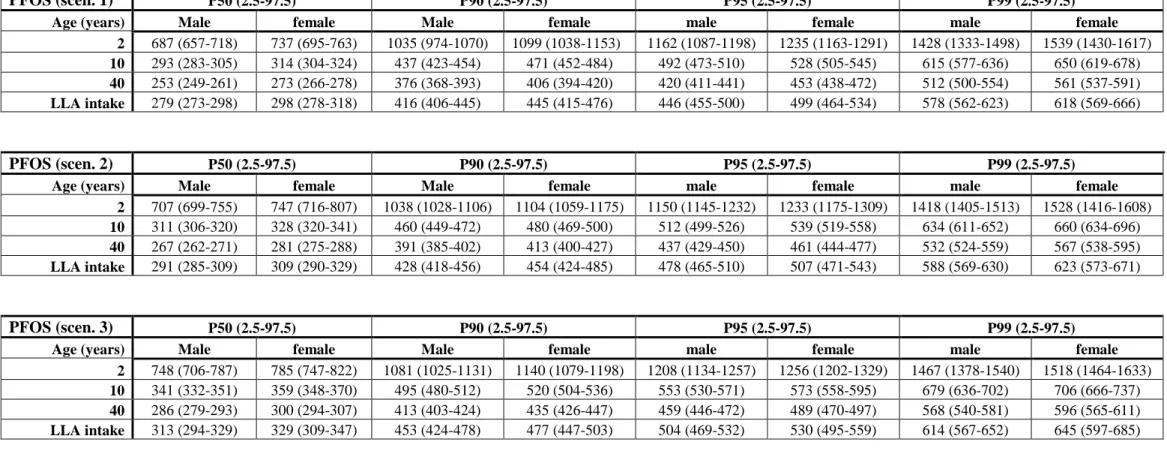
Age dependent intakes of PFOS and PFOA are presented separately for males and females (see Table 3). Table 3 also presents the percentiles of the life-long average exposure.
Percentile values of PFOS and PFOA are comparable between males and females. However, females tend to have a slightly higher intake of the two PFCs. For PFOS the best estimate of the median (P50) life-long intake ranged from 279 to 329 pg/kg bw/day in the three different scenarios. For PFOA the best estimate of the median life-long intake varies between 212 and 346 pg/kg bw/day.
Estimated levels of high life-long intake (P99) were between 578 and 645 pg/kg bw/day for PFOS and between 462 and 675 pg/kg bw/day for PFOA.
Table 3. Percentiles of age-dependent long-term dietary intake (including drinking water) of PFOS and PFOA (pg/kg bw/day). Between brackets: 95% confidence interval. Values below the LOD were set according to the three scenarios described in Material and Methods.
PFOS (scen. 1) P50 (2.5-97.5) P90 (2.5-97.5) P95 (2.5-97.5) P99 (2.5-97.5)
Age (years) Male female Male female male female male female
2 687 (657-718) 737 (695-763) 1035 (974-1070) 1099 (1038-1153) 1162 (1087-1198) 1235 (1163-1291) 1428 (1333-1498) 1539 (1430-1617)
10 293 (283-305) 314 (304-324) 437 (423-454) 471 (452-484) 492 (473-510) 528 (505-545) 615 (577-636) 650 (619-678)
40 253 (249-261) 273 (266-278) 376 (368-393) 406 (394-420) 420 (411-441) 453 (438-472) 512 (500-554) 561 (537-591)
LLA intake 279 (273-298) 298 (278-318) 416 (406-445) 445 (415-476) 446 (455-500) 499 (464-534) 578 (562-623) 618 (569-666)
PFOS (scen. 2) P50 (2.5-97.5) P90 (2.5-97.5) P95 (2.5-97.5) P99 (2.5-97.5)
Age (years) Male female Male female male female male female
2 707 (699-755) 747 (716-807) 1038 (1028-1106) 1104 (1059-1175) 1150 (1145-1232) 1233 (1175-1309) 1418 (1405-1513) 1528 (1416-1608)
10 311 (306-320) 328 (320-341) 460 (449-472) 480 (469-500) 512 (499-526) 539 (519-558) 634 (611-652) 660 (634-696)
40 267 (262-271) 281 (275-288) 391 (385-402) 413 (400-427) 437 (429-450) 461 (444-477) 532 (524-559) 567 (538-595)
LLA intake 291 (285-309) 309 (290-329) 428 (418-456) 454 (424-485) 478 (465-510) 507 (471-543) 588 (569-630) 623 (573-671)
PFOS (scen. 3) P50 (2.5-97.5) P90 (2.5-97.5) P95 (2.5-97.5) P99 (2.5-97.5)
Age (years) Male female Male female male female male female
2 748 (706-787) 785 (747-822) 1081 (1025-1131) 1140 (1079-1198) 1208 (1134-1257) 1256 (1202-1329) 1467 (1378-1540) 1518 (1464-1633)
10 341 (332-351) 359 (348-370) 495 (480-512) 520 (504-536) 553 (530-571) 573 (558-595) 679 (636-702) 706 (666-737)
40 286 (279-293) 300 (294-307) 413 (403-424) 435 (426-447) 459 (446-472) 489 (470-497) 568 (540-581) 596 (565-611)
14
Table 3 (continued)
PFOA (scen. 1) P50 (2.5-97.5) P90 (2.5-97.5) P95 (2.5-97.5) P99 (2.5-97.5)
Age (years) Male female Male female male female male female
2 385 (368-400) 407 (393-425) 593 (565-615) 631 (603-658) 675 (637-696) 714 (678-747) 851 (794-884) 891 (846-945)
10 181 (176-185) 192 (187-197) 275 (269-285) 296 (287-303) 311 (303-324) 332 (324-345) 395 (378-410) 414 (404-435)
40 222 (218-226) 236 (233-242) 342 (333-349) 367 (354-372) 385 (377-395) 416 (401-423) 493 (470-502) 520 (497-535)
LLA intake 212 (192-221) 226 (205-236) 326 (295-341) 347 (314-363) 368 (332-386) 392 (354-411) 462 (414-488) 493 (442-520)
PFOA (scen. 2) P50 (2.5-97.5) P90 (2.5-97.5) P95 (2.5-97.5) P99 (2.5-97.5)
Age (years) Male female Male female male female male female
2 424 (408-445) 452 (436-474) 645 (613-671)) 684 (655-715) 724 (688-753) 770 (735-801) 899 (851-948) 954 (916-994)
10 203 (197-209) 216 (209-221) 306 (296-315) 327 (316-335) 342 (333-357) 368 (354-376) 427 (412-446) 461 (438-471)
40 237 (232-241) 252 (247-257) 357 (349-364) 382 (372-389) 401 (391-411) 429 (418-438) 507 (484-517) 529 (513-548)
LLA intake 229 (211-241) 244 (224-256) 346 (317-363) 367 (337-386) 389 (356-409) 413 (378-435) 484 (440-512) 513 (467-544)
PFOA (scen. 3) P50 (2.5-97.5) P90 (2.5-97.5) P95 (2.5-97.5) P99 (2.5-97.5)
Age (years) Male female Male female male female male female
2 691 (671-716) 736 (714-765) 985 (967-1039) 1065 (1030-11-7) 1092 (1073-1155) 1186 (1141-1234) 1340 (1295-1409) 1448 (1388-1495) 10 328 (323-329) 355 (347-363) 477 (467-690) 513 (500-526) 529 (519-545) 567 (555-586) 647 (627-669) 683 (670-715)
40 314 (308-319) 338 (329-341) 456 (444-461) 487 (473-492) 506 (492-511) 539 (524-547) 612 (594-630) 649 (635-669)
3.4
Comparison of dietary intake to the TDI
In 2008 EFSA’s CONTAM panel established a Tolerable Daily Intake (TDI) of 150 ng/kg bw/day for PFOS and 1500 ng/kg bw/day for PFOA.
The calculated median (P50) life-long intake of PFOS is around 0.3 ng/kg bw/day, which is 500 times lower than the TDI of 150 ng/kg bw/day. Even the P99 in the high intake scenario (0.65 ng/kg bw/day, females) is a factor 230 lower than the TDI. The calculated median (P50) life-long intake of PFOA is varying between 0.2 and 0.35 ng/kg bw/day, depending on which values are used for the calculations. This calculated dietary intake is 4300 - 7500 lower than the TDI of 1500 ng/kg bw/day. Even the P99 in the high intake scenario (0.68 ng/kg bw/day, females) is a factor 2200 lower than the TDI.
17
4. Discussion and Conclusions
This study presents dietary intake calculations of PFOS and PFOA, inclusive the exposure from drinking water.
The median life-long intake for PFOS amounted around 0.3 ng/kg bw/day and, depending on the intake calculation scenario, 0.2 to 0.35 ng/kg bw/day for PFOA. These intakes are well below the TDIs of 150 ng/kg bw/day for PFOS and 1500 ng/kg bw/day for PFOA.
From this results it might be concluded that the exposure of the Dutch population to PFCs from food and drinking water has limited toxicological relevance. However, in this context the following subjects of discussion should be kept in mind.
Concentrations in food
The concentrations found in the food items analyzed in this study are, in general terms, lower than those found in other dietary studies of PFCs in foods. In the present study, the measured concentration ranged between 0.001 and 0.6 ng/g. In a Canadian study, PFOS was detected in beef steak, ground beef, popcorn and marine and freshwater fish (Tittlemier et al., 2007). The measured concentrations were > 2 ng/g, except for popcorn (1 ng/g). PFOA was only detected in roast beef (2.6 ng/g) and popcorn (3.6 ng/g). The British Food Safety Agency (FSA) has presented data of PFOS in fish, liver and kidney, while PFOA was detected in whitebait, crab and liver (FSA, 2009). The concentrations ranged between 1 and 20 ng/g. Both studies (Tittlemier et al., 2007 and FSA, 2009) showed higher concentrations in food products compared with the results in the present study. However, a study in Spain (Ericson et al., 2008) has detected low levels of PFOS in vegetables, fish, meat, eggs and dairy products too. PFOA was only detected in milk. Measured concentrations were between 0.02 and 0.7 ng/g, which were in the same range compared with the present study. In the current study, highest concentrations of PFOS and PFOA are observed in crustaceans and lean fish.
Concentration in fish
The PFOS concentrations in fish samples in this study are lower than reported for freshwater fish in German waters (Schuetze et al., 2010) and slightly lower than in Swedish freshwater fish (Berger et al., 2009). The results presented here are also lower than of an earlier Dutch survey of freshwater and marine fish from 2004 (Van Leeuwen and De Boer, 2006). A possible explanation for the low concentrations measured in this study could be the result of using a different analytical method or using pooled samples. Concentrations of PFCs in individual food items used to prepare the food category will be higher than those reported for the food category in total since food items with PFC levels < LOD in the same category can effectively act to dilute PFC concentrations in individual food items. PFOS and PFOA have been demonstrated to bioaccumulate in fish (Martin et al., 2004a; 2004b). Thus fish is potentially an important dietary source of these PFCs for consumers, in particular high fish consumers. Freshwater and marine fish, and seafood, have been analyzed for PFCs. Generally PFOS has been found at higher levels in fish than PFOA. The difference between the PFOS and PFOA fish concentrations are caused by a lower potential of PFOA to bioaccumulate in fish than PFOS. Differences in bioconcentration and dietary accumulation of PFOS and PFOA have been demonstrated in laboratory experiments (Martin et al., 2004 and 2004b).
18
Alternatively, the relative low PFOS concentrations in fish samples in this study are in concordance with the low concentrations as found in farmed fish consumed in The Netherlands (Van Leeuwen et al., 2008).
Intake calculation scenarios
Foods levels below the LOD were considered as evidence for a chemical’s absence from the analyzed food. Foods levels below the LOD were considered as evidence for a chemical’s absence from the analyzed food. In the intake calculations all food samples below the LOD were therefore assigned a “zero” value, i.e. the contribution of these samples to the dietary intake was neglected.
In the case of levels above the LOD and below the LOQ three scenarios were applied: a low scenario in which the chemical concentration is set at the LOD, a middle scenario in which the chemical concentration is set at its measured concentration and a high scenario in which the chemical concentration is set at the LOQ. All three scenarios resulted in quite similar intake calculations, illustrating the high sensitivity of the applied chemical analysis in detecting PFOS and PFOA in food.
Intake calculations from food and drinking water
Given the discussion points mentioned above it is not surprising that (even) the high level PFOS/PFOA intakes in the present study (P99: 0.5 - 0.6 ng/kg bw/day for PFOS and PFOA) are very low compared to studies performed in the UK (FSA, 2009), Canada (Tittlemier et al., 2007) and Europe (EFSA, 2008) and somewhat lower than in Spain (Ericson et al., 2008). The FSA presented an average adult dietary intake of 10 ng/kg bw/day for both PFOS and PFOA. The high level dietary intake was 20 ng/kg bw/day for both compounds. These high intakes however result from the attribution of relative high LOD levels of PFOS/PFOA to food products in which PFOS and PFOA levels were below the LOD (LODs reaching from 1 – 20 ng/g product for PFOS and 1 – 10 ng/g product for PFOA, Bakker et al., 2009). Ericson et
al. calculated a dietary intake of PFOS of 1.06 ng/kg bw/day, while Tittlemier et al.
estimated a dietary intake of PFOS about 4 ng/kg bw/day. EFSA (2008) calculated an average dietary exposure for PFOS and PFOA of 60 and 2 ng/kg bw/day, respectively. The dietary intake thus varies significantly between studies, with the present study showing the lowest intake. These differences likely result from differences in the sensitivity of analytical chemical methods to detect PFOA and PFOA in food. Not surprisingly, using a sensitive analytical method as in this study resulted in a relative low dietary intake of PFOS and PFOA in The Netherlands. This results (again) stresses that prudence is called for in using the results of “not sensitive enough” chemical analyses in food for intake calculations: using such analyses will certainly result in an overestimation of the dietary exposure.
Irrespective of the fact that the PFOS and PFOA concentrations in drinking water are only indicative for the concentrations of these compounds in Dutch drinking water, this report clearly identifies drinking water as an important exposure source for PFOS and PFOA. Besides drinking water, the main contributors of PFOA intake were vegetables/fruit (19%) and flour (15%). For PFOS, next to drinking water, the main contributors are milk (25%) and beef (21%). Despite the concentrations of PFOS and PFOA being relatively high in fish and crustaceans, the contribution to the intake is low due to the relatively low consumption of fish and crustaceans in The Netherlands. It is remarkable that the main contributors, except for drinking water, are different for
19
PFOS and PFOA. These results suggest that PFCs may penetrate or accumulate differently in the various food product. For example, PFOS was detected in eggs and beef, while PFOA was not detected in these food categories. On the other hand PFOA was detected in vegetables/fruit and flour, while PFOS was not found herein.
Finally, the calculations reported here are based on food consumption data collected from April 1997 to March 1998. Here bias may have been introduced by linking rather dated food consumption data to actual food concentration data. However, data from a more recent, i.e. 2003, food questionnaire among young adults in The Netherlands did reveal differences in food consumption pattern, however, to an extent which will only marginally affect the intake presented in this report (see Appendix B).
Exposure other than food
With regard to food as the source of PFC exposure Fromme et al. (2009) has reviewed PFC concentrations in indoor and ambient air, house dust, drinking water and food. They have concluded that dietary exposure is the dominant intake pathway, responsible for 96% (PFOS) and 99% (PFOA) of the total intake of the general population using mean intake data. House dust is responsible for 2% (PFOS) and 0.6% (PFOA) of the total intake, while air (indoor and outdoor together) is responsible for only 0.3% (PFOS) and 0.08% (PFOA).
Risk Assessment
The estimated dietary intakes of PFOA are well below the TDI of 1500 ng/kg bw/day, set by the EFSA. Similarly, the estimated intakes of PFOS are well below the TDI of 150 ng/kg bw/day.
EFSA primarily determined these TDIs based on the externally administered dose, without explicit incorporation of interspecies differences in accumulation of PFCs. Risk assessments of other accumulating compounds showed that including information on compound specific kinetics results in much lower TDIs (SCF, 2000, 2001; WHO, 2000; JECFA, 2002; Bakker et al., 2008). As a consequence the health risk may be underestimated. Quantification of this underestimation requires kinetic modelling of PFOS and PFOA in the experimental animals and in humans. These modelling studies are currently under way at the RIVM.
Recently, PFOS was evaluated within the Water Framework Directive (WFD, 2000/60/EC)( Smit et al., 2010). The WFD aims to protect all situations including those locations where local fisherman consume self caught fish on a daily basis. Smit
et al. calculated a maximum concentration in freshwater and fish based on several
default assumptions, resulting in a permissible PFOS concentration of 9.1 ng/g fish. Here it should be kept in mind that the latter concentration should not be considered as a product safety standard. The calculations in Smit et al. cannot be directly compared to the current intake calculations in this report since we focused on the actual daily intake through consumption fish.
20
5. Recommendations
Concentration measurement in drinking water
Though indicative values were used for the PFOS/PFOA concentration in drinking water this matrix appeared as an important exposure source for these compounds. The used concentrations represent European wide data as presented by EFSA (2008) and amounted 7 pg/g for PFOS and 9 pg/g for PFOA. These indicative concentrations for PFOS and PFOA in Dutch drinking water resulted in drinking water to account for 33% and 55% of the total PFOS resp. PFOA intake. These percentages are prone to considerable uncertainty with regard to the situation in The Netherlands. Background concentration in drinking water may be in the low ng/l range, however concentrations up to 300 ng/L have been found in drinking water as a direct cause of an environmental spill off to the surrounding area (for a complete review of PFOS/PFOA in drinking water, ground water and surface water and their mutual dependency, see Eschauzier and de Voogt, 2010). Clearly even the consumption of 1 l of drinking water per day with a concentration of 300 ng/l will lead to an exposure which will overshadow the exposure from Dutch food as assessed in this report, however still will stay below either of the PFOS/PFOA TDIs. Nevertheless, as monitoring data in The Netherlands are missing, a pilot study on the PFC content of drinking water could confirm this conclusion.
Consumption of fresh water fish
The concentrations of PFOS and PFOA in fish used in this study (PFOA: 8-23 pg/g product, PFOS: 61 – 308 pg/g) lie well below levels reported from fresh water fish (levels up to 230 ng/g, see Van Leeuwen and De Boer, 2006). As the consumption of freshwater fish by far outweighs all other exposures (and even may approach the TDI) it is recommended to perform a risk assessment of the exposure to PFOS/PFOA from fresh water fish, i.e. the exposure resulting from hobby-fishing.
Risk Assessment
The present study identified fourteen different PFCs in Dutch food, indicating that the the exposure to PFCs is not confined to PFOS and PFOA, but exists of a complex PFC mixture. In this respect the exposure to PFCs has similar characteristics as the exposure to dioxins and PolyBrominatedDiphenylEthers. In the case of dioxins the evaluation of a mixture exposure has been approached by the development of the so-called Toxic Equivalency Factor (TEF) concept. In this concept the toxic potency of individual mixture components is scaled towards a reference compound (2,3,7,8-TCDD). Underlying the TEF concept lies a common toxic working mechanism of the dioxin congeners.
In our opinion the exposure to PFCs and its corresponding risk assessment should be treated as a combined exposure in the future too. As a first approach the risk assessment may be performed by assuming dose additivity of the mixture components. This approach may be refined by the application of potency corrections. The application of potency corrections however needs comparative toxicity data for mixture components. Up to now comparable toxicity data are only available for PFOS and PFOA. Whereas PFOS and PFOA were found the dominant PFCs in Dutch food toxicity data of PFCs other than PFOS and PFOA are needed to come to a more definitive risk assessment of PFCs from food and drinking water.
21
Acknowledgements
Erik Roerink and Hans van Rhijn of the VWA laboratory in Zutphen are gratefully acknowledged for their skillful sample preparation.
22
References
Andersen, M.E., Clewell, H.J., Tan, Y-M, Butenhoff, J.I. and Olsen, G. (2006) Pharmacokinetic modeling of saturable, renal resorption of perfluoroalkylacids in monkeys- Probing the determination of long plasma half-lives. Toxicology, 227, 156-164.
Ballesteros-Gomez, A., Rubio, S. and S.P.J. van Leeuwen (2010) Combination of efficient extraction, in-line clean-up, and selective liquid chromatrography/tandem mass spectrometry for the quantitation of perfluorinated compounds in food at the low pictogram per gram level (Submitted to the Journal of Chromatogrphy).
Bakker, M.I., De Winter-Sorkina, R., De Mul, A., Boon, P.E., Van Donkersgoed,G., Van Klaveren, J.D., Baumann,B.A., Hijman, W.C.,Van Leeuwen, S.P.J., De Boer, J., and Zeilmaker, M.J. (2008) Dietary intake of PBDEs in The Netherlands. Molecular Nutrition and Food Research, 52, 204-216.
Bakker, M.I. and J.D. te Biesebeek (2009) Inname van perfluorverbindingen via voeding. Voorstel voor monstername, RIVM/SIR briefrapport, SIR-090146 MBA/hvg. Berger, U., Glynn, A., Holmstrom, K.E., Berglund, M., Ankarberg, E.H. and Tornkvist, A. (2009) Fish consumption as a source of human exposure to perfluorinated alkyl substances in Sweden – Analysis of edible fish from Lake Vättern and the Baltic Sea. Chemosphere, 6, 799-804.
De Boer, W.J. and Van der Voet, H. (2007) MCRA, Release 6, a web-based program for Monte Carlo Risk Assessment, On line Manual, documenting MCRA Release 6.0. De Boer, W. J., van der Voet, H., Bokkers, B. G., Bakker, M. I. and Boon, P. E. (2009). Comparison of two models for the estimation of usual intake addressing zero consumption and non-normality. Food Addit Contam Part A Chem Anal Control Expo Risk Assess 26, 1433-49.
De Mul, A., De Winter-Sorkina, R., Boon, P.E., Van Donkersgoed, G., Bakker, M.I. and Van Klaveren, J.D. (2005) Dietary intake of brominated diphenyl ether congeners by the Dutch population. Report 2005.006, RIKILT Institute of Food Safety, Wageningen.
De Mul, A., Bakker, M.I., Zeilmaker M.J., Traag, W.A., Van Leeuwen, S.P.J., Hoogenboom, L.A.P., Boon, P.E. and Van Klaveren, J.D. (2008) Dietary exposure to dioxins and dioxin-like PCBs in The Netherlands anno 2004. Regulatory Toxicology and Pharmacology, 51, 278–287.
Ericson, I., Martí-Cid, R., Nadal, M., Van Bavel, B., Lindström, G. and Domingo, J.L. (2008) Human exposure to perfluorinated chemicals through the diet: intake of perfluorinated compounds in foods from the Catalan (Spain) market. J Agric Food Chem, 56, 1787-1794.
23
Ericson, I., Domingo, J.L., Nadal, M., Bigas, E., Llebaria, X., Van Bavel, B. and Lindström, G. (2009) Levels of perfluorinated chemicals in municipal drinking water from Catalonia, Spain: public health implications. Arch Environ Contam Toxicol, 57, 631-638.
Eschauzier, C. and De Voogt, P. (2010) PFCs in the European drinking water environment: from raw water to tap water (manuscript in preparation).
European Commission (2010) Commission recommendations of 17 March 2010 on the monitoring of perfluoralkylated substances in food (2010/161/EU). Official Journal of the European Union.
European Food Safety Authority (EFSA) (2008) Perfluorooctane sulfonate (PFOS), perfluorooctanoic acid (PFOA) and their salts. Scientific Opinion of the Panel on Contaminants in the Food Chain (Question No EFSA-Q-2004-163). Adopted on 21 February 2008, The EFSA Journal, 653, 1-131.
Fromme, H., Tittlemier, S.A., Völkel, W., Wilhelm, M. and Twardella, D. (2009) Perfluorinated compounds – Exposure assessment for the general population in western countries. Int J Hyg Environ Health, 212, 239-270.
FSA (2009) Fluorinated chemicals in food. Food Survey Information Sheet 05/09 Food Standards Agency, UK, available at
http://www.food.gov.uk/science/surveillance/fsisbranch2009/fsis0509.
Hekster, F.M., Laane, R.W.P.M. and De Voogt, P. (2003) Environmental and toxicity effects of perfluoroalkylated substances. Rev Environ Contam Toxicol, 179, 99-121. Joint FAO/WHO Expert Committee on Food Additives (JECFA) (2002) Safety evaluation of certain food additives and contaminants, WHO Food Additives Series 48, WHO, Geneva, ISBN 9241660481.
Kistemaker, C., Bouman, M. and Hulshof, K.F.A.M. (1998) De consumptie van afzonderlijke producten door de Nederlandse bevolkingsgroepen - Voedselconsumptiepeiling 1997-1998. TNO-rapport V98.812, Zeist.
Lehmler, H.J. (2005) Synthesis of environmentally relevant fluorinated surfactants - a review. Chemosphere, 58, 1471-1496.
Liem, A.K.D., Theelen, R.M.C., Slob, W. and J.H. van Wijnen (1990) Dioxinen en planaire PCB’s in voeding. Gehalten in voedingsproducten en inname door de Nederlandse bevolking (in Dutch). RIVM rapport 730501.034.
Martin, J.W., Whittle, D.M., Muir, D.C. and Mabury, S.A. (2004a) Perfluoroalkyl contaminants in a food web from Lake Ontario. Environ Sci Technol, 38, 5379-5385. Martin, J.W., Smithwick, M.M., Braune, B.M., Hoekstra, P.F., Muir, D.C. and Mabury, S.A. (2004b) Identification of long-chain perfluorinated acids in biota from the Canadian Arctic. Environ Sci Technol, 38, 373-380.
24
Olsen, G.W., Burris, J.M., Ehresman, D.J., Froehlich, J.W., Seacat, A.M., Butenhof, J.L. and L.R. Zobel (2007) Half-life of serum elimination of perfluororoctanoate in Retired Fluorochemical Production Workers, Env. Health Perpect., 115, 9, 1298 – 1305.
Scientific Committee on Food (SCF) of the European Commission (2000) Opinion of the SCF on the Risk Assessment of Dioxins and Dioxin-like PCBs in Food. SCF/CS/CNTM/Dioxins/8 Final.
Scientific Committee on Food (SCF) of the European Commission (2001) Opinion of the SCF on the Risk Assessment of Dioxins and Dioxin-like PCBs in Food, Update based on new scientific information available since the adoption of the SCF opinion of 22th
Moermond, C.T.A., Verbruggen, E.M.J and C.E. Smit (2010) Environmental risk limits for PFOS. A proposal for water quality standards in accordance with the Water Framework Directive, RIVM Report 601714013/2010
November 2000, CS/CNTM/Dioxin/20 Final.
Schuetze, A., Heberer, T. and Effkemann, S. (2010) Occurrence and assessment of perfluorinated chemicals in wild fish from Northern Germany. Chemosphere, 78, 647-652.
Skutlarek, D., Exner, M. and Färber, H. (2006) Bestimmung von perfluorierten Tensiden (PFC)in der aquatischen Umwelt und Trinkwasser mittels HPLC-MS/MS. Poster auf der Tagung der Wasserchemischen Gesellschaft am 22.–24.05.2006 in Celle.
Tittlemier, S.A., Pepper, K., Seymour, C., Moisey, J., Bronson, R., Cao, X.L. and Dabeka, R.T.W. (2007) Dietary exposure of Canadians to perfluorinated carboxylates and perfluorooctane sulfonate via consumption of meat, fish, fast foods, and food items prepared in their packaging. J Agric Food Chem, 55, 3203-3210.
Van Dooren, M.M.H., Boeijen, I., Van Klaveren, J.D. and Van Donkersgoed, G. (1995) Conversie van consumeerbare voedingsmiddelen naar primaire agrarische producten (Conversion of foods to primary agricultural commodities), RIKILT report 95-17, RIKILT/DLO, Wageningen, The Netherlands.
Van Leeuwen, S.P.J. and De Boer, J. (2006) Survey on PFOS and other perfluorinated compounds in Dutch fish and shellfish. Wageningen, IMARES Report number C034/06.
Van Leeuwen, S.P.J., Velzen, M. van, Zwart, K., Veen, I. van der, Traag, W., Spanjer, M., Scholten, J. Rhijn, H. van en J. de Boer (2008) Contaminants in popular farmed fish consumed in The Netherlands and their levels in fish feed, Institute for Environmental Studies (IVM), VU University, The Netherlands, Report nr. R-08/03. Van Leeuwen, S.P.J., Swart, C.P., Noorlander, C.W. and Zeilmaker M.J. (2010) Perfluorinated compounds in Dutch food samples, Institute for Environmental Studies (IVM), VU University, The Netherlands, Report nr. R-10/005.
25
WHO European Centre for Environment and Health and International Program on Chemical Safety (2000) Assessment of the health risk of dioxins: re-evaluation of the tolerable daily intake (TDI), Van Leeuwen, F.X.R. and Younes, M.M. (Eds.), Food Additiv Contamin, 17, 4, 223-359.
26
Appendix A
Pooled food categories and their constituting food products
Food category Product Amount of 15 products (g)
Total amount (g)
Flour whole wheat flour 160 300
flour 140
Fatty fish herring 136.5 249
eel 9
mackerel 19.5
salmon 84
Lean fish cod 310.5 499.5
plaice 76.5 pollack 70.5 tuna 42 Pork sausage 64.5 250.5 slice of bacon 91.5 pork chop 72 bacon 7.5
minced meat rolled in bacon 15
Eggs chicken egg 30 eggs 250
Crustaceans mussels 265.5 498
shrimp 213
crab 19.5
Bakery products cake 60 249
almond paste cake 60
biscuits 42
brown spiced biscuit 43.5
pie 43.5 Vegetables/fruit apple 85.5 663 orange 117 grape 34.5 banana 19.5 potato 172.5
27 tomato, cucumber, paprika or mushroom 46.5
cauliflower or broccoli 46.5
white cabbage, red cabbage or brussel sprout 19.5
spinach, endive or lettuce 34.5
french beans 34.5
Cheese gouda cheese, 48+ 213 250.5
edammer cheese, 40+ 12
cheese, 48+, less salt 7.5
cheese, 30+ 12
brie cheese 6
Beef ground beef 271.5 499.5
beefburger 90
stewing steak 52.5
braising steak 36
minced steak 49.5
Chicken/poultry chicken leg 144 499.5
quarter chicken 70.5
chicken filet 225
chicken burger 37.5
collared chicken 22.5
Butter butter, salt-free 160.5 250.5
butter, salted 66
butter, low-fat 24
Milk half cream milk 500 500
Vegetable oil Margarine (solid/fluid) 156.2 249.3
low-fat margarine 37.5
frying fat (vegetable) 11.2
frying oil (vegetable) 29.4
sunflower oil 15
Industrial oil (low-fat) margarine 142.8 249.6
frying fat (industrial oil) 54
frying oil (industrial oil)
28
Appendix B
Food Consumption (grams/day) as revealed from the DNFCS-3 (1998) and the Food Consumption Survey Young Adults in The Netherlands (2003)(Age-class: 19-31 years).
DNFCS-1998 FCS Young Adults
n average P95 n average P95
Vegetables 737 102 219 1046 129 276
Fish (incl. crustaceans) 131 41 109 157 64 122
Meat 741 106 233 1092 125 258
Eggs 280 28 70 526 28 74
Cheese 622 39 96 850 39 98
RIVM
National Institute for Public Health and the Environment P.O. Box 1
3720 BA Bilthoven The Netherlands www.rivm.com