Disease burden of food-related pathogens
in the Netherlands, 2015
RIVM Letter report 2017-0060 M.J. Mangen et al.
Colophon
© RIVM 2017
Parts of this publication may be reproduced, provided acknowledgement is given to: National Institute for Public Health and the Environment, along with the title and year of publication.
DOI 10.21945/RIVM-2017-0060
M.J. Mangen (auteur), RIVM I.H.M. Friesema (auteur), RIVM M. Bouwknegt (auteur), RIVM W. van Pelt (auteur), RIVM Contact:
Marie-Josee Mangen
marie-josee.mangen@rivm.nl
This investigation has been performed by order and for the account of Ministerie van VWS, within the framework of Programma 5
This is a publication of:
National Institute for Public Health and the Environment
P.O. Box 1 | 3720 BA Bilthoven The Netherlands
Synopsis
Disease burden of food-related pathogens in the Netherlands, 2015
The Ministry of VWS has requested RIVM to present an annual update on the number of illnesses caused by 14 enteric pathogens. These
pathogens can be transmitted by food, the environment, animals and humans. The disease burden is expressed in DALYs (Disability Adjusted Life Years), a metric integrating morbidity and mortality into one metric unit. Furthermore, the cost-of-illness (COI) related to the 14 food-related pathogens was estimated and expressed in euros. The total disease burden caused by the 14 pathogens increased from around 12,600 DALY in 2014 to 12,800 DALY in 2015. The share of foodborne transmission in this estimated burden was comparable to earlier years, mounting to 5,800 DALY in 2015. The food-related COI were slightly increased from 166 M€ in 2014 to 168 M€ for 2015. The increase in both, burden and in costs, in the estimates is possibly related to the significant larger incidence of rotavirus infections compared to 2014. The research presented in this report results in more insight in the true incidence of foodborne diseases and the associated disease burden and costs-of-illnesses and enables to monitor trend in time for these public health indicators.
Publiekssamenvatting
Ziektelast van via voedsel overdraagbare ziekteverwekkers in Nederland in 2015
Het RIVM onderzoekt jaarlijks hoeveel mensen ziek worden van 14 ziekteverwekkers die via voedsel in het menselijk lichaam terechtkomen (darmpathogenen). Deze ziektelast wordt uitgedrukt in DALY’s
(Disability Adjusted Life Year), een internationaal gehanteerde maat voor het aantal gezonde levensjaren die verloren gaan aan ziekte of overlijden. Het aantal verloren DALY’s als gevolg van de 14
ziekteverwekkers is in 2015 geschat op 5,800, en is daarmee iets lager dan in 2014 (5.900 DALY’s).
Daarnaast wordt geschat welke kosten hieraan verbonden zijn (cost-of-illness). Deze omvatten directe medische kosten, maar ook de kosten voor de patiënt en/of zijn familie, zoals reiskosten, als ook de kosten binnen andere sectoren, bijvoorbeeld door werkverzuim. De
gerelateerde kosten van de 14 ziekteverwekkers die mensen via voedsel opliepen was met 168 miljoen euro iets hoger dan in 2014 (166 miljoen euro). De verschillen zijn grotendeels een gevolg van schommelingen in de infecties die zich voordoen, de ziektelast die ze veroorzaken en uiteenlopende kosten per infectie.
De onderzochte ziekteverwekkers kunnen niet alleen via voedsel aan de mens worden overgedragen (circa 40 procent), maar ook via het milieu (bijvoorbeeld via oppervlaktewater), dieren, en van mens op mens. De verhouding verschilt per ziekteverwekker. De totale ziektelast van alle ‘routes’ is geschat op 12.800 DALY, en daarmee iets hoger dan in 2014 (12.600 DALY). De totale kosten werden geschat op 409 miljoen euro en waren daarmee hoger dan in 2014 (385 miljoen). Een belangrijke
oorzaak hiervan is een verdubbeling van aantal rotainfecties ten opzichte van 2014.
VWS is opdrachtgever van dit onderzoek. De resultaten bieden handvatten om meer zicht te krijgen op het daadwerkelijke aantal voedselinfecties dat mensen jaarlijks oplopen en de bijbehorende ziektelast.
Kernwoorden: voedsel-gerelateerde ziekte, ziektelast, DALY, kosten, trend
Contents
1 Introduction — 9 2 Methods — 11 2.1 Trend information — 11 2.2 Model updates — 12 2.3 Disease burden — 12 2.4 Cost of illness — 12 3 Results — 13 3.1 Trend information — 13 3.2 Disease incidence — 133.3 Disease burden by pathogen — 14 3.4 Cost of illness by pathogen — 14 3.5 Attribution — 14
4 Discussion — 15 References — 17
1
Introduction
Since 2008, RIVM regularly publishes estimates of the incidence, disease burden and costs-of-illnesses of food-related disease on its web pages in publicly available reports[1-6]. Furthermore the website
https://www.volksgezondheidenzorg.info/ launched in 2014, combines multiple information sources in a single website. The estimates from 2013 onwards will be integrated in this website as of 2016.
The epidemiological estimates of the disease burden are expressed in Disability Adjusted Life Years (DALY). The methodology for these estimates is described in detail in a peer-reviewed paper [1]. The economic burden estimates, the cost-of-illness (COI) are expressed in euros, and are also described in detail in a peer-reviewed paper [7]. In the current report, trend information from surveillance, demographic information and consumer price index (a measure for changes in price levels of consumer goods and services) were used to update the information to the year 2015.
2
Methods
2.1 Trend information
Data on the size and age distribution of the Dutch population, as well as mortality risks and the number of live births and stillbirths were
obtained from Statistics Netherlands1.
Trend information on the incidence of gastro-enteritis (GE) by pathogen in the general population and consulting the general practitioner was obtained from the following sources:
• Thermophilic Campylobacter spp.: RIVM laboratory surveillance • Non-typhoidal Salmonella spp.: RIVM laboratory surveillance • Shiga-toxin producing Escherichia coli O157 (STEC O157):
RIVM-OSIRIS, active surveillance.
• Norovirus: hospitalisation for viral gastro-enteritis (ICD code 86) • Rotavirus: RIVM laboratory surveillance,
• Hepatitis A, and perinatal and acquired listeriosis: RIVM-OSIRIS, mandatory notification and active surveillance.
• Cryptosporidium spp.: a stable incidence since 2003 was assumed, based on laboratory surveillance data from 2001 to 2007.
• Giardia spp.: a continuing decrease with the rate of -1.03% per year observed between 2001 and 2007 was assumed
• No trend information was available for the GE toxin-producing bacteria (Bacillus cereus, Clostridium perfringens and
Staphylococcus aureus), hepatitis-E and toxoplasmosis. For the latter, trends in reported fatalities are included.
Trends in hospitalizations for gastro-enteritis as primary cause (ICD codes 20-93; 558.9) were obtained from the National Medical Register up until 2010 and from the Dutch Hospital Data (DHD) for 2011-2014. Based on the observed time series from the laboratory surveillance (primarily tested faeces) estimates for the number of hospitalized patients in 2015 were derived by taking the average for the number of hospitalized patients in 2011-2013.
Data on norovirus surveillance was based on ICD9 codes until 2012, and based on ICD10 codes from 2012 onwards. This lead to an increased incidence rate per 100,000 of 27.1 compared to 19.7 for 2012 and 37.6 compared to 18.6 for 2013. The baseline incidence rate (i.e., for 1999) was based on ICD9-codes, so straightforward inclusion of the new incidence rates in the update would likely lead to a trend break in methodology used. However, with ICD10 codes, GE cases are expected to be better distinguished and reported, and thus to lead to a more accurate incidence estimate. Yet, for comparison of trends in annual foodborne DALY estimates with earlier years a comparable methodology is needed. Therefore, we used the ICD9 and ICD10 estimates for 2012 and 2013 to estimate the proportional increase due to the new reporting system. Based on ICD9 3293 (2012) and 3132 (2013) cases were
reported, based on ICD10 4534 (2012) and 6328 (2013). The proportional increase thus mounted to
(3293+3132)/(4534+6328)=1.69. The incidence rate for 2014 was subsequently divided by this number. The same methodology was applied for 2015.
Excess mortality risks from campylobacteriosis and salmonellosis were assumed constant across the years. Fatalities due to listeriosis and STEC O157 were obtained from active surveillance. Age-specific case fatality ratios for norovirus and rotavirus, originally obtained from German surveillance data, and for protozoan pathogens, originally obtained from the international literature, were assumed constant throughout the years (changes in years of life lost therefore reflect changes in incidence on which mortality is based).
2.2 Model updates
The model was not changed since the 2013-update.
2.3 Disease burden
The method for DALY calculations was not changed compared to previous years.
2.4 Cost of illness
The method for cost-of-illness calculations were not changed compared to previous years (i.e. 2011 and onwards), only the cost prices used for the different resources had to be updated to 2015 euros using consumer price indexes as provided by Statistics Netherlands2. In order to allow comparison with earlier results we also updated the earlier cost-of-illness estimates (i.e., 2011- 2014) to 2015 euros; hence all differences in the results for the year 2015 compared to earlier years will reflect the impact of trends in the underlying information on demographics and pathogen incidence.
2
http://statline.cbs.nl/Statweb/publication/?DM=SLNL&PA=71311ned&D1=0&D2=0&D3=51,142,181,194,219,2 32,245,258,l&HDR=G1,T&STB=G2&VW=T, accessed December 6th, 2016
3
Results
3.1 Trend information
Trend information for specific pathogens is presented in Table 3. A summary of trends (in comparison with 2014) is discussed below:
• The incidence of campylobacteriosis (laboratory confirmed cases) decreased from 47.5 to 42.8 cases per 100,000 inhabitants, showing a continuously decreasing trend since 2011 (with an incidence of 51.3 per 100,000 population in 2011)
• The incidence of salmonellosis (laboratory confirmed cases) remained similar to 2014 with 9.0 per 100,000 inhabitants. The reported incidence rate for 2013-2015 were the lowest since 1999 (21.1 per 100,000).
• The incidence of gastroenteritis by rotavirus (laboratory confirmed cases) was with 20.4 per 100,000 inhabitants more than the double than in 2014 (9.5 per 100,000), but similar to the years 2013 and 2012 (23.3 and 20.1 per 100,000). • The incidence of acquired listeriosis (active surveillance)
decreased from 92 cases in 2014 to 72 cases in 2015, and was similar to earlier years. However, the recorded fatalities
increased markedly from 9 in 2014 to 15 in 2015. Similar or even higher fatalities were previously only reported for 2005 (15 cases) and for 2006 (17 cases).
• The incidence of perinatal listeriosis (active surveillance) was 3 cases with 1 fatalities. The number of perinatal cases and mortality were similar to previous years.
• The incidence of diseases caused by STEC O157 (active
surveillance) was 76 cases with 27 hospitalizations (of 68 cases for which this information is known). The number of STEC O157 cases, including the number of hospitalized cases, was similar to the previous two years, but higher than the years before. There were no fatal cases recorded. The incidence of HUS cases was with 3 in 2015, similar to 2014.
• The incidence of hepatitis A (notified cases) decreased compared to the previous three years; the incidence was the lowest among the recorded incidences for the years 2006-2015. The number of hospitalizations, was similar to 2014, with the proportion of hospitalized patients being 23%.
• The number of GE hospitalization was estimated to be 22,200 in 2015, and therefore slightly higher than in 2014 (20,345), but similar to earlier years. The observed increase in 2015 was mainly driven by the far higher number of rotavirus infections in 2015, compared to 2014. Note, opposite to earlier years, were the number of hospitalization estimated.
3.2 Disease incidence
The incidence of gastroenteritis by pathogen, of disease by non-gastrointestinal pathogens and of sequelae by pathogen in 2015 is presented in Tables 4-6, and Figure 1. Overall there were no marked increases in incidence compared to 2014, with one exception, namely rotavirus. The estimated total number of foodborne cases due to the 14
pathogens increased from 1,500,000 in 2014 to 1,620,000 in 2015, which was similar to 2013. The total number of deaths due to foodborne diseases increased from 215 in 2014 to 241 in 2015, but was similar to earlier years (i.e. 236 in 2013). The incidence of sequelae in 2015 (Table 6) was similar with previous years.
3.3 Disease burden by pathogen
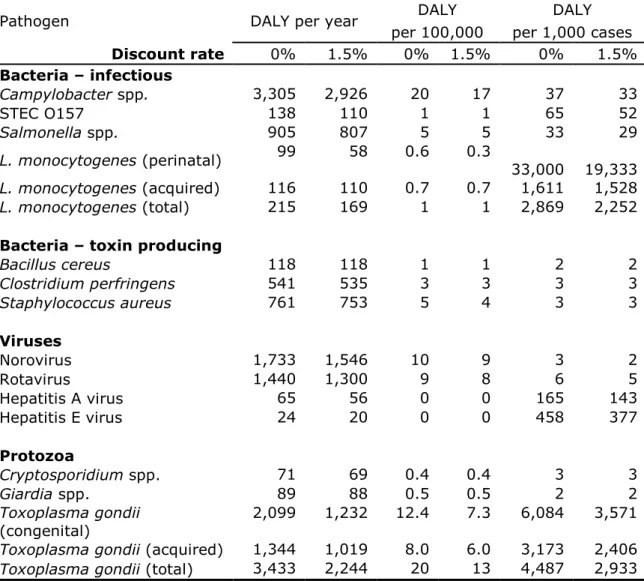
The burden by pathogen is presented in Table 7 and Figure 2. The total burden of the 14 pathogens increased by 200 DALY from 12,600 DALY in 2014 to 12,800 DALY in 2015, but was lower than in earlier years. Predominant changes compared to 2014 were for Campylobacter (-345 DALY) and rotavirus (+680 DALY). The largest burden at population level was caused by Toxoplasma gondii (3,400 DALY) and
Campylobacter (3,300 DALY), followed by norovirus (1,780 DALY). Perinatal listeriosis was the disease outcome with the highest individual burden among all pathogens (33 DALY per case), followed by congenital toxoplasmosis (6.1 DALY per case).
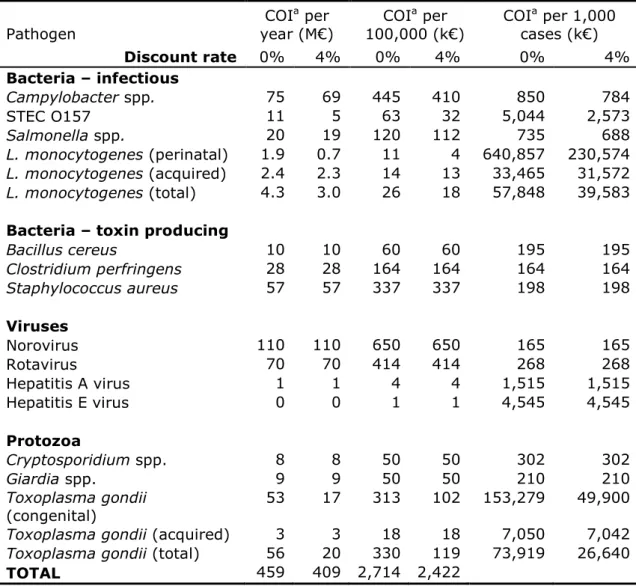
3.4 Cost of illness by pathogen
The total COI was 25 M€ higher in 2015 compared to 2014 and was estimated at 409 M€ (discounted at 4%) (Table 8 and Figure 3). The three pathogens causing the largest discounted COI are norovirus (110 M€), rotavirus (70 M€) and Campylobacter spp. (69 M€). The lowest contribution to the COI was by hepatitis E-virus (0.2 M€). The average cost per case were largest for perinatal Listeria (0.23 M€, discounted), followed by congenital Toxoplasma gondii infections (0.05 M€,
discounted). The trends in COI compared to 2014 followed the trends in DALYs.
3.5 Attribution
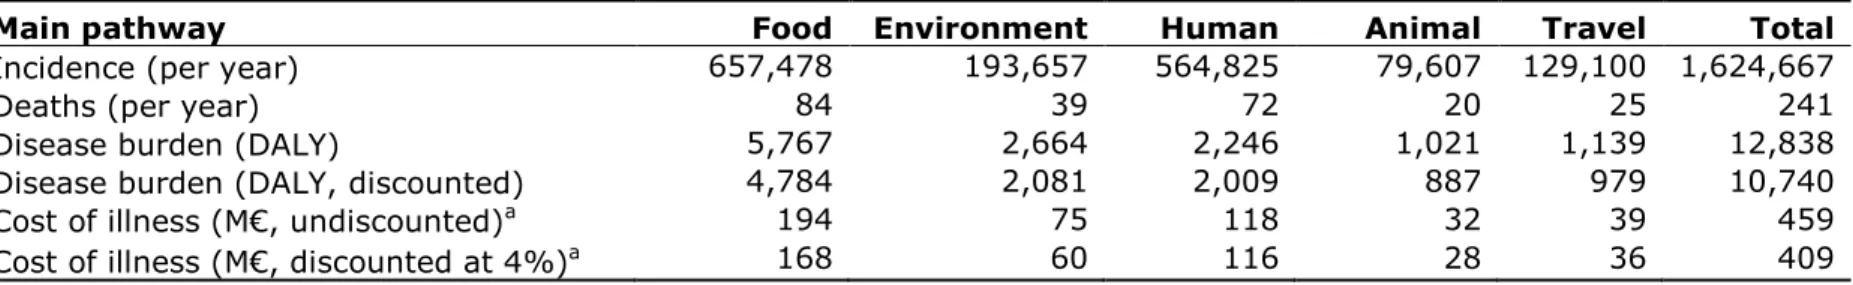
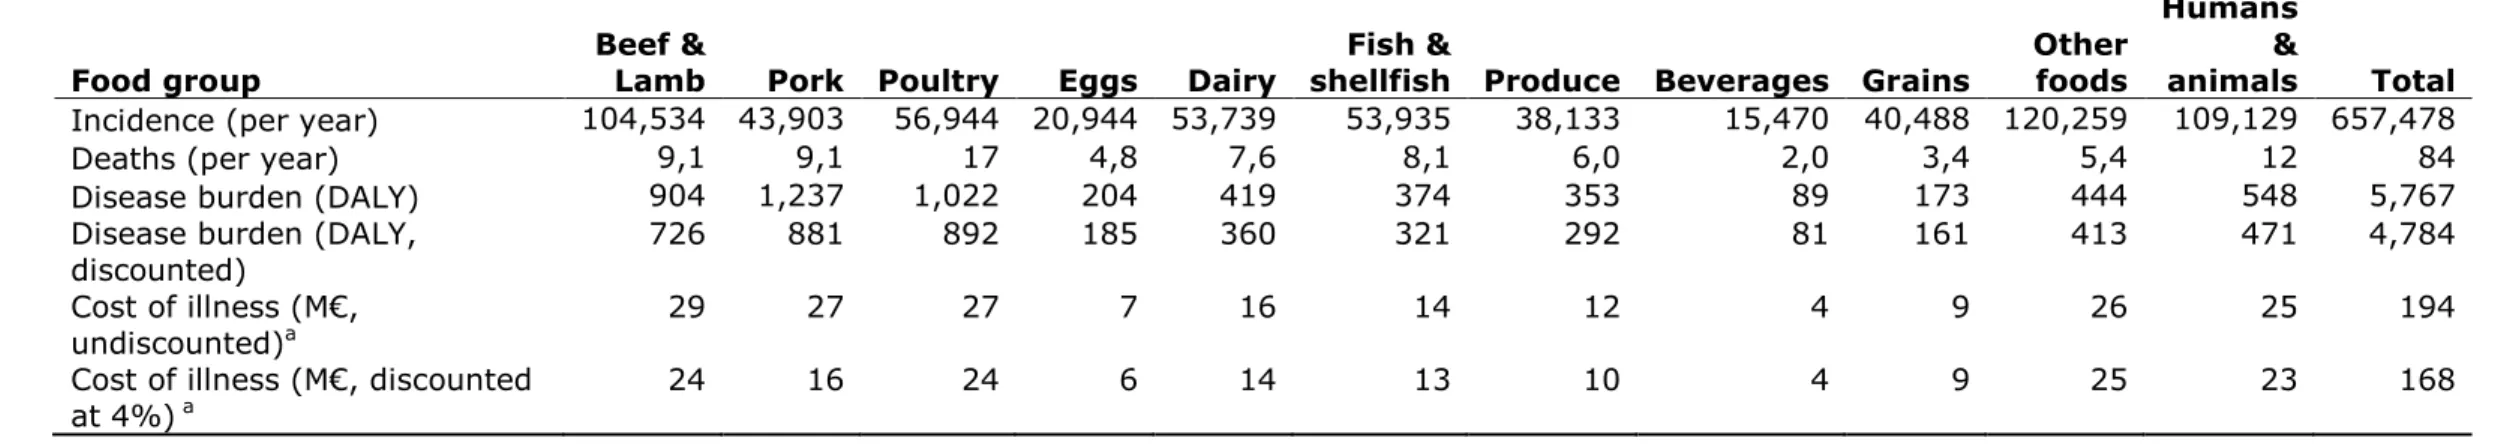
The attribution results for DALYs and COI are presented in Tables 9 and 10. The foodborne disease burden decreased by 100 DALY from 5,900 DALY in 2014 to approximately 5,800 DALY in 2015, and were similar to 2013 (5,800 DALY). Fifty-five percent of the foodborne burden was associated with meat (pork 26%, poultry 21% and beef & lamb 19%). These foods caused 31% of all food-related cases, indicating that the pathogens associated with these foods tend to cause more severe infections than pathogens associated with other foods.
The total food-related COI increased by 1% from 166 M€ to 168 M€. Approximately 38% of the COI was associated with meat and 50% with foods of animal origin.
4
Discussion
The estimated disease burden of 14 enteric pathogens in 2015 is higher by about 200 DALYs to 12,800 compared to 2014. But compared to earlier years, there is still a continuing decrease since 2012. The share of foodborne transmission in this burden decreased by 100 DALY from 5,900 to 5,800 DALY, and is similar with 2013. These estimates are the lowest since 2009, the first year in which the burden for all 14
pathogens was estimated. The overall COI estimates increased by 25 M€ to 409 (discounted at 4%) compared to 2014 (385 m€), and the
foodborne COI increased by approximately 2 M€ to 168 M€. The increase in costs was a result of higher incidences for predominantly rotavirus in 2015 compared to 2014. A range of hypotheses has been proposed to explain this unprecedented low rotavirus year in 2014, amongst them the very mild winter of 2014 and vaccination in neighboring countries, 2015, however, reached normal levels of
rotavirus infections as before, while the very mild winter of 2016 shows even lower levels of rotavirus infection than in 2014. These data will be shown in the next update of the burden estimates.
For several pathogens, no trend information is currently used, and changes in trend then reflect changes in the population structure that are however small from year to year. This statement holds for the toxin producers, hepatitis E virus and Toxoplasma gondii. Furthermore, trends for Cryptosporidium spp. and Giardia spp. are extrapolated from trends until 2007, when systematic surveillance was discontinued.
Furthermore, attribution data used in this report are based on an expert elicitation study, conducted in 2006 [8]. No time-trends in the expert estimates are available. As a consequence, the changes in incidence and burden as presented in this report for these pathogens need to be interpreted with appropriate restrictions and care.
In the past years several surveillance and registration systems have been started, have been changed or were available but not used, including for hepatitis E virus, norovirus and Cryptosporidium. In 2017, approaches to include trend updates for these pathogens will be
examined and applied if deemed feasible. Estimates for previous years will be recalculated where possible given the available data, to enable proper trend assessments.
References
1. Havelaar, A.H., et al., Disease burden of foodborne pathogens in the Netherlands, 2009. Int J Food Microbiol, 2012. 156(3): p. 231-8.
2. Bouwknegt, M., et al., Disease burden of food-related pathogens in the Netherlands, 2011. 2013, National Institute for Public Health and the Environment: Bilthoven, the Netherlands. RIVM Letter Report 330331006/2013. Available at:
http://www.rivm.nl/dsresource?objectid=85e2a05e-0d0c-4bec-b097-0aeaad5bce31&type=org&disposition=inline
3. Bouwknegt, M., et al., Disease burden of food-related pathogens in the Netherlands, 2012. 2014, National Institute for Public Health and the Environment: Bilthoven, the Netherlands. RIVM Letter report 2014-0069. Available at:
http://www.rivm.nl/dsresource?objectid=f4ef4518-344e-42f3-9908-27edc39b0898&type=org&disposition=inline
4. Bouwknegt, M., et al., Disease burden of food-related pathogens in the Netherlands, 2013. In press, National Institute for Public Health and the Environment: Bilthoven, the Netherlands. RIVM Letter report 2014-0115.
5. Bouwknegt, M., et al., Disease burden of food-related pathogens in the Netherlands, 2014. In press, National Institute for Public Health and the Environment: Bilthoven, the Netherlands. RIVM Letter report 2017-0061.
6. Havelaar, A.H., I.H.M. Friesema, and W. Van Pelt, Disease burden of food-related pathogens in the Netherlands, 2010. 2012,
National Institute for Public Health and the Environment:
Bilthoven, the Netherlands. RIVM Letter Report 330331004/2012. Available at: http://www.rivm.nl/dsresource?objectid=d8df8a89-4395-4fca-b3c2-7510de78a4a5&type=org&disposition=inline
7. Mangen, M.J., et al., Cost-of-illness and disease burden of food-related pathogens in the Netherlands, 2011. Int J Food Microbiol, 2015. 196: p. 84-93.
8. Havelaar, A.H., et al., Attribution of foodborne pathogens using structured expert elicitation. Foodborne Pathog Dis, 2008. 5(5): p. 649-59.
Table 1. Population in the Netherlands by age group, 2011-15 Age group 2015 2014 2013 2012 2011 0 174,681 170,953 175,587 179,653 184,007 1-4 713,641 726,716 736,615 739,083 739,099 5-11 1,324,894 1,338,448 1,354,657 1,378,914 1,394,007 12-17 1,215,977 1,206,685 1,196,634 1,189,120 1,184,970 18-64 10,463,848 10,467,463 10,491,737 10,527,210 10,558,770 65+ 3,007,685 2,919,024 2,824,345 2,716,368 2,594,946 Total 16,900,726 16,829,289 16,779,575 16,730,348 16,655,799
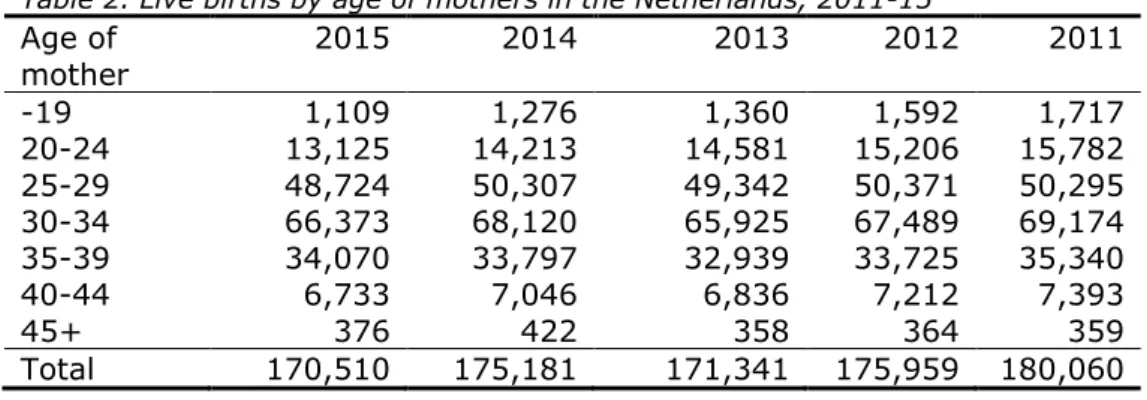
Table 2. Live births by age of mothers in the Netherlands, 2011-15
Age of mother 2015 2014 2013 2012 2011 -19 1,109 1,276 1,360 1,592 1,717 20-24 13,125 14,213 14,581 15,206 15,782 25-29 48,724 50,307 49,342 50,371 50,295 30-34 66,373 68,120 65,925 67,489 69,174 35-39 34,070 33,797 32,939 33,725 35,340 40-44 6,733 7,046 6,836 7,212 7,393 45+ 376 422 358 364 359 Total 170,510 175,181 171,341 175,959 180,060
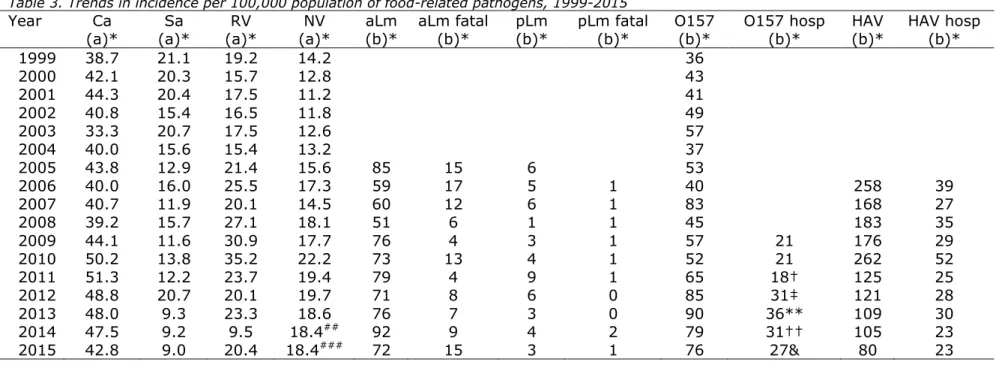
Table 3. Trends in incidence per 100,000 population of food-related pathogens, 1999-2015
Year Ca Sa RV NV aLm aLm fatal pLm pLm fatal O157 O157 hosp HAV HAV hosp
(a)* (a)* (a)* (a)* (b)* (b)* (b)* (b)* (b)* (b)* (b)* (b)*
1999 38.7 21.1 19.2 14.2 36 2000 42.1 20.3 15.7 12.8 43 2001 44.3 20.4 17.5 11.2 41 2002 40.8 15.4 16.5 11.8 49 2003 33.3 20.7 17.5 12.6 57 2004 40.0 15.6 15.4 13.2 37 2005 43.8 12.9 21.4 15.6 85 15 6 53 2006 40.0 16.0 25.5 17.3 59 17 5 1 40 258 39 2007 40.7 11.9 20.1 14.5 60 12 6 1 83 168 27 2008 39.2 15.7 27.1 18.1 51 6 1 1 45 183 35 2009 44.1 11.6 30.9 17.7 76 4 3 1 57 21 176 29 2010 50.2 13.8 35.2 22.2 73 13 4 1 52 21 262 52 2011 51.3 12.2 23.7 19.4 79 4 9 1 65 18† 125 25 2012 48.8 20.7 20.1 19.7 71 8 6 0 85 31‡ 121 28 2013 48.0 9.3 23.3 18.6 76 7 3 0 90 36** 109 30 2014 47.5 9.2 9.5 18.4## 92 9 4 2 79 31†† 105 23 2015 42.8 9.0 20.4 18.4### 72 15 3 1 76 27& 80 23 Used abbreviations:
Ca: Campylobacter spp.; Sa: Salmonella spp.; RV: rotavirus; NV: norovirus; aLm: acquired listeriosis; pLm: perinatal listeriosis; O157: STEC O157; HAV: hepatitis A-virus; hosp: hospitalized;
Notes:
*(a) per 100,000 inhabitants; (b) reported cases;
## based on ICD10 codes instead of ICD9 and not directly comparable to numbers from before 2012
### 2015 was estimated by multiplying the 2014 incidence by a correction factor. Correction factor represented the average trend for hospitalization and surveillance data.
†known for 57 of the 65 cases; ‡known for 77 of the 85 cases; **known for 84 of the 90 cases; †† known for 71 of the 79 cases; & known for 68 of the 76 cases;
Data sources:
Table 4. Mean incidence and 95% interval (between brackets) of gastroenteritis by pathogen in the Netherlands, 2015
Pathogen General population GP visit Hospitalised Fatal cases (x 1,000) (x 1,000) (x 1,000)
All causes 4,803 223 22 NA#
(3,983 - 5,713) (71 – 522) - Bacteria – infectious Campylobacter spp. (12 – 245) 88 (11 – 40) 22 (0.4 - 2.2) 1.1 (35-74) 54 STEC O157 2.1 0.2 0.02 1 (0.2 - 8.7) (0.01 - 0.9) - 0 - 3 Salmonella spp. 28 4.1 1.1 25 (2.2 – 83) (0.2 - 7.0) (0.4 - 2.2) (22 – 29)
Bacteria – toxin producing
Bacillus cereus 52 7.2 0.2 0 (17 – 122) (1.6 – 20) (0.07 - 0.5) - Clostridium perfringens (56 – 374) 169 (7.3 – 80) (0.01 - 0.6) 31 0.3 (0.1 - 20) 5 Staphylococcus aureus (124 – 546) 288 (11 – 96) 40 (0.6 - 2.8) 1.5 (0.1 – 29) 7 Viruses Norovirus 667 17 1.9 71 (488 - 1,025) (9.1 – 25) (1.0 – 3.3) (30 – 133) Rotavirus 261 16 5.4 42 (128 – 466) (10 – 24) (4.3 - 7.6) (14 – 94) Protozoa Cryptosporidium spp. (8.6 – 67) 28 (0.8 - 2.9) 1.7 (0.2 - 1.2) 0.6 (0.03 - 7.5) 2 Giardia spp. 41 3.7 0.5 1 (20 – 79) (1.9 - 6.5) (0.04 - 1.4) (0.03 - 4.2) * not available
Table 5. Mean incidence and 95% interval (between brackets) of non-gastrointestinal pathogens in the Netherlands, 2015
Pathogen Incidence Fatal cases
Listeria monocytogenes Perinatal 3 1 Acquired 72 15 Hepatitis A virus 391 1 (212 – 690) (0.7 – 2) Hepatitis E virus 53 1 (23 – 94) (0.2 – 1.3) Toxoplasma gondii Congenital 345 12 (177 – 606) (7 – 21) Acquired** 424 0 (197 – 717)
* No uncertainty because Listeria cases were acquired through active surveillance; ** chorioretinitis only
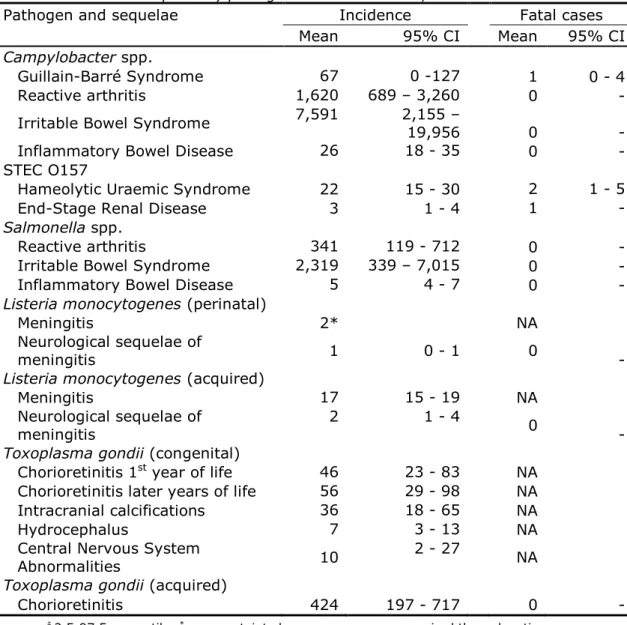
Table 6. Incidence of sequelae by pathogen in the Netherlands, 2015
Pathogen and sequelae Incidence Fatal cases
Mean 95% CI Mean 95% CI
Campylobacter spp.
Guillain-Barré Syndrome 67 0 -127 1 0 - 4
Reactive arthritis 1,620 689 – 3,260 0 -
Irritable Bowel Syndrome 7,591 2,155 – 19,956 0 -
Inflammatory Bowel Disease 26 18 - 35 0 -
STEC O157
Hameolytic Uraemic Syndrome 22 15 - 30 2 1 - 5
End-Stage Renal Disease 3 1 - 4 1 -
Salmonella spp.
Reactive arthritis 341 119 - 712 0 -
Irritable Bowel Syndrome 2,319 339 – 7,015 0 -
Inflammatory Bowel Disease 5 4 - 7 0 -
Listeria monocytogenes (perinatal)
Meningitis 2* NA
Neurological sequelae of
meningitis 1 0 - 1 0 -
Listeria monocytogenes (acquired)
Meningitis 17 15 - 19 NA
Neurological sequelae of
meningitis 2 1 - 4 0 -
Toxoplasma gondii (congenital)
Chorioretinitis 1st year of life 46
23 - 83 NA Chorioretinitis later years of life 56 29 - 98 NA Intracranial calcifications 36 18 - 65 NA
Hydrocephalus 7 3 - 13 NA
Central Nervous System
Abnormalities 10 2 - 27 NA
Toxoplasma gondii (acquired)
Chorioretinitis 424 197 - 717 0 -
† mean; ‡ 2.5-97.5 percentile; * no uncertainty because cases were acquired through active surveillance; NA: not applicable (fatal cases are reported in Table 2)
Table 7. Estimated total DALY, DALY per 100,000 inhabitants and mean DALY per case of illness in the Netherlands, 2015
Pathogen DALY per year DALY DALY
per 100,000 per 1,000 cases
Discount rate 0% 1.5% 0% 1.5% 0% 1.5% Bacteria – infectious Campylobacter spp. 3,305 2,926 20 17 37 33 STEC O157 138 110 1 1 65 52 Salmonella spp. 905 807 5 5 33 29 L. monocytogenes (perinatal) 99 58 0.6 0.3 33,000 19,333 L. monocytogenes (acquired) 116 110 0.7 0.7 1,611 1,528 L. monocytogenes (total) 215 169 1 1 2,869 2,252
Bacteria – toxin producing
Bacillus cereus 118 118 1 1 2 2 Clostridium perfringens 541 535 3 3 3 3 Staphylococcus aureus 761 753 5 4 3 3 Viruses Norovirus 1,733 1,546 10 9 3 2 Rotavirus 1,440 1,300 9 8 6 5 Hepatitis A virus 65 56 0 0 165 143 Hepatitis E virus 24 20 0 0 458 377 Protozoa Cryptosporidium spp. 71 69 0.4 0.4 3 3 Giardia spp. 89 88 0.5 0.5 2 2 Toxoplasma gondii (congenital) 2,099 1,232 12.4 7.3 6,084 3,571
Toxoplasma gondii (acquired) 1,344 1,019 8.0 6.0 3,173 2,406
Table 8. Estimated total costs of illness (COI), COI per 100,000 inhabitants and mean COI per case of illness in the Netherlands, 2015
Pathogen COI a per year (M€) COI a per 100,000 (k€) COI a per 1,000 cases (k€) Discount rate 0% 4% 0% 4% 0% 4% Bacteria – infectious Campylobacter spp. 75 69 445 410 850 784 STEC O157 11 5 63 32 5,044 2,573 Salmonella spp. 20 19 120 112 735 688 L. monocytogenes (perinatal) 1.9 0.7 11 4 640,857 230,574 L. monocytogenes (acquired) 2.4 2.3 14 13 33,465 31,572 L. monocytogenes (total) 4.3 3.0 26 18 57,848 39,583
Bacteria – toxin producing
Bacillus cereus 10 10 60 60 195 195 Clostridium perfringens 28 28 164 164 164 164 Staphylococcus aureus 57 57 337 337 198 198 Viruses Norovirus 110 110 650 650 165 165 Rotavirus 70 70 414 414 268 268 Hepatitis A virus 1 1 4 4 1,515 1,515 Hepatitis E virus 0 0 1 1 4,545 4,545 Protozoa Cryptosporidium spp. 8 8 50 50 302 302 Giardia spp. 9 9 50 50 210 210 Toxoplasma gondii (congenital) 53 17 313 102 153,279 49,900
Toxoplasma gondii (acquired) 3 3 18 18 7,050 7,042
Toxoplasma gondii (total) 56 20 330 119 73,919 26,640
TOTAL 459 409 2,714 2,422
Table 9. Attribution of the incidence, fatalities, disease burden and Cost-of-Illness* to the major transmission pathways in the Netherlands, 2015
Main pathway Food Environment Human Animal Travel Total
Incidence (per year) 657,478 193,657 564,825 79,607 129,100 1,624,667
Deaths (per year) 84 39 72 20 25 241
Disease burden (DALY) 5,767 2,664 2,246 1,021 1,139 12,838
Disease burden (DALY, discounted) 4,784 2,081 2,009 887 979 10,740
Cost of illness (M€, undiscounted)a 194 75 118 32 39 459
Cost of illness (M€, discounted at 4%)a 168 60 116 28 36 409
* due to the 14 pathogens included in this study a costs are expressed in 2015 euros
Table 10. Attribution of the incidence, fatalities, disease burden and Cost-of-Illness of foodborne disease* to food groups in the Netherlands, 2015
Food group Beef & Lamb Pork Poultry Eggs Dairy shellfish Produce Beverages Grains Fish & Other foods
Humans &
animals Total
Incidence (per year) 104,534 43,903 56,944 20,944 53,739 53,935 38,133 15,470 40,488 120,259 109,129 657,478
Deaths (per year) 9,1 9,1 17 4,8 7,6 8,1 6,0 2,0 3,4 5,4 12 84
Disease burden (DALY) 904 1,237 1,022 204 419 374 353 89 173 444 548 5,767
Disease burden (DALY,
discounted) 726 881 892 185 360 321 292 81 161 413 471 4,784
Cost of illness (M€,
undiscounted)a 29 27 27 7 16 14 12 4 9 26 25 194
Cost of illness (M€, discounted
at 4%) a 24 16 24 6 14 13 10 4 9 25 23 168
* due to the 14 pathogens included in this study a costs are expressed in 2015 euros
Figure 1. Comparison of incidence of food-related pathogens in 2009 through 2015.
Figure 2. Comparison of disease burden of food-related pathogens in 2009 through 2015. DALYs are undiscount
Figure 3. Comparison of discounted cost-of-illnessa (in million €) of food-related pathogens in 2011 through 2015. Costs are discounted with 4%.
Annex: Detailed results
Summary of resultsPathogen Incidence (per year) Deaths (per year) Disease burden (DALY) Costs (M€ per jaar) Disc, 0% Disc, 4% Campylobacter 88,437 54 3,305 75 69 STEC O157 2,119 4 138 11 5 L, monocytogenes 75 16 215 4 3 Salmonella 27,628 25 905 20 19 B. cereus toxine 51,884 0 118 10 10 C. perfringens toxine 168,959 5 541 28 28 S, aureus toxine 287,698 7 761 57 57 Hepatitis-A virus 393 1 65 1 1 Hepatitis-E virus 53 1 24 0 0 Norovirus 667,219 71 1,733 110 110 Rotavirus 261,024 42 1,440 70 70 C. parvum 27,806 2 71 8 8 G. lamblia 40,608 1 89 9 9 T. gondii 765 12 3,433 56 20 Total 1,624,667 241 12,838 459 409
Attribution of incidence by pathogen to main pathways
Pathogen Food Environment Human Animal Travel Total
Campylobacter 37,143 18,218 5,572 16,891 10,612 88,437 STEC O157 856 365 216 434 248 2,119 L. monocytogenes 52 5 4 4 10 75 Salmonella 15,057 3,564 2,569 2,542 3,896 27,628 B. cereus toxine 46,332 571 623 571 3,788 51,884 C. perfringens toxine 152,739 3,717 3,548 3,548 5,407 168,959 S. aureus toxine 250,872 10,357 9,206 6,329 10,933 287,698 Hepatitis-A virus 45 44 72 0 233 393 Hepatitis-E virus 7 13 4 6 23 53 Norovirus 111,426 94,745 369,639 33,361 58,048 667,219 Rotavirus 33,933 44,374 151,655 7,831 23,231 261,024 C. parvum 3,309 7,702 7,619 3,726 5,450 27,806 G. lamblia 5,279 9,705 14,091 4,345 7,188 40,608 T. gondii 427 277 7 19 35 765 Total 657,478 193,657 564,825 79,607 129,100 1,624,667
Attribution of deaths by pathogen to main pathways
Pathogen Food Environment Human Animal Travel Total
Campylobacter 22.9 11.2 3.4 10.4 6.5 54.5 STEC O157 1.6 0.7 0.4 0.8 0.5 4.0 L. monocytogenes 11.1 1.1 0.8 0.9 2.1 16.0 Salmonella 13.8 3.3 2.3 2.3 3.6 25.2 B. cereus toxine 0.0 0.0 0.0 0.0 0.0 0.0 C. perfringens toxine 4.2 0.1 0.1 0.1 0.1 4.6 S. aureus toxine 6.3 0.3 0.2 0.2 0.3 7.2 Hepatitis-A virus 0.1 0.1 0.2 0.0 0.7 1.2 Hepatitis-E virus 0.1 0.2 0.0 0.1 0.3 0.6 Norovirus 11.8 10.0 39.1 3.5 6.1 70.5 Rotavirus 5.4 7.2 24.7 1.3 3.8 42.4 C. parvum 0.3 0.5 0.5 0.2 0.3 1.7 G. lamblia 0.2 0.3 0.4 0.1 0.2 1.2 T. gondii 6.8 4.4 0.1 0.3 0.6 12.1 Total 84.4 39.3 72.4 20.2 25.1 241.4
Attribution of disease burden (DALY per year, undiscounted) to main pathways
Pathogen Food Environment Human Animal Travel Total
Campylobacter 1,388 681 208 631 397 3,305 STEC O157 56 24 14 28 16 138 L. monocytogenes 149 14 11 12 29 215 Salmonella 493 117 84 83 128 905 B. cereus toxine 105 1 1 1 9 118 C. perfringens toxine 489 12 11 11 17 541 S. aureus toxine 664 27 24 17 29 761 Hepatitis-A virus 7 7 12 0 38 65 Hepatitis-E virus 3 6 2 3 10 24 Norovirus 289 246 960 87 151 1,733 Rotavirus 187 245 837 43 128 1,440 C. parvum 8 20 19 10 14 71 G. lamblia 12 21 31 10 16 89 T. gondii 1,916 1,243 31 86 158 3,433 Total 5,767 2,664 2,246 1,021 1,139 12,838
Attribution of cost-of-illness (M€ per year, discounted at 4% and expressed in 2015 euros) to main pathways
Pathogen Food Environment Human Animal Travel Total
Campylobacter 29.1 14.3 4.4 13.2 8.3 69.4 STEC O157 2.2 0.9 0.6 1.1 0.6 5.5 L. monocytogenes 2.1 0.2 0.2 0.2 0.4 3.0 Salmonella 10.4 2.5 1.8 1.7 2.7 19.0 B. cereus toxine 9.1 0.1 0.1 0.1 0.7 10.1 C. perfringens toxine 25.0 0.6 0.6 0.6 0.9 27.6 S. aureus toxine 49.7 2.1 1.8 1.3 2.2 57.0 Hepatitis-A virus 0.1 0.1 0.1 0.0 0.4 0.6 Hepatitis-E virus 0.03 0.1 0.02 0.03 0.1 0.2 Norovirus 18.3 15.6 60.9 5.5 9.6 109.9 Rotavirus 9.1 11.9 40.7 2.1 6.2 70.0 C. parvum 1.0 2.3 2.3 1.1 1.6 8.4 G. lamblia 1.1 2.0 3.0 0.9 1.5 8.5 T. gondii 11.2 7.3 0.2 0.5 0.9 20.2 Total 168.4 59.9 116.5 28.4 36.1 409.3
Attribution of incidence by pathogen to food groups
Pathogen Beef & Lamb Pork Poultry Eggs Dairy shellfish Fish & Produce Beverages Grains Other foods Humans & animals Total Campylobacter 1,523 1,894 20,020 1,151 3,306 2,600 1,969 631 854 1,226 1,969 37,143 STEC O157 378 55 27 18 63 25 61 31 25 30 145 856 L. monocytogenes 6 5 3 2 13 9 4 1 3 3 3 52 Salmonella 1,897 2,153 2,228 3,343 994 617 949 467 647 903 858 15,057 B. cereus toxine 3,336 1,622 741 1,668 2,687 927 927 788 7,830 24,695 1,112 46,332 C. perfringens toxine 73,009 12,830 10,844 4,277 6,262 9,928 10,539 3,818 3,971 11,761 5,499 152,739 S. aureus toxine 18,815 20,321 19,568 8,279 36,878 14,551 5,017 4,516 18,815 74,258 29,854 250,872 Hepatitis-A virus 0 0 0 0 0 6 6 2 2 1 28 45 Hepatitis-E virus 0 5 0 0 0 0 1 0 0 0 1 7 Norovirus 3,566 3,454 3,231 2,117 2,229 17,271 8,134 3,454 5,794 5,571 56,604 111,426 Rotavirus 0 950 0 0 577 6,583 8,076 1,493 2,545 1,527 12,182 33,933 C. parvum 867 146 96 89 304 721 685 99 0 99 202 3,309 G. lamblia 1,040 253 164 0 406 681 1,742 169 0 174 649 5,279 T. gondii 98 214 20 0 20 16 25 0 0 10 24 427 Total 104,534 43,903 56,944 20,944 53,739 53,935 38,133 15,470 40,488 120,259 109,129 657,478
Attribution of deaths by pathogen to food groups
Pathogen Beef & Lamb Pork Poultry Eggs Dairy shellfish Fish & Produce Beverages Grains Other foods Humans & animals Total Campylobacter 0.9 1.2 12.3 0.7 2.0 1.6 1.2 0.4 0.5 0.8 1.2 22.9 STEC O157 0.7 0.1 0.1 0.0 0.1 0.0 0.1 0.1 0.0 0.1 0.3 1.6 L. monocytogenes 1.2 1.0 0.7 0.4 2.7 2.0 0.8 0.3 0.7 0.6 0.5 11.1 Salmonella 1.7 2.0 2.0 3.1 0.9 0.6 0.9 0.4 0.6 0.8 0.8 13.8 B. cereus toxine 0.0 0.0 0.0 0.0 0.0 0.0 0.0 0.0 0.0 0.0 0.0 0.0 C. perfringens toxine 2.0 0.4 0.3 0.1 0.2 0.3 0.3 0.1 0.1 0.3 0.2 4.2 S. aureus toxine 0.5 0.5 0.5 0.2 0.9 0.4 0.1 0.1 0.5 1.9 0.7 6.3 Hepatitis-A virus 0.0 0.0 0.0 0.0 0.0 0.0 0.0 0.0 0.0 0.0 0.1 0.1 Hepatitis-E virus 0.0 0.1 0.0 0.0 0.0 0.0 0.0 0.0 0.0 0.0 0.0 0.1 Norovirus 0.4 0.4 0.3 0.2 0.2 1.8 0.9 0.4 0.6 0.6 6.0 11.8 Rotavirus 0.0 0.2 0.0 0.0 0.1 1.1 1.2 0.2 0.4 0.2 2.0 5.4 C. parvum 0.1 0.0 0.1 0.0 0.0 0.0 0.0 0.0 0.0 0.0 0.0 0.3 G. lamblia 0.0 0.0 0.0 0.0 0.0 0.0 0.0 0.0 0.0 0.0 0.0 0.2 T. gondii 1.5 3.4 0.3 0.0 0.3 0.3 0.4 0.0 0.0 0.2 0.4 6.8 Total 9.1 9.1 16.7 4.8 7.6 8.1 6.0 2.0 3.4 5.4 12.2 84.4
Attribution of disease burden (DALY per year, undiscounted) to food groups
Pathogen Beef & Lamb Pork Poultry Eggs Dairy shellfish Fish & Produce Beverages Grains Other foods Humans & animals Total Campylobacter 56.9 70.8 748.1 43.0 123.5 97.2 73.6 23.6 31.9 45.8 73.6 1.388.1 STEC O157 24.6 3.6 1.7 1.2 4.1 1.6 4.0 2.0 1.6 2.0 9.4 55.9 L. monocytogenes 16.7 13.8 9.8 5.7 36.8 26.5 11.3 3.9 8.8 8.3 7.3 148.9 Salmonella 62.1 70.5 73.0 109.5 32.5 20.2 31.1 15.3 21.2 29.6 28.1 493.1 B. cereus toxine 7.6 3.7 1.7 3.8 6.1 2.1 2.1 1.8 17.8 56.2 2.5 105.4 C. perfringens toxine 233.6 41.1 34.7 13.7 20.0 31.8 33.7 12.2 12.7 37.6 17.6 488.8 S. aureus toxine 49.8 53.7 51.8 21.9 97.5 38.5 13.3 11.9 49.8 196.4 79.0 663.6 Hepatitis-A virus 0.0 0.0 0.0 0.0 0.0 0.9 0.9 0.3 0.3 0.2 4.6 7.4 Hepatitis-E virus 0.0 2.5 0.0 0.0 0.0 0.2 0.2 0.1 0.0 0.0 0.3 3.3 Norovirus 9.3 9.0 8.4 5.5 5.8 44.8 21.1 9.0 15.0 14.5 147.0 289.3 Rotavirus 0.0 5.2 0.0 0.0 3.2 36.3 44.6 8.2 14.0 8.4 67.2 187.3 C. parvum 2.2 0.4 0.2 0.2 0.8 1.8 1.8 0.3 0.0 0.3 0.5 8.5 G. lamblia 2.3 0.6 0.4 0.0 0.9 1.5 3.8 0.4 0.0 0.4 1.4 11.5 T. gondii 438.7 961.7 92.0 0.0 88.1 70.9 111.1 0.0 0.0 44.1 109.2 1.915.7 Total 903.8 1.236.5 1.021.8 204.4 419.4 374.3 352.6 89.0 173.2 443.7 547.8 5.766.7
Attribution of cost-of-illness (M€ per year, discounted at 4% and expressed in 2015 euros) to food groups
Pathogen Beef & Lamb Pork Poultry Eggs Dairy shellfish Fish & Produce Beverages Grains Other foods Humans & animals Total Campylobacter 1.2 1.5 15.7 0.9 2.6 2.0 1.5 0.5 0.7 1.0 1.5 29.1 STEC O157 1.0 0.1 0.1 0.0 0.2 0.1 0.2 0.1 0.1 0.1 0.4 2.2 L. monocytogenes 0.2 0.2 0.1 0.1 0.5 0.4 0.2 0.1 0.1 0.1 0.1 2.1 Salmonella 1.3 1.5 1.5 2.3 0.7 0.4 0.7 0.3 0.4 0.6 0.6 10.4 B. cereus toxine 0.7 0.3 0.1 0.3 0.5 0.2 0.2 0.2 1.5 4.8 0.2 9.1 C. perfringens toxine 11.9 2.1 1.8 0.7 1.0 1.6 1.7 0.6 0.6 1.9 0.9 25.0 S. aureus toxine 3.7 4.0 3.9 1.6 7.3 2.9 1.0 0.9 3.7 14.7 5.9 49.7 Hepatitis-A virus 0.0 0.0 0.0 0.0 0.0 0.0 0.0 0.0 0.0 0.0 0.0 0.1 Hepatitis-E virus 0.0 0.0 0.0 0.0 0.0 0.0 0.0 0.0 0.0 0.0 0.0 0.0 Norovirus 0.6 0.6 0.5 0.3 0.4 2.8 1.3 0.6 1.0 0.9 9.3 18.3 Rotavirus 0.0 0.3 0.0 0.0 0.2 1.8 2.2 0.4 0.7 0.4 3.3 9.1 C. parvum 0.3 0.0 0.0 0.0 0.1 0.2 0.2 0.0 0.0 0.0 0.1 1.0 G. lamblia 0.2 0.1 0.0 0.0 0.1 0.1 0.4 0.0 0.0 0.0 0.1 1.1 T. gondii 2.6 5.6 0.5 0.0 0.5 0.4 0.7 0.0 0.0 0.3 0.6 11.2 Total 23.7 16.3 24.4 6.4 14.0 13.0 10.1 3.7 8.8 24.9 23.1 168.4
Attribution of disease burden (DALY per year, undiscounted) to food in the Netherlands from 2012 to 2015
Pathogen Disease burden (DALY) per year - undiscounted 2012 2013 2014 2015 Toxoplasma gondii 1950 1930 1950 1920 Campylobacter spp. 1560 1430 1530 1390 Salmonella spp. 1350 600 500 490 S. aureus toxine 670 670 670 660 C. perfringens toxine 490 490 490 490 Norovirus 300 280 280 290 Rotavirus 185 210 100 190 B. cereus toxine 100 100 100 100 Listeria monocytogenes 90 60 180 150 STEC O157 57 60 60 60 Giardia spp. 14 13 13 12 Hepatitis-A virus 9 8 10 7 Cryptosporidium spp. 8 8 8 8 Hepatitis-E virus 2 2 3 3 Totaal 6780 5850 5890 5770