Quick scan and Prioritization of
Microplastic Sources and Emissions
RIVM Letter report 2014-0156 A. Verschoor et al.
Page 2 of 44
Colophon
© RIVM 2014
Extracts from this publication may be reproduced if cited as follows: ‘National Institute for Public Health and the Environment (RIVM), title of publication and year of publication’.
This is a publication of:
National Institute for Public Health and the Environment
P.O. Box 1│3720 BA Bilthoven The Netherlands
www.rivm.nl/en Authors:
Anja Verschoor, RIVM Leon de Poorter, RIVM Erwin Roex, Deltares
Bert Bellert, Rijkswaterstaat (Directorate-General for Public Works and Water Management, RWS) / Department for Water, Traffic and the Environment
Contact: Anja Verschoor
Centre for Safety of Substances and Products anja.verschoor@rivm.nl
Internal RIVM reviewers: Willie Peijnenburg, Joke Herremans, Charles Bodar
This study was commissioned by the Ministry of Infrastructure and the Environment as part of project M/250012 Microplastics.
Synopsis
This report presents an inventory of land-borne sources of microplastics that may end up in sea. Microplastics are particles smaller than 5 mm and may enter the food chain. Sources can be products, production process or routes along which they are transported via rivers to the sea. Subsequently these sources are prioritized. Based on the prioritization policy plans can be developed to reduce the amount of microplastics in the environment. More research is required to underpin and specify measures.
Five criteria were used for the prioritization: volume of the emission, essentiality of the source, possibility of quick win measures, social perception and presence of alternatives for the consumer.
High priority was assigned to sources of secondary microplastics, i.e.
microplastics that result from fragmentation of larger plastics. Plastic debris, which consists largely of packaging materials and disposable products is the most important source of microplastics (score 8-9 on a scale from 1-10). Other secondary microplastic sources with a relatively high score (score 6-7) are fibres and clothing, roadway runoff (including tire dust), dust from construction places, agricultural plastic and input from abroad via the rivers Rhine, Meuse and Scheldt. Also waste water, sewage sludge and compost received a relatively high score (score 6), because they contain primary as well as secondary microplastics from a variety of sources with emissions to the sewer system, such as
households that emit fibres through the washing machine and microbeads used for personal care and cosmetic purposes.
For the primary microplastics, which are intentionally added to products for specific functions, the highest priorities were assigned to cosmetics and
pigments and paints (score 7), followed by abrasive cleaning agents (score 6). A complete socio-economic analysis could not be performed on short notice because of limited availability of data. Moreover, the impacts of microplastic exposure for man and environment are not clear. The priorities were assigned based on the Dutch situation by expert judgement offered by representatives of RIVM, Deltares, Rijkswaterstaat and the Dutch Pollutant Release and Transfer Register.
Publiekssamenvatting
Deze verkennende inventarisatie beschrijft via welke bronnen op het land microplastics in zee terechtkomen. Microplastics zijn kleiner dan 5 millimeter en kunnen in de voedselketen terechtkomen. De bronnen kunnen producten zijn, productieprocessen of routes waarlangs ze via de rivieren de zee bereiken. Vervolgens is aan elk van die bronnen een prioriteit toegekend. Op basis daarvan kunnen beleidsmaatregelen worden genomen om de hoeveelheid microplastics in het milieu terug te dringen. Aanvullend onderzoek is nodig om maatregelen verder in te vullen.
Voor de prioritering zijn vijf criteria gebruikt: omvang van de emissie, (on)misbaarheid van de bron, mogelijkheden voor ‘quick win’-maatregelen, maatschappelijke beeldvorming, en de aanwezigheid van alternatieven voor de consument.
Hoge prioriteit wordt toegekend aan bronnen van secundaire microplastics; dit zijn microplastics die ontstaan als grotere plastics in kleinere fragmenten uiteenvallen. Zwerfvuil, voornamelijk verpakkingen en wegwerpartikelen, is de belangrijkste bron van microplastic (score 8-9 op een schaal van 10). Andere secundaire microplastic bronnen die relatief hoog scoren (score 6-7) zijn vezels en kleding, de afspoeling van straatvuil (waaronder bandenslijtage),
stofemissies van bouwplaatsen, landbouwplastics en de aanvoer van microplastics door rivieren uit het buitenland. Verder scoren afvalwater, zuiveringsslib en compost relatief hoog (score 6). Deze bevatten microplastics van diverse bronnen die in het riool terechtkomen, bijvoorbeeld kledingvezels die tijdens het wassen vrijkomen en kleine scrubdeeltjes uit cosmetica. Primaire microplastics zijn plastic deeltjes die doelbewust toegevoegd worden aan producten vanwege hun specifieke functie. Van deze bronnen scoren cosmetica en verf- en kleurstoffen hoog (score 7), gevolgd door schurende reinigingsmiddelen (score 6).
Er was onvoldoende informatie beschikbaar om binnen de tijdspanne van dit onderzoek een volledige kosten-baten-analyse uit te voeren. Ook is niet bekend in hoeverre microplastics schadelijk zijn voor mens en milieu. De prioritering is uitgevoerd door een expertgroep met vertegenwoordigers van RIVM, Deltares, Rijkswaterstaat en de Emissieregistratie.
Contents
Executive summary − 9 1 Introduction − 11
2 Definition of microplastics − 13
3 Inventory of microplastic emissions − 15
3.1 Approach − 15
3.2 Contamination routes of plastics and microplastics − 15 3.3 Sectors and products − 18
4 Priorities by means of multicriteria analysis − 21
4.1 Approach − 21
4.2 Assignment of scores − 21 4.3 Weighting of criteria − 23
5 Results − 25
5.1 Overview of priority list − 25 5.2 Explanation of scores − 27
6 Conclusions and recommendations − 37 References − 39
Executive summary
This report presents an inventory and prioritization of land-borne sources of microplastics to support the development of effective and efficient action plans by the government. The plastics under consideration are limited to solid,
polymeric materials of petrochemical origin. This report includes primary as well as secondary microplastics.
For a systematic inventory of microplastic sources, the Dutch National Emission Register was used as a template. Sources were further supplemented with literature data and results of a previous expert-meeting.
A multicriteria analysis (MCA) was performed in order to assign a priority for microplastic sources. The MCA included relevance (volume of emission), feasibility of measures (alternatives, quick win) and perceived urgency (media attention, options for consumers choice or action perspective). A complete social-economic analysis was not possible within the available time-frame, because the required quantitative information is often absent, incomplete, inconsistent and/or scattered. Therefore a group of experts representing the National Institute for Public Health and the Environment (RIVM), Rijkswaterstaat and Deltares assigned qualitative scores to the criteria that reflect the volume, extent or likelihood of the criteria based on the Dutch situation. A rationale for the scores is included in the report. The scores were combined to a total score, which determines the priority.
The largest source of plastic and secondary microplastic emissions is plastic debris, which consists largely of packaging materials and disposable products. This was confirmed by the high scores in this report (8-9 on a scale of 1-10). Other sources of secondary microplastics with a relatively high score (6-7) were fibres and textiles, roadway runoff (including tire dust), dust from construction places, agricultural plastic and input from abroad via the rivers Rhine, Meuse and Scheldt. Waste water, sewage sludge and compost (score 6) contain primary as well as secondary microplastics, from sources with emissions to the sewer system, such as households that emit fibres through the washing machine and microbeads used for personal care and cosmetic purposes. The emission of microplastics from toys and party accessories (for example balloons) was also estimated to be relatively high, but because of the absence of alternatives, the low risk perception and the high action perspectives of consumers, it received a lower priority (score 4).
For the primary microplastics, the highest priorities were assigned to cosmetics and pigments and paints, followed by microbeads used for polishing or cleaning of specific surfaces or equipment. Because, quantitative information about microplastics use in these products is missing, these product groups are
recommended for a follow-up study. Based on the results of the follow-up study, the priorities for emission reduction measures may change.
The volume of microplastic emission is an essential criterion for prioritization, but a sound quantification was not possible due to poor availability of data. Also the estimation of technical possibilities for emission reduction and alternatives of microplastics has an exploratory nature. This study provides a prioritization that supports decisions about the continuation of a number of current policy
measures and the eventual introduction of additional measures. Refinement and corroboration of technical details are necessary to implement actual introduction of new measures. It is recommended to start follow-up studies, which contain more process- or industry-specific information and monitoring data for microplastic sources which received a high priority.
1
Introduction
The objective of this report is to compile a list of potential land-borne sources of microplastics and prioritize them in order to support the Dutch government in establishing an effective and efficient programme of emission-reduction measures.
Nowadays, plastic has penetrated virtually every single aspect of everyday life: from clothing to electronics and from building materials to cleaning products. The development of plastic has skyrocketed since the 1950s. Global plastic production in 2012 reached 288 million tonnes1 and continues to increase by roughly 3% every year. Plastic is cheap, durable (little to no decomposition), is chemically inert (rarely reacts with other substances) and is relatively
lightweight and malleable, resulting in a practically unlimited number of possible applications [1].
However, the disadvantages of plastics are gradually becoming apparent [2]. Large quantities of plastic pollute the oceans, seas and rivers, and back on dry land, plastic litter is an everyday sight in our towns and cities [3-5]. There are grave concerns about the consequences of plastic for sea life such as fish, sea birds, seals and turtles. The most common problems of plastic for animals are obstruction (resulting in starvation), injury or suffocation [6-9]. These effects play out at the individual level.
The effects of smaller plastic particles are less clear, although they could well have far-reaching consequences. Smaller particles may be absorbed by the tissue of aquatic organisms such as mussels and fish, resulting in the plastics entering the food chain [10]. Via these plastic particles, animals can also be exposed to other agents added to the plastics such as plasticizers, which can cause hormone disruption [11]. Furthermore, many waterborne contaminants have a tendency to adhere to plastics [12]. A number of studies indicate that exposure to these contaminants is enhanced due to intake via plastics [13-15], although there are also claims that contradict this [11].
In order to distinguish the effects of small plastic particles, that are practically invisible to the naked eye, from the effects of larger plastic waste, the Marine Strategy Framework Directive2008/56/EC (MSFD) pays special attention to these microplastics (plastic particles smaller than 5mm). In addition to plastic waste, microplastics have been included as one of the indicators for assessment of the quality of the marine ecosystem. According to the MSFD, member states must develop monitoring methods in order to follow trends in the occurrence of microplastics. Furthermore, research must be conducted to the sources of microplastics and to measures that can reduce the quantity of microplastics [16].
Although the full impact of microplastics on humans and the environment is not yet known, the persistence of plastics is beyond dispute. For this reason, the reduction of plastic waste is one of the key issues of both Dutch and European environmental policy [17, 18].
Every year, an estimated 8-16 million tonnes of plastic waste finds its way into the seas and oceans [19]. It is estimated that approximately 80% of this
Page 12 of 44
quantity comes from land-borne sources. The Ministry of Infrastructure and the Environment asked RIVM (the National Institute for Public Health and the Environment) to create a list of potential and land-borne microplastics sources and to prioritize them based on size, feasibility of emission-reduction measures and urgency. Microplastics from land-borne sources generally enter the sea via rivers. Sources that discharge plastics directly into the sea (shipping, fishing, oil rigs, beach litter) are not classified as land-borne sources. These sources have already been addressed within other frameworks and are therefore not taken into consideration in this report.
Literature, expert judgement and sources from the Pollutant Release and Transfer Register were used to compile a list of land-borne sources.
Environmental issues, technical issues and social issues were used as the basis for determining the priorities of the sources. Quantitative information about emissions and costs of measures are currently unavailable. Because an advice was requested on short notice and the only quantitative information available was limited and fragmented, we made use of expert judgement to estimate the significance of each criterion and assigned semi-quantitative categories: small, moderate or large. The approach takes into account the degree of uncertainty and must therefore be viewed as a preliminary ranking of priorities. If desired, the priority list can be refined by measuring microplastic emissions or by obtaining information from the business sector about contamination routes, scale of the emissions and technical possibilities for emission reduction.
2
Definition of microplastics
There are many different interpretations of plastic. The word plastic reflects its malleable characteristics. Plastic materials range from soft and malleable to extremely hard. The UNEP defines plastics as synthetic materials of
petrochemical origin [20]. Plastics are created from polymers, sometimes supplemented with copolymers and/or additives, and in general have poor water solubility and biodegradability.
This report only focuses on plastics of petrochemical origin. There are also plastics of animal, vegetable or mineral origin (such as cellulose, rubber, paraffin and silicone), whose malleable qualities, poor water solubility and limited
reactivity mean that they can also be regarded as plastics.
In many ways, the qualities of bioplastics and silicone are comparable to other plastics. As a result, these substances provide an alternative for plastics of petrochemical origin and are appealing as they are synthesised from renewable materials. However, these particles of bioplastics or silicone are not necessarily less harmful to the aquatic environment.
Building blocks of polymers released by the cracking of crude oil include ethene, propene and butene. A wide range of raw materials can be used for plastic products. Polyethylene (PE), polypropylene (PP) and polyvinylchloride (PVC) account for nearly 60% of all plastics used in Europe [1]. Other well-known plastics include polyethylene terephthalate (PET), polystyrene (PS),
polyurethane (PUR), polytetrafluoroethylene (PTFE/Teflon®) and acrylonitrile butadiene styrene (ABS). These polymers, which are made up of alkenes, are often referred to by the collective noun polyolefins. Most polymers are available in different varieties. The length of the polymers and the degree of branching determines whether the plastic is soft or hard.
Rubber is a natural resource, and can therefore be classified as a bioplastic. However, there are also many different types of synthetic rubber derived from petrochemicals. A well-known example is styrene-1.3-butadene rubber (SBR) found in car tyres and recycled products made from tyre rubber. Every year, an estimated quantity of 17 kilotonnes of tyre-wear is released into the
environment [21]. Other frequently used synthetic rubbers include ethylene propylene diene monomer (EPDM), nitrile butadiene rubber (NBR) and neoprene. The definition of microplastics used here is displayed in Text box 1. The
definition of the size of microplastics is a subject of discussion. The most widely adopted definition considers all plastic particles smaller than 5mm to be
microplastics. [22]. However, some researchers draw the line at 1mm [23, 24]. A proposal from the International Union of Applied and Pure Chemistry aiming at international standardisation, defines microplastics as particles between 0.1 and 100 µm [25]. As detailed information about particle sizes in products is often not provided by businesses, we conform to the broadest description of microplastics, i.e. all plastic particles under 5mm are classified as microplastics. For specific measures, it may be necessary to give a more precise definition of the size, e.g. to enable enforcement.
Page 14 of 44
Text box 1: Definition of microplastics
Microplastics are deliberately added to certain products or production processes as they perform specific functions. These plastics are known as primary
microplastics. Examples of these include pre-production pellets, plastic powders or granulates used as raw materials in the plastic industry. Primary microplastics are also used as abrasives in products like cosmetics, soap and cleaning
products, or as a carrier of pigments in paint.
Emissions of plastics and microplastics are closely related. Although a great deal of attention and work is devoted to the development of degradable and
biodegradable plastics, the vast majority of plastics are very poorly degradable. Plastic that enters the environment hardly disappears; rather it will gradually degrade into microparticles as a result of physical and chemical decomposition [26]. Microplastics caused by wear or degradation of plastic products are known as secondary microplastics. Microplastics that occur as contaminants within products, such as in sewage sludge or compost, are also classified as secondary microplastics. A major source of secondary microplastics is litter, which
originates from a wide variety of products and for which a wide variety of different actors are responsible. This report focuses on sources of both primary and secondary microplastics.
‐
Synthetic materials of petrochemical origin
‐
Poor water solubility
‐
Poor biodegradability
‐
Solid particles
3
Inventory of microplastic emissions
3.1 Approach
There is a practically unlimited number of applications for plastic. The inventory of sources can be conducted at various levels of detail, for example
contamination routes, sectors or products. For this reason, one source may be featured multiple times. A sewage plant is a source of microplastics, although it is also a collection point for microplastics from various other sources, such as cosmetics and clothing fibres that enter the sewer via the washing machine. The inventory must be compatible with the policy's ability to implement measures. Measures that can be considered to reduce microplastics emissions are improvement of waste collection and sewage water treatment, replacement of raw materials in products, product regulations and publicity and eduction to change behaviour.
The policy can therefore intervene at the source, but can also take action to combat the spread of microplastics.
In order to compile the inventory, a wide range of data was used: 1) Information from Plastics Europe [1]
2) Information from UNEP [20]
3) Emission Register (www.emissieregistratie.nl) 4) Expert groups
The following three sections will give a description of the contamination routes, the sectors involved and the most important plastic products.
3.2 Contamination routes of plastics and microplastics
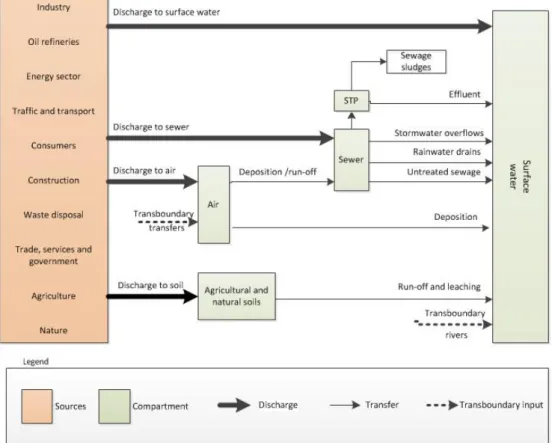
Plastic can be released during production, during or after usage or in storage and transfer between these stages. At the waste stage, packaging is the dominant form of plastic, accounting for 62.2% of all waste plastic collected. Construction, electrical/electronic products and agriculture are each responsible for 5-6% of plastic waste. A large proportion of waste plastic collected in the Netherlands is recycled (33%) or used for energy production (60%) [1]. The remaining 7% is disposed of in landfills. However, a major source of plastic in the environment is the non-collected waste: plastic that is dropped in the street, left behind or blown away from collection points (e.g. full bins). Around the world, an estimated 10 to 20 million tonnes of plastic is released into the environment via many different routes [20]. This plastic is a major source of microplastics. Measures intended to reduce microplastic emissions can intervene at particular points in the contamination route or address the source directly. Figure 1 displays the main potential routes along which microplastics get into the environment. These are described in greater detail below.
Discharge water
In the Netherlands, a licence is required in order to discharge waste water (whether treated or not). This licence sets standards for the quality of the discharged water. These quality requirements govern, amongst others, heavy metals, some organic micropollution and nutrients, but not microplastics. In principle, household waste water is treated at sewage treatment plants (STP). In most cases, industries have their own treatment installations or filters at their disposal. Microplastics are not recycled and due to their limited size, it is difficult for sewage treatment plants to filter all microplastic contaminants out of the water. Only limited data is available on the treatment efficiency of sewage
Page 16 of 44
treatment plants with regard to microplastics. In a study conducted by the Institute of Environmental Studies (IVM) at VU University Amsterdam, in collaboration with Deltares, Delft University of Technology and the Hollandse Delta Water Board, research was conducted into the presence of microplastics in various flows at the Heenvliet sewage treatment plant [27]. In this exploratory study that only included a few samples, 90% of the microplastics were removed by the treatment process. The remaining 10% enters the surface water, from where it can reach the sea. In a follow-up study, the number of sewage treatment plants was increased to three and a larger number of samples were taken. Microplastics were detected in the effluent (on average 39-89
microplastic particles per litre). This confirms that microplastics are not entirely removed from water by sewage treatment plants [28]. Microplastics were also detected in the influent. It turned out that the concentration of microplastics varied greatly with time, and that effluent concentrations were not always lower than influent concentrations. The previous estimate for treatment efficiency (90%) was not confirmed by the follow-up study. A recent study conducted by four Dutch sewage-treatment plants show average microplastic concentrations of between 48 and 55 particles per litre [29].
Figure 1: Sources and routes of plastics/microplastics to surface water (www.emissieregistratie.nl).
Sewage treatment plants have insufficient capacity to cope with periods of heavy rainfall, meaning that untreated waste water will enter the surface water via a sewer overflow. This particularly occurs at plants that don't have a separated waste water system, i.e. rainwater and domestic waste water are combined and treated at the plant. In the case of separated waste-water collection, rainwater and domestic waste water are treated separately. The advantage of this system is that overflows are less frequent, due to the fact that the amount of domestic waste water is relatively consistent. The disadvantage is that urban runoff water
is not treated, and hence plastics/microplastics from litter can directly enter the surface water. The proportion of households that are not connected to the sewer network and as a result directly discharge untreated waste water amounts to 0.3%: roughly 23,000 households [30]. Direct untreated discharge of domestic waste water can also originate from the shipping industry. The Emission Register calculated that in 2012, 12% of the waste water from recreational shipping was collected. For chartered ships and passenger ships, this figure was 5%, while 0% of waste water from inland shipping is collected. However, there was an increase in the number of vessels that collect their waste water in tanks and deposit it at the port [31].
Runoff from paved surfaces
Litter and street refuse, such as tyre wear, can enter the river via wind or rain (runoff). Due to factors such as tyre wear, an estimated 17,000 tonnes of tiny rubber particles are released in the Netherlands every year [21].
Runoff from unpaved surfaces
Litter in natural areas can also enter the rivers via wind and rain. When mowing roadside grass, plastic litter is ground into smaller plastic particles that can be washed away much more easily. Plastic from agricultural plots or fragments of degradable plastics can also enter the water via drainage water or wind. Inflow from abroad
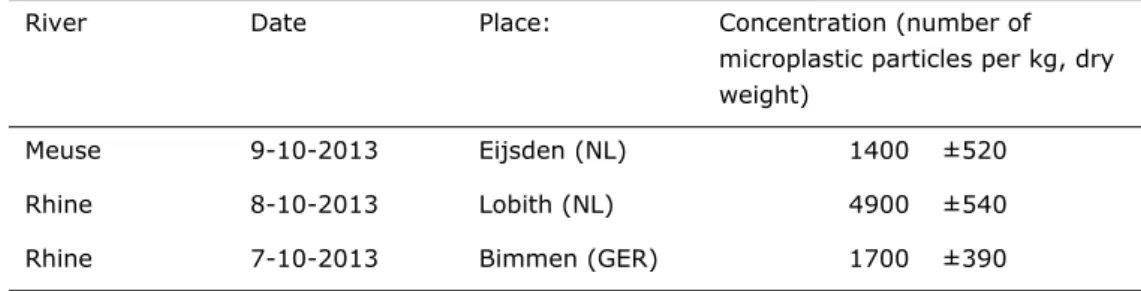
A small-scale monitoring study was conducted in the Meuse and Rhine areas in 2013. The inflow of plastics and microplastics from abroad via rivers was measured in suspended matter in the border regions of Eijsden (Meuse), Lobith (East Rhine) and Bimmen (West Rhine), on 9, 8 and 7 October 2013 respectively [28]. The results are displayed in Table 1. In 2014, a more extensive study was conducted, with weekly samples being taken over a period of five months. The results will be published in autumn 2014.
Table 1: Concentrations of microplastics (1µm-5mm) in suspended matter at border regions of the Rhine and the Meuse rivers. Values are the average of duplicate samples from October 2013 [28].
River Date Place: Concentration (number of
microplastic particles per kg, dry weight)
Meuse 9-10-2013 Eijsden (NL) 1400 ±520
Rhine 8-10-2013 Lobith (NL) 4900 ±540
Rhine 7-10-2013 Bimmen (GER) 1700 ±390
Atmospheric deposition
Plastic dust particles can enter the rivers via the air. The contribution that atmospheric deposition makes to this process is unknown.
Once in the river, the plastic can affect various different aspects: 1) sediment, 2) water columns, 3) surface water and 4) organisms both in (biota) and around (predation) the water. However, to go into detail on these aspects would stray outside the scope of this report.
Page 18 of 44
3.3 Sectors and products
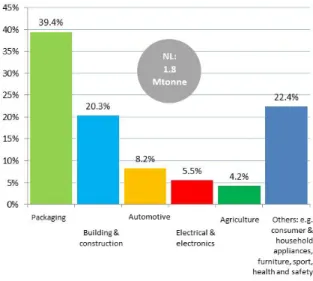
The packaging industry is the main user of plastic, accounting for 39.4% of the total quantity (see Figure 2). In the Netherlands, 1.8 million tonnes of plastic are converted each year compared to 45.9 Mtonne in the EU plus Norway and Switzerland. Packaging is also the dominant group with regard to refuse collection, accounting for 62.2% of collected plastic waste [1]. In its annual report, the European sector association Plastics Europe gives an overview of the use of plastic in various sectors.
Figure 2: Use of plastics in various sectors in the EU plus Norway and Switzerland (data: Plastics Europe, 2013).
To ensure a systematic inventory of sources, we used the definitions of sectors, processes and products as described in the National Emission Register. The National Emission Register is a system that combines emissions of all kinds of substances from all kinds of sources, establishing a nationwide picture of the environmental impact in The Netherlands (www.emissieregistratie.nl). In 2013, serious consideration was given to developing an emission-estimation method for microplastics within the Emission Register. This did not materialise at the time as too little quantitative data was available from the various sectors. In this report, we use the categories of sectors, processes and products as defined in the National Emission Register. The sources cited also participated in this process during an expert meeting in September 2013 (participants are listed in Appendix 1). The report examines both primary and secondary microplastics. To enable systematic inventory of sources, the Emission Register defines the following sectors:
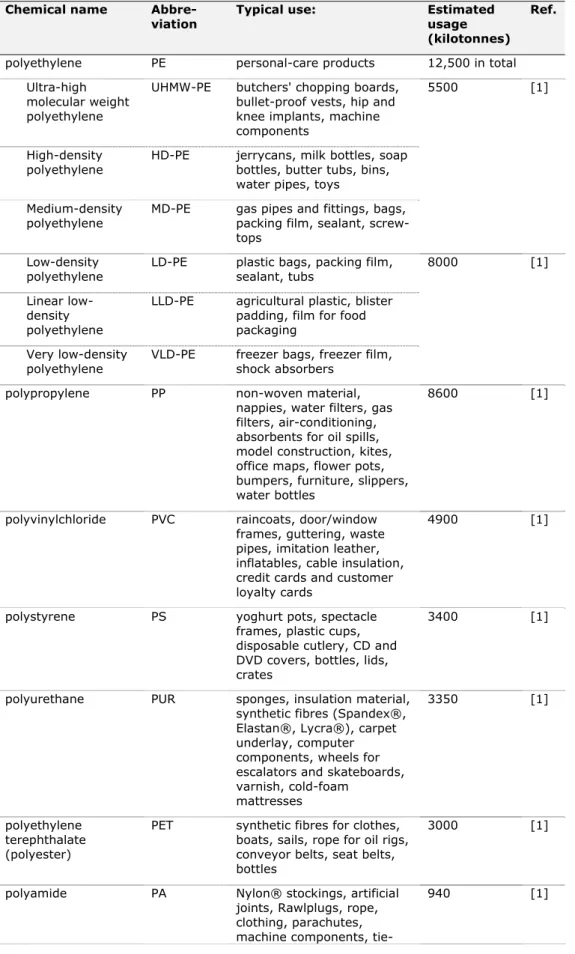
A summary of plastic products and the type of plastic they are made of can be found in Table 2. The tonnages stated give are indicative for the scale of such sources. The environmental relevance of the source is related to the likelihood of a product entering the environment as litter or via the sewers. This will be addressed in greater detail in Chapter 4.
1. Waste disposal 8. Agriculture 2. Construction 9. Nature
3. Chemical industry 10. Other industry 4. Consumers 11. Refineries
5. Drinking water provision 12. Sewers and water treatment plants 6. Energy sector 13. Traffic and transport
Table 2: List of various chemical types of plastics and examples of their most typical usages, classified according to volume of usage in 2012 (EU27+N/CH).
Chemical name
Abbre-viation Typical use: Estimated usage (kilotonnes)
Ref.
polyethylene PE personal-care products 12,500 in total Ultra-high
molecular weight polyethylene
UHMW-PE butchers' chopping boards, bullet-proof vests, hip and knee implants, machine components
5500 [1]
High-density
polyethylene HD-PE jerrycans, milk bottles, soap bottles, butter tubs, bins, water pipes, toys
Medium-density
polyethylene MD-PE packing film, sealant, screw-gas pipes and fittings, bags, tops
Low-density
polyethylene LD-PE plastic sealant, tubs bags, packing film, 8000 [1] Linear
low-density polyethylene
LLD-PE agricultural plastic, blister padding, film for food packaging
Very low-density
polyethylene VLD-PE shock absorbers freezer bags, freezer film,
polypropylene PP non-woven material,
nappies, water filters, gas filters, air-conditioning, absorbents for oil spills, model construction, kites, office maps, flower pots, bumpers, furniture, slippers, water bottles
8600 [1]
polyvinylchloride PVC raincoats, door/window frames, guttering, waste pipes, imitation leather, inflatables, cable insulation, credit cards and customer loyalty cards
4900 [1]
polystyrene PS yoghurt pots, spectacle
frames, plastic cups, disposable cutlery, CD and DVD covers, bottles, lids, crates
3400 [1]
polyurethane PUR sponges, insulation material, synthetic fibres (Spandex®, Elastan®, Lycra®), carpet underlay, computer components, wheels for escalators and skateboards, varnish, cold-foam mattresses 3350 [1] polyethylene terephthalate (polyester)
PET synthetic fibres for clothes, boats, sails, rope for oil rigs, conveyor belts, seat belts, bottles
3000 [1]
polyamide PA Nylon® stockings, artificial joints, Rawlplugs, rope, clothing, parachutes, machine components,
Page 20 of 44
Chemical name
Abbre-viation Typical use: Estimated usage (kilotonnes)
Ref.
wraps, dental floss, cables, fishing nets, wigs, strings for instruments, spokes
acrylonitrile
butadiene styrene ABS electronics, musical casing for computers and instruments, golf clubs, bumpers, helmets, canoes, suitcases, 3D printer liquid, toys (including Lego®), all kinds of consumer items, colouring agents in tattoo ink
840 (incl.
SAN) [1]
polycarbonate PC windows, acoustic barriers, compact discs, DVDs and Blu-Ray discs, bottles, reflectors, car-headlight glass, bulletproof glass, anti-theft packaging for small products, cockpit glass, spectacles, visors on motorcycle helmets, wind breaks for scooters and motorbikes, mobile electronics and screens
640 [1]
ethylene propylene
diene monomer EPDM roofing materials Sealant rings and strips, belts, conveyor belts, electrical insulation, pond liner
5802 [32] polymethyl- methacrylate PMMA acrylate Perspex®, Plexiglas®, windows, aquariums, acoustic barriers, dentures, photos
270 [1]
neoprene = polychloroprene rubber
CR laptop and tablet computer cases, orthopaedic braces, sailing and surfing gear (wet suits, dry suits)
133 [32]
nitrile butadiene
rubber NBR insulation, belts sealants, piping, cable 111 [32]
Polytetra-fluoroethylene PTFE, Teflon® anti-stick layers in frying pans, coating vats for storing aggressive chemicals, cable insulation for use in space and military organisations, heat shields, high-voltage installations, sealing of gas piping
523 [33]
Styrene acrylonitrile SAN polystyrene See ABS
2 Estimated production. Details: European production in 1992 was 266 kilotonnes with annual growth of
266 tonnes.
3 Estimated production. Data for 2012: Global production of 248 kilotonnes, with Europe's market share
4
Priorities by means of multicriteria analysis
4.1 Approach
The priority list regarding microplastics sources supports policymakers during establishment of emission-reducing measures. The priority list indicates in which sectors, processes or products emission reduction is most relevant, urgent or achievable. A number of criteria can be adopted in order to substantiate these factors and make them transparent.
The following criteria can contribute to the determination of priorities for
microplastics sources: 1) volume of microplastic emissions, 2) economic value of the product, 3) indispensability, 4) technical possibilities for emission reduction or treatment, 5) costs of emission reduction or treatment, 6) opportunities for 'quick wins', 7) public opinion, 8) perspective for consumer action and 9) relationship between national emissions and transboundary emissions. For a number of criteria, insufficient quantitative information is available in order to conduct a full analysis in the short term. Therefore, in consultation with the Ministry of Infrastructure and the Environment, it has been decided to pursue a qualitative approach and to focus on the criteria listed in Text box 2.
Text box 2:
Criteria used for the prioritization of microplastics sources
In order to prioritize the various criteria from Text box 2, which are largely qualitative in nature, scores have been assigned. In this way, a ranking order can be created with regard to magnitude, opportunity or likelihood of the
criterion. The higher the score, the greater the priority of measures. The various criteria can subsequently be combined to establish a total score. Furthermore, discussion can be conducted regarding the weighting of the various criteria. The multicriteria analysis (MCA) method resembles a social cost-benefit analysis (SCBA), although for MCAs, not all criteria have to be expressed in terms of money.
4.2 Assignment of scores
It was not possible to carry out a full social cost-benefit analysis within the time frame of this investigation. A similar methodology was conducted by UNEP [19] with regard to consumer goods, and this report contains elements of this research. This report makes use of expert judgement in order to assign scores for relevance, feasibility and urgency.
The group of experts consisted of Erwin Roex (project manager of the Water Emission Register, Deltares), Bert Bellert (water quality advisor, RWS), Anja Verschoor (microplastics project manager, RIVM) and Leon De Poorter (Emission Register advisor, RIVM). Over two sessions, the most prominent sources were
Relevance
o Volume of microplastic emissions
Feasibility
o Are microplastics indispensable for the relevant product/process/sector?
o Opportunities for quick wins
Urgency
o Public opinion
o Alternatives for the consumer
Page 22 of 44
determined and following consensus, the prioritization criteria were allocated a score.
The following scores were assigned to the criteria: A) Scale of the emissions. Possible scores:
0 = Small 1 = Moderate 2 = Large
B) Indispensability: For this criterion, you must consider the feasibility of removing or replacing plastics/microplastics with an alternative material or ingredient. Possible scores:
0 = Replacement or removal of microplastics is not possible.
1 = Replacement or removal of microplastics is only possible to a limited extent.
2 = Replacement or removal of microplastics is possible.
C) Opportunities for quick wins: Opportunities for emission reduction or treatment of primary and secondary microplastics. This can relate to technical possibilities as well as information, education, behavioural change and support for this change. Possible scores:
0 = No chance of further emission reduction.
1 = Only limited or complicated and expensive methods are available. 2 = Opportunities for quick wins exist.
D) Public opinion: Public awareness or unrest regarding certain products or sectors is a factor that must be taken into account during the prioritisation process. Therefore, a higher score is assigned to products or sectors that gain a great deal of media attention or for which public risk perception is high. Possible scores:
0 = Not a sensitive social issue.
1 = Not currently a sensitive social issue, but this situation may change. 2 = A great deal of public attention already exists.
E) Consumer options: If consumers lack information or options to minimize the emission of microplastics, then this can necessitate government action. Options comprise knowledge of the presence of microplastics in products, the availability of alternative products, possibility to dispose the
microplastics in a way that it does not lead to exposure of the
environment.Therefore, the less options there are, the higher the priority score. The perspective for action is indicated by the customer/consumer, not by the producer. Possible scores:
0 = Perspective for action clearly exists. 1 = Only limited perspective for action exists. 2 = No perspective for action exists.
4.3 Weighting of criteria
Weighting factors can be assigned to the various criteria displayed in Text box 2 to designate the degree to which each of the separate criteria contributes to the definitive priority list. The sum total of all of the weighting factors must be 1. The weighting factors can be determined and adjusted based on a political dialogue. No a priori assumptions have been made regarding the relative importance of the various criteria. For this reason, the current priority list is based on equal weighting of each of the three main criteria. The aspects of feasibility and urgency are both divided into two subcriteria. We will assign equal weighting to these subcriteria.
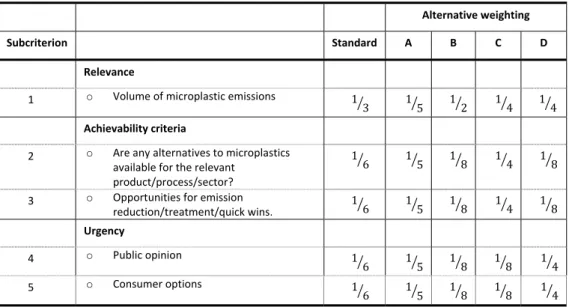
To give insight into the effect of a different weighting on the final priorities, we have devised four weighting possibilities: A) All subcriteria are given equal weighting, B) Relevance is given a heavier weighting, C) Feasibility is given a heavier weighting, and D) Urgency is given a heavier weighting. The weighting factors are summarized in Table 3.
Table 3: Weighting factors for determining the contribution of various criteria to the prioritization of sources of microplastics.
Alternative weighting Subcriterion Standard A B C D
Relevance 1 o Volume of microplastic emissions 1 3 15 12 14 14 Achievability criteria 2 o Are any alternatives to microplastics available for the relevant product/process/sector? 1 6 15 18 14 18 3 o Opportunities for emission reduction/treatment/quick wins. 16 15 18 14 18 Urgency 4 o Public opinion 1 6 15 18 18 14 5 o Consumer options 1 6 15 18 18 14
The priority scores have been standardized into a scale ranging from 0-10. The higher the score, the higher the priority.
The final score will be calculated as follows:
5
Final scores will be rounded off to the nearest whole number. This report adopts the standard weighting factors. The results of the alternative weighting are included in Appendix 2.
5
Results
5.1 Overview of priority list
The priority list indicates which sources can or should be targeted for emission-reduction measures, e.g. by making agreements with industries, implementing product regulations or providing information to the public. Table 4 lists the possible sources of microplastics in order of priority. The assessed priority scores are based on a scale of 1 to 9, with 9 indicating the highest priority. The table also indicates which scores were assigned to the separate underlying criteria (0, 1 or 2). The scoring method and the calculation of the priority is described in Chapter 4. The table displays to which actor the policy measures could be directed. In this way, particular products may appear twice or three times (i.e. with regard to the producer, the professional user and/or the consumer). These actors therefore have different responsibilities and opportunities regarding the reduction of plastic and microplastic emissions.
The distinction between microplastics originating from larger plastic components and microplastics that were deliberately produced and applied in this way is not relevant from an environmental perspective. For this reason, Table 4 makes no distinction between primary and secondary sources. The order of priorities is determined by the scale of the emissions, the opportunities to take effective action and public opinion and consumer options.
The scores for the separate criteria are displayed in order to indicate the degree to which they contribute to the eventual priority score. The priority list is not solely determined by the scale of the emissions. Sometimes, sources of
moderate emissions are given a higher priority than larger sources. This may be because of greater technical opportunities for emission reduction, higher public risk perception or the lack of alternatives for the general public. If citizens have no choice, then the priority for the government to take action is greater. The priorities may shift if an alternative weighting system is applied. In Appendix 2, you can find the results of various alternative weighting systems. The highest priorities remain the same, although minor variations (plus or minus 1 point) in the order of priorities are possible.
In Section Error! Reference source not found., explanation is given of the scores for each separate source.
Page 26 of 44
Table 4: Priority scores for sources of microplastics based on five criteria. C1: Scale of emissions, C2: Indispensability, C3: Opportunities for quick wins, C4: Risk perception, C5: Alternatives for the consumer
Activity/product Sector/actor Scale Feasibility Urgency Priority C1 C2 C3 C4 C5 Packaging material Consumers 2 2 2 2 1 9 Litter (general) Various sectors 2 2 1 2 1 8 Waste collection Waste disposal 2 0 2 2 0 7 Cosmetics Chemical industry 1 1 2 2 1 Cosmetics Consumers 1 1 2 2 1 Paint, lacquer, dyes Consumers 2 1 1 1 1 Fibres and clothing Consumers 2 1 1 1 1 Loading, unloading, transfer Services 2 0 1 1 2 Runoff from paved surfaces Traffic and transport 2 1 1 1 2 Dust from construction sites Construction 2 0 1 1 1 6 Abrasive cleaning agents Industry 1 1 2 1 1 Abrasive cleaning agents Consumers 1 1 2 1 1 Agricultural plastics Agriculture 1 1 2 1 1 Compost, sewage sludge Agriculture 1 1 1 1 2 Treated water Sewage treatment plants 1 1 1 1 2 Overflow and untreated water Sewage treatment plants 1 1 1 1 2 Tyre wear Traffic and transport 2 0 0 1 2 Inflow from abroad Other 2 0 0 1 2 Composting installations Waste disposal 1 0 1 1 2 5 Glues, paints Construction 1 0 1 1 0 Insulation Construction 1 1 1 1 1 Cast floors, carpeting Construction 1 1 1 1 1 Food Consumers 1 1 1 1 1 Household items Consumers 2 0 1 1 0 Automotive businesses Services 1 1 1 0 2 Dry cleaners Services 1 0 2 0 2 Cleaning of tankers Services 1 1 1 0 2 Sports fields Services 1 1 0 1 2 Foodstuffs and snacks Consumers 0 1 1 2 1 4 Landfill sites Waste disposal 1 0 0 1 2 Fibres Chemical industry 1 1 0 1 1 Packaging Chemical industry 1 1 0 1 1 Granular material (DIY) Consumers 1 1 1 0 1 Medical resources Consumers 2 0 1 0 0 Toys and party items Consumers 2 0 1 0 0 Combustion Waste disposal 1 0 0 0 2 3 Sandblasting Construction 0 2 0 0 2 Granular material Chemical industry 1 0 0 0 2 Foodstuffs and snacks Chemical industry 0 1 1 1 1 Glues and adhesives Consumers 1 0 0 0 2 Shipyards Services 1 0 0 0 2 Rotary milling Traffic and transport 1 0 0 0 2 Atmospheric deposition Other 1 0 0 0 2 Preparation of recycling Waste disposal 1 0 1 0 0 2 Production of base chemicals Chemical industry 0 0 0 0 2 Paint and adhesives Chemical industry 0 1 0 1 1 Medical resources Chemical industry 0 0 0 0 2 Electronics, printers Consumers 1 0 0 0 1 Dental surgeries Services 1 0 0 0 1 Corrosion of water mains Services 0 1 0 0 1 Extraction and distribution Drinking water industry 0 1 0 1 1 Cooling water Energy 0 0 0 0 2 Aviation Traffic and transport 0 0 0 0 2 Pesticides/herbicides Chemical industry 0 0 0 0 1 1 Pesticides/herbicides Agriculture 0 0 0 0 1 Printing firms Services 0 1 0 0 0
5.2 Explanation of scores
In this section, further explanation is given of the scores for each separate source. Wherever possible, the scores are based on factual information and estimations made by the expert group.
Priority score: 9
Packaging material has been given the highest priority due to the large
quantities of plastic involved (62% of all collected plastic waste is packaging), the many technical possibilities for emission reduction and the public awareness and media attention for the issue of packaging material. Even when the
weighting of the various criteria is adjusted, plastic packaging remains at the top of the priority list (see Appendix 2).
In order to reduce emissions of plastic packaging materials, measures such as promoting awareness amongst consumers, shops and industries could be implemented, and if desired, backed up by regulations. Currently, work is in progress to reduce disposable plastic bags, and cancellation of returnable deposits on soft-drink bottles is once again being discussed [34, 35]. Awareness is also being raised by campaigns targeting beachgoers, sports clubs and schools (www.nederlandschoon.nl).
Priority score: 8
Litter also scores highly. There is a great deal of overlap between litter and
packaging material, as packaging material accounts for a large proportion of litter. Other common forms of plastic litter include disposable cutlery, toys, clothing and shoes [20]. In order to reduce microplastic emissions from litter, measures can be implemented to prevent it (both in the street and in natural areas) from entering the rivers. Removal of plastic litter and preventing plastic waste from being ground up when mowing roadside grass can contribute to reducing microplastic emissions.
Priority score: 7
Collection of plastic waste has also been given a high priority due to the large
volume of emissions and the opportunities for reducing emissions. There is room for improvement of waste collection services (with regard to both capacity and vigilance), which will reduce the likelihood of plastic being blown away from collection points. Measures can be implemented that focus on both citizens and the waste processing sector.
Cosmetics are featured twice in this group: once based on the role of the
consumer and once based on the role of the cosmetics industry. Despite the scale of microplastic emissions from these products being relatively less than other sources, cosmetics have been assigned a high priority because alternatives are available, publicity and awareness of microplastics in cosmetics is high and both consumers and the industry have a clear perspective for action. The cosmetics industry is co-operating in the replacement of microplastic scrub particles and well-informed consumers can choose to buy products that are free of microplastics. Provision of information about the presence of microplastics in cosmetics could be improved by adding a label or logo to the packaging.
Paint, lacquer, dyes (consumers): Little is known about the presence of
microplastics in paint and lacquer. Paint, lacquer and dyes have a high priority score as consumer use of these products is often accompanied by a relatively large emission of polymers. The matrices of paint and lacquer consist of
polymers such as epoxy, acrylic or alkyd, with concentrations of between 14 and 30%. Supplementary research is required to establish whether these and other
Page 28 of 44
ingredients of paint should be classified as microplastics. Unlike professional use of these products in the construction industry, consumers are often not equipped for proper disposal of paint waste, brushes, rinsing solutions and dust. A study found that alkyd accounted for 81% of the microplastic particles found off the coast of Korea, originating from the sanding of ships [36]. Consumer use of water-soluble paint often leads to brushes being washed off under the tap, resulting in paint waste entering the sewer system. Awareness of this issue could be improved.
Wear and tear of fibres and clothing is likely to be another major source of microplastics. For every item of clothing washed, an estimated 1,900 plastic particles are released into the water, which then enters the sewers (
www.life-mermaids.eu). The EU Life programme is funding the MERMAID research
programme, which focuses on reducing the number of plastic microfibres and nanofibres that are released during washing. Microfibres are frequently detected in samples of surface water and sediment, as well as in organisms. Awareness of this source is moderate, as is the perspective for action. Consumers can choose to buy clothing made from cotton, linen, silk or wool, although synthetic fibres are so entrenched in the clothing industry - also in the form of mixed fibres - that abolishing synthetic clothing is not seen as a realistic objective.
Hypoallergenic pillows and travel pillows are often filled with plastic balls. During washing, the pillows can rip, resulting in microbeads entering the washing water. One technical option for reducing the emission of fibres into surface water is to install filters on washing machines.
Loading, unloading and transfer can result in considerable emission of plastic
materials due to spillage and leakage from containers, as evidenced by the frequent detection of pre-production pellets in environmental samples. Plastic powders and granular matter used in the formulation industry can be released into the environment in this way.
The group of experts estimates that businesses already take great care when handling their resources and that the opportunities for reducing such losses are therefore limited. Consumer awareness is negligible and consumers have no perspective for action whatsoever.
Surface runoff: This is another collective source - litter and tyre wear end up in
surface water via rain and wind. Emissions of tyre wear in the Netherlands is estimated at 17 kilotonnes per year [21]. Technical possibilities are limited: street sweeping and drainage of rainwater into the sewers are possible ways to reduce this source of emission. Risk perception amongst the general public is low with regard to litter (except for the visual aspect), and the issue is not closely associated with microplastics.
Priority score: 6
Dust emissions from construction sites: Dust from sawing, sanding and
drilling plastic plates/pipes creates dust on building sites that is then swept up by the wind or washed away by the rain. Alternatives for these materials are not available apart from returning to natural materials such as wood and metal. One technical possibility for reducing emissions is the installation and usage of vacuum systems. Sustainable construction is regularly featured in the media, although it is not directly associated with solving the problem of microplastics. Consumers - as commissioners of the construction work - can often make decisions that can reduce emissions. The government is yet to establish microplastic emissions as a criterion for sustainable purchasing.
Abrasive cleaning agents: Little is known by either consumers or the
professional market about the presence of microplastics in abrasive cleaning agents. The abrasive particles in cleaning products can be made of plastic, just like in cosmetics, and can be used for mild abrasion of specific surfaces, such as ceramic hot plates and other vulnerable glossy materials. Additional research is required to establish the application, the nature and the quantity of microplastics in such cleaning agents. According to the NVZ (Netherlands Association of Soap Manufacturers), which has asked a number of its members about this issue, a quantity of approx. 1,000-2,000kg of microplastic is used for these products every year in The Netherlands. According to the NVZ, regular washing and cleaning agents contain little to no microplastics as they are less effective and more expensive than the usual ingredients (calcite). This survey must be further investigated in order to provide insight into the level of response and the market share of the respondents in question. Microplastics in abrasive cleaning agents enter the surface water via the sewer. Not all abrasive cleaning products contain microplastics. Consumers are unaware of information about microplastics and are therefore unable to adjust their purchasing behaviour. The lower priority of abrasive cleaning agents compared to cosmetics results from the lesser degree of awareness and the negligible media attention regarding these products.
Agricultural plastic: Non-degradable agricultural plastic is often found in litter.
The agricultural sector has taken measures aimed at improving the collection, disposal and recycling of agricultural plastic. Nowadays, biodegradable
agricultural plastics are available on the market. This means that after usage, this type of plastic doesn't require disposal, and can even provide nutrients to plants. The use of OXO biodegradable 4agricultural plastics is strongly
discouraged by the EU [18]. Two considerations motivate this viewpoint. Firstly, this type of plastic reduces constructive reuse of plastic waste. Secondly, OXO-biodegradable plastics do not degrade entirely. Additives are added to these plastics, causing them to disintegrate into small fragments at the end of the growing season. These fragments subsequently become a source of
microplastics that enter surface water via nearby streams. According to the industry (the OXO-Biodegradable Plastic Association), the fragmentation is the first step towards further degradation. The quantity of biodegradable plastic used by the agricultural sector is unknown. Measures can focus on encouraging the development of fully degradable plastic (i.e. plastic that breaks down into carbon dioxide and water) or monitoring the entire removal process of
agricultural plastic after use. Citizens have no perspective for action with regard to this issue.
Compost, sewage sludge: Microplastics that occur in compost and sewage
sludge can be released into the environment when these products are applied. The Use of Fertiliser Decree established a range of standards regarding the constructive use of compost and sewage sludge for land fertilisation [37]. This decree imposes limits on concentrations of heavy metals and arsenic in fertilisers. Sewage sludge from treatment plants does not comply with these requirements, and is therefore not used in the agricultural sector. For industrial sludge, only a few sources comply with the requirements in this decree.
Statistics Netherlands collected data regarding the disposal of sewage sludge. In 2012, approximately 177 million kilograms of industrial (wet) sludge was used in the agricultural sector. This sludge is mainly sourced from treatment plants in the foodstuffs industry. Compost, sewage sludge and manure are increasingly
Page 30 of 44
being used to produce biogas. This is done by means of co-fermentation. The waste product of biogas production is known as digestate. Microplastics present in the compost or sludge are not broken down during fermentation and are therefore present in the digestate. If this digestate complies with certain quality requirements, then it can be used to fertilise land. According to Statistics Netherlands, no sewage sludge from treatment plants is used on agricultural land, but this data does not include the use of digestate.
The technical possibilities for reducing the levels of plastics in compost, sludge and digestate are limited. Options include better separation of waste prior to composting or better separation by citizens at the point of collection. The risk perception is moderate. The perspective for action is negligible for farmers and citizens, as no information about the compost is provided that could indicate whether or not it contains microplastics.
Treated water (effluent from treatment plants) can contain microplastics
[27-29]. There are no specific discharge requirements with regard to microplastics. The target value for suspended matter (including suspended plastic particles) in the effluent is 30mg per litre. Generally, no filtration takes place at the sewage treatment plant: particles are mostly removed by
sedimentation and flocculation. Only limited measurement data is available with regard to microplastics in the influent and effluent of sewage treatment plants. This data is also extremely variable, making it impossible to reliably estimate the treatment efficiency. Innovations such as recovery of raw materials and energy will also enable removal of microplastics. Awareness of the issue of microplastics in treated water is moderate, and citizens' perspective for action is zero.
Overflow at sewage treatment plants and untreated waste water
significantly contributes to the emission of microplastics into surface water. This is because it provides a route for clothing fibres and microplastics from
cosmetics, foodstuffs, medicines and cleaning products to enter the surface water. In 2012, approximately 23,000 households in the Netherlands were not connected to the sewerage system [30]. "Domestic" waste water from the shipping sector is also released directly into the sea without any treatment measures being applied [31]. There is room for improvement with regard to treatment and collection of waste water, and such improvement will reduce the emission of microplastics.
Tyre wear: Wear and tear on rubber tyres results in an estimated
17,000 tonnes of tiny rubber particles being released into the environment every year [21]. These particles are swept up by the wind or washed away by the rain, eventually ending up in surface water or the sewer system. There are very few opportunities for emission reduction, although the problem of fine-particle pollution has generated a degree of public attention to the effects of car traffic on air quality. However, these risks are not closely associated with microplastics. Consumers have no perspective for action with regard to this issue.
Inflow from abroad: Every second, 2,200m3of water flows into the
Netherlands via the Rhine, and 230m3 via the Meuse. These rivers encompass a
drainage area of 185,000 and 36,000km2 respectively. This area is mainly
outside the Netherlands and includes a number of large cities and industrial areas. The inflow of microplastics from abroad is therefore believed to be considerable. The technical possibilities for preventing this inflow are practically zero, public awareness of this problem is moderate and there is no action that citizens could take to combat the problem.
Composting plants: Larger plastics are blown or filtered out of biodegradable
waste. We assume that this waste is disposed of professionally and properly. Alternatives are not applicable, as the plastic is not supposed to be there. It is possible that the processes can be improved to reduce the amount of emissions via windborne waste. The risk perception is low, and citizens have no
perspective for action with regard to this issue.
Glues, paints (construction): In the professional sector, proper disposal of
glue/paint waste and cleaning of brushes is better organised than is the case for private individuals. Plastic particles can also be released into the atmosphere as a result of sanding old layers of paint or general wear and tear (see also dust emissions on construction sites). This type of emission can be considerable in scale. Little to no alternatives are available to microplastics in paint. It is possible that providing information about clean working methods, vacuuming of dust etc. can help to further reduce emissions. There is awareness within the sector of careful working methods and environmentally friendly paints and glues. However, the latter aspect relates more to solvents than the possible presence of microplastics. The consumer's perspective for action is negligible, as
information about microplastics in paint is not provided.
During the installation of cast floors, insulation and carpeting
(construction), microplastics can be emitted via the wind. Wear and tear
(particularly of floors) can also cause emissions. Alternative materials are available, and these are already being used for sustainable housing projects. Awareness of sustainable building materials is growing amongst consumers, although it is not as yet associated with the emission of microplastics. As is the case for the issue of dust emissions on construction sites, the consumer, i.e. the commissioner of the construction work, is partly involved in the choice of materials. The government is yet to establish microplastic emissions as a criterion for sustainable purchasing.
Domestic items (disposable or otherwise) are identified by the UNEP as the
largest source of plastic pollution in the sea [20]. This includes plastic cutlery, cups, straws and other such items. There are few technical possibilities available for reducing emissions, although improvements could be made by means of education and influencing behaviour. So-called biodegradable plastics that quickly 'degrade' into smaller fragments may well result in quicker
disappearance of visible litter, but they promote the emission of less visible microplastics. Only plastics that fully degrade into carbon dioxide and water can contribute to reducing microplastic emissions. Public awareness of this issue is not extremely high, although consumers do have a clear perspective for action.
Automotive businesses: Microplastic waste is produced by this sector,
especially in car respray shops and scrapyards. This is due to the release of paint particles at respray shops and scrapping of plastic car components. The emissions are moderate, technical possibilities for emission reduction are few and far between and public awareness and perspective for action are also limited. Other factors affecting the criteria of relevance, achievability and urgency do not alter the priority score.
Dry cleaners: Emissions of microplastics from dry cleaners mainly result from
wear and tear of textile fibres. A quick win can be realised by installing filters that prevent microplastics from entering the sewers. The public risk perception is low, and citizens also have no perspective to act.
Cleaning of tankers: Industrial soap and abrasive cleaning agents can contain
microplastics. It can be assumed that in professional environments such as these, the waste water is treated separately before it is discharged into surface
Page 32 of 44
water or the sewer system. However this treatment does not specifically target microplastics. The treatment efficiency is therefore unknown. There is little public awareness of this issue and citizens have no perspective for action. Technical possibilities for the reduction of emissions are unknown.
Sports fields: Over the past ten years, the number of artificial grass pitches
and athletics tracks has increased rapidly. Emissions of microplastics can result from wear and tear on the artificial surface, as well as the spreading of rubber infill that is added to support the grass fibres. This rubber infill spreads across the surrounding area and gets into sports bags and clothing, and in this way, it enters the sewer system via washing machines and other routes. As the rubber infill disappears from the field over time, replacement infill must be periodically scattered. Sand infill is an alternative to rubber infill, but this results in a lesser-quality playing surface. The alternative to artificial grass is real grass. No quick wins are expected with regard to this matter. The risk perception is moderate. Since 2006, there has been regular unrest in the media (e.g. articles in De Telegraaf [30/8/2006] and Zondagsnieuws Maastricht/Mergelland
[2/11/2008]) about the risks of chemical substances in rubber infill, particularly the risk of contamination of groundwater and air quality. On many occasions between 2006 and 2009, questions were asked about this matter in the Dutch parliament.
Priority score: 4
Foodstuffs and snacks (consumers): Microplastics are sometimes added as a
filler in chewing gum. Chewing gum frequently ends up littering the streets, which can result in microplastic emissions. Harmful effects to humans resulting from consumption of microplastics have not yet been demonstrated. Little is known about the unintentional presence of microplastics in foodstuffs. In mussels collected at two different locations on the Dutch coast, a maximum of 105 microplastic particles per gram was detected, with a maximum of 87 microplastic particles per gram for oysters [29]. Microplastic particles have also been found in honey: coloured fibres (average of 0.17 particles per gram) and fragments (average of 0.009 particles per gram), which may have been transferred onto/into flowers via wet or dry deposition. The volumes are extremely low and therefore no adverse effects in humans are expected. It is expected that a large proportion of these microplastics will be excreted and enter surface water via a sewage treatment plant. The degree of microplastic emissions from food into surface water is estimated to be moderate. The achievability of consumers reducing emissions and the citizens' perspective for action are very low as this issue mainly relates to microplastics that are unintentionally added to products. At the moment, there is negligible unrest amongst the public and the media with regard to food quality. However, this can change quickly, as food quality is a sensitive subject. Food safety is a sensitive topic, and this can rapidly increase urgency.
Landfill sites: In the Netherlands, domestic waste is no longer put into landfills
(http://afvalmonitor.databank.nl). Landfill sites do still exist for industrial waste, construction and demolition waste, contaminated earth etc. The emission from plastics is moderate as covering measures are in place to prevent waste from blowing away. Technical possibilities for emission reduction are negligible and few alternatives are available. Consumers do associate landfill sites with the problem of windborne litter, but not directly with microplastics. Consumers have no perspective for action with regard to this issue.
Fibres (chemical industry): During the production of plastic fibres, materials