Monitoring data in pesticide registration
A.A.Cornelese, J.J.T.I.Boesten1, M.Leistra1, A.M.A.van der Linden, J.B.H.J.Linders, J.W.W.Pol2, A.J.Verschoor
This investigation has been performed by order and for the account of the Directorate General for Environmental Protection, Directorate for Soil, Water and Agriculture, within the
framework of project 601450, Risk Assessment Methodology.
RIVM, P.O. Box 1, 3720 BA Bilthoven, telephone: 31 - 30 - 274 91 11; telefax: 31 - 30 - 274 29 71 1Alterra, Wageningen University and Research Centre, Wageningen
Acknowledgement
The Working group for the “Revision of the Decision Tree Leaching” thanks the Advisory Committee, consisting of delegates of the Ministry of Housing, Spatial Planning and the Environment, Nefyto, BASF, Bayer, and Syngenta Crop Protection for fruitful discussions at the start of the project and one year later. Based on their expertise and/or position dr. Jan de Rijk, mr. Maritza van Assen, ir. Leo Joosten, ir. Jan Renger van de Veen, ir. Johan Henken are Members of the Advisory Committee. Connie Posthuma is kindly acknowledged for word processing.
Abstract
The Dutch working group for the “Revision of the Decision Tree Leaching” commissioned by the Ministry of Housing, Spatial Planning and the Environment, has worked on the improvement of the decision tree leaching, including triggers, safety factors, scenarios, models, field and lysimeter studies and monitoring. The guidelines developed by the working group enable a more consistent and comprehensive registration process for pesticide
admission. This report deals with the place of monitoring in the decision tree. In the
registration process in The Netherlands the precautionary principle will always be followed which implies that a pesticide is not registered until it has been demonstrated that it complies with legal criteria. Monitoring results will be introduced in the final phase of registration. A prerequisite is that the monitoring data comply with generally accepted quality standards and, if applicable, international Good Laboratory Practice protocols. Furthermore the monitoring programmes should be dedicated to the question whether the substance of interest will leach when it is applied according to Good Agricultural Practice. This report gives guidelines for the set-up of monitoring studies and interpretation and evaluation of monitoring data to be used in the registration process. Furthermore guidance for summarising and evaluation of monitoring results is provided.
Preface
In the European Union Plant Protection products (PPP) can only be registered if they fulfil the requirements as stated in Directive 91/414/EEC (EU, 1991) and later updates and
implementation notes. The estimation of the risk of groundwater contamination is part of the registration procedure. In The Netherlands, as in most European countries, a tiered approach is followed. The approach has been laid down in an explicit scheme (decision tree) with clear-cut criteria. In the Dutch authorisation process a revision of the decision tree dated from 1993 is elaborated. The reasons for reconsidering the Dutch decision tree on leaching were: • the harmonisation process on registration of PPP’s;
• the deviations between the Dutch approach and the FOCUS (EU) approach; • availability of data (among others soil and climate data) in electronic form (GIS); • availability of a spatially distributed model.
Results from groundwater concentration measurements will find their place in the overall assessment. In this report the benefit of measurement results, criteria to be put on the data and their use in decision taking will be discussed.
Contents
SAMENVATTING ... 6
1. INTRODUCTION... 7
2. POSITION OF MONITORING IN THE REGISTRATION PROCESS ... 8
2.1 THE NETHERLANDS... 8
2.2 EUROPEAN UNION AND OTHER COUNTRIES... 9
3. SET-UP OF MONITORING STUDIES ... 11
3.1 INTRODUCTION... 11
3.2 UPPER GROUNDWATER... 11
3.3 DEEPER GROUNDWATER... 13
4. INTERPRETATION OF MONITORING STUDIES ... 16
4.1 THE PURPOSE OF MONITORING STUDIES... 16
4.2 INTERPRETATION OF UPPER GROUNDWATER MONITORING DATA... 16
4.3 INTERPRETATION OF DEEPER GROUNDWATER MONITORING DATA... 17
5. SUMMARISING MONITORING STUDIES... 19
5.1 EVALUATING NON-SPECIFIC MONITORING DATA... 19
5.2 QUALITY OF STUDIES... 19
5.3 SUMMARY OF A MONITORING STUDY... 21
6. CONCLUSIONS ... 24
REFERENCES ... 25
APPENDIX A MONITORING STUDY WITH A LARGE NUMBER OF FIELDS. ... 28
Samenvatting
Bij de evaluatie van de toelaatbaarheid van gewasbeschermingsmiddelen spelen gegevens uit laboratorium- en veldexperimenten een belangrijke rol. Ook gegevens uit
monitoringprogramma’s kunnen bij de registratie van gewasbeschermingsmiddelen worden gebruikt. Bij de beoordeling van uitspoeling worden gegevens van monitoringprogramma’s in de laatste stadia van de beoordeling gebruikt. Het CTB gaat bij de toelatingsbeoordeling uit van het voorzorgsprincipe. Dat wil zeggen dat een toelating pas wordt verstrekt als uit de evaluatie blijkt dat een stof voldoet aan wettelijke gestelde normen. Om bruikbaar te zijn in het evaluatieproces dienen monitoringgegevens dan ook een antwoord te geven op de vraag of een stof aan de wettelijke normen voldoet. Gezien de plaats in het evaluatieproces dienen aan opzet, uitvoering, interpretatie en evaluatie hoge eisen te worden gesteld. Dit rapport geeft richtlijnen voor elk van deze aspecten van monitoringstudies. Tevens wordt een richtlijn gegeven voor het samenvatten van dergelijke studies.
1.
Introduction
The estimation of the risk of groundwater contamination by plant protection products is a major task of the registration authorities. For the registration of agrochemicals to be marketed in the European Union the chemicals have to comply with legal criteria. The estimation of the risk of groundwater contamination is part of the registration. Annex VI to the Directive 91/414/EEC; the Uniform Principles (EU, 1997) says:
”Registration shall be granted if the chemical and each of its relevant metabolites after leaching:
a) have a calculated concentration in groundwater of less than 0.1 µg/l or less than 0.1 times the ADI in µg/kg bodyweight (smallest of both values),
b) have a measured concentration in groundwater of less than 0.1 µg/l or less than 0.1 times the ADI in µg/kg bodyweight (smallest of both values).”
In The Netherlands (BUB, Rumb 2000) these criteria are set for the upper groundwater. To protect the groundwater as a source of drinking water there must be reasonable certainty that the concentration of the chemical or its relevant metabolites in the groundwater at 10 m depth does not exceed 0.1 µg/l. It should be noted that the criterion of 10 m depth is the Dutch elaboration of the European standard described for water intended to be used for drinking water. The underlying assumption is that the pesticides are used according to Good Agricultural Practice.
2.
Position of monitoring in the registration process
2.1
The Netherlands
In order to streamline decision making, a decision tree is used to check whether a chemical can be considered safe with respect to leaching to groundwater (CTB, 2002). In The Netherlands a decision tree has been used since the early nineties (Brouwer et al., 1993), based on one standard scenario selected on expert judgement. This decision tree is being re-elaborated, because of recent developments at the European level and scientific
developments. A proposal for the structure and hierarchy of the new decision tree is given in Figure 1 (derived from Van der Linden and Boesten, 2002). Decision making follows a tiered approach. Whether a plant protection product can be registered is ultimately decided at the highest tier (tier 3). In this tier the legal registration criteria are applied as such. In earlier tiers decisions are taken on the basis of less information, and therefore more strict rules or higher confidence limits are applied in order to avoid unwarranted approvals.
Figure 1 Simplified scheme of the decision tree leaching
In tier 1 decisions are taken using a minimum set of data. Up till now, authorisation in The Netherlands can be granted if, with respect to groundwater contamination, the active
substance and each of its relevant metabolites (major and minor) show a calculated leaching of less than 0.001 µg/l. Average values for DT50 and Kom from laboratory studies are used as
input values for the PEARL model and calculations are performed for a standard scenario. A safety factor of 100 is applied to the simulation results. This factor should cover uncertainties in substance properties, uncertainties in the scenario and its parameterisation and,
uncertainties in the model. The re-elaboration of the decision tree might change this procedure and / or lead to alteration of the safety clause (Van der Linden et al., 2003 in prep.).
Overview decision tree
1
2
3
simple calculation procedure
(e.g. a few scenarios)
- calculations with GeoPEARL
- field/lysimeter experiments
- additional transformation rate studies
- monitoring upper groundwater
i
i
h ll
- transformation rate in water-saturated zone
- monitoring deeper groundwater
1 m
-In tier 2 additional information is taken into account. The additional information may include calculations for more realistic scenarios, extra laboratory studies,lysimeter and / or field studies. Common to each of these information sources is that they focus on issues unresolved in the first tier. The additional information should ascertain that the final concentration in groundwater to be used for drinking water does not exceed 0.1 µg/l. Refined scenario calculations are not performed on a standard basis at this moment. The simulation model GeoPEARL (Tiktak et al., 2002) is developed for this purpose at this moment for registration procedure in The Netherlands. It is possible that lysimeter or field studies on leaching in combination with calculations provide enough evidence to evaluate the risk of leaching (Verschoor et al., 2002).
In the third tier information from the saturated zone is taken into account. It should be demonstrated that transformation of the substance occurs under all relevant environmental conditions that prevail in the subsurface up to a depth of 10 m. This transformation should be fast enough to ensure that concentrations at greater depths comply with the criteria. Results from these transformation studies are used in simple calculations, assuming a travel time of the groundwater of 4 years. This part of the third tier has been rarely applied up till now. Though the impact of plant protection products on groundwater quality can be assessed through a variety of studies and the likely concentrations estimated by modeling, it is only through monitoring studies that these predictions can be confirmed (Mills and Simmons, 1998). The results of monitoring studies can be used in the evaluation process if, in the second tier or in the third tier, safe use with regard to leaching cannot be concluded and/or leaching risk cannot be excluded with reasonable certainty from the additional information provided by experiments or refined modeling. In the second tier monitoring data from shallow groundwater can be used. Shallow groundwater is defined as the upper meter of the groundwater. At shallow groundwater tables (as in most of The Netherlands) this is
approximately the groundwater at 1-2 m depth. It follows from the legal criterion that, by definition, shallow groundwater is groundwater not deeper than 5 m (bijlage IV, Rumb 2000) below soil surface. Monitoring data from greater depths (around 10 m below soil surface) can be used in the third tier.
2.2
European union and other countries
At the European level, but also in several member states, realistic worst case conditions are considered in the evaluation process (among others FOCUS, 2000). For the European level the realistic worst case is defined as the overall 90% vulnerable situation. More specifically, the vulnerability is split evenly over soil and climatic conditions, and average or median pesticide properties are taken in the evaluation process. The Netherlands has chosen to use a different distribution of weights over the different factors (Van der Linden et al., 2002; Van der Linden et al., 2003 in prep). Because of the emphasis of protecting groundwater as a source for drinking water, more weight is given to the vulnerability of soils and less to climatic conditions. For the moment, the overall 90% vulnerable situation is evaluated using average substance properties and climatic conditions.
The evaluation should demonstrate that there is no risk of leaching for a certain product. In the Netherlands this has been specified as: the legal standard of 0.1 µg/l must on average not be exceeded on at least 90% of the surface area. Given the place of monitoring in the decision tree, this means that monitoring results should answer the question whether on average the
concentration of the substance under consideration is < 0.1 µg/l on at least 90% of the (potential) use area.
From the literature it becomes clear that a lot of measurements on plant protection products in groundwater are performed. Measurements are mostly done in public or private (Wade et al., 1998; Rudolph et al., 1998; Jones and Estes, 1994) or are designed as field studies (Jones et
al., 1987; Loewy et al., 1999; Johnson et al., 2001; Gooddy et al., 2001). Within the
registration process, abstraction wells are not suitable for groundwater monitoring as is discussed later in the report.
Information on the implementation of monitoring data in registration procedures is scarce. In Germany there is a framework of groundwater monitoring performed by authorities or water suppliers (Aden et al., 2002). If concentrations > 0.1 µg/l are found, the authorisation holders have to explain the findings. In some cases (for example because of special substance
properties or the results of a lysimeter study) a post-registration monitoring study is imposed. The evaluation of results is done on a case by case basis.
In this report an outline of the use of data from monitoring programs for shallow and deeper groundwater in the decision making process is given. Firstly (Chapter 2) we highlight some points of concern in the design and performance of monitoring programs. The interpretation and extrapolation of results, including statistical analyses, are discussed in Chapter 3. Not all monitoring data originate from specifically designed monitoring programs. Whether or not data can be used in the evaluation process is discussed in Chapter 4, which also highlights the procedure for quality checking and summarising.
3.
Set-up of monitoring studies
3.1
Introduction
In view of the registration procedure, groundwater monitoring programs can be divided into two types of monitoring based on the sampling depth: monitoring of the upper groundwater and monitoring of deeper groundwater. Upper or shallow groundwater may be monitored to demonstrate that under common agricultural practice, according to GAP and following label instructions, there is no risk of leaching of a chemical to groundwater. If the risk of leaching to upper groundwater cannot be excluded, information on the behaviour in deeper layers is necessary to prove that a substance does not leach to the deeper groundwater (legal criterion at 10 m depth). Monitoring data from deeper groundwater may serve this need. Normally an elaborated protocol should be discussed with the registration authority.
3.2
Upper groundwater
Upper groundwater monitoring provides information on pesticide leaching on the field scale. There is a direct relationship between the plant protection product used on the sampled location and the measurements in the groundwater. A variety of program set-ups is possible. In the following a set-up using a relatively small number of fields, relatively homogeneously treated, is discussed. An alternative, which uses a larger number of fields is discussed in Appendix A. Although a larger number of fields would be preferred, we realise that selection of more fields often goes along with a decline in information per field. This hampers
interpretation and therefore a relatively small number – with adequate information per field – is preferred.
Occasionally the influence of discriminating factors (for instance soil type, crop type or application period) is one of the goals of the monitoring study. The number of fields included in the monitoring program then has to be increased accordingly. For each set of conditions a sufficient number of replicates should be selected. Monitoring studies may not be very efficient in discovering influences of discriminating factors.
The statistical hypothesis (H0) to be tested is:
the 90th percentile in space of the long-term average concentration in the uppermost groundwater exceeds 0.1 µµµµg/L.
The procedure is:
-monitoring of the top meter of groundwater at 8 – 10 fields; -fields have to be more vulnerable than 90th percentile;
-if possible, be sure that the weather is wet enough (or supplemented by irrigation).
Field selection
Eight to ten fields are selected on which the chemical was recently used or on which the chemical will be used in course of the project. The monitoring is mainly targeted to vulnerable areas and with shallow groundwater (Mills and Simmons, 1998).
Fields are selected to represent an overall 90% vulnerability, taking into account or based on: • soil type and soil profile characteristics (soil texture, soil organic matter and soil pH of
• groundwater depth, artificial drainage and other hydrological aspects;
• chemical properties of the substance (in view of interaction with the soil, etcetera); • (if relevant) crop and application time (within the growing season).
The selection of the fields should be underpinned with measurements or statements taking into account the variations in characteristics and properties of the chemical (among others in DT50 and Kom). Calculations on potential leaching may be included in the selection procedure.
For a proper comparison and interpretation of the data, fields should be submitted to
approximately the same agricultural practice. In the statistical analyses measurement data are considered to descend from one entity (population of data).
If the study is started from scratch, like in post registration monitoring, one should make sure that the weather is wet enough. The possibility of irrigation, to be sure that average leaching conditions occur, should be included in the study design. The precipitation amount could be filled up to long term averages on a monthly basis.
Outline of sampling
For upper groundwater monitoring samples are taken approximately in the top meter below the groundwater table. A layer of 1 m thick approximates the yearly groundwater recharge. Filter lengths of more than 1 m should be avoided; a filter of 50 cm length, positioned in the centre of the target layer, is preferred. Semi-permanent or occasional wells are installed for sampling. Samples can be taken by means of a (submersible) pump or vacuum abstraction through a capillary. Care should be taken not to loose (semi-)volatile substances.
To avoid the risk of missing the leaching peak, samples should be taken on more than one occasion in time. At least three sampling times are preferred, a) before the peak concentration is expected to reach the groundwater, b) approximately at the time of the maximum expected concentration in the groundwater and c) at a time after the peak concentration has passed. The position of the leaching peak can be estimated using a simulation model, preferably using site specific soil profile and pesticide behaviour information. To gain insight in in-field variability in leaching behaviour a series of samples (12 – 20) should be taken randomly over the field. Individual samples can be mixed in the laboratory before analysis. Cornelese and Van der Linden (1998) analysed four pooled samples for each field and found this to be an acceptable minimum.
The presence of residues in the groundwater, resulting from earlier applications than the one to be studied, may have implications for the set-up of the experiments. The sampling method should then exclude the mixing of water infiltrated during the consecutive years. Improper sample taking makes the interpretation of the results more difficult or might even render the data useless.
Analysis
Immediately after sample taking, the individual samples are cooled or put on ice. After transfer to the lab, individual or pooled samples are analysed using appropriate quantification and confirmation techniques. Analysis should also include sufficient first and second line control samples and positive references.
Reporting of the analysis results
The report of the monitoring study should include the results of all measurements, including analytical recovery results, first and second line control samples and positive references. The report should also state the Limit of Detection (LOD) and the Limit of Quantification (LOQ). Samples having a concentration <LOD may be reported as such. For samples having a
concentration between LOD and LOQ the value should reported; these values should be marked.
3.3
Deeper groundwater
Monitoring programs for deeper groundwater are usually performed using permanent wells. Usually the wells are installed to serve broad monitoring programs, not specific for plant protection products. As groundwater flow usually is quite complex, only very seldom direct relationships between the field of infiltration and the sampling point in the groundwater can be established. Careful well selection is therefore of eminent importance (Leistra et al, 2001). Here the statistical hypothesis (H0) to be tested is:
the 90th percentile in space of the long-term average concentration in
groundwater at 10 m depth exceeds 0.1 µµµµg/L.
The hypotheses for the uppermost groundwater and the groundwater at 10 m depth essentially are the same; only the reference to the depth is different. Only sampling wells are considered in the program, no wells pumped for drinking water, so the 90th percentile is considered sufficient to protect drinking water.
Important in the monitoring procedure is: -careful well selection;
-adequate sampling and analytical procedures; -large number of wells needed (in the order of 100); -filter depth at or below 10 m depth.
Well selection
The usefulness of every well for the study purpose should be demonstrated. The evaluation of the usefulness includes at least two stages: a “desk-top-stage”, in which general (for instance soil maps, geological and hydrological maps of the area) and specific information is used to make a gross selection of wells, and an “in-field-stage”, in which the selection of the desk-top stage is confirmed and additional information on the wells and their surroundings is gathered. In the desk-top-stage the wells are evaluated for:
• the construction and installation; the materials used should be inert to the chemical, seals should prevent preferential flow, the well head should be positioned well above soil surface (or infiltration through the well head should otherwise be excluded; wells that are situated at or below surface level have the risk of introduction of contaminated run-off water (or introduction of large amounts of “clean” water), accessibility by non-authorised persons should be prevented.
• the depth of the filter (bottom end) should be at least around 10 m depth. Other filters may be present, but then seals must exclude mutual influence.
• the age of the groundwater at the filter depth should not exceed the time the plant protection product was marketed; i.e. non-relevant zeros are to be excluded.
• the use of the plant protection product in the infiltration area around the well must be demonstrated, for instance by historical information on agricultural use of the pesticide in the infiltration area of the filter. One should be confident that the product was used on at least 10% and preferably 25% or more of the intake area of the well (to be justified). This again is to assure the exclusion of non-relevant zeros. Based on information on travelling
time or the age of the sampled well water and the possible retardation of the substance, the time over which data on the use of the plant protection products in the intake area should be known can be determined.
• the area around the well should be relatively vulnerable to leaching of the compound or the occurrence of the compound in shallow groundwater should have been demonstrated in the area.
• other contamination sources (for instance not-controlled dump sites and pesticide storage locations) should be absent in the infiltration area.
• infiltration of surface water from water courses (ditches, canals and rivers) should be absent. Larger water courses have been identified as a source of contamination; any influence should therefore be excluded.
The in-field stage should confirm the desk-top stage and furthermore be used to check: • the integrity of the well. Damage of wells may be visible or concluded from the
appearance of the water that is abstracted.
• the presence of abstraction wells (for irrigation, drinking water supply for cattle, etcetera) in the direct surroundings of the well (within approximately 100 m distance). Be aware that such wells are often located inside buildings. It should be checked whether these wells may function as a short-cut to deeper groundwater; this may be the case when the well-head is below soil surface. It should also be checked whether these wells are also used for filling or cleaning of the spraying equipment. If there is any suspicion, the neighbor wells should be excluded from the study.
• the probability of over-spraying the well head. This is only relevant when a short cut to the groundwater as a result of improper well construction or well position is possible. A correct sample taking procedure, which excludes contamination of the sample and
contamination of the groundwater, will be sufficient to include such wells in the selection. • re-allotment, which might go along with deep tillage, fill-up of cavities, etcetera.
• reconstruction of waterways.
• deep drainage of construction sites. This may lead to greater flow rates, additional infiltrating water, etcetera. The well then is not representative of the normal situation. Wells that do not comply with the criteria above should be excluded from the sample population.
The selected wells should represent the area of use of the chemical. The total number of samples should be large (≥ 100). If discriminating factors are introduced in the study set-up, the number should be increased correspondingly. Discriminating factors may be:
• sampling depth; • soil type;
• hydrological conditions; • geographical region;
• human activities in the intake area.
Sampling
Selected wells should be pre-pumped to refresh at least three times the contents of the filter tube. During this stage additional parameters (like EC, pH, oxygen content) can be measured. Samples can be taken by means of a (submersible) pump or by vacuum abstraction through a capillary (up to approximately 7 m depth). Care should be taken not to loose (semi-) volatile substances. In general wells are sampled once; trend analysis is usually not the goal of the study. However, a short sequence of samples would be desired.
Analysis
Immediately after sample taking, the individual samples are cooled or put on ice. After transfer to the lab, individual samples are analysed using appropriate quantification and confirmation techniques. Analysis should include sufficient first and second line control samples and positive references. If a sample shows the presence of the chemical, it is best to take a second sample from the same location (within several weeks) to check whether contamination during sample taking or sample handling occurred.
Reporting of the analysis results
The report of the monitoring study should include the results of all measurements, including analytical recovery results, first and second line control samples and positive references. The report should also state the Limit of Detection (LOD) and the Limit of Quantification (LOQ). Samples having a concentration <LOD may be reported as such. For samples having a
concentration between LOD and LOQ the value should reported; these values should be marked.
4.
Interpretation of monitoring studies
4.1
The purpose of monitoring studies
In the framework of the tiered risk evaluation (the decision tree), monitoring data should provide additional information on the risk of leaching. Monitoring is invoked when the risk of leaching cannot be excluded. This means that monitoring results should demonstrate that there is no leaching of an active substance and/or its metabolite(s) above the legal criterion, under the suspicion that there is leaching. For The Netherlands this means that monitoring should ultimately demonstrate that the concentration in the groundwater at 10 m depth does not exceed the criterion under common agricultural practice according to GAP and label instructions. The interpretation of the monitoring studies should focus on this.
4.2
Interpretation of upper groundwater monitoring data
The interpretation of the results of the preferred monitoring strategy is discussed here; the interpretation of the results of the alternative is discussed in Appendix A. Usually, the number of samples will be too small to rely on statistical examination alone. The
interpretation of the data therefore includes a number of steps in order to evaluate whether or not there is a risk for leaching to upper groundwater:
1. selection of data. For each field the data from the successive sampling rounds are compared. The data from the sampling round showing the highest concentration are considered representative of the leaching concentration (if contamination can be excluded).
2. statistical analysis of the data from individual fields. Common statistical tools are used to compare field (average) values to the threshold value of 0.1µg/l. Confidence intervals are calculated to examine the likelihood of data to be below the threshold level.
3. comparison of the results with values predicted by the model for the selected individual soils. This comparison gives insight in the performance of the model to predict leaching under practical circumstances. Site specific data are used as much as possible for the simulations.
4. statistical comparison of measured values for the dataset as a whole. The selected fields collectively should be representative of the critical soil situation (90th percentile). This step evaluates whether the threshold value is exceeded under the environmental
conditions that occurred following the applications. Confidence intervals are calculated to examine the likelihood of data to be below the threshold level.
5. in case of examining the influence of discriminating factors, an ANOVA analysis may be performed to investigate whether the factors are significant.
6. evaluation of the study period in view of the long-term climatic conditions of the area of interest. The weather conditions at the sampled locations in between application and sampling may be not representative of average conditions at the sampling sites (too dry or too wet). This step should evaluate whether concentrations under average long-term climatic conditions comply with the legal criterion. Modeling for the individual sites, considering long-term weather series may be part of this evaluation. The results of step 3 are used in this evaluation in a similar manner as in the interpretation of field and
lysimeter studies (Verschoor et al., 2002).
This series of evaluation steps should also be performed when all analytical analyses resulted in quantities below LOQ or LOD. Monitoring performed under dry conditions may lead to
the conclusion that the risk for leaching is still not addressed clearly. Continuation of the study will probably be requested.
The steps together should provide sufficient confidence whether the legal requirement in the uppermost groundwater is met. The null hypothesis to be tested is that the 90th percentile in space of long term average concentration is above 0.1 µg/L. Proper field selection is crucial in this procedure.
4.3
Interpretation of deeper groundwater monitoring data
Monitoring of deeper groundwater is positioned at the end of the decision tree. This means that in earlier steps information was insufficient to conclude that leaching to groundwater is expected to comply with the requirement. As an ultimate decision will be based on the results, it is crucial that samples are representative for the leaching of the substance to the depth of around 10 m.
Groundwater flow is usually complex and therefore it is hardly possible to establish
relationships between the area of infiltration and the filter where the sample is taken. Deeper groundwater is mostly monitored via permanent wells that are not specifically installed for the program under consideration. A proper selection of the wells (see chapter 3.3) is essential for the correct interpretation. The samples collectively should represent the situation at around 10 m depth in infiltrating areas.
From the criteria used for monitoring well selection irrelevant sample results should have been prevented. In the evaluation phase a closer look at the origin of the data again might be necessary to remove irrelevant results. The following results should be excluded from the final evaluation:
False negatives -possible inflow of clean water into the well, either from flow along the well pipe or from infiltration from surface water.
-well water in contact with sorbing materials. False positives -preferential flow along the well pipe.
-inflow of contaminated runoff water.
Non-relevant negatives -sampled groundwater older than pesticide is on the market. -not enough use of pesticide in the intake area of the well Non-relevant positives -possible spill locations in the neighbourhood (tank fill,
depot)
-other non-label uses in the surroundings of the well.
If the wells were selected properly, only a statistical analysis is necessary to determine whether the legal criterion is met. The null-hypothesis to be tested is that the 90th percentile of all relevant wells is above 0.1 µg/L. The analysis should demonstrate that the null hypothesis has to be rejected.
Meinardi (1994), Uffink and Van der Linden (1998), Van der Linden and Uffink (1998) and Van der Linden et al, (1999)showed that groundwater at 10 m depth in infiltration areas can vary significantly in age and still has preserved much of the variability in concentrations that occurred in the top layer of the groundwater. The infiltration pattern in space and time can still be recognised at the depth of 10 m. Diffusion and dispersion in the groundwater occurs,
but the effect is still limited at the depth of 10 m. As a result differences from variability in long term climatic conditions will be accounted for in the sample population. Complete mixing of water of different age and infiltrated at different locations occurs in abstraction wells. Raw water from abstraction wells will usually be a mixture of water leached from a number of fields and over a period of several decades. Samples of abstracted water are therefore not suitable for evaluating groundwater contamination. The age of the samples will cover a wide range (Meinardi, 1994, Uffink and Van der Linden, 1998).
If, for some reason, the total area in which the substance possibly infiltrates is not covered, an extrapolation might be necessary. Differences in vulnerability between the different areas should then be accounted for. This analysis might render the dataset insufficient to reach a conclusion. In case of examining the influence of discriminating factors, an ANOVA analysis might be performed to investigate whether the factors are significant.
In the course of time the total dataset to be used for the evaluation might grow as data from more monitoring studies become available. Datasets can be joined as long as data meet the selection criteria mentioned in Chapter 3. Data from the same filter should be examined whether these can be considered to be independent. This will be the case when the time elapsed between the samplings is more than one year.
5.
Summarising monitoring studies
5.1
Evaluating non-specific monitoring data
Monitoring data may become available from studies that are not specifically designed for registration purposes or regular control activities, for instance control series of drinking water companies. These data can be taken into account, provided they fulfil criteria that are also posed on specifically designed studies. Data for the upper groundwater should then be taken into account when evaluating the leaching to upper groundwater; data for groundwater around 10 m depth can be added to the database, thus becoming members of the total population.
Data not fulfilling the criteria should be disregarded when there is evidence that they originate from contamination or non-GAP use of the plant protection product. If there is no evidence of contamination such data have a signal-function. The registration authority will evaluate the data in view of the total dossier and decide whether additional information is necessary.
5.2
Quality of studies
Whether individual data, a study or a program can be used for registration evaluation depends on the quality of the study; only studies fulfilling minimal quality criteria are taken into account. Determination of the quality of a study is therefore one of the first steps in the evaluation procedure. The quality of a study is the result of the reliability and the completeness of the study. Assigning a quality index to study reports when they are summarised is part of the quality system at RIVM-SEC. The general methodology is described in Mensink et al. (1995). Three quality classes are distinguished:
Q1 study is complete, verifiable and reliable and contains all the information needed for interpretation of the results.
Q2 study does not meet all the requirements, but the most essential data are present. Q3 essential information is missing or improper methods have been used. The results can
not be interpreted.
Here, the quality criteria with regard to monitoring studies are given. Many of them are taken from NEN-ISO 5744, 5745, 5667-3 and 5667-13. Most of the criteria are applicable to both monitoring of upper groundwater and monitoring of deeper groundwater.
The quality of monitoring data depends on the following criteria for the individual measurements:
- all materials used are inert to the measured compound;
- the well is constructed and installed in such a way that samples are taken from the desired depth; no preferential flow along the tube is possible;
- no water from another location is used for the installation of wells;
- at the installation of the well the soil profile is disturbed to a minimum and soil layers are not mixed up;
- contamination of the well with top-soil material is excluded;
- sample taking is completely traceable and cross contamination is avoided;
- all sampling materials are pre-rinsed with the groundwater before the actual sample is taken;
- before use, sample bottles are washed to ensure that they are absolutely clean with respect to the chemical under investigation;
- possibility of contamination through filter paper is excluded;
- the removal rate of groundwater should not be too high to avoid withdrawal of water from other than the desired depths;
- transport and storage (if applicable) of samples does not affect the concentration of the analyte;
- the water content of a ((semi-)permanent) filter is refreshed at least 3 times before the sample is taken;
- sampling and analysis are performed according to the principles of Good Laboratory Practice (OECD, 1998 and OECD 1999);
- methods of analysis are adequate and include a confirmatory method and a number of control samples (analysis blanks, field blanks, equipment blanks, trip blanks, recovery samples at the limit of quantification and at the 0.1 µg/L level, (field) duplicates);
- the limit of quantification is at or below the 0.1 µg/L criterion, the coefficient of variation at this level should be better than 25%
Besides checking the information on sample taking and handling individual samples, the study is checked for quality and completeness of other information:
- a literature review of other monitoring data on the same compound, including data from other countries with comparable environmental conditions;
- a description of the field at which the samples were taken (soil type, soil profile, crops, drains, ditches);
- history of the field (crops, other pesticides used, cultivation, water management measures) for at least a period of 5 years; this information may be summarised; - the number of individual samples taken if analyses were performed for combined
samples;
- the agricultural use of the pesticide on the field (application rates, application period, method of application);
- climatic conditions for the period between application and sampling. Long term averages for precipitation and temperature and detailed information (daily, weekly) for
precipitation and temperature;
- the selected simulation model, together with a full listing of input parameters; - the statistical methods used for the analyses.
A report on deeper groundwater monitoring should contain:
- a description of the area where filters are located (soil type, main crops, slopes, water discharge from the area);
- the agricultural use of the pesticide in the intake area;
- global history of the intake area (main crops, history of agricultural use); - groundwater flow patterns in the surroundings of the filter;
- climatic conditions for the region. Long term averages for precipitation and temperature - other possible sources of groundwater contamination;
- changes in hydrology in the area.
5.3
Summary of a monitoring study
Full reports of studies are to be supplied to the registration authority. During the evaluation usually an extended summary of the study is prepared, stating the results of the study and all information relevant for quickly getting an overview by decision takers. Results of the monitoring program must not be reported as results of the analyses only. The evaluation of the full study has to be done by an expert, who also writes the extended summary.
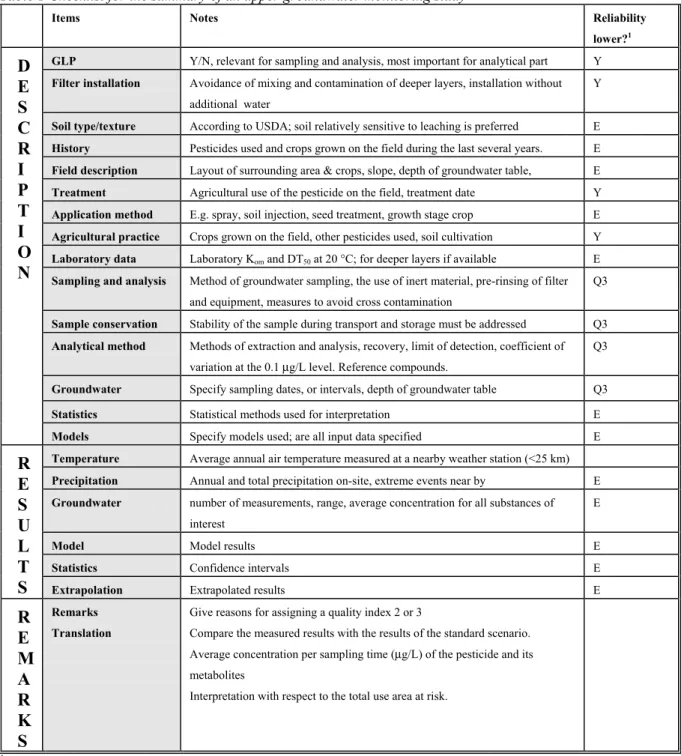
Table 5.1 gives a checklist of items that should be described in the extended summary. The table does not provide guidance for the strategy and performance of a monitoring study; for this one is referred to Chapter 3. The last column provides a checklist for judging the quality of the study.
If one essential item receives a Q3 the whole study will be assigned Q3. However, there are many items which can have a lower quality but do not affect interpretation. These items are indicated with Y. If one item receives a Y, the whole study will be assigned Q2. If several items receive a Y, Q3 should be assigned to the study as a whole, because there are too many uncertainties to make the study reliable enough for interpretation.
Table 1 Checklist for the summary of an upper groundwater monitoring study
Items Notes Reliability
lower?1
GLP Y/N, relevant for sampling and analysis, most important for analytical part Y
Filter installation Avoidance of mixing and contamination of deeper layers, installation without additional water
Y
Soil type/texture According to USDA; soil relatively sensitive to leaching is preferred E
History Pesticides used and crops grown on the field during the last several years. E
Field description Layout of surrounding area & crops, slope, depth of groundwater table, E
Treatment Agricultural use of the pesticide on the field, treatment date Y
Application method E.g. spray, soil injection, seed treatment, growth stage crop E
Agricultural practice Crops grown on the field, other pesticides used, soil cultivation Y
Laboratory data Laboratory Kom and DT50 at 20 °C; for deeper layers if available E
Sampling and analysis Method of groundwater sampling, the use of inert material, pre-rinsing of filter and equipment, measures to avoid cross contamination
Q3
Sample conservation Stability of the sample during transport and storage must be addressed Q3
Analytical method Methods of extraction and analysis, recovery, limit of detection, coefficient of variation at the 0.1 µg/L level. Reference compounds.
Q3
Groundwater Specify sampling dates, or intervals, depth of groundwater table Q3
Statistics Statistical methods used for interpretation E
D E S C R I P T I O N
Models Specify models used; are all input data specified E
Temperature Average annual air temperature measured at a nearby weather station (<25 km)
Precipitation Annual and total precipitation on-site, extreme events near by E
Groundwater number of measurements, range, average concentration for all substances of interest
E
Model Model results E
Statistics Confidence intervals E
R E S U L T
S Extrapolation Extrapolated results E
R E M A R K S Remarks Translation
Give reasons for assigning a quality index 2 or 3
Compare the measured results with the results of the standard scenario. Average concentration per sampling time (µg/L) of the pesticide and its metabolites
Interpretation with respect to the total use area at risk.
1 E=expert judgement, Y=reliability is lower and Q
≠1 if item is not reported or is not according to guidance, Q3 is given when this item is not reported.
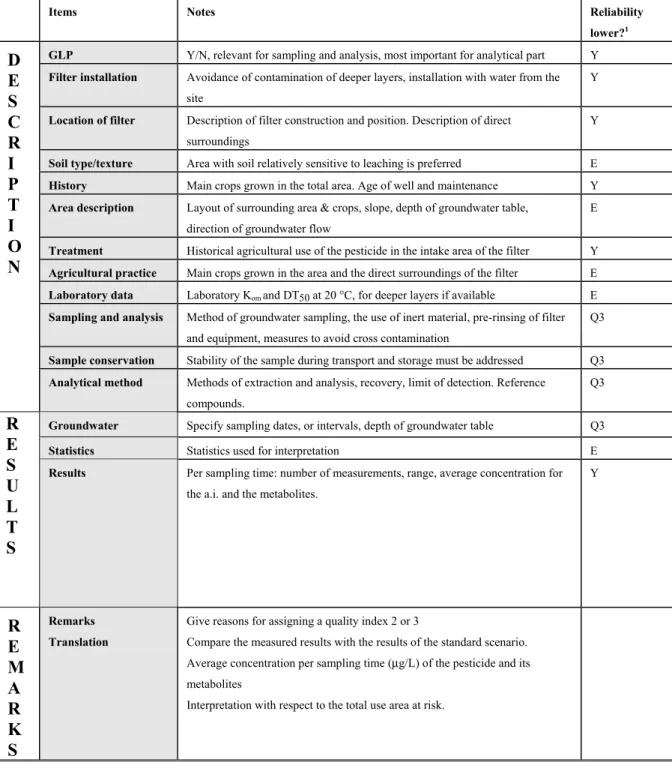
Table 2 Checklist for the summary of a deeper groundwater monitoring study
Items Notes Reliability
lower?1
GLP Y/N, relevant for sampling and analysis, most important for analytical part Y
Filter installation Avoidance of contamination of deeper layers, installation with water from the site
Y
Location of filter Description of filter construction and position. Description of direct surroundings
Y
Soil type/texture Area with soil relatively sensitive to leaching is preferred E
History Main crops grown in the total area. Age of well and maintenance Y
Area description Layout of surrounding area & crops, slope, depth of groundwater table, direction of groundwater flow
E
Treatment Historical agricultural use of the pesticide in the intake area of the filter Y
Agricultural practice Main crops grown in the area and the direct surroundings of the filter E
Laboratory data Laboratory Kom and DT50 at 20 °C, for deeper layers if available E
Sampling and analysis Method of groundwater sampling, the use of inert material, pre-rinsing of filter and equipment, measures to avoid cross contamination
Q3
Sample conservation Stability of the sample during transport and storage must be addressed Q3
D E S C R I P T I O N
Analytical method Methods of extraction and analysis, recovery, limit of detection. Reference compounds.
Q3
Groundwater Specify sampling dates, or intervals, depth of groundwater table Q3
Statistics Statistics used for interpretation E
R E S U L T S
Results Per sampling time: number of measurements, range, average concentration for the a.i. and the metabolites.
Y R E M A R K S Remarks Translation
Give reasons for assigning a quality index 2 or 3
Compare the measured results with the results of the standard scenario. Average concentration per sampling time (µg/L) of the pesticide and its metabolites
Interpretation with respect to the total use area at risk.
E=expert judgement, Y=reliability is lower and Q≠1 if item is not reported or is not according to guidance, Q3 is given when this item is not reported.
6.
Conclusions
In the evaluation of registration of plant protection products, results of monitoring studies on leaching can be included. In the decision tree leaching, which forms the framework for the evaluation process, the position of monitoring studies is at the end of the second tier (shallow groundwater monitoring) and at the end of the third tier (deep groundwater monitoring). The results of monitoring studies are therefore decisive (the final decision); the results of
monitoring studies may overrule decisions of all earlier steps in the evaluation.
Usually monitoring is invoked when earlier steps in the evaluation indicate a possibility of leaching above the critical / legal level. Plant protection products can then only be admitted if there is convincing evidence that, under practical circumstances the substance and / or its relevant metabolites do not leach above this level. This position of monitoring studies requires utmost quality of study design, site selection, sample taking, analysis and
interpretation. Data or studies not having such high quality can not be used in the evaluation process.
References
Aden, K., R. Binner, R. Fischer, D. Gottschild, R. Kloskowski, K. Schinkel und B. Michalski, 2002. Schutz des Grundwassers vor Pflanzenschutzmitteleinträgen: Leitlinie zur
Aufklärung von Funden und zur Durchführung von zulassungsbegleitenden
Monitoringstudien. Nachrichtenblatt Deutschen Pflanzenschutzdienst, 54 (5), 125-129. Boland J., S.Q. Broerse, A.A. Cornelese, A.M.A. van der Linden, R.A. Baumann, W. de
Graaf and H.A.G. Heusinkveld. 1995. Monitoring of ETU in the uppermost
groundwater below flower bulb and potato fields in the Netherlands in 1993. RIVM report 715801003. Confidential.
Brouwer, W.W.M., van Vliet P.J.M., Linders, J.B.H.J., van de Berg, R., 1993. Environmental risk assessment for plant protection products: The Dutch approach. Environmental Outlook 4: 30-35.
BUB, Rumb 2000. Regeling uitvoering milieutoelatingseisen bestrijdingsmiddelen 2000, VROM DGM/DWL/2000042634, Directie Drinkwater, Water en Landbouw, in Dutch. Cornelese A.A. and A.M.A. van der Linden. 1998. Monitoring bentazone concentrations in
uppermost groundwater after late season applications. RIVM report 714801021 EU, 1997 Council Directive 97/57/EC of 22 September 1997 establishing Annex VI to
Directive 91/414/EEC concerning the placing of plant protection products on the market.
FOCUS, 2000. Boesten J., Businelli M., Delmas A., Gottesbüren B., Hanze K., Jarvis T., Jones R., Klein M., Linden T. van der, Rekolainen S., Resseler H., Roquero C., Maier W-M., Styczen M., Thorsen K., Travis K., Vanclooster M. 2000. FOCUS groundwater scenarios in the EU review of active substances. Brussels, Sanco/321/2000
Gooddy, D.C., J.P. Bloomfield, P.J. Chilton, A.C. Johnson and R.J. Williams. Assessing herbicide concentrations in the saturated and unsaturated zone of a chalk aquifer in Southern England. Groundwater, 2001, Vol.39, No.2.
Handleiding voor de toelating van bestrijdingsmiddelen, versie 0.2. College voor toelating van bestrijdingsmiddelen, mei 2002. Manual for the registration process of pesticides. Version in English May 2003, http:/www.ctb-wageningen.nl
Johnson, A.C., T.J. Besien, C. Lal Bhardwaj, A. Dixon, D.C. Gooddy, A.H. Haria and C. White. Penetration of herbicides to groundwater in an unconfined chalk aquifer following normal soil applications. Journal of Contaminant Hydrology, 53, 2001. Jones, R.L. and T.L. Estes (1995). Summary of aldicarb monitoring and research programs in
Jones, R.L., A.G. Hornsby, P.S.C. Rao and M.P. Anderson. Movement and degradation of aldicarb residues in the saturated zone under citrus groves on the Florida ridge. Journal of contaminant hydrology, 1, 1987.
Loewy, M., V. Kirs, G. Carvajal, A. Venturino and A.M.Pechen de Dángelo. Groundwater contamination by azinphos methyl in the Northern Patagonic region (Argentina). The Science of the Total Environment, 225, 1999.
NEN-ISO 5667-3, 1994. Guidance on preservation and handling of samples.
NEN-ISO 5667-14, April 1996. Guidance on quality assurance of environmental water sampling and handling.
NEN 5744 Bodem: Monsterneming van grondwater ten behoeve van de bepaling van metalen anorganische verbindingen, matig vluchtige organische verbindingen en fysisch
chemische eigenschappen. 1991, in Dutch.
NEN 5745 Bodem: Monsterneming van grondwater ten behoeve van de bepaling van vluchtige verbindingen. 1997, in Dutch.
OECD, Environment directorate, 1998. OECD Principles on good laboratory practice. OECD, Environment directorate, 1999. The application of GLP principles to field studies. Leistra, M. and J.H. Smelt. 2001. An appraisal of methods for measurement of pesticide
transformation in the groundwater zone. Pest Manag. Sci. 57 (2001), 4: 333-340. Meinardi C.R. 1994. Groundwater recharge and travel times in the sandy regions of the
Netherlands. RIVM report 715501004.
Mensink, B.J.W.G., M. Montforts, L. Wijkhuizen, H. Tibosch and J.B.H.J. Linders (1995). Manual for summarising and evaluating the environmental aspects af pesticides. RIVM-report 679101022.
Mills, M.S. and N.D. Simmons (1998) Assessing the ground-water contamination potential of agricultural chemicals: a flexible approach to mobility and degradation studies.
Pesticide Science, 54, 418-434.
Rudolph, D.L., D.A.J. Barry and M.J. Goss (1998). Contamination in Ontario farmstead domestic wells and its association with agriculture: 2. Results from multilevel monitoring well installations. Journal of contaminant Hydrology, 32, 295-311.
Tiktak A, D.S. de Nie, A.M.A. van der Linden and R. Kruijne. 2002. Modeling the leaching and drainage of pesticides in the Netherlands: The GeoPEARL model. Agronomie (4), 373 - 387.
Uffink G.J.M. and A.M.A. van der Linden. 1998. Dilution of pesticides in groundwater during advective dispersive transport. RIVM report 716601002.
Van der Linden A.M.A. and G.J.M. Uffink. 1998.Dilution of pesticides in groundwater during advective dispersive transport. Proceedings of XI Symposium on Pesticide Chemistry, 463 - 472
Van der Linden A.M.A., C.G.E.M. van Beek, J.J.T.I. Boesten, M. Leistra, C.R. Meinardi, L.M. Puijker 1999. Beoordeling van het gedrag van bestrijdingsmiddelen in de verzadigde zone van de bodem. RIVM rapport 715801005, in Dutch.
Van der Linden A.M.A., A Tiktak, J.J.T.I. Boesten, R. Kruijne. 2002. Further development of national groundwater scenarios in the Netherlands. Presentation at the EU modeling workshop, Lisboa, June 6, 2002. Available at http:/www.alterra.nl/models/pearl. Van der Linden A.M.A. and J.J.T.I. Boesten. 2002. Use of results of lysimeter studiesin EU
and Dutch decision trees. Presentation at International PostgraduateTraining "Modeling of pesticide fate in the environmentfor EU and national registration". Wageningen, November 4 - 6.
Van der Linden A.M.A., J.J.T.I. Boesten, A.J. Verschoor, M. Leistra, J.B.H.J. Linders, A.A. Cornelese and J.W. Pol. 2003, in prep. New decision tree for the evaluation of the leaching of pesticides in the Netherlands. RIVM, Alterra, CTB report.
Verschoor A.J., J.J.T.I. Boesten, M. Leistra, A.M.A. van der Linden and J.W.W. Pol, 2001. Evaluation of pesticide leaching in lysimeter and field studies; parent substances. RIVM report 601506007/2001.
Wade, H.F., A.C. York, A.E. Morey, J.M. Padmore and K.M. Rudo (1998). The impact of pesticide use on groundwater in North Carolina. Journal of Environmental Quality, 27, 1018-1026.
Appendix A Monitoring study with a large number of
fields.
The total number of fields to be selected is large; 100 or more.
Field selection.
Fields are selected on which the chemical was recently used or on which the chemical will be used in course of the project. Fields are selected in such a way that they represent the use area of the pesticide. Selection is based on:
• soil type and soil profile characteristics (a.o. soil texture, soil organic matter and soil pH of the different horizons), may be derived from soil maps;
• groundwater depth, may be derived from maps.
The selected fields should be evenly distributed over the total soil population. One should be sure that vulnerable soils are properly represented in the selection. The selection of the fields should be described. Calculations on potential leaching might be included in the selection procedure.
If the applicant wishes to include discriminating factors (for example soil type or crop) then the number of fields should be enlarged accordingly and a sufficient and representative population of data for each of the conditions should be established.
Sampling
Groundwater samples are taken approximately in the top meter below the groundwater table. A layer of 1 m thick approximates the yearly groundwater recharge. Semi-permanent or occasional wells are installed for sampling. To avoid the risk of missing the leaching peak, sampling should be performed on more than one occasion in time. Three sampling times are preferred, a) before the peak concentration is expected to reach the groundwater, b)
approximately at the time of the maximum expected concentration in the groundwater and c) at a time after the peak concentration has passed. The position of the leaching peak can be estimated using a simulation model, for a relative vulnerable soil profile and average values for DT50 and sorption of the pesticide as input values. Preferably several groundwater samples are taken on each field in order to arrive at more representative field averages, however one random sample per field could be accepted.
Variability within a field is not included in such a monitoring program . For this kind of monitoring the number of data (fields) has to be large to be able to perform analysis of variance and to obtain a confidence interval for the results. The presence of residues in the groundwater at the start of the study makes the interpretation of the results more difficult.
Analysis
Analysis is not different from the analysis in the design given in chapter 2.
Interpretation
The interpretation will usually be different because less information is available. All fields, however, should have received an application of the chemical of interest. Furthermore, it should be demonstrated that the moment of sampling was correct; i.e. the sample should give a representative value of the average concentration in the recharge water. Interpretation then includes:
1. statistical analysis in order to find out whether the critical value is met (including calculation of confidence intervals);
2. evaluation of the study period in view of the long-term climatic conditions of the area of interest.
Including discriminating factors is possible, but again the number of required samples will increase. Also here the selection of fields is important; the selected fields should together represent the use of the plant protection product.
Analysis of variance is the statistical method to address differences in concentrations among wells. When more than two sets of data are compared the appropriate statistical method is an ANOVA.
Statistical analysis gives insight in the confidence level of the concentration on a field scale. Variation within a field is included in the analysis. Statistical analysis of field means gives insight in exceeding the threshold value of all fields or use categories. The variability between field means gives information about variation between fields.
Appendix B Glossary
ANOVA: ANalysis Of VAriance.
Agrochemical: chemical used in agriculture to optimise harvest.
Confidence interval: range of values that are valid according to the statistical test performed. BUB: Besluit Uniforme Beginselen gewasbeschermingsmiddelen. Incorporation of the
Uniform Principles in the Dutch law on pesticides. Deeper groundwater: groundwater at a depth of around 10 m.
DT50: Transformation half-life of a substance. Throughout the text DT50 refers to the
transformation half-life in top soil under reference conditions (20 °C, pF = 2).
GAP: Good Agricultural Practice In the context of this report GAP means that pesticides are applied according to the label instructions and therefore includes the non-agricultural use when this is in agreement with the registration.
GLP: Good Laboratory Practice (OECD, 1998).
Kom: sorption constant of a pesticide to organic matter. LOD: Limit Of Detection.
LOQ: Limit Of Quantification.
PF: negative logarithm of the soil moisture pressure; pF = 2 equals a moisture pressure of –100 cm water (-104 Pa).
PPP: plant protection product also pesticide.
RIVM-SEC: formerly known as RIVM-CSR Centre for Substances and Risk Assessment. Rumb: Regeling uitvoering milieutoelatingseisen bestrijdingsmiddelen. Dutch guidance on
the environmental criteria for the authorisation of pesticides.
Uppermost groundwater: The top meter of the groundwater, not deeper than 5 m below soil surface.