National Institute for Public Health and the Environment
P.O. Box 1 | 3720 BA Bilthoven www.rivm.com
The Euro emission standards for cars
and trucks in relation to NO
2limit value
exceedances in the Netherlands
RIVM Letter report 680363001/2013 G.J.M. Velders et al.
Colophon
ISBN: © RIVM 2013
Parts of this publication may be reproduced, provided acknowledgement is given to: National Institute for Public Health and the Environment, along with the title and year of publication.
G.J.M. Velders
,
RIVM J. Wesseling,
RIVM G.P. Geilenkirchen,
PBL N.E. Ligterink,
TNOContact: Guus Velders M&V/MIL/L&E
guus.velders@rivm.nl
This investigation has been performed by order and for the account of Ministry of Infrastructure and the Environment, within the framework of Project GCN-maps.
Rapport in het kort
Aantal overschrijdingen NO2-grenswaarde deels gevolg van
tegenvallende verkeersemissies
Sinds de jaren negentig van de vorige eeuw gelden zogeheten Euro-normen voor personenauto’s en vrachtwagens om de uitstoot van luchtverontreinigende stoffen te verminderen. Uit nationaal en internationaal onderzoek is gebleken dat de feitelijke emissie van stikstofoxiden (NOx) door verkeer minder daalt dan
volgens de Euro-normen voor auto’s werd verwacht. De grenswaarde voor stikstofdioxide (NO2) in de buitenlucht wordt in 2015 in Nederland volgens de
huidige berekeningen op circa 150 locaties overschreden. Er zouden in 2015 vrijwel geen overschrijdingen zijn als de feitelijke uitlaatemissies van
personenauto's en vrachtwagens zo sterk zouden zijn gedaald als volgens de Euro-normen de bedoeling was. De onzekerheid in de schatting van het aantal locaties is overigens groot omdat honderden locaties net onder of net boven de grenswaarde liggen. Dit onderzoek is uitgevoerd door het RIVM, het Planbureau voor de Leefomgeving (PBL) en TNO.
De Euro-normen zijn belangrijke instrumenten in Europa om de concentraties stikstofdioxide onder de grenswaarde te brengen. Ze zijn door de jaren heen steeds strenger geworden. Om te controleren of de uitlaatgassen van auto’s voldoen aan Euro emissie-eisen, worden ze onder laboratoriumomstandigheden getest. De afgelopen jaren is gebleken dat personenauto’s en vrachtwagens rijdend op diesel in de praktijk meestal veel meer stikstofoxiden uitstoten dan op basis van de laboratoriumtests werd verwacht.
Dit effect heeft ook invloed op de totale uitstoot van stikstofoxiden in Nederland. Volgens de verwachte emissies zou de totale stikstofoxidenuitstoot van het wegverkeer in 2015 in Nederland ongeveer 50 miljoen kilogram zijn. Op basis van de feitelijke emissies wordt dat getal 50 procent hoger geschat, ongeveer 74 miljoen kilogram.
Abstract
Number of exceedances NO2 limit value partly due to higher than
expected traffic emissions
Since the 1990s, the Euro standards are in effect to reduce the exhaust emissions of air pollutants of passenger cars and trucks. National and
international research has shown that the actual emissions of nitrogen oxides (NOx) by traffic decrease less than was expected from the Euro standards. The
limit value for nitrogen dioxide (NO2) is expected to be exceeded at
approximately 150 locations (15 km road length) in the Netherlands in 2015. If the actual exhaust emissions from passenger cars and trucks had decreased as was expected based on the Euro standards, there would be virtually no
exceedances anymore in 2015. The uncertainty in the estimates is large, because at hundreds of locations the concentrations are just above or below the limit value. This study was conducted by RIVM, the Netherlands Environmental Assessment Agency (PBL) and TNO.
The Euro standards are important tools in Europe to bring the nitrogen dioxide concentrations below the limit value. They have become increasingly stringent over the years. To check whether the emissions of cars meet the Euro emission standards, they are tested under laboratory conditions. The past few years have shown that diesel passenger cars and trucks in practice usually emit more nitrogen oxides than was expected based on the laboratory tests.
The less than expected reductions in exhaust emissions also affect the total nitrogen oxide emissions in the Netherlands. If these emissions would have been as low as was expected, projected total nitrogen oxide emissions of road traffic would be about 50 million kg in the Netherlands in 2015. Based on actual emissions that estimate is 50 percent higher, about 74 million kilograms.
Contents
1
Introduction−7
2
Euro emission standards−8
2.1
European Union emission standards for light and heavy-duty vehicles−8
2.2
Type approval and real-world NOx emissions of diesel vehicles−9
2.3
Emission factors used in this study−12
3
NO2 concentrations and limit value exceedances−15
4
References−18
Summary
Emissions from road traffic determine to a large extent the NO2 concentrations
at ground level. At many locations in Europe the NO2 concentrations exceed the
limit value of 40 µg m-3 for the annual average. In the Netherlands the NO 2 limit
values must be adhered to everywhere in 2015, but it is estimated that there will be about 150 locations (or 15 km road length)1 where the limit values will still be exceeded in 2015.
The Euro standards for the exhaust emissions of passenger cars and light- and heavy-duty vehicles are important instruments in Europe to reduce the NOx
emissions from road traffic and to bring the NO2 concentration levels below the
limit value. The exhaust emissions must comply with the Euro standards during type approval tests under laboratory conditions and the legislative text suggests that similar emissions must occur under all normal driving conditions. But, it has been shown several times already that the NOx emissions of diesel-powered
vehicles during real-world driving conditions are significantly higher than expected based on the type approval tests. The present study reports how significant the NO2 concentrations and exceedances of limit values are affected
by the higher than expected NOx emissions from road traffic.
If the NOx emissions during real-world driving conditions of Euro-1 to -5
passenger cars and light-duty vehicles and Euro-I to -V heavy-duty vehicles would be as low as was expected from the type approval tests there would be virtually no locations left anymore in the Netherlands where the limit values will be exceeded in 2015.
The first measurements on Euro-6 diesel passenger cars indicate that their NOx
emissions during real-world driving conditions are higher than was expected from the type approval tests (Section 2.2). This is not taken into account in the present study, but if confirmed by measurements on more cars, it may slightly increase the number of locations (or road length) with exceedance of the limit value in 2015.
The uncertainty in the expected number of exceedances, however, is large. Taking uncertainties into account may result in no exceedances in 2015 in the reference case, but may also increase the projected number of locations by as much as a factor of ten.
If the NOx emissions of passenger cars and heavy-duty vehicles would have
complied with EU emission standards under real-world driving conditions, projected NOx emissions of road traffic would be about 50 million kg in the
Netherlands in 2015. The current projection is 50% larger, with 74 million kg.
1 This is based on a calculation without the NSL specific corrections for IJmond, Schiphol and Rotterdam and
1
Introduction
In the European Union there is a limit on the annual average concentration of nitrogen dioxide (NO2) in the air of 40 µg m-3. This limit value is exceeded at
many locations in Europe. The concentrations must be below2 this limit value in the Netherlands in 2015 (EU, 2008). The number of locations (or road length) in the Netherlands where the NO2 concentrations are above the limit value has
declined over the past 10 years, but it is expected that concentrations will still exceed the limit value at a limited number of locations in 2015 (Van Zanten et al., 2013). These locations lie mostly in busy streets in major cities in the Randstad, i.e. in Amsterdam, Rotterdam, The Hague and Utrecht. The Dutch Government has adopted a comprehensive programme, the ‘National air quality collaboration programme’ (NSL) (VROM, 2008), which is aimed to ensure adherence to air quality limit values, everywhere in the Netherlands, in time. The programme comprises national as well as local measures. Attainability of the air quality limit values, in time, within the Netherlands, depends not only on national and local measures, but also on European measures to reduce emissions in the Netherlands and in other European countries.
The observed decrease in NO2 concentrations and in limit value exceedances can
be attributed to decreases in emissions of nitrogen oxides (NOx) in the
Netherlands and surrounding countries. Important for local NO2 concentrations
are the NOx exhaust emissions from passenger vehicles and light-duty trucks
(Euro-1 to Euro-6 emission standard categories, (EC, 2007)), and from heavy-duty vehicles (Euro-0 to Euro-VI (EC, 2009)). The emission standards should progressively reduce exhaust emissions, and are the most important tools for improving the air quality in cities and along motorways.
In the past decade it has become clear that the emissions from both diesel powered passenger cars and heavy-duty vehicles during real-world driving conditions are significantly higher than expected based on the emission tests during type approval of the vehicles (see for example, Velders et al., 2011, Weiss et al., 2011, Ligterink et al., 2012a). This is the case for almost all Euro standards (-1 to -5) and driving conditions (urban, rural and motorways). Local NO2 concentrations are affected by the higher than expected emissions of cars
during real-world driving conditions as compared to the emissions based on the type approval tests. It is likely that local NO2 concentrations and the number of
locations where limit values are exceeded would have been lower in many countries in Europe if the real-world emissions of cars and trucks had been reduced in line with the increasingly stringent Euro standards.
We report here how many exceedances of the NO2 limit values would be
expected in 2015 if the NOx emissions of passenger cars and light- and
heavy-duty trucks would comply with the Euro-1 to -6 and Euro-I to -VI emissions standards during real-world driving conditions. To answer this the same
methods and input data are used as for the official monitoring of the progress of the NSL (Velders et al., 2013; Van Zanten, 2013).
2
Euro emission standards
2.1 European Union emission standards for light and heavy-duty vehicles New road vehicles sold in the EU must comply with European emission standards for several air polluting substances. In order to confirm compliance with these standards, the type approval of new vehicle types includes standardized laboratory emissions testing.
Emissions of light-duty vehicles, i.e. passenger cars and light commercial vehicles (LCVs), have been regulated in the EU since the 1970s. In the early nineties, the so-called Euro standards were introduced, including a type-approval procedure to confirm compliance of new vehicles with the standards. The Euro standards apply to all new passenger cars and LCVs with a gross vehicle weight below 3500 kg. Different standards were introduced for positive ignition (e.g., petrol and LPG) and for compression ignition (diesel) vehicles. In subsequent years, more stringent emission standards were implemented. New emission standards are usually introduced first for passenger cars and the smallest LCVs. Larger LCVs (Class II and III) have to fulfill the new requirements typically a year later. Furthermore, the larger LCVs have less stringent emission limits.
Currently, new passenger cars and LCVs must comply with the Euro-5 emission standards. Euro-5 became effective starting September 2009 for new passenger cars that were first introduced on the EU market. Starting 2011, all newly sold passenger cars must comply with the Euro-5 standards. The Euro-5 standards for larger LCVs became effective a year later. Euro-6 standards have already been agreed upon and come into force starting September 2014 for new passenger cars first introduced onto the EU market. Currently, the first Euro-6 passenger cars are already available for a few makes and models.
Since 1990, the test cycle used for the type approval of passenger cars and LCVs has remained more or less the same. The New European Driving Cycle (NEDC) that was introduced in the year 2000, only included a change in the cold-start procedure compared to the previously used test cycle that was introduced in 1990: the 40 seconds idling period prior to the test was removed. The NOx emission limits of light-duty diesel vehicles have been approximately
three times those of petrol vehicles. Only with the introduction of the Euro-5 (100 mg/km for petrol versus 180 mg/km for diesel) and Euro-6 (60 mg/km versus 80 mg/km) standards the gap between petrol and diesel for NOx
emissions has been closing. The emission limits of heavy LCVs (typically diesel) are less stringent: 125 mg/km instead of 80 mg/km for Euro-6.
Emissions from diesel engines used in heavy-duty vehicles, with a gross vehicle weight over 3500 kg, have been regulated by European legislation since 1988. All newly sold heavy-duty trucks and buses in the EU must comply with current emission standards. The emission standards are defined in a series of EU directives staging the progressive introduction of increasingly stringent standards (EC, 2009). The Euro-III emission standard applied to the type approval of new truck engines (officially called heavy-duty diesel engines) from October 2000 onwards, the Euro-IV standard from October 2005 onwards, the Euro-V standard from October 2008 onwards, and the Euro-VI standard from
January 2013 onwards. In between the changes of emission standards with the successive numbers, minor changes in legislation occurred as well. In particular, different phases in Euro-V legislation can be distinguished.
The emission standards, defined by engine power, progressively decrease the NOx emissions from 5.0 g/kWh for Euro-III engines, to 3.5, 2.0, and 0.4 g/kWh
for Euro-IV, -V, and -VI engines, respectively, on the most relevant test cycle: the transient test. These emission standards must be met during type approval engine tests under laboratory conditions.
The type approval procedure for new heavy-duty engines has been adjusted several times. Up until Euro-V, the type approval was based on engine testing using the European Transient Cycle (ETC) and the European Steady-state Cycle (ESC). This procedure was introduced in 2000 with the introduction of the Euro-III standards.
With the introduction of the Euro-VI emission standards, a new test procedure is introduced in the EU emission legislation: the Worldwide Harmonised Heavy-Duty Emissions Certification Procedure. This test consists of two representative test cycles for typical driving conditions in the EU, the USA, Japan and Australia: the World Heavy-duty Transient Cycle (WHTC) and the World Heavy-duty Steady-state Cycle (WHSC). The test procedure is commonly referred to as the WHTC. This new test procedure is an improvement compared to the ETC and ESC tests (Verbeek et al., 2008).
2.2 Type approval and real-world NOx emissions of diesel vehicles
In the past decade it has been shown repeatedly that real-world NOx emissions
of diesel-powered vehicles can be substantially higher than during type approval tests (Hausberger et al., 2003; Rexeis and Hausberger, 2009; Rexeis et al., 2005; Sturm and Hausberger, 2005; Ligterink et al., 2009; Ligterink et al., 2012a, Velders et al., 2011). The type approval procedures for both the light and heavy-duty vehicles are unable to accurately capture the real-world (on-road) emissions of the vehicles. The NEDC, that is currently used for type approval of light-duty vehicles, makes it possible that vehicles comply with emission standards during type approval testing and test circumstances, but substantially exceed the standards during real-world operation. The new light-duty test cycle, the WLTC, will probably not lead to lower emissions. Experience shows that testing circumstances, such as cold start and laboratory
temperature, affects the test results more than the test cycle itself. It might be that emission control in cars is optimized for the narrow band of the NEDC test conditions and it is possible that this will also occur with the new WLTC cycle. More reductions in real-world emissions are expected from the RDE (Real Driving Emission) legislation. This allows for on-road testing by testing authorities and may result in low emissions in all real-world driving
circumstances. This would, e.g., be a “not-to-exceed” limit at about 1.5 times, or 120 mg/km, the limit on the test at 80 mg/km. However, there are signals that different stakeholders strive for allowances, in particular for high-powered vehicles, and motorway driving, which typically allow for more extreme driving styles. The introduction is at the moment planned for 2017, however, the introduction may be in 2020 or later, depending on discussions among member states.
Deriving real-world emission factors for passenger cars, LCVs and heavy-duty trucks under various driving conditions is not straightforward. For example, emission levels of trucks can vary greatly with velocity, work (kWh) and vehicle mass. In the current in-use compliance programs from the Ministry of
Infrastructure and Environment in The Netherlands, heavy-duty vehicles are all tested on the road, no longer as an engine only. For modern trucks, information is also required on actual performance of exhaust gas after-treatment systems. Therefore, a modeling approach is applied to derive real-world emission factors. In the Netherlands, the VERSIT+ emission model is used to derive real-world emission factors for passenger cars (Ligterink and De Lange, 2009) and heavy-duty trucks (Ligterink et al., 2012b) . The VERSIT+ model uses vehicle emission maps to calculate the second-by-second fuel consumption and emissions for different types of vehicles under various driving conditions.
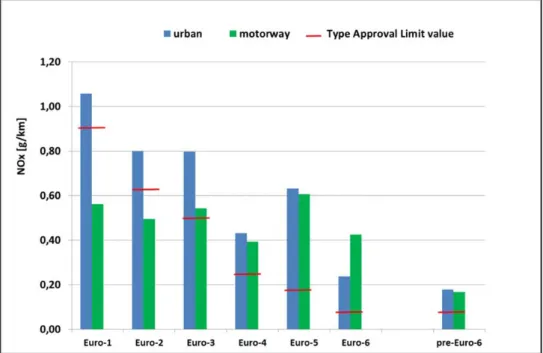
Figure 1 compares the Euro standards for NOx of diesel passenger cars with the
real-world NOx emission factors for typical urban and motorway driving
conditions that are currently used in the Netherlands, as derived by TNO using the VERSIT+ model. The figure shows that in the early stages, NOx emissions of
diesel cars were higher during urban driving than during motorway driving conditions. The emission factors for urban driving conditions exceed the Euro standards, but NOx emissions during typical motorway driving conditions are
below the standards. Starting with Euro-3, the real-world NOx emission factors
for both urban and motorway driving conditions are above the type approval limit value. In later stages, the differences between type approval and real-world emissions increases substantially. Even though the emission standards decreased from 0.5 g/km for Euro-3 to 0.18 g/km for Euro-5, real-world NOx
emissions hardly decreased. The Euro-5 NOx emission factor for motorway
driving conditions is actually higher than the Euro-3 emission factor.
Figure 1 NOx emission limits and the real-world emission factors of diesel
passenger cars for urban driving and motorway conditions. The emission factors relate to the average type of cars and average driving conditions in the
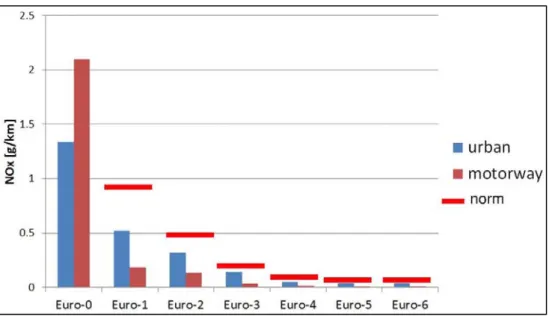
Figure 2 The real-world NOx emission factors of petrol cars from Euro-0 to
Euro-6 for urban driving and motorway conditions. The emission factors relate to the average type of cars and average driving conditions in the Netherlands.
For petrol vehicles, responsible for more than 50% of vehicle kilometers of the light-duty vehicle fleet, the in real-world NOx emission factors are typically far
below the emission limit (Figure 2). The three-way catalyst for stoichiometric engines is a robust after-treatment technology, yielding low emissions in all circumstances.
The type approval procedure of heavy-duty engines used in trucks and buses has similar issues as discussed for diesel passenger cars. The current test procedure does not fully capture the range of driving conditions that is seen in the real world (Lowell and Kamakaté, 2012). As such, real-world emissions can be substantially higher than the emission standards. For example, Verbeek et al. (2010) showed that real-world NOx emissions of Euro-V trucks under urban and
rural driving conditions can be several times higher than the Euro-V emission standard. They conclude that the test procedure, with its relatively high engine loads, does not necessarily lead to low real-world emissions at low vehicle speeds in urban driving.
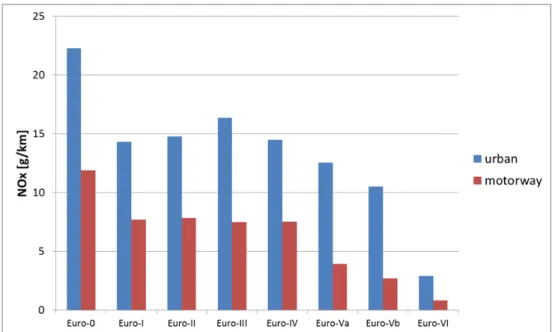
Figure 3 shows the real-world NOx emission factors for tractor-trailer
combinations in The Netherlands, derived by TNO using the VERSIT+ model. Again, NOx emissions are higher during urban driving than during motorway
driving conditions. The figure also shows that real-world NOx emissions hardly
decreased from Euro-I up to Euro-IV, even though the NOx emission standard
decreased from 8 g/kWh to 3.5 g/kWh (on the ESC test).
The first measurements on Euro-VI heavy-duty vehicles show that the NOx
emissions during real-world driving conditions are as low as, or even lower than, expected from the type approval tests. The NOx emissions are significantly
reduced with the WHTC, combined with Real Driving Emissions (RDE) legislation and On-Board Diagnostics (OBD) legislation. The NOx emissions measured on
large heavy-duty trucks are in the same order as passenger cars, which is remarkable considering that heavy-duty vehicles are about twenty times heavier than passenger cars.
Figure 3 Real-world NOx emission factors for tractor-trailer combinations and
average driving conditions in the Netherlands. Two legislative classes of Euro-V engines can be distinguished, before (-Va) and after (-Vb) September 1, 2009. The emission factor for the heavy-duty vehicle (in g/km), does not have a direct relation with the emission standard (in g/kWh) for the engine. However,
measurements of CO2-emission and a conservative relation of 650 gCO2/kWh,
yields real-world NOx emission factors (in g/km) that are 1-1.5 times the
emission limits during motorways conditions and even higher values in urban conditions.
Currently, the first Euro-6 passenger cars are available for a few makes and models. From September 2015 onwards all newly sold passenger cars must comply with the Euro-6 standards. The share of Euro-6 vehicles in the vehicle fleet will be still small in 2015, but increases towards 2020. The first
measurements on Euro-6 passenger cars using petrol show that their NOx
emissions during real-world driving conditions are as low as was as expected based on the reduction in emissions during type approval tests (Figure 2). This is not the case for Euro-6 diesel passenger cars. The first measurements on these cars indicate that their NOx emissions during real-world driving conditions
are somewhat lower than those of the Euro-5 cars, but not as low as expected based on the type approval tests (Figure 1). The effects of potentially higher than expected NOx emissions from Euro-6 diesel passenger cars on the average
emissions factors for light-duty vehicles have not been taken into account in the calculations. Only when Euro-6 is compulsory in 2015, it will become clear what will be the prevalent emission control technology applied for diesel passenger cars sold. As with Euro-5, only after the new legislation comes into force, the Dutch fleet-average real-world emissions of Euro-6 vehicles can be established accurately
2.3 Emission factors used in this study
In the scenarios used in this study it is assumed that all vehicles comply with the EU emission standards during real-world driving. The determination of emission factors for light-duty vehicles in this scenario is straightforward, since the Euro standards are defined in terms of grams per vehicle kilometer. Therefore the emission factors in g/km used in the air quality modeling can be
set equal to the legally required values. This means that for light-duty vehicles of a specific Euro class, the same NOx emission factor is used for all different
driving circumstances (all road types and congestion levels), equal to the emission limit. The emission limit is meant to be a “not to exceed” value, and is therefore treated as such.
It should be noted that for some vehicle types, specifically for petrol cars, the real-world NOx emission factors are actually lower than the Euro standards
(Figure 2). For these vehicle types, the real-world emission factors are used in the analysis, rather than the (higher) values of the emission standard.
The Euro standards only apply to total NOx emissions of the vehicles. For air
quality modeling, the NO2 fraction in total NOx emissions is also an important
factor in determining roadside NO2 concentrations. The NO2 fraction of recent
generations of diesel cars and LCVs has increased substantially (Carslaw et al., 2007). Since total NOx emission factors are decreased in this scenario, question
is what to do with NO2 fractions in total NOx. In the analysis we use two
assumptions:
1. NO2 fractions in total NOx emissions are kept constant from Euro-1
onwards. Even though there is no specific EU legislation for NO2
emissions or NO2 fractions, it is assumed that the increase in NO2
fractions is an unwanted side effect of the use of certain exhaust gas after-treatment systems. Under this assumption the decrease of NO2
emission factors is even higher than the decrease in NOx emission
factors.
2. NO2 fractions are identical to currently observed real-world values. This
means that NO2 emission factors decrease in line with emission factors
for total NOx.
For heavy-duty vehicles the Euro standards are defined in g/kWh and therefore must first be translated to emission factors per vehicle kilometer that are used in the air quality modeling. This translation of the emission standards to emission factors per vehicle kilometer is based on the fuel consumption of the trucks under different driving conditions. One kWh of energy is associated with 650 g CO2, typical of a heavy-duty engine on the ETC test. The CO2 emission
factors are calculated using VERSIT+ for different trucks under different driving conditions and are subsequently translated to kWh/km. For example, a CO2
emission factor of 1300 g/km is set to 2 kWh/km. With an Euro-V emission standard of 2 g NOx/kWh, an energy use of 2 kWh/km would result in a Euro-V
emission factor of 4 g NOx/km.
The resulting NOx and NO2 emission factors for light- and heavy-duty vehicles in
2015 (fleet averages), as used in the air quality modeling in Section 3, are shown in Tables A1 and A2 of Annex A. The emission factors per road type and congestion level still show some variation, due to differences in the vehicle fleet composition per road type. From the tables it can be seen that light-duty NOx
emission factors in 2015 decrease by approximately 30-40% when assuming that all vehicles comply with the Euro standards during real-world driving. In 2015, most light-duty diesel vehicles in The Netherlands comply with Euro-5 emission standards. Figure 1 shows that real-world NOx emissions of Euro-5
diesel passenger cars are up to 3 times higher than the Euro-5 emission limit. Assuming that the emission limit is met during real-world driving conditions therefore means a significant reductions in NOx emission factors for these
factors is reduced, though, because petrol vehicles are responsible for more than 50% of vehicle kilometers of the light-duty vehicle fleet and NOx emission
factors for petrol vehicles remain unchanged.
Light-duty fleet average NO2 emission factors decrease substantially if the first
assumption (described above) is used, with reductions of 80-90%. Since NO2
fractions of petrol vehicles are generally low, diesel vehicles dominate the fleet average NO2 emission factors. The NO2 fraction for Euro-5 diesel passenger cars
is 55%. Reducing all NO2 fractions of diesel light-duty vehicles to 5%, as is the
case under the first assumption, therefore means a major reduction in fleet average NO2 emission factors. The NO2 emission factors for the second
assumption are not shown in the tables, since the reduction of the emission factors is equal to the reduction of the NOx emission factors.
The reduction of the fleet-average NOx emission factors for heavy-duty vehicles
for the year 2015 shows a little more variation, depending on the road type and congestion level. For urban driving conditions, the fleet average NOx emission
factors decrease by 40-55%, whereas for motorway driving the emission factors decrease by 25-30%. It should be noted though that the share of heavy-duty vehicles on urban roads for the most part is rather small compared to the share on motorways.
3
NO
2concentrations and limit value exceedances
Emission totals for road traffic are calculated using the emission factors of Section 2 to calculate the effects on the large-scale NO2 concentrations for 2015
and 2020. The fleet average emission factors are applied to the national
emissions of passenger cars, light commercial vehicles and heavy-duty vehicles. The contributions from road traffic emissions from abroad to the large-scale concentrations in the Netherlands are taken into account by scaling the traffic emissions from countries neighbouring the Netherlands using the same fractional changes in road traffic emissions as in the Netherlands.
The total NO2 concentration level at road-side locations results from both
large-scale concentrations and local traffic contributions. The large-large-scale
concentrations are based on the methods and emissions described by Velders et al. (2013). The local traffic contributions are calculated using the methods and data prescribed by Dutch law (Rbl, 2007) and described in Beijk et al. (2010) and Van Zanten et al. (2013).
Dutch cities have, due to present local high NO2 concentration levels,
implemented traffic measures to reduce NOx emissions locally. In the present
study the effects of these local measures are included in the calculations, although it seems likely that at least some of these measures would not have been taken, if the emissions during real-world driving conditions would have been reduced as was expected based on the Euro standards.
The emission factors based on the Euro standards type approval test are lower than those based on the real-world driving conditions for both NOx and for the
fractions NO2 in NOx (Tables A1 and A2 of Annex A). This results in large
differences, up to a factor of ten, in net NO2 emissions compared to the
currently used emission factors for real-world driving conditions (Ligterink et al., 2012). Since the Euro standards do not contain explicit regulations for the NO2
emissions, the fraction NO2 in NOx is not limited by the regulations. Therefore, in
addition to the calculations using the NOx and NO2 emission factors from Tables
A1 and A2 an additional calculation of local NO2 concentrations has been
performed in which the fractions of NO2 in total NOx emissions are identical to
the reference case (see also Section 2.3).
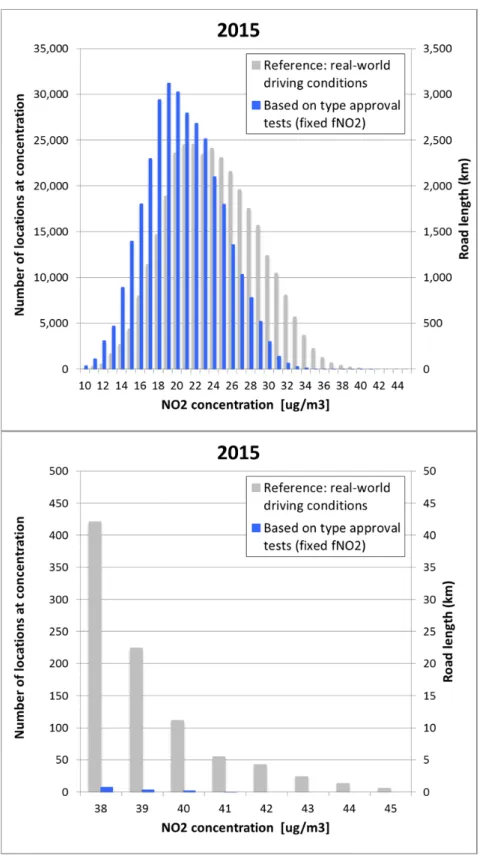
The analysis shows that the NO2 concentrations in the Netherlands would be
significantly lower in 2015 if the emissions from passenger cars, light-duty, and heavy-duty vehicles would have been reduced as expected from the Euro standards (Figure 4). At individual locations the local traffic contribution would have been about 30% lower than currently expected. This would be in addition to a lower expected large-scale contribution of a few µg m-3. The total NO
2
concentrations at specific locations would have been 5 to 10 µg m-3 lower than
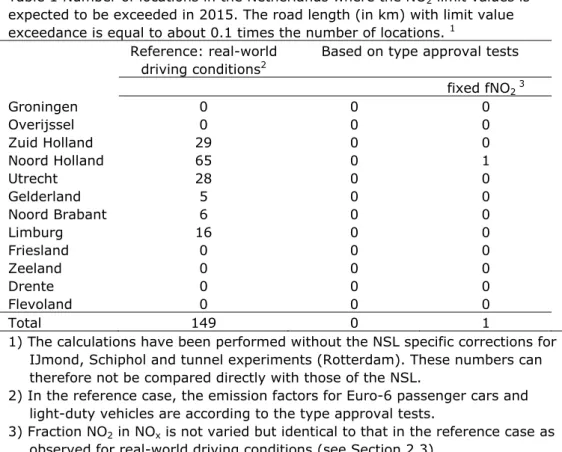
currently expected for 2015. As a result there would be practically no locations where the limit value would be exceeded in the Netherlands in 2015, compared to about 150 locations (or 15 km road length) in the current projection (Table 1).
Figure 4 Histogram of the concentrations of NO2 from different performances of
the Euro standards in 2015. Shown are histograms based on the emission factors for real-world driving conditions (reference) and those based the type approval test of Euro standards. The bottom panel shows the histogram for a smaller concentration range than the top panel.
Table 1 Number of locations in the Netherlands where the NO2 limit values is
expected to be exceeded in 2015. The road length (in km) with limit value exceedance is equal to about 0.1 times the number of locations. 1
Reference: real-world
driving conditions2
Based on type approval tests
fixed fNO2 3 Groningen 0 0 0 Overijssel 0 0 0 Zuid Holland 29 0 0 Noord Holland 65 0 1 Utrecht 28 0 0 Gelderland 5 0 0 Noord Brabant 6 0 0 Limburg 16 0 0 Friesland 0 0 0 Zeeland 0 0 0 Drente 0 0 0 Flevoland 0 0 0 Total 149 0 1
1) The calculations have been performed without the NSL specific corrections for IJmond, Schiphol and tunnel experiments (Rotterdam). These numbers can therefore not be compared directly with those of the NSL.
2) In the reference case, the emission factors for Euro-6 passenger cars and light-duty vehicles are according to the type approval tests.
3) Fraction NO2 in NOx is not varied but identical to that in the reference case as
observed for real-world driving conditions (see Section 2.3).
The number of locations where the NO2 concentration is just below the limit
value would also have been much lower than currently expected for 2015. These conclusions hold for both assumptions regarding the fraction of NO2 in NOx
emissions.
The first measurements on Euro-6 diesel passenger cars indicate that their NOx
emissions during real-world driving conditions are higher than was expected from the type approval tests (Section 2.2). This is not taken into account in the present study, but if confirmed by measurements on more cars, it may slightly increase the number of locations with exceedance of the limit value in 2015. The uncertainty in the expected number of exceedances, however, is large. Taking uncertainties into account may result in no exceedances in 2015 in the reference case, but also as much as ten times more than now projected (Van Zanten et al., 2013).
If the NOx emissions of diesel passenger cars, light commercial vehicles, and
heavy duty vehicles would have complied with EU emission standards under real-world driving conditions, projected total NOx emissions of road traffic would
be about 50 million kg in the Netherlands in 2015. The current projected emission is 50% larger with 74 million kg.
4
References
Beijk, R., Wesseling, J.P., Mooibroek, D., du Pon, B., Nguyen, L., Groot-Wassink, H., Verbeek, C., 2010. Monitoring NSL: State of affairs 2010, RIVM report 6800708000, National Institute of Public Health and the Environment, Bilthoven, The Netherlands.
Carslaw, D.C., S.D. Beevers, S.D. Bell, M.C., 2007, Risks of exceeding the hourly EU limit value for nitrogen dioxide resulting from increased road transport emissions of primary nitrogen dioxide, Atmospheric Environment 41, 2073–2082 EC, 2007. Regulation (EC) No 715/2007 of the European Parliament and the Council of 20 June 2007 on type approval of motor vehicles with respect to emissions from light passenger and commercial vehicles (Euro-5 and Euro-6), European Commission, Brussels, Belgium.
EC, 2009. Regulation (EC) No 595/2009 of the European Parliament and the Council of 18 June 2009 on type-approval of motor vehicles and engines with respect to emissions from heavy duty vehicles (Euro VI), European Commission, Brussels, Belgium.
EU, 2008. Directive 2008/50/EC of the European Parliament and of the Council of 21 May 2008 on ambient air quality and cleaner air for Europe, European Commission, Brussels, Belgium.
Hausberger, S., Rodler, J., Sturm, P., Rexeis, M., 2003. Emission factors for heavy-duty vehicles and validation by tunnel measurements, Atmospheric Environment 37, 5237-5245.
Ligterink, N., De Lange, R., 2009. Refined vehicle and driving-behaviour dependencies in the VERSIT+ emission model, Proceedings of the joint 17th Transport and Air Pollution Symposium and 3rd Environment and Transport Symposium (ETTAP), June 2009, Toulouse, France.
Ligterink, N., De Lange, R., Vermeulen, R., Dekker, H., 2009. On-road NOx emissions of Euro-V trucks, TNO report MON-RPT-033-DTS-2009-03840, TNO Industry and Technology, Delft, The Netherlands.
Ligterink, N.E., Van Mensch, P., and Kadijk, G.A., 2012a. Determination of Dutch NOx emission factors for Euro-5 diesel passenger cars. TNO report 2012
R11099.
Ligterink, N.E., Tavasszy, L.A., De Lange, R., 2012b. A velocity and payload dependent emission model for heavy-duty road freight transportation, Transportation Research Part D 17, 487–491.
Lowell, D., Kamakaté, F., 2012. Urban off-cycle NOx emissions from Euro IV/V
trucks and buses. Problems and solutions for Europe and developing countries. International Council on Clean Transportation, Washington, USA.
Rbl, 2007. Regeling van de Minister van Volkshuisvesting, Ruimtelijke Ordening en Milieubeheer van 8 november 2007, nr. LMV 2007.109578, houdende regels met betrekking tot het beoordelen van de luchtkwaliteit”, in Dutch.
Rexeis, M., Hausberger, S., 2009. Trend of vehicle emission levels until 2020 - Prognosis based on current vehicle measurements and future emission
legislation, Atmospheric Environment 43, 4689-4698.
Rexeis, M., Hausberger, S., Riemersma, I., Tartakovsky, L., Zvirin, Y., Poppel, M.v., Cornelis, E., 2005. Heavy duty vehicles emissions. Final report for ARTEMIS WP 400. , Report I 02/2005/Hb 20/2000 I680, Graz University of Technology, Graz, Austria.
Sturm, P., Hausberger, S., 2005. Emissions and fuel consumption from heavy duty vehicles, COST 346 - Final Report. ISBN-310: 343-902465-902448-902464 pp., Graz University of Technology, Graz, Austria.
M.C. van Zanten, A. van Alphen, J. Wesseling, D. Mooibroek, P.L. Nguyen, H. Groot Wassink, C. Verbeek, 2013. Monitoringsrapportage NSL 2013; Stand van zaken Nationaal samenwerkingsprogramma Luchtkwaliteit, RIVM Rapport 680712005/2013, expected december 2013.
Velders, G.J.M., G.P. Geilenkirchen, R. de Lange, 2011. Higher than expected NOx emission from trucks may affect attainability of NO2 limit values in the Netherlands, Atmospheric Environment, 45, 3025-3033, doi:
10.1016/j.atmosenv.2011.03.023.
Velders, G.J.M., Aben, J.M.M., Geilenkirchen, G.P., Den Hollander, H.A.,
Jimmink, B. Van der Swaluw, E. De Vries, W.J., Wesseling, J., Van Zanten, M.C., 2013. Large-scale air quality concentration and deposition maps in the
Netherlands. Report 2013, RIVM report 680362003, National Institute of Public Health and the Environment, Bilthoven, The Netherlands,
http://www.rivm.nl/gcn.
Verbeek, R.P., Ligterink, N.E., and Dekker, H.J., 2008. Correlation between European and World Harmonized Test Cycles for heavy-duty engine, TNO report MON-RPT-033-DTS-2008-03854.
Verbeek, R.P, Vermeulen, R., Vonk, W., and Dekker, H.J., 2010. Real world NOx emissions of Euro V vehicles, TNO report MON-RPT-2010-02777.
VROM, 2008. National air quality collaboration programme, Ministery of Housing, Spatial Planning and the Environment (VROM), The Hague, The Netherlands, http://international.vrom.nl/pagina.html?id=11410.
Weiss, M., Bonnel, P., Hummel, R., Provenza, A. Manfredi, U., 2011. On-road emissions of light duty vehicles in Europe. Environmental Science & Technology 45, 8575-8581.
5
Annex A. Emission factors
NOx and NO2 emission factors for light-duty and heavy-duty traffic on
motorways and in cities. Presented in Tables A1 and A2 are the emission factors based on the type approvals test and the real world driving conditions for 2015 (reference). The reference includes the emission factors for real-world driving conditions for Euro-1 to -5 passenger cars and Euro-I to -VI heavy-duty vehicles, but the lower emission factors for Euro-6 diesel passenger cars based on the type approval tests.
Presented in Tables A3 and A4 are the emission factors for a potential
inefficiency of Euro-6 diesel passenger cars and light-duty vehicles and for the reference case for 2015 and 2020.
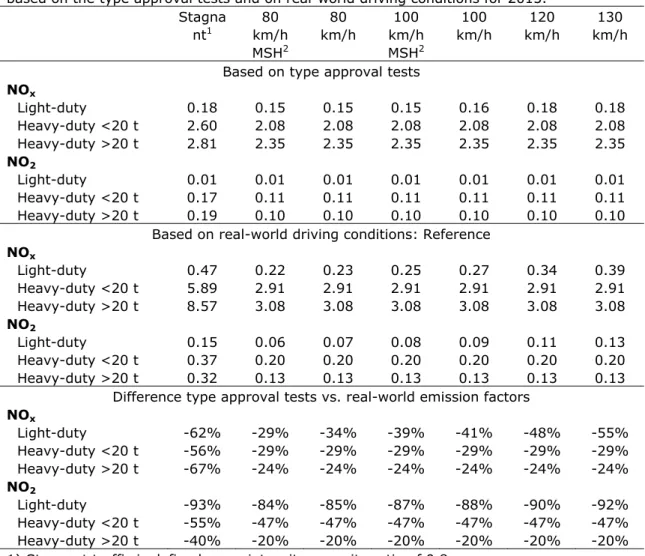
Table A1. NOx and NO2 emission factors (g/km) for motorways driving conditions
based on the type approval tests and on real-world driving conditions for 2015. Stagna nt1 km/h 80 MSH2 80 km/h 100 km/h MSH2 100 km/h 120 km/h 130 km/h Based on type approval tests
NOx Light-duty 0.18 0.15 0.15 0.15 0.16 0.18 0.18 Heavy-duty <20 t 2.60 2.08 2.08 2.08 2.08 2.08 2.08 Heavy-duty >20 t 2.81 2.35 2.35 2.35 2.35 2.35 2.35 NO2 Light-duty 0.01 0.01 0.01 0.01 0.01 0.01 0.01 Heavy-duty <20 t 0.17 0.11 0.11 0.11 0.11 0.11 0.11 Heavy-duty >20 t 0.19 0.10 0.10 0.10 0.10 0.10 0.10
Based on real-world driving conditions: Reference NOx Light-duty 0.47 0.22 0.23 0.25 0.27 0.34 0.39 Heavy-duty <20 t 5.89 2.91 2.91 2.91 2.91 2.91 2.91 Heavy-duty >20 t 8.57 3.08 3.08 3.08 3.08 3.08 3.08 NO2 Light-duty 0.15 0.06 0.07 0.08 0.09 0.11 0.13 Heavy-duty <20 t 0.37 0.20 0.20 0.20 0.20 0.20 0.20 Heavy-duty >20 t 0.32 0.13 0.13 0.13 0.13 0.13 0.13
Difference type approval tests vs. real-world emission factors NOx Light-duty -62% -29% -34% -39% -41% -48% -55% Heavy-duty <20 t -56% -29% -29% -29% -29% -29% -29% Heavy-duty >20 t -67% -24% -24% -24% -24% -24% -24% NO2 Light-duty -93% -84% -85% -87% -88% -90% -92% Heavy-duty <20 t -55% -47% -47% -47% -47% -47% -47% Heavy-duty >20 t -40% -20% -20% -20% -20% -20% -20%
1) Stagnant traffic is defined as an intensity-capacity ratio of 0.8 or more 2) Speed limit with strict enforcement.
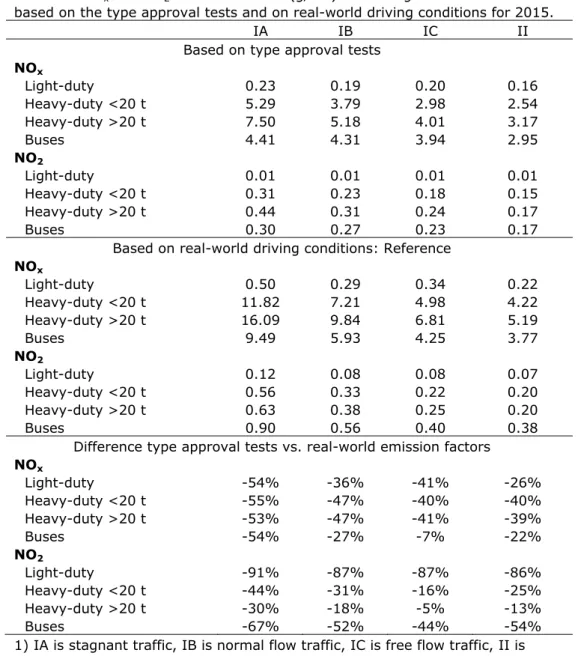
Table A2. NOx and NO2 emission factors (g/km) for driving conditions in cities1
based on the type approval tests and on real-world driving conditions for 2015.
IA IB IC II
Based on type approval tests NOx Light-duty 0.23 0.19 0.20 0.16 Heavy-duty <20 t 5.29 3.79 2.98 2.54 Heavy-duty >20 t 7.50 5.18 4.01 3.17 Buses 4.41 4.31 3.94 2.95 NO2 Light-duty 0.01 0.01 0.01 0.01 Heavy-duty <20 t 0.31 0.23 0.18 0.15 Heavy-duty >20 t 0.44 0.31 0.24 0.17 Buses 0.30 0.27 0.23 0.17
Based on real-world driving conditions: Reference NOx Light-duty 0.50 0.29 0.34 0.22 Heavy-duty <20 t 11.82 7.21 4.98 4.22 Heavy-duty >20 t 16.09 9.84 6.81 5.19 Buses 9.49 5.93 4.25 3.77 NO2 Light-duty 0.12 0.08 0.08 0.07 Heavy-duty <20 t 0.56 0.33 0.22 0.20 Heavy-duty >20 t 0.63 0.38 0.25 0.20 Buses 0.90 0.56 0.40 0.38
Difference type approval tests vs. real-world emission factors NOx Light-duty -54% -36% -41% -26% Heavy-duty <20 t -55% -47% -40% -40% Heavy-duty >20 t -53% -47% -41% -39% Buses -54% -27% -7% -22% NO2 Light-duty -91% -87% -87% -86% Heavy-duty <20 t -44% -31% -16% -25% Heavy-duty >20 t -30% -18% -5% -13% Buses -67% -52% -44% -54%
1) IA is stagnant traffic, IB is normal flow traffic, IC is free flow traffic, II is traffic on rural roads
National Institute for Public Health and the Environment
P.O. Box 1 | 3720 BA Bilthoven www.rivm.com