Disease burden and costs of selected
foodborne pathogens in the
Netherlands, 2006
Report 330331001/2009J.A. Haagsma | B.P. van der Zanden | L. Tariq | W. van Pelt | Y.T.P.H. van Duynhoven A.H. Havelaar
RIVM Report 330331001/2009
Disease burden and costs of selected foodborne
pathogens in the Netherlands, 2006
J.A. Haagsma B.P. van der Zanden L. Tariq
W. van Pelt
Y.T.P.H. van Duynhoven A.H. Havelaar
Contact: A.H. Havelaar
Laboratory for Zoonoses and Environmental Microbiology arie.havelaar@rivm.nl
This investigation has been performed by order and for the account of Ministry of Public Health, Welfare and Sports; Nutrition, Health Protection and Prevention Department, within the framework of V/330081001, Microbial Food Safety
© RIVM 2009
Parts of this publication may be reproduced, provided acknowledgement is given to the 'National Institute for Public Health and the Environment', along with the title and year of publication.
Abstract
Disease burden and costs of selected foodborne pathogens in the Netherlands, 2006
The RIVM studies the disease burden and cost-of-illness caused by six foodborne pathogens in 2006. These pathogens are toxin-producing bacteria Clostridium perfringens, Staphylococcus aureus and Bacillus cereus, Listeria monocytogenes and hepatitis A and E virus. Additionally, the disease burden of irritable bowel syndrome following infectious intestinal disease was included in the calculation. This increased the disease burden due to the selected pathogens that may cause irritable bowel syndrome by forty percent (an increase of 1,400 DALYs per year to almost 5,000).
The disease burden of the toxin-producing bacteria Clostridium perfringens and Staphylococcus aureus are in the range of 500 and 700 DALYs per year. This is comparable to the burden of disease of protozoon Giardia and rotavirus. The disease burden of Bacillus cereus and Hepatitis A and E virus are with less than 140 DALYs per year low in comparison to other foodborne pathogens.
This study examined the pathogens as well as the transmission routes by which they spread to humans. The most important route is food, and within this category poultry, beef and mutton proved to be the major source of pathogen transmission.
Key words:
Rapport in het kort
Ziektelast en kosten van geselecteerde voedsel-overdraagbare micro-organismen in Nederland, 2006
Het RIVM heeft voor het eerst de ziektelast en de kosten onderzocht die zes ziekteverwekkende micro-organismen in 2006 veroorzaakten. Het gaat om de toxinevormende bacteriën Clostridium perfringens, Staphylococcus aureus en Bacillus cereus, Listeria monocytogenes en het hepatitis A- en E-virus. De bacteriën veroorzaken bij mensen darminfecties met diarree en buikgriep als gevolg. Hepatitis leidt tot leverinfecties. Behalve deze infecties is de ziektelast van het prikkelbare darmsyndroom na een voedselinfectie in de berekening opgenomen. Deze ziekte kan onder andere worden opgelopen door een besmetting met de Salmonella bacterie en het norovirus en leidt tot aanhoudende buikklachten. Door deze toevoeging stijgt de totale ziektelast als gevolg van micro-organismen die het prikkelbare darmsyndroom kunnen veroorzaken met veertig procent (een toename met 1400 DALYs per jaar tot bijna 5000).
De ziektelast van de toxinevormende bacteriën Clostridium perfringens en Staphylococcus aureus zijn tussen de 500 en 700 DALY’s per jaar (Disability-Adjusted Life-Years, oftewel het aantal gezonde levensjaren dat een bevolking verliest door ziekte of vroegtijdig overlijden). Deze ziektelast is daarmee vergelijkbaar met infecties als gevolg van de parasiet Giardia en het rotavirus. De ziektelast van Bacillus cereus en het hepatitis A- en E-virus zijn met minder dan 140 DALYs per jaar laag vergeleken met andere voedseloverdraagbare micro-organismen.
In het onderzoek zijn zowel de ziekteverwekkers onderzocht als de wijze waarop ze de mens bereiken. Van deze blootstellingroutes is voedsel de belangrijkste bron. Binnen deze categorie blijken kip en rundvlees de belangrijkste bronnen die de micro-organismen overdragen.
Het onderzoek is uitgevoerd in opdracht van het ministerie van VWS en helpt om prioriteiten te kunnen aanbrengen in maatregelen die voedselinfecties voorkomen. Het onderzoek is onderdeel van een reeks naar de gezondheidseffecten van ziekteverwekkende micro-organismen waarvan het merendeel via voedsel wordt overgedragen.
Trefwoorden:
voedselinfecties, prioritering, ziektelast, ziektegebonden kosten, gastroenteritis
Contents
Summary 9 1. Introduction 11 1.1 Background 11 1.2 Outline of report 11 2. Incidence of gastroenteritis, 2006 133. Disease burden and cost-of-illness - methodology 15
4. Post-infectious irritable bowel syndrome 19
4.1 Outcome tree, incidence and duration of illness 19
4.1.1 Outcome tree and incidence 19
4.1.2 Duration of illness 22
4.2 Disease burden 23
4.3 Scenario analysis 24
4.4 Discussion 24
5. Clostridium perfringens 27
5.1 Outcome tree, incidence and duration of illness 27
5.1.1 Outcome tree and incidence 27
5.1.2 Duration of illness and age-distribution 29
5.2 Disease burden 30
5.3 Cost-of-illness 31
5.4 Scenario analysis 32
5.5 Discussion 33
6. Staphylococcus aureus 35
6.1 Outcome tree, incidence and duration of illness 35
6.1.1 Outcome tree and incidence 35
6.1.2 Duration of illness and age-distribution 36
6.2 Disease burden 37
6.3 Cost-of-illness 38
6.4 Scenario analysis 40
6.5 Discussion 41
7. Bacillus cereus 43
7.1 Outcome tree, incidence and duration of illness 43
7.1.1 Outcome tree and incidence 43
7.1.2 Duration of illness and age-distribution 44
7.2 Disease burden 45
7.3 Cost-of-illness 46
7.4 Scenario analysis 48
8. Listeria monocytogenes 51
8.1 Perinatal listeriosis 51
8.1.1 Outcome tree and incidence 51
8.1.2 Disease burden 53
8.2 Acquired listeriosis 54
8.2.1 Outcome tree and incidence 54
8.2.2 Disease burden 56
8.3
Cost-of-illness
578.4 Discussion 59
9. Hepatitis A virus 63
9.1 Outcome tree, incidence and duration of illness 63
9.1.1 Outcome tree and incidence 63
9.1.2 Duration of illness and age-distribution 65
9.2 Disease burden 66
9.3 Discussion 67
10. Hepatitis E virus 69
10.1 Outcome tree, incidence and duration of illness 69
10.1.1 Outcome tree and incidence 69
10.1.2 Duration of illness and age-distribution 71
10.2 Disease burden 72 10.3 Discussion 73 11. Integration of results 75 11.1 Disease burden 75 11.2 Cost-of-illness 78 11.3 Transmission pathways 80
11.4 Food group attribution 82
12. General discussion 87
Appendix – Detailed methodological choices 89
References 99
Aknowledgement 111
Summary
Human health is threatened by a wide variety of foodborne and zoonotic pathogens. The major objective of this project was to develop a model that helps the Dutch Ministry of Public Health, Welfare and Sports to prioritize pathogenic micro-organisms as a decision tool in their food safety policy.
In two preceding studies published in 2006 and 2007 the disease burden and/or costs of nine pathogens were estimated. In the current follow-up study, in which we applied the same methods as the previous studies, we estimated the burden of disease and/or costs of post-infectious irritable bowel syndrome, three spore-forming bacteria Clostridium perfringens, Staphylococcus aureus and Bacillus cereus, Listeria monocytogenes and hepatitis A and E virus.
A literature review showed that 9% of bacterial gastroenteritis cases and 2% of viral gastroenteritis cases go on to develop post-infectious irritable bowel syndrome, resulting in an annual disease burden of 1,400 DALYs for six pathogens, increasing the total disease burden of studied pathogens with 40%. For the spore-forming bacteria Clostridium perfringens and Staphylococcus aureus the most likely undiscounted annual disease burden was 509 DALYs and 688 DALYs, respectively. Cost-of-illness of these two spore forming bacteria was approximately 10 and 18 million euros in 2006. The disease burden and associated costs of Bacillus cereus was relatively low compared to other pathogens, with a most likely undiscounted disease burden of 109 DALYs and a cost-of-illness of approximately 3 million euros in 2006.
Over 2005 and 2006 the most likely annual disease burden of perinatal listeriosis was 203 and 62 DALYs undiscounted and discounted, respectively. Over the same time period the annual disease burden for acquired listeriosis was 108 and 96 DALYs lost. The annual cost-of-illness of perinatal and acquired listeriosis was 0.2 and 2 million euros, respectively.
With 103 and 136 DALYs, the most likely undiscounted annual disease burden of respectively hepatitis A and E virus was also relatively low.
The pathogens studied in this report were compared to the nine pathogens from the two preceding studies. Bacillus cereus had the lowest disease burden and cost-of-illness compared to the other eleven pathogens. The cost-of-illness of Listeria monocytogenes was even lower than the costs of Bacillus cereus. The annual burden of disease of Listeria monocytogenes on the other hand was in de middle range. Clostridium perfringens, Staphylococcus aureus and hepatitis A and E virus disease burden and costs were in the middle range.
1 Introduction
1.1 Background
Human health is threatened by a wide variety of foodborne and zoonotic pathogens. In order to provide an objective basis for policy decisions the Dutch Ministry of Public Health, Welfare and Sports asked the National Institute for Public Health and the Environment (RIVM) to develop a model that helps them to establish the priority of pathogenic micro-organisms that can (also) be transmitted by food, as a basis for effective and efficient policy-making on control, prevention and surveillance.
A first study was published in 2006, estimating the disease burden for five enteric and two non-enteric pathogens, and the related sequelae. The selected pathogens were norovirus (NV), rotavirus (RV), thermophilic Campylobacter spp., Salmonella spp., Shiga-toxin producing Escherichia coli O157 (STEC O157), Listeria monocytogens and Toxoplasma gondii. For four of these pathogens, namely norovirus, rotavirus, thermophilic Campylobacter spp. and Salmonella spp. the associated cost-of-illness were also estimated. Full details were reported by Kemmeren et al. [1]. A second study, published in 2007, applied the same methods to estimate the disease burden and cost-of-illness of Giardia lamblia and Cryptosporidium spp. [2]. Both studies focused on community-acquired infections (i.e. excluding infections caused in health-care settings).
The current report is a follow-up of this earlier work. In this report we describe the disease burden of post-infectious irritable bowel syndrome, a sequel to infectious diarrhea, and Hepatitis A and E virus. For the toxin-producing pathogens Clostridium perfringens, Staphylococcus aureus and Bacillus cereus, the burden of disease as well as the cost-of-illness is described. Also, an update of surveillance-based Listeria monocytogenes and associated costs are reported. All estimates are surveillance-based on incidence data and cost estimates for the year 2006.
1.2 Outline of report
Adjustments regarding the incidence of gastroenteritis (GE) are described in chapter 2. The
methodology applied for disease burden and cost-of-illness estimates is shortly described in chapter 3. In chapter 4 through 10 the results are described. Chapter 11 integrates the result of this report and earlier work. Chapter 12 ends with a general discussion.
2 Incidence of gastroenteritis, 2006
As mentioned before, the results presented in this report are a continuation of previous work on the burden of foodborne disease, published in 2006 and 2007 [1, 2]. In many respects, the approach to assess the burden of disease used in the current study is similar to the 2006 and 2007 studies; however, some important adjustments have been made regarding the incidence of gastroenteritis and the
methodology to assess the non-fatal burden of disease. This chapter covers the update of the incidence of gastroenteritis. The methodological adaptations will be discussed in the next chapter.
The previous 2006 and 2007 burden of foodborne disease estimates were based on the incidence of gastroenteritis for the year 2004 [1, 2]. For the current study the GE incidence was updated to 2006. This update entailed both data on acute GE in the population and the fraction of cases consulting the GP. The GE incidence in the entire population of the Netherlands was based on data from SENSOR, a Dutch community based cohort study performed from 1998 through 1999 in order to estimate the incidence of GE and its pathogens [3]. NIVEL, a Dutch GP based cohort study from 1996 though1999, was used to assess the fraction of cases that consulted a GP [4]. For all enteric pathogens, the age-specific SENSOR and NIVEL cases were extrapolated to 2006, adjusting for population growth and age-composition of the Netherlands in the year 2006, and, where available, taking into account trends in reported cases to the Laboratory Surveillance System [5].
In Table 1 the updated incidence estimates for GE per pathogen in the Netherlands over the year 2006 is presented.
Table 1. Incidence of gastroenteritis per pathogen in general population of the Netherlands, 2006.
Pathogen Incidence general population
All causes 4,800,000 †
4,400,000 – 5,200,000 ‡
Bacteria – infectious
(Thermophilic) Campylobacter spp. 79,000
28,000 – 170,000
Shiga-toxin producing Escherichia coli (STEC) O157 1,800
Salmonella spp. 43,000
8,600 – 110,000
Bacteria – toxin producing
Bacillus cereus 47,000 21,000 – 87,000 Clostridium perfringens 160,000 65,000 – 290,000 Staphylococcus aureus 270,000 150,000 – 450,000 Viruses Norovirus 640,000 470,000 – 850,000 Rotavirus 300,000 170,000 – 480,000 Protozoa Cryptosporidium parvum 56,000 23,000 – 110,000 Giardia lamblia 110,000 69,000 – 180,000 † mean ‡ 5-95 percentile
3 Disease burden and cost-of-illness methodology
In order to assess the burden of disease and the cost-of-illness for the various pathogens under study, information on clinical outcomes of infection was arranged in outcome trees. An outcome tree defines the possible health outcomes followed by infection. Details are given in the following chapters. Disease burden, one of the two criteria considered, is expressed in Disability Adjusted Life Years (DALYs). By using the DALY methodology, morbidity, expressed in years lived with disability (YLDs), and mortality, expressed in years of life lost (YLLs), are summed up into one metric unit. Compared to the preceding Dutch burden of foodborne disease studies, two significant adaptations regarding the methodology to calculate YLDs were made.
The first adaptation concerns the disability weights used. The disability weight is a scaling factor that reflects the impact of a specific health outcome with a value ranging from 0, indicating best imaginable health state, to 1, indicating worst imaginable health state. In the previous two Dutch burden of
foodborne disease studies disability weights were based on the so-called standard QALY/DALY disability model (SQM). This model assumes that each health profile is separated into a succession of independent health states with distinct severities and that the valuation of each of the health states is independent of the duration of the health state. For chronic disease these assumptions are valid, but in case of a disease with an acute onset and/or a complex pattern over time, like gastroenteritis, the SQM assumptions are not appropriate [6, 7]. To overcome the operational limitations of the SQM, the annual profile model (APM) was developed. The most important feature of the APM is that it describes the course of the health state over the period of one year [6]. Because the duration of the health state is incorporated into the APM disability weight, YLD is calculated by multiplying the incidence by the disability weight. The current study adopted APM disability weights derived from a Dutch population panel in order to estimate YLDs lost due to foodborne disease. For certain health states, APM disability weights were not available. For these health states, SQM disability weights were applied.
The disability weights that were used are summarized in Table 2.
The second adjustment of the methodology to calculate YLDs concerns the lack of a clear cut-off point for severity, the so-called relevance criterion. Foodborne disease encompasses a wide variety in possible health states, ranging from minor to severe, and using incidence data from population health surveys, like the SENSOR study, implies that cases of minimal disease are included in burden of disease estimates. Collectively these highly prevalent cases of minimal disease may amount to a large number of YLDs in the aggregate, which may get priority above severe, but less frequently occurring disease. As a result, the application of burden of disease estimates in prioritization discussion may be restricted. This can be overcome by including a criterion for relevant disease. In the current study, a preference-bases relevance criterion was applied. This is a relevance criterion that is based on the preferences of a Dutch population panel [8]. The preference-based relevance criterion is met if at least 50% of the panel members is willing to trade-off time in order to be restored from the health state. If the health state is regarded as not relevant, it is excluded from the burden of disease calculation.
Apart from these two methodological adaptations, the DALY methodology used in the current study was similar to the 2006 and 2007 studies. A detailed description of the DALY methodology and the general assumptions made with respect to disease burden are given in chapter 2 of Kemmeren et al. [1]. Details on the methodological choices made are summarized in the Appendix.
Table 2. Disability weights used in this report.
Disability weight Source
Death 1.00 Gastroenteritis
Not visiting GP 0a Haagsma et al.[8]
Visiting GP 0.015a Haagsma et al.[8]
Hospitalized 0.041a Haagsma et al.[8]
Irritable bowel syndrome 0.042a Bonsel et al.[9]
Meningitis 0.32 Melse et al.[10]
Neurological disorders 0.25 Melse et al.[10]
Pneumonia 0.04 Melse et al.[10]
Sepsis 0.93 Melse et al.[10]
Hepatitis, mild 0.011a Haagsma et al. [11]
Hepatitis, moderate 0.058a Haagsma et al. [11]
Hepatitis, hospitalized 0.353 Havelaar et al. [12]
a) annual profile disability weight
Cost-of-illness, the second valuation criterion, is calculated by accumulation of: a) direct health care costs (DHC), which are costs for example the consultation of general practitioners and specialists, hospitalization, drugs and rehabilitation; b) direct non-health care costs (DNHC), which include e.g. the travel costs by patients and other co-payments by patients; and c) indirect non-health care costs
(INHC), such as the productivity losses of patients and/or care-givers. Productivity losses were estimated according to the friction method. In order to keep our results comparable with the earlier estimations, costs were estimated using cost prices of the year 2006. The cost vectors used in the current study are summarized in Table 3. Pathogen specific assumptions, if available/necessary, are given in the specific chapters hereafter.
Disease burden and costs are presented, both discounted at a rate of 4% and undiscounted.
Uncertainty analysis was restricted to using low, most likely and high values for uncertain parameters, and some scenario analyses. For details, see Kemmeren et al. [1].
Table 3. Cost vectors in the Netherlands for the year 2006 (in €), most likely point estimate and if applicable, minimum and maximum point estimate.
Cost vectors Costs per unit (in €)
Most likely point estimate (minimum and maximum) Direct medical costs
Over-the-counter medicine of patients not requiring medical help per day of illness
0.16
Over-the-counter medicine of patients requiring medical help per day of illness
0.53
Cost for medication incl. prescription charges 37.1
Cost per average GP visit 32.3 (20.4 – 32.3) a
Costs for pathogen diagnostic in feces/sample submitted 67
Hospitalization adults/day 367
Hospitalization child/day 461
Outpatient clinic/consultation 64b
Short subscription fee for internist 62
Short subscription fee for paediatrician 88
Direct non-medical services
Travel cost per average GP consultation 0.8 (0.14 – 1.5) c
Travel cost per hospitalization 3.5
Cost per diaper 0.3
Indirect costs
Average costs of absence from paid work/hour 36.5
Average costs of third person taking care of sick person/hour 22.5 (8.5 - 36.5) d a) Of the considered GP consultations, approximately 90% were GP practice visits (€ 21/visit) and the remaining 10% were house calls from the GP to the patient (€ 41/visit). Furthermore, per registered GP consultation, an additional 0.97 GP telephone consultations of the doctors’ assistant took place (€ 10/call). For the minimum estimate we assumed 100% GP practice visits and no phone calls.
b) Calculated as the weighted average of visiting a general hospital (84% of patients and €57 per consultation) and a university hospital (16% of patients and €101 per consultation).
c) Depending on the assumption made of an average GP consultation and depending of the travel form used (e.g. public transport, car or cycling/walking). For details see Kemmeren et al. [1].
d) It could not be assessed whether work absence was from paid work or from unpaid work. We therefore assumed as most likely point estimate that the average of productivity losses for an average working person, € 36.5/hour, and the opportunity costs for informal care, € 8.5/hour, which was equal to an average of € 22.5/hour. In our low cost estimate and high cost estimate, however, we assumed that productivity losses were equal to € 8.5/hour and € 36.5/hour, respectively.
4 Post-infectious irritable bowel syndrome
Irritable bowel syndrome (IBS) is a chronic functional bowel disorder characterized by abdominal pain and intermittent diarrhea/constipation. It is a highly prevalent disorder, affecting an estimated 10 to 20% of the Western population at a certain point in time [13, 14]. Following the results from a
community survey, the prevalence of IBS-like complaints in the Netherlands is 6.2%, with 2% meeting the diagnostic criteria of Manning, ROME I and ROME II [15]. Extrapolating this prevalence rate to the whole population of the Netherlands leads to a prevalence of 330,000 individuals with formally diagnosed IBS.
The cause of IBS is largely unknown; however several studies have found evidence that IBS is a sequel of a preceding episode of infectious gastroenteritis [16, 17]. Due to gastroenteritis the concentration of the serotonin-containing enteroendocrine cells within the gut may increase, resulting in higher gut motility [18]. Pathogens known to be associated with post-infectious IBS (PI-IBS) are Salmonella spp., Shigella spp., (thermophilic) Campylobacter spp, Shiga-toxin producing Escherichia coli (STEC) O157 and norovirus (see Table 5). Women suffer from PI-IBS more often compared to men [19, 20]. Other risk factors for the development of PI-IBS include severity and duration of the gastro-enteritis episode, age, smoking and co-occurring depression [19, 21, 22]. This section describes the estimated disease burden of PI-IBS due to pathogens Campylobacter, Salmonella, STEC, Shigella, norovirus and rotavirus in the Netherlands.
4.1 Outcome tree, incidence and duration of illness
4.1.2 Outcome tree and incidence
The outcome tree of PI-IBS is shown in Figure 1.
We conducted a systematic literature review of published studiesto date that explored PI-IBS following gastroenteritis (see Table 4). Firstly, we conducted a search of the database MEDLINE that was restricted to articles published in English from and including 1990, using the following searchterms: irritable bowel syndrome, functional bowel disorder, post infectious, infectious, follow-up,
gastroenteritis, diarrhea, incidence, and prevalence. The resulting articles were screened in order to identify articles that met the predefined selection criteria. Reference lists of the included articles were then examined to identify cited articles not captured by MEDLINE. Finally, full text articles that met the selection criteria were scrutinized to assess methodological quality.
Table 4. Overview of the systematic review on post-infectious irritable bowel syndrome (PI-IBS).
Database MEDLINE
Keywords irritable bowel syndrome, functional bowel disorder, post infectious, infectious, follow-up, gastroenteritis, diarrhea, diarrhoea, incidence, prevalence
Selection criteria Written in English or Dutch, year of publication >1990
We found 19 studies that investigated the incidence of PI-IBS following gastroenteritis. Table 5 presents an overview of the findings of these 19 follow up studies. In these studies, the index group was a cohort of GE-patients, usually with confirmed bacterial or viral etiology. Controls were included in 8 studies and comprised of volunteers, patients from the same general practice, siblings or spouse of the patient. The PI-IBS incidence rate found in the 19 studies ranges from 4% up to 36%.
The data reported in the follow-up studies was pooled in order to estimate the incidence rate of PI-IBS. This resulted in an incidence rate of PI-IBS of 13.1%. If the pooled incidence was weighted for sample size of the study, the pooled PI-IBS incidence was 11.6%. This pooled incidence rate has not been corrected for background illness. For the case-control studies, the incidence rate can be adjusted by calculation of the attributable proportion (AP; see Table 6). The data do not suggest an increasing probability of PI-IBS for different levels of the surveillance pyramid. Neither do the data suggest that PI-IBS differs between pathogens, except for a lower risk following norovirus infections.
Table 5. Incidence rate of post-infectious irritable bowel syndrome (PI-IBIS).
Author Year Study
designa Pathogen Subjects
b Follow up
(months)
Rate PI-IBS (%) Borgaonkar et al.[23] 2006 PC Bacterial Lab+ patients 3 4 Cumberland et al.[24] 2003 PCC ? GP patients 3 3 Dunlop et al.[25] 2003 PCC Campylobacter Lab+ patients 3 14 Gwee et al.[20] 1996 PC Mixed Hosp. patients 3, 6, 9, 12 29, 27, 20, 12 Ilnyckyj et al.[26] 2003 PC TD* Travelers (no
GP)
3 4 Ji et al. [27] 2005 PCC Shigella Hosp. employees 3, 6, 12 19, 11, 15
Kim et al.[28] 2006 PCC Shigella Lab+ patients 36 18 Marshall et al.[29] 2006 RC E coli/
Campylobacter
Residents 24 36 Marshall et al.[30] 2007 PCC Norovirus Conference part 3, 6, 12,
24
24, 12, 15, 20 McKendrik et al.[31] 1994 RC Salmonella Lab+ patients 6 31 McKeown et al.[32] 2006 PC Campylobacter Hosp. patients 3, 6 17, 17 Mearin et al.[33] 2005 PC Salmonella Lab+ patients 3, 6, 12 7, 11,12 Neal et al.[19] 1997 PC Bacterial Lab+ patients 6 6 Okhuysen et al.[34] 2004 PC E coli Travelers (no
GP)
6 11 Parry et al.[21] 2003 PCC Bacterial Lab+ patients 6 17
Rodriguez et al.[35] 1999 PCC Bacterial GP patients 12 4 Spence et al.[36] 2007 PC Campylobacter Lab+ patients 6 8 Thornley et al.[37] 2001 PC Campylobacter Lab+ patients 6 9 Wang et al.[38] 2004 PCC Shigella Lab+ patients 10 9
Total 13,1
a) PC = prospective cohort, PCC = prospective case control, RC = retrospective cohort b) Lab+ patients = Laboratory confirmed cases of bacterial gastrointestinal pathogen b) number of people with PI-IBS/total number of GE patients
* TD = traveler’s diarrhea
Table 6. Attributive Risk (AR), per study.
Study Pathogen Cases Controls AP
Ji et al.[27] Shigella 15/101 6/102 0.090
Kim et al.[28] Shigella 17/95 4/105 0.141
Parry et al.[21] Bacterial 18/108 4/206 0.147
Rodriguez et al.[35] Bacterial 14/318 2027/584308 0.041
Wang et al.[38] Shigella 24/235 2/243 0.094
The APs were calculated as: Pge*(RR-1)/RR;
where pge is the proportion exposed to acute gastroenteritis among cases and RR is the relative rate
adjusted for developing IBS without exposure acute gastroenteritis. We employed data from five case-control studies in order to calculate the AP for bacterial infections [21, 27, 28, 35, 38]. The mean AP risk for bacterial infections weighted for sample size was 8.6% (most likely estimate) with a minimum of 5.5%, corresponding to the 5th percentile, and a maximum AP of 9.6%, corresponding to the 95th
percentile of the Beta distribution. To determine the AP for viral infections, data from one case-control study performed by Marshall et al. was available [30]. This study measured incidence of PI-IBS at 3, 6, 12 and 24 months after infection. The diagnostic criteria for IBS suggest evident symptoms for at least three months, either continuously or recurrent, over a period of at least 6 months prior to the diagnosis. In accordance with the diagnostic criteria and the follow-up period regarding studies on PI-IBS following bacterial infection, we used the 6-month follow-up data for the AP calculation. This resulted in a best estimate of the AP for viral infections of 2.3% with a minimum of 0 and a maximum of 9.5% (95th percentile of the distribution). The estimated incidence of PI-IBS is shown in Table 7.
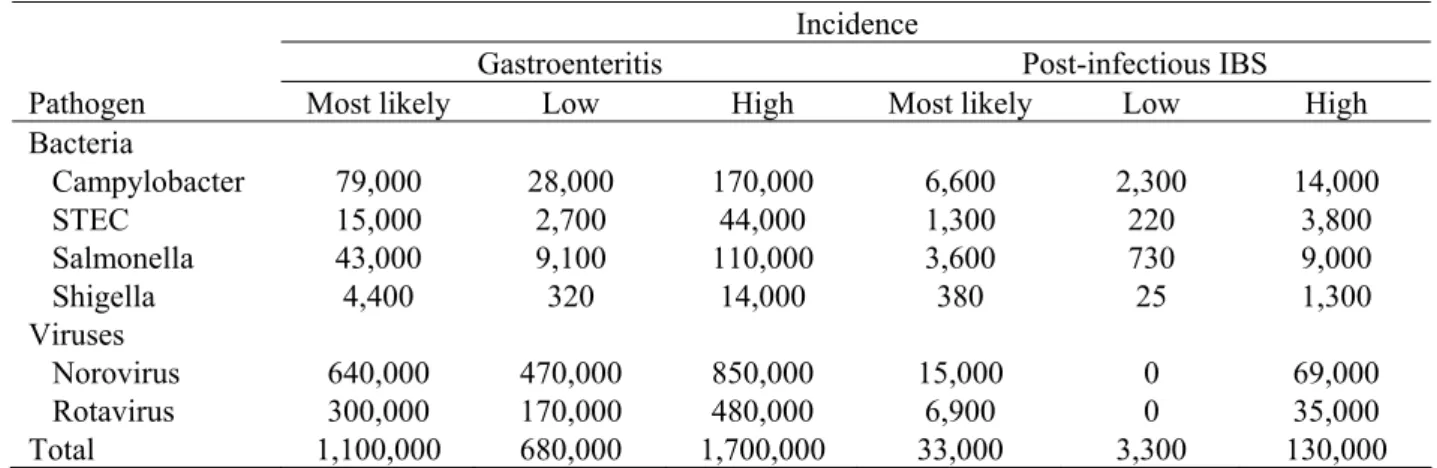
Table 7. Incidence of gastroenteritis and post-infectious irritable bowel syndrome per pathogen for 2006 a.
Incidence
Gastroenteritis Post-infectious IBS
Pathogen Most likely Low High Most likely Low High
Bacteria Campylobacter 79,000 28,000 170,000 6,600 2,300 14,000 STEC 15,000 2,700 44,000 1,300 220 3,800 Salmonella 43,000 9,100 110,000 3,600 730 9,000 Shigella 4,400 320 14,000 380 25 1,300 Viruses Norovirus 640,000 470,000 850,000 15,000 0 69,000 Rotavirus 300,000 170,000 480,000 6,900 0 35,000 Total 1,100,000 680,000 1,700,000 33,000 3,300 130,000
a) Summations might not necessarily tally because of rounding
4.1.2 Duration of illness
About the long-term course of IBS, little is known. Results from studies that did investigate the course of IBS indicated that symptoms do not change over one year time [39]. Spence et al. [36] as well as Parry et al.[21] found incidence rates that were similar at 3 months and 6 months follow up. Ji et al. [27], who sent a follow-up questionnaire at 3, 6 and 12 months, reported that 50% of the patients with PI-IBS did not recover within 12 months. Moreover, long-term follow-up studies showed that
symptoms often lasted for several years. Owens et al. [40] performed a prospective review of the medical records of 112 IBS patients. The median follow time of this study was 40 years (range 1 to 80 years) and the median duration between diagnosis of IBS and last recorded IBS related visit to the clinic was 29 years (range 1 to 32 years). Results from a retrospective six year follow up showed that 31% of patients with IBS and 43% of patients with post-infectious (PI) IBS were recovered [19]. This suggests that the prognosis of patients with PI-IBS is slightly better compared to IBS [41]. A literature
search yielded 5 long-term PI-IBS follow up studies. The findings of these studies are summarized in Table 8.
However, it should be noted that the PI-IBS follow up studies relied on patient-reported questionnaires and that the validity of self-reported questionnaires to assess health has been disputed [42]. This means that the reported symptoms might not correspond to actual health. In clinical practice, the majority of patients (80-90%) do not consult a gastroenterologist after a period of one year (P. Siersema,
University Medical Centre, Utrecht, personal communication). We assumed a median duration of symptoms in between these extremes of one year on the one hand and six years on the other hand, i.e. a median duration of one year, with a minimum duration of 6 months and a maximum duration of 6 years.
Table 8. Percentage of patients with persistent post-infectious irritable bowel syndrome symptoms at follow-up.
Study Follow up % with persistent
PI-IBS symptoms Gwee et al.[20], McKeown et al.[32] 6 months 91%; 100% Ji et al.[27], Marshall et al.[30] 1 year 80%; 43%a
Marshall et al.[30] 2 years 41%a
Kim et al.[28] 3 years 75%
Neal et al.[43] 6 years 56%
Agrues et al.[39] 7 years 44% (note: IBS)
a) viral rather than bacterial pathogen.
4.2
Disease burden
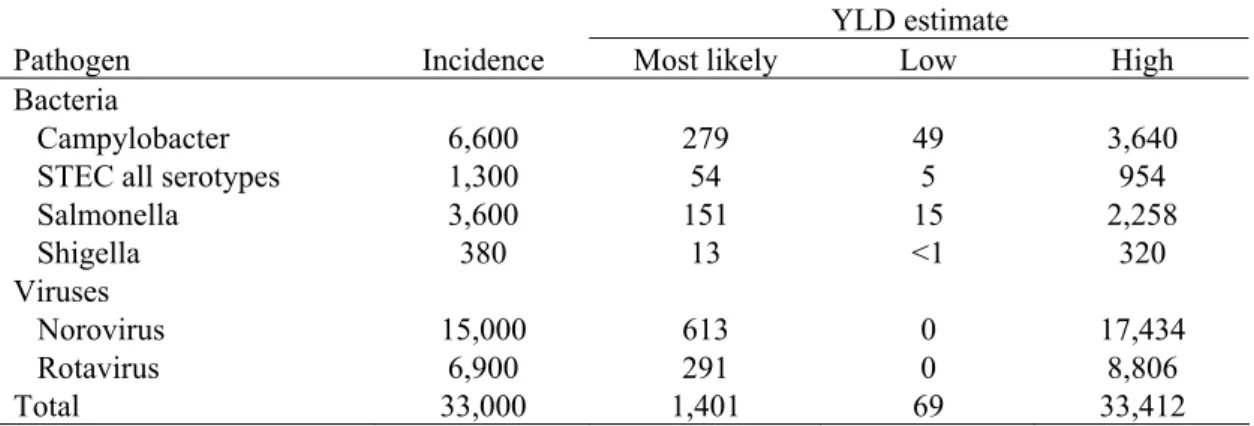
The estimated YLD lost due to PI-IBS following infection with the selected pathogens was computed by combining incidence, duration of the illness and the disability weight for IBS. Minimum and maximum YLD estimates were calculated using the low and high incidence estimates of PI-IBS. The results are shown in Table 9.
Table 9. Incidence and YLD of post-infectious irritable bowel syndrome for 2006 (undiscounted) a.
YLD estimate
Pathogen Incidence Most likely Low High
Bacteria
Campylobacter 6,600 279 49 3,640
STEC all serotypes 1,300 54 5 954
Salmonella 3,600 151 15 2,258 Shigella 380 13 <1 320 Viruses Norovirus 15,000 613 0 17,434 Rotavirus 6,900 291 0 8,806 Total 33,000 1,401 69 33,412
4.3
Scenario analysis
Because the data of the case-control studies on PI-IBS that were included in our analysis did not suggest an increasing probability of PI-IBS for different levels of the surveillance pyramid, we have calculated PI-IBS following gastroenteritis of six selected pathogens using all cases of gastroenteritis in the population, independent of the severity and duration of the episode. However, there is evidence that the probability of developing PI-IBS increases by level of severity and duration of gastroenteritis symptoms [19, 21, 22]. Therefore, the assumption that all cases in the population are at risk to develop PI-IBS, even the cases that do not seek medical advice, might not be correct. Symptoms severity and duration of the gastroenteritis episode are determinants of seeking medical advice [3]. Rather than using all cases in the population, perhaps only cases with that consult a GP or hospitalized cases should be used to estimate the number of patients that go on to develop PI-IBS. Table 10 shows the estimated number of cases of PI-IBS and DALYs lost based on the cases visiting the GP and hospitalized cases.
Table 10. Incidence and DALY of post-infectious irritable bowel syndrome for 2006 (undiscounted), using GP and hospitalized cases of gastroenteritis a.
Pathogen Incidence DALY
(most likely) Bacteria
Campylobacter 1,700 70
STEC all serotypes 140 6
Salmonella 620 26 Shigella 60 30 Viruses Norovirus 365 15 Rotavirus 470 20 Total 3,300 140
a) Summations might not necessarily tally because of rounding
4.4
Discussion
The findings of the systematic literature review indicate that 9% of patients with bacterial
gastroenteritis and 2% of patients with viral gastroenteritis go on to develop PI-IBS. Annually, this amounts to an estimated 33,000 cases of PI-IBS following gastroenteritis of the six selected pathogens that occur in the Dutch population, with an uncertainty range of 3,300 and 130,000 cases per year. Each year the total number of PI-IBS cases results in a loss of 1,401 DALYs per year (undiscounted), increasing the total number of DALYs lost due to studied pathogens with 40%, assuming that all GE cases in the population are at risk to develop PI-IBS, even cases that do not consult the GP. If only cases that seek medical advice are included in the estimates, the total number of DALYs lost due to PI-IBS is 140 DALYs per year.
Including PI-IBS increases the annual burden of disease of Campylobacter spp. with 18% (from 1,564 to 1,843 DALYs). For Salmonella spp. this increase is 17% (from 905 to 1056 DALYs) and for STEC 46% (from 118 to 172 DALYs). Highest increase in burden of disease regards the viral pathogens noro-
and rotavirus. The burden of norovirus increases with 152% (from 404 to 1,017 DALYs) and rotavirus with 56% (from 521 to 812 DALYs). Figure 2 shows the disease burden of the five pathogens, both excluding and including PI-IBS.
0 500 1,000 1,500 2,000 2,500 3,000
Campylobacter STEC Salmonella Norovirus Rotavirus
DAL Ys p er y ea r .
Excluding post-infectious IBS Including post-infectious IBS
Figure 2. Disease burden of five pathogens for 2006, using most likely estimates, both excluding and including post-infectious irritable bowel syndrome. Error bars express an uncertainty interval that results from using low and high estimates.
5 Clostridium perfringens
Clostridium perfringens, previously known as Clostridium welchii, are anaerobic, Gram-positive, spore-forming bacteria. They are widely distributed in the environment, inhabiting soil and water, and also the intestinal tract and faeces of warm-blooded animals and humans [44]. In healthy humans the C. perfringens in the intestinal tract do not cause disease; however, if humans ingest food that is contaminated with large numbers of C. perfringens, food poisoning may occur [45, 46]. After ingestion C. perfringens multiply in the small intestines and release enterotoxin during
sporulation [47, 48]. The enterotoxins cause food poisoning, of which the clinical signs occur 8 to 12 hours after ingestion. Usually C. perfringens food poisoning is characterized by a relatively mild self-limiting gastroenteritis with short duration. Due to these mild and short-term symptoms, many cases of C. perfringens food poisoning are undiagnosed [49].
In very rare cases, C. perfringens food poisoning causes necrotizing enterocolitis, a severe and often fatal disease that involves infection and necrosis of the intestinal wall and tissue [50]. This rare but severe sequel of food poisoning mainly involves C. perfringens type C strains which produce β-toxin as well as toxin, whereas the mild form of C. perfringens food poisoning is mainly caused by the α-toxin producing type A strains [45, 46, 50]. Cases with necrotizing enterocolitis have chiefly been reported regarding inhabitants of Papua New Guinea, although sporadic cases of enteritis necroticans have been reported from Western countries [51]. Because of its sporadical occurrence, we excluded the sequel necrotizing enterocolitis from the burden of disease estimate of C. perfringens.
C. perfringens are typically found in raw and processed meat products, especially beef and poultry [47]. Unlike most foodborne pathogens, C. perfringens survive cooking because of the ability to form spores that are heat-resistant. Additional factors that enhance C. perfringens outbreaks are improper cooling and long duration between preparation and consumption of the food [52]. Most cases of C. perfringens food poisoning are reported from restaurants, hospitals and old people’s homes [44].
5.1 Outcome tree, incidence and duration of illness
5.1.2 Outcome tree and incidence
Food poisoning due to C. perfringens is not systematically registered in the Netherlands. Therefore, to estimate the incidence of C. perfringens food poisoning in the population we used data from the SENSOR-study [3]. SENSOR is a Dutch prospective population-based cohort study that was conducted from 1998 through 1999 in order to estimate the incidence of gastro-enteritis and its pathogens. The age-specific SENSOR-data on C. perfringens induced gastro-enteritis were adjusted for population growth and age composition of the Netherlands in the year 2006, resulting in an estimated incidence of C. perfringens food poisoning of 160,000 cases per year. The uncertainty of this estimation ranges from 65,000 (low estimate corresponding with the 5th percentile of the estimation) to 290,000 (high estimate corresponding with the 95th percentile of the estimation).
The number of cases that would visit a GP due to C. perfringens food poisoning is also unknown for the Netherlands. A large study from England/Wales reported that 53% of the cases would visit the GP [53]. This percentage seems rather high regarding the relative mildness and short duration of the symptoms. The reported high percentage of cases consulting the GP might be explained by the relatively high consultation rate of gastroenteritis patients in England, which is approximately three times higher compared to the consultation rate in the Netherlands [3]. Correcting for the differences in consultation rates between England and the Netherlands, we assumed that in the Netherlands 19% of the C. perfringens food poisoning cases would visit the GP. Consequently, the number of cases that would consult the GP due to C. perfringens food poisoning is estimated at 29,000 per year. This estimation includes both hospitalized and non-hospitalized cases. The minimum estimation of cases consulting the GP is 12,000, corresponding with the 5th percentile of the estimation. The maximum estimation of cases consulting the GP is 54,000, corresponding with the 95th percentile of the estimation.
The hospitalization rate of patients with C. perfringens food poisoning was calculated using data on C. perfringens cases reported by Dutch public health laboratories (PHL) that participate in the
Infectious Diseases Surveillance System database (ISIS). In total, fourteen PHLs reported hospitalized C. perfringens cases. Taking the coverage rate of the PHLs into account, we estimated that the
hospitalization rate of C. perfringens food poisoning is 0.002. This hospitalization rate is slightly lower compared to those reported by Adak et al. [53] and Mead et al. [54], who found C. perfringens
hospitalization rates of 0.004 and 0.003, respectively. Using the calculated Dutch hospitalization rate of 0.002, we supposed that in 2006 most likely 270 cases of C. perfringens food poisoning were
hospitalized, with a minimum of 120 cases, and a maximum of 510 cases.
Based on case fatality rates reported by Mead et al. [54], we assumed that most likely 4 people died due to C. perfringens food poisoning, with a minimum of 2 cases and a maximum of 8 cases. Figure 3 shows the outcome tree for C. perfringens food poisoning and Table 11 shows the estimated incidence of C. perfringens food poisoning.
Table 11. Incidence of illness of C. perfringens-associated gastroenteritis for 2006.
Incidence estimates (cases per year)
Most likely Low High
Gastroenteritis 160,000 65,000 290,000
No GP 130,000 53,000 230,000
GP 29,000 12,000 54,000
Hospitalization 270 120 510
Fatal 4 2 8
* Summations do not necessarily tally.
5.1.2 Duration of illness and age-distribution
C. perfringens food poisoning symptoms often last no longer than two days. This relatively short duration is endorsed by several C. perfringens outbreak studies reporting a median duration of
symptoms lasting 16 through 24 hours [55-59]. Results from the IID-study showed that adults who did not visit the GP reported diarrhea for a median duration of 2 days and abdominal pain for 3 days, whereas adults that did visit the GP reported diarrhea for 4 days and abdominal pain for 6 days [60]. Taking into account both outbreak studies and the IID-study, we supposed that cases not visiting the GP had a duration of illness of 2.5 days and cases visiting the GP had a duration of illness of five days. Hospitalized patients from England/Wales were admitted to hospital for 10.5 days on average [53]. Taking this into account, we assumed that the duration of illness of hospitalized patients was 14 days. The age distribution of C. perfringens induced food poisoning is summarized in Table 12. The age distribution of cases not visiting the GP is unknown for the Netherlands. We therefore supposed that the age distribution of cases not visiting the GP (no GP) is similar to the age distribution observed in the laboratory confirmed cases reported by the Dutch PHL participating in ISIS. To render the age distribution of cases that did visit a GP (GP) and cases that were hospitalized (hospitalization), we also used the cases reported by the PHLs. Data on the age distribution of fatal cases of C. perfringens food poisoning are lacking. However, it is suggested that death due C. perfringens food poisoning is mainly seen in elderly [44, 47]. This is supported by findings reported in several outbreak studies [61-63]. Therefore, we assumed that fatal cases only occurred in the age group of 65 years and older.
Table 12. Age distribution of C. perfringens-associated gastroenteritis.
Age classes
0-4 years 5-9 years 10-14 years 15-64 years > 65 years Gastroenteritis
No GPa 3% 1% 3% 33% 61%
GPb 4% 1% 8% 33% 54%
Hospitalizationb 2% 1% 1% 27% 69%
Fatalc - - - - 100%
a) no information available. We used laboratory confirmed cases reported by PHLs from ISIS as a proxy. b) based on C. perfringens cases reported by PHLs from ISIS.
5.2
Disease burden
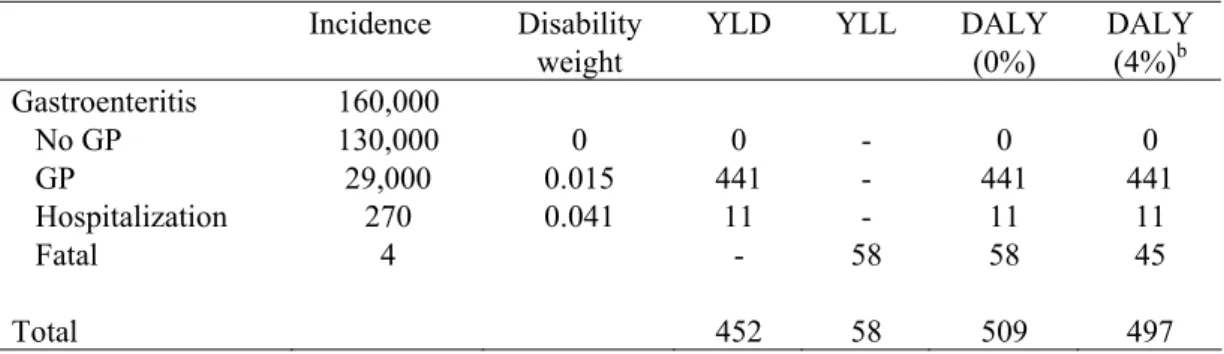
The estimated number of YLD, YLL and DALYs lost due to C. perfringens food poisoning are shown in Table 13. Both the discounted (4%) and the undiscounted number of DALYs lost are calculated. The incidence, duration and disability weights used for the estimations are also shown in Table 12. In Figure 4 the DALY estimates for the most likely estimate and the uncertainty (low and high estimate) are shown for the total estimation as well as for each health state separately, both discounted and undiscounted.
Table 13. Incidence, duration and disease burden of C. perfringens food poisoning for 2006 (most likely estimates).
Incidence Disability weight
YLD YLL DALY (0%) DALY (4%)b Gastroenteritis 160,000 No GP 130,000 0 0 - 0 0 GP 29,000 0.015 441 - 441 441 Hospitalization 270 0.041 11 - 11 11 Fatal 4 - 58 58 45 Total 452 58 509 497
* Summations do not necessarily tally.
0 100 200 300 400 500 600 700 800 900 1,000
Total GE-NoGP GE-GP GE-Hosp GE-Fatal
DAL Ys p er y ea r
Most likely (0%) Most likely (4%)
Figure 4. Disease burden of C. perfringens-associated gastroenteritis for 2006, using most likely estimates, discounted (4%) and undiscounted (0%). Error bars express an uncertainty interval that results from using low and high estimates.
5.3 Cost-of-illness
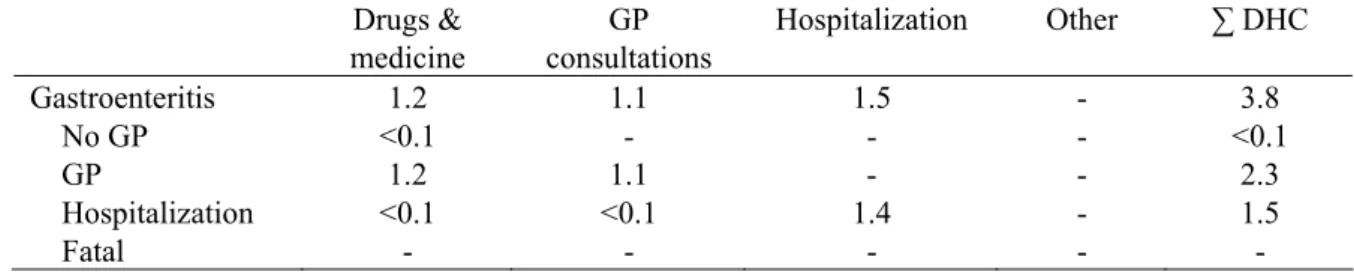
Based on the incidence and duration of illness shown in Table 11, and following in general the assumptions described in section 2 and in the previous report, we estimated the direct health care costs for the different health states. An average hospital stay of 10.5 days was assumed for C. perfringens cases. DHC results of C. perfringens cases are summarized in Table 14 for the most likely estimate only.
Table 14. DHC of C. perfringens-associated gastroenteritis in million euros for 2006 (most likely estimates).
Drugs & medicine GP consultations Hospitalization Other ∑ DHC Gastroenteritis 1.2 1.1 1.5 - 3.8 No GP <0.1 - - - <0.1 GP 1.2 1.1 - - 2.3 Hospitalization <0.1 <0.1 1.4 - 1.5 Fatal - - - - -
Productivity losses due to paid employment lost was considered in the current study due to work absence of patients as well as due to work absence of third persons taking care of sick persons, according to the assumptions described in section 2. The estimated overall work absence for C. perfringens patients not visiting a GP and C. perfringens patients visiting a GP only, were estimated to be a 0.22 days and 0.69 days, respectively. In Table 14 we have summarized the estimated number of days paid employment lost for adult patients and for third persons taking care of a sick person. We further present in Table 15 the most likely estimate of Indirect Non Health Care Costs (INHC).
Table 15. Number of days paid employment lost and INHC of community acquired C. perfringens-associated gastroenteritis in million euros for 2006 (most likely estimates).
No. of days paid employment lost
Productivity losses ∑ INHC
Patient Third person Patient Third person
Gastroenteritis - - 4.7 0.9 5.6
No GP 0.2 1 2.6 0.6 3.2
GP 0.7 1 1.9 0.3 2.2
Hospitalization 5.0 3 0.1 - 0.1
Fatal 154 - - - -
In Table 16 and Figure 5 we present the cost-of-illness of community acquired C. perfringens-associated GE in detail for the different health states in million euros for 2006.
Table 16. Cost-of-illness of community acquired C. perfringens-associated gastroenteritis for the different health states in million euros for 2006 (most likely estimates).
(discounting) DHC (0%) DNHC (0%) INHC (0%) ∑ Costs (0%) Gastroenteritis 3.8 <0.1 5.6 9.4 No GP <0.1 - 3.2 3.3 GP 2.3 <0.1 2.2 4.6 Hospitalization 1.5 - 0.1 1.6 Fatal - - - -
In Figure 5 we have summarized the most likely estimate and the most likely estimate with attendant uncertainty, respectively, for the total cost of community acquired C. perfringens-associated GE cases. Given that all costs occur within one year, discounting is not an issue.
0 2 4 6 8 10 12 14 16 18 20
Total NoGP GP Hosp Fatal
To ta l c os ts in € m ill io n p er y ea r Most likely (0%)
Figure 5. Total cost-of-illness of community acquired C. perfringens-associated gastroenteritis, using most likely estimates. Error bars express an uncertainty interval that results from using low and high estimates. Discounting was not required as all costs occur within the first year.
5.4 Scenario analysis
In the current study the number of cases with gastroenteritis due to C. perfringens that consulted a GP was based on data from study of Adak et al. who found a GP consultation rate of 0.53 for C. perfringens in the UK [53]. This rate was then adapted for the Dutch situation, resulting in a GP consultation rate of 0.19. This latter adaptation contains some uncertainties, since general differences in consultation rates between the Netherlands and the UK were used for the adaptation. It is unclear whether the differences in consultation rate between UK and the Netherlands hold true for the relatively mild symptoms of gastroenteritis caused by C. perfringens.
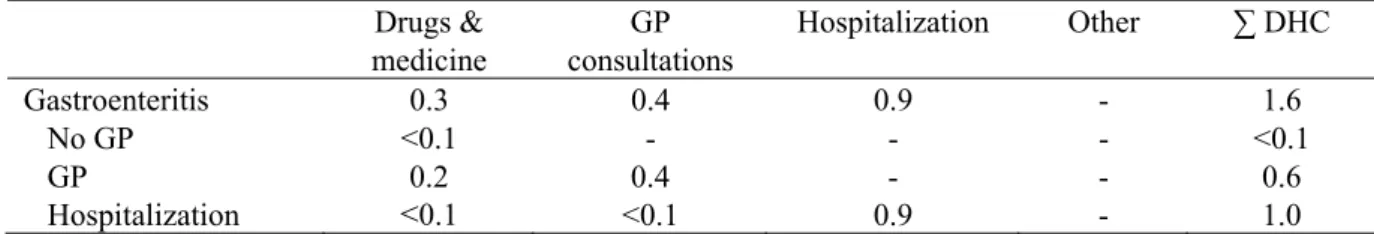
In Table 17 we have summarized the incidence and burden of disease if we apply the GP consultation rate of 0.53 rather than the adapted consultation rate. Using the UK GP consultation rate for C.
perfringens increases the number of DALYs lost significantly by 154% from 509 to 1,293 DALYs and the cost-of-illness with 64% from 9.4 to 15.9 million euros.
Table 17. Incidence, DALY and cost-of-illness of community acquired C. perfringens-associated GE for the different health states a.
Pathogen Incidence DALY
(0%) Cost (0%) Gastroenteritis 160,000 1,293 15.9 No GP 73,000 0 1.9 GP 82,000 1,224 12.4 Hospitalization 270 11 1.6 Fatal 4 58 0
a) Summations might not necessarily tally because of rounding
5.5 Discussion
Each year about 160,000 cases of C. perfringens food poisoning occur in the Dutch population. Although the incidence is relatively high, the duration of the symptoms is short, often lasting no longer than 2 days. About one in five cases of C. perfringens food poisoning requests medical help and an estimated 4 people die annually due to C. perfringens food poisoning. C. perfringens food poisoning results in a loss of 509 DALYs per year, with an uncertainty range of 215 DALYs to 942 DALYs per year (undiscounted). Total costs associated with C. perfringens-associated gastroenteritis amounted to 9 million euros (uncertainty range 4 million euros to 19 million euros). INHC accounted for 59% of all costs associated with C. perfringens gastroenteritis cases, the majority from patients, or their caretaker, not requiring any medical services. DHC accounted for 40% of all costs.
On average, with each C. perfringens food poisoning case 0.003 DALYs are lost. The mean cost-of-illness of C. perfringens food poisoning is 61 euros per case.
A problem concerning the estimation of the burden of disease and cost-of-illness of C. perfringens is the lack of data. C. perfringens food poisoning is not systematically registered in the Netherlands, therefore estimations regarding the incidence in the population, mortality and age distribution had to be drawn from other sources, like literature. This adds to the uncertainty of the estimations of both valuation criteria.
Secondly, it should be noted that information on the duration of illness of C. perfringens food poisoning was based on the IID-study. The duration reported by the IID-study, however, seems quite long compared to the duration of illness reported in several outbreak studies. The main share of outbreak studies recorded a duration of illness of less than 24 hours, whereas the IID study reported a length of illness of 3 days. As a result, the most likely estimation of the burden of disease and cost-of-illness might be fairly high.
6 Staphylococcus aureus
Staphylococcus aureus (S. aureus) is an aerobic Gram-positive bacterium that can be found in the air, on dust, in sewage, water, milk, and food, as well as on animals and humans. Approximately 30-50% of the human population carries S. aureus on the skin, the throat or in the nose [64, 65]. Usually these S. aureus do not cause illness; however, they may cause skin infections, like folliculitis. Furthermore, S. aureus carried on the body of food handlers or other sources may contaminate food that comes in contact with their hands [64, 66]. Subsequent improper storage of the food may enhance multiplication of S. aureus and production of heat-stable protein toxins [67]. S. aureus may also originate from food-producing animals or from contaminated equipment.
If an individual ingests food with preformed staphylococcal enterotoxins, food poisoning may occur. The symptoms of staphylococcal food poisoning have a rapid onset (2 to 6 hours) and include nausea, vomiting, and abdominal cramping. The symptoms are self-limiting and resolve within 24 to 48 hours of onset [68]. In severe cases of S. aureus food poisoning headache, muscle cramping, changes in blood pressure and pulse rate may occur. The complications of S. aureus intoxication may be lethal, although this happens very rarely [69].
Because S. aureus cannot form spores, food contamination can be easily prevented by proper heating of the food [65]. In spite of this, S. aureus is one of the most common causes of food borne illness [52, 54, 61, 70].
6.1 Outcome tree, incidence and duration of illness
6.1.1 Outcome tree and incidence
To estimate the incidence of S. aureus food poisoning, we used data from the SENSOR-study [3]. By adjusting the SENSOR-data collected in 1998 and 1999 to the Dutch population growth and age composition of the year 2006, we estimated that the annual incidence of S. aureus food poisoning in Dutch population was 270,000, with an uncertainty ranging from 150,000 (low estimate corresponding to the 5th percentile) to 450,000 (high estimate corresponding to the 95th percentile).
For the Netherlands it is unknown how many cases of S. aureus food poisoning consult a GP. Adak et al. [53] estimated that in England/Wales 40% of patients with S. aureus food poisoning would visit a GP. However, due to differences in consultation rates between England/Wales and the Netherlands, this percentage is most probably higher than the percentage of cases consulting the GP in the Netherlands [3, 71]. Since the GP consultation rate in the Netherlands is about three times lower compared to England/Wales, we presumed that in the Netherlands 14% of S. aureus food poisoning cases consulted the GP, resulting in an estimated 39,000 cases consulting the GP due to S. aureus food poisoning in 2006, with a minimum estimation of 21,000 and a maximum estimation of 64,000.
Regarding hospitalization, rates ranging from 0.005 up to 0.18 have been reported [53, 54, 70-72]. Because of the rapid and often mild course of S. aureus food poisoning on the hand, and the improper sample collection and examination on the other hand, the total number of S. aureus food poisoning cases is often underestimated [64]. Therefore, we adopted a hospitalization rate of 0.005. Thus, most likely 1,400 cases of S. aureus food poisoning were hospitalized, with a minimum of 750 cases, and a maximum of 2,300 cases.
Fatal cases of S. aureus food poisoning are very rare; nevertheless fatal cases do occur among susceptible subjects, like elderly people. Using the fatality rate reported by Mead et al., we estimated that annually 3 fatal cases occur, with a minimum of 2 and a maximum of 5 cases [54].
The outcome tree of S. aureus is shown in Figure 6. Table 18 presents the estimated incidence of S. aureus food poisoning.
Figure 6. Outcome tree S. aureus-associated gastroenteritis.
Table 18. Incidence S. aureus-associated gastroenteritis for 2006.
Incidence estimates (cases per year)
Most likely Low High
Gastroenteritis 270,000 150,000 450,000
No GP 230,000 120,000 380,000
GP 39,000 21,000 64,000
Hospitalization 1,400 750 2,300
Death 3 2 5
* Summations do not necessarily tally.
6.1.2 Duration of illness and age-distribution
S. aureus food poisoning symptoms usually abate within 24 hours [61, 65, 73]. We estimated that for cases not visiting the GP the duration of the symptoms was one day. For cases visiting the GP mean duration of symptoms was estimated at four days. A study on a massive S. aureus food poisoning incident affecting approximately 4,000 people reported a duration of hospitalization of 7-10 days [70]. We therefore assumed length-of-illness of symptoms of 12 days for hospitalized cases.
The age distribution of S. areus-associated gastroenteritis is summarized in Table 19. We assumed that the age distribution of gastroenteritis as found in the SENSOR study would be representative for S. areus cases not visiting a GP (no GP) [3]. The age distribution of cases visiting a GP and
hospitalized cases are based on ISIS data. Fatal cases of S. areus food poisoning occur mainly among the elderly [61, 69, 71].
Table 19. Age distribution of S. aureus-associated gastroenteritis.
Age classes
0-4 years 5-9 years 10-14 years 15-64 years > 65 years Gastroenteritis
No GPa 33% 14% 8% 35% 10%
GPb 26% 7% 10% 46% 12%
Hospitalizationb 23% 1% 3% 41% 32%
Fatalc - - - - 100%
a) no information available. We used laboratory confirmed cases reported by PHLs from ISIS as a proxy. b) based on S. aureus cases reported by PHLs from ISIS
c) no pathogen specific information available.
6.2
Disease burden
The estimated number of YLD, YLL and DALYs lost due to S. aureus food poisoning are shown in Table 20, both undiscounted and discounted (4%). The incidence, duration and disability weights used for the estimations are also shown in Table 20. In Figure 7 the DALY estimates for the most likely estimate and the uncertainty (low and high estimate) are shown for the total estimation as well as for each health state separately, both discounted and undiscounted.
Table 20. Incidence, duration and disease burden of S. aureus food poisoning for 2006 (most likely estimates).
Incidence Duration Disability weight
YLD YLL DALY (0%) DALY (4%)b Gastroenteritis 270,000 No GP 230,000 1 day 0 0 - 0 0 GP 39,000 4 days 0.015 592 - 592 592 Hospitalization 1,400 12 days 0.041 57 - 57 57 Fatal 3 11,5 years - 39 39 30 Total 649 39 688 667
0 200 400 600 800 1,000 1,200
Total GE-NoGP GE-GP GE-Hosp GE-Fatal
DAL Ys p er y ea r
Most likely (0%) Most likely (4%)
Figure 7. Disease burden of S. aureus-associated gastroenteritis for 2006, using most likely estimates, discounted (4%) and undiscounted (0%). Error bars express an uncertainty interval that results from using low and high estimates.
6.3 Cost-of-illness
Based on the incidence and duration of illness shown in Table 18, and following in general the
assumptions described in chapter 2 and in the previous report, we estimated the direct health care costs for the different health states. An average hospital stay of twelve days was assumed for Staphylococcus aureus cases. DHC results of S. aureus cases are summarized in Table 21 for the most likely estimate only.
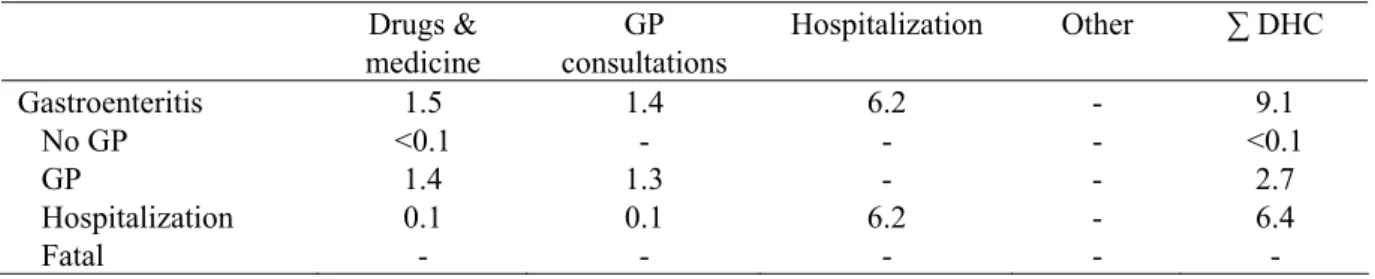
Table 21. DHC of S. aureus-associated gastroenteritis in million euros for 2006 (most likely estimates).
Drugs & medicine GP consultations Hospitalization Other ∑ DHC Gastroenteritis 1.5 1.4 6.2 - 9.1 No GP <0.1 - - - <0.1 GP 1.4 1.3 - - 2.7 Hospitalization 0.1 0.1 6.2 - 6.4 Fatal - - - - -
Productivity losses due to paid employment lost was considered in the current study due to work absence of patients as well as due to work absence of third persons taking care of sick persons,
according to the assumptions described in Chapter 2. The estimated overall work absence for S. aureus patients not visiting a GP and S. aureus patients visiting a GP only, were estimated to be a 0.09 days and 0.56 days, respectively. In Table 22 we have summarized the estimated number of days paid
employment lost for adult patients and for third persons taking care of a sick person. We further present in Table 22 the most likely estimate of Indirect Non Health Care Costs (INHC).
Table 22. Number of days paid employment lost and INHC of community acquired S. aureus-associated gastroenteritis in million euros for 2006 (most likely estimates).
No. of days paid employment lost
Productivity losses ∑ INHC
Patient Third person Patient Third person
Gastroenteritis - - 5.3 1.4 6.7
No GP 0.09 - 2.0 0.9 2.9
GP 0.56 - 2.6 0.5 3.1
Hospitalization 6.21 4 0.7 <0.1 0.7
Fatal 154 - - - -
In Table 23 and Figure 8 we present the cost-of-illness of community acquired S. aureus-associated GE in detail for the different health states in million euros for 2006.
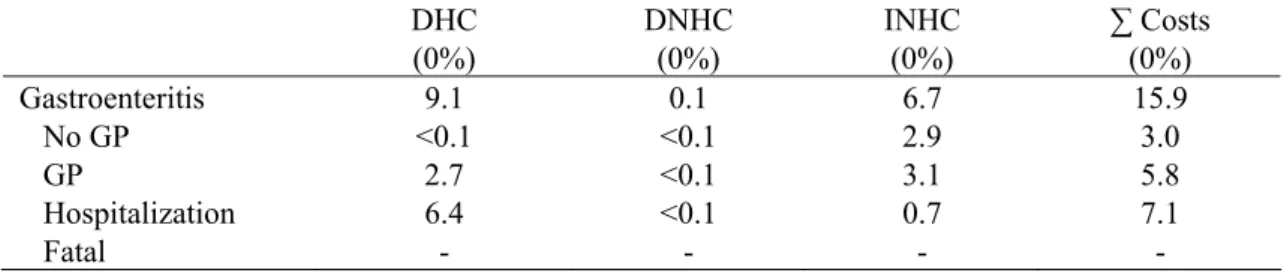
Table 23. Cost-of-illness of community acquired S. aureus-associated gastroenteritis for the different health states in million euros for 2006 (most likely estimates).
DHC (0%) DNHC (0%) INHC (0%) ∑ Costs (0%) Gastroenteritis 9.1 0.1 6.7 15.9 No GP <0.1 <0.1 2.9 3.0 GP 2.7 <0.1 3.1 5.8 Hospitalization 6.4 <0.1 0.7 7.1 Fatal - - - -
In Figure 8 we have summarized the most likely estimate with attendant uncertainty, respectively, for the total cost of community acquired S. aureus-associated gastro-enteritis cases. Given that all costs occur within one year, discounting is not an issue.
0.00 5.00 10.00 15.00 20.00 25.00 30.00 35.00
Total NoGP GP Hosp Fatal
To ta l c os ts in € m ill io n p er y ea r Most likely (0%)
Figure 8. Total cost-of-illness of community acquired S. aureus-associated gastroenteritis, using most likely estimates. Error bars express an uncertainty interval that results from using low and high estimates. Discounting was not required as all costs occur within the first year.
Total costs associated with community acquired S. aureus-associated GE totalled to 15.9 million euros (8.7 million euros to 29.3 million euros), about 45% due to hospitalization.
6.4 Scenario analysis
In the current study, the number of cases with gastroenteritis due to S. aureus that consulted a GP was based on data from the study of Adak et al. who found a GP consultation rate of 0.40 for S. aureus in the UK [53]. This rate was then adapted for the Dutch situation, resulting in a GP consultation rate of 0.14. This latter adaptation contains some uncertainties, since general differences in consultation rates between the Netherlands and the UK were used for the adaptation. It is unclear whether the difference in consultation rates between UK and the Netherlands hold true for the relatively mild symptoms of gastroenteritis caused by S. aureus.
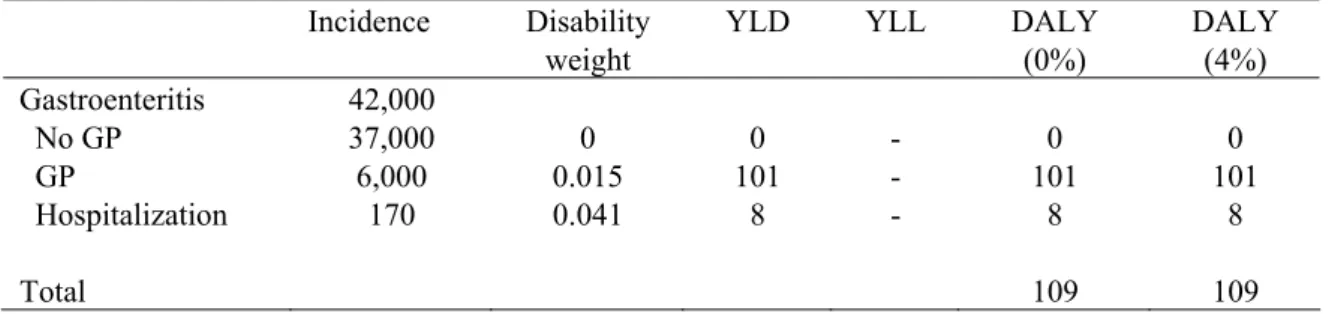
In Table 24 we have summarized the incidence and burden of disease if we apply the GP consultation rate of 0.40 rather than the adapted consultation rate. Using the UK GP consultation rate for S. aureus increases the number of DALYs lost significantly by 160% from 109 to 1,740 DALYs and the cost-of-illness with 75% from 9.1 to 15.9 million euros.
Table 24. Incidence, DALY and cost-of-illness of community acquired S. aureus-associated gastroenteritis for the different health states a.
Pathogen Incidence DALY
(0%) Cost (0%) Gastroenteritis 270,000 1,740 15.9 No GP 160,000 0 3.0 GP 110,000 1,643 5.8 Hospitalization 1400 57 7.1 Fatal 3 39 0
a) Summations might not necessarily tally because of rounding
6.5 Discussion
With respect to incidence, S. aureus with 270,000 cases of gastro-enteritis in the Dutch population per year outnumbers all other pathogens except for norovirus (470,000 cases). The course of the disease is generally mild and fatal cases are very rare. Annually, an estimated 3 cases per year die due to food poisoning. Despite the relatively high incidence of S. aureus-associated gastroenteritis, the associated burden of disease is about 688 DALYs per year, with an uncertainty range of 367 DALYs to 1,122 DALYs per year (undiscounted). The disease burden of patients visiting the GP attributed the majority (86%) to the burden of disease.
Total costs associated with S. aureus-associated gastroenteritis amounted to 15.9 million euros (uncertainty range 8.7 million euros to 29.3 million euros). DHC accounted for 57% of all costs associated with S. aureus gastroenteritis cases. INHC accounted for 42% of the total cost-of-illness of S. aureus food poisoning.
Similarly to C. perfringens, with each case of S. aureus food poisoning on average 0.003 DALYs are lost. The mean cost-of-illness of S. aureus food poisoning is 58 euros per case, which is slightly lower compared to the average 61 euros of a C. perfringens food poisoning case.
Data on S. aureus is scarce. Hence, assumptions were made based on sources such as literature. These assumptions concerned health care use, fatalities, and duration of symptoms; variables that are used for both burden of disease estimates and cost-of-illness calculations. This implies that the results presented in this section have a relatively high uncertainty which should be taken into consideration.