RIVM Report 260801004/2007
Opportunities for preventing diabetes and its
cardiovascular complications
A modelling approach
M.A.M. Jacobs-van der Bruggen P.M. Engelfriet G. Bos R.T. Hoogenveen T.L. Feenstra C.A. Baan Contact: Caroline A. Baan RIVM-PZO Caroline.Baan@rivm.nl
This investigation has been performed by order and for the account of Ministry of Health, Welfare and Sport, within the framework of Kennisvraag diabetes
© RIVM 2007
Parts of this publication may be reproduced, provided acknowledgement is given to the 'National Institute for Public Health and the Environment', along with the title and year of publication.
Abstract
Opportunities for preventing diabetes and its cardiovascular complications: a modelling approach
If interventions aimed to reduce overweight and promote physical activity would be implemented on a national scale in the Netherlands, between 1% and 2% of new cases of diabetes would be prevented over a 20-year period. More intensive treatment of persons with diabetes would prevent 5% to 10% of new cases of macrovascular complications. In order to prevent the burden of disease due to diabetes, prevention is crucial.
In this study the long-term efficacy of various interventions in preventing diabetes and its
complications was investigated. In addition the costs and cost-effectiveness of these interventions were evaluated. This was done with the help of a computer model that was designed to track the evolution of the Dutch population over time, with regard to risk factors, chronic diseases and mortality.
Reducing the prevalence of overweight is the most powerful tool in preventing diabetes. As the interventions currently available allow the realisation of not more than a small part of the potential health gains, it is mandatory to continue to invest in identifying and developing effective measures to loose weight in a sustainable manner. Smoking cessation does not contribute to preventing diabetes. But, of course, it does prevent other diseases. In treating indivuals with diabetes, interventions aimed at lowering cholesterol and blood pressure result in greater health gains than intensifying blood sugar control.
Succesful prevention of diabetes and its complications leads to higher overall costs of care due to the fact that people live longer and as a consequence incur healthcare costs in life years gained. However, in all interventions evaluated, health gains justify the extra costs.
Key words:
Rapport in het kort
Kansen voor de preventie van diabetes en de cardiovasculaire complicaties: een modelstudie
Als interventies gericht op verminderen van overgewicht en bevorderen van lichamelijke activiteit op landelijk schaal worden ingevoerd, zouden de komende 20 jaar 1 à 2% van de nieuwe gevallen van diabetes kunnen worden voorkomen. Daarnaast zouden de komende 20 jaar 5 à 10% van de nieuwe macrovasculaire complicaties bij mensen met diabetes kunnen worden voorkomen door intensievere behandeling. Preventie is essentieel om de toekomstige ziektelast van diabetes zoveel mogelijk te beperken.
Van verschillende maatregelen is berekend in welke mate zij bijdragen aan het voorkómen van diabetes of diabetescomplicaties op de lange termijn. Daarnaast zijn voor deze maatregelen de kosten en
kosteneffectiviteit geschat. Hierbij is gebruikgemaakt van een computermodel dat in staat is de ontwikkelingen van de Nederlandse bevolking, voor wat betreft risicofactoren, chronische ziekten en sterfte, te volgen over de tijd.
Terugdringen van overgewicht is het belangrijkste wapen in het voorkomen van diabetes. Omdat met de bestaande interventies slechts een fractie van de mogelijke gezondheidswinst wordt gerealiseerd, moeten we blijven investeren in het identificeren en ontwikkelen van effectieve maatregelen om (blijvend) af te vallen. Stoppen met roken draagt niet bij aan preventie van diabetes maar wel aan preventie van andere chronische aandoeningen. Bij mensen met diabetes levert behandeling gericht op cholesterol- en bloeddrukverlaging een grotere bijdrage aan de preventie van macrovasculaire
complicaties dan verder intensiveren van bloedsuikerbehandeling.
Succesvolle preventie van diabetes en diabetescomplicaties leidt tot hogere totale zorgkosten doordat mensen langer leven en zorgkosten maken in gewonnen levensjaren. Echter, voor alle bestudeerde maatregelen geldt, dat de gezondheidswinst de extra kosten rechtvaardigt.
Trefwoorden: diabetes, preventie, cardiovasculaire complicaties, modellering, kosteneffectiviteit, Chronische Ziekten Model
Voorwoord
Dit rapport werd geschreven in het kader van Programma 2 ‘Beleidsondersteuning Volksgezondheid en Zorg’ en heeft betrekking op kennisvraag 4 ‘Diabetes’ (2007).
Diabetes is al sinds enkele jaren een speerpunt van het beleid van het Ministerie van Volksgezondheid, Welzijn en Sport. Het beleidskader is vastgelegd in de nota ‘Langer gezond leven’ en in de beleidsbrief aan de Tweede Kamer ‘kiezen voor gezond leven’. Via het Nationaal Diabetes Actieprogramma wil het ministerie tot een samenhangende aanpak komen om de sterke toename in het aantal mensen met diabetes tegen te gaan. De directie Publieke Gezondheid heeft het RIVM verzocht om de
kosteneffectiviteit van diverse preventiemaatregelen door te rekenen. Het huidige rapport beschrijft de effecten op de volksgezondheid en de daarmee gepaard gaande kosten van diverse scenarios gericht op het voorkomen van diabetes of diabetescomplicaties. Het is een interessant en informatief rapport geworden dat een belangrijke basis kan bieden voor de verdere uitwerking van het Nationaal Diabetes Actieprogramma.
Wij zijn de volgende personen zeer erkentelijk voor het becommentariëren van (delen van) een eerdere versie van dit rapport: dr. P.H.M. van Baal, mw. dr. H.C. Boshuizen, mw. dr. ir. W.J.E. Bemelmans.
C.A. Baan projectleider
Contents
Samenvatting 9
1 Introduction 13
2 General description of methods used 15
2.1 The Chronic Disease Model (CDM) 15
2.2 Simulation cohorts 16
2.3 Risk factors in the CDM 17
2.4 General approach 18
2.5 Scenarios 19
PART 1: UNIVERSAL AND SELECTIVE PREVENTION OF DIABETES 21
3 Weight loss and increased physical activity 23
3.1 Description of the lifestyle scenarios 24
3.2 Long-term effects on health outcomes 25
3.3 Long-term effects for health care costs 26
3.4 Sensitivity analyses 29
3.5 Summary 30
4 Smoking cessation 31
4.1 Description of scenarios 31
4.2 Long-term effects of smoking cessation on health outcomes 32
4.3 Smoking cessation and health care costs 33
4.4 Sensitivity analyses 34
4.5 Summary 35
PART 2: CARE-RELATED PREVENTION OF COMPLICATIONS 36
5 Blood glucose: intensive control 37
5.1 Description of scenarios 38
5.2 Long-term effects for health outcomes 38
5.3 Long-term effect on health care costs 39
5.4 Sensitivity analyses 41
5.5 Summary 41
6 Cholesterol-lowering treatment 43
6.1 Description of scenarios 43
6.2 Long-term effects for health outcomes 44
6.3 Long-term effects for health care costs 45
7.5 Summary 53
8 Prevention of complications: multifactorial treatment 55
8.1 Description of scenarios 55
8.2 Long-term effects on health outcomes 55
8.3 Long-term effect on health care costs 56
8.4 Sensitivity analyses 56
8.5 Summary 57
PART 3 GENERAL DISCUSSION 58
9 Summary, discussion, and recommendations 59
9.1 Summary of findings 59
9.2 Highlights and recommendations: prevention of diabetes 64 9.3 Highlights and recommendations: prevention of complications 65
9.4 General, methodological issues 67
9.5 Conclusions 68
References 69
Appendix 1: Sensitivity analyses for lifestyle intervention 77
Samenvatting
Ontstaan en verloop van type 2-diabetes worden beïnvloed door een aantal risicofactoren. Sommige hebben vooral effect op het krijgen van de ziekte (incidentie), andere juist op het optreden van complicaties. Door het ontwikkelen en toepassen van maatregelen om deze risicofactoren te beïnvloeden, kan de ziektelast van diabetes worden verminderd.
In dit rapport onderzoeken we in hoeverre bepaalde maatregelen, gericht op het bestrijden van risicofactoren, kunnen bijdragen aan het voorkómen van diabetes enerzijds of het voorkómen van het optreden van complicaties bij mensen met diabetes, anderzijds. Tevens is gekeken naar de kosten en kosteneffectiviteit van de maatregelen.
De studie is uitgevoerd met behulp van het Chronische Ziekten Model (CZM) dat op het RIVM is ontwikkeld. Dit model simuleert de ontwikkelingen van de Nederlandse bevolking voor wat betreft risicofactoren, chronische ziekten en sterfte over de tijd.
Uitgangspunt van de analyses is steeds een specifieke risicofactor. Voor iedere risicofactor is eerst gekeken naar de theoretisch te behalen gezondheidswinst, bij volledige verwijdering van de risicofactor onder de bevolking in een theoretisch ‘maximum scenario’. Vervolgens is een haalbaar geachte
interventie gesimuleerd in een ‘realistisch scenario’. In het realistische scenario is bijvoorbeeld rekening gehouden met het bereik van een interventie (welk deel van de populatie), bewezen effectiviteit en interventiekosten.
Deel 1 van dit rapport beschrijft een aantal preventieve interventies, gericht op het terugdringen van overgewicht, lichamelijke inactiviteit en roken, met als doel om het ontstaan van diabetes te vookomen. De scenario’s worden gesimuleerd voor een cohort, representatief voor de Nederlandse bevolking in de leeftijdsgroep 20 tot 80 jaar in 2005 (n=11,8 miljoen). De simulatie stopt als iedereen in het cohort is overleden. De uitkomsten voor de theoretisch maximale en realistische scenario’s worden vergeleken met een referentiescenario, waarin de huidige situatie (zonder interventie) wordt gesimuleerd. Het verwachte aantal nieuwe gevallen van diabetes in de Nederlandse bevolking in het referentiescenario tot aan 2025 is ongeveer 1,7 miljoen.
Als iedereen een gezond gewicht zou hebben en voldoende zou bewegen (maximum scenario), zou het aantal nieuwe gevallen van diabetes in Nederland in de komende 20 jaar ongeveer 50% minder zijn. Daarvoor zouden mensen met ernstig overgewicht (obesitas) echter gemiddeld 25 kilo moeten afvallen en mensen met overgewicht 10 kilo. Uitgaand van feitelijke ervaring met leefstijlinterventie is een gewichtsverlies van gemiddeld 0,5 tot 3,0 kilo haalbaar, afhankelijk van de intensiteit van de
interventie. In de realistische scenario’s zijn de effecten op het voorkómen van diabetes dan ook veel kleiner dan in het maximum scenario; 2% minder nieuwe diabetesgevallen in de komende 20 jaar bij een combinatie van maatregelen gericht op de gehele gemeenschap en op mensen met obesitas. In tegenstelling tot overgewicht, is er een relatief zwakke invloed van roken op het ontstaan van
gewichtsvermindering en stoppen met roken staat dat de kosten niet hoog zijn. De kosteneffectiviteitratio’s zijn heel gunstig.
Deel 2 van dit rapport beschrijft interventies gericht op betere controle van bloedsuiker, cholesterol en bloeddruk bij mensen met diabetes, met als doel het voorkomen van macrovasculaire complicaties (hart- en vaatziekten). In tegenstelling tot deel 1, waarin leefstijlaanpassingen centraal staan, gaat het hier om farmacologische interventies. De scenario’s worden gesimuleerd voor een cohort,
representatief voor mensen met diabetes in Nederland in de leeftijdsgroep 30-75 jaar, in 2005 (n=398.000). Bij voortduren van de huidige situatie zullen in dit cohort tot 2025 naar verwachting 63.000 beroertes optreden en 220.000 gevallen van hart- en vaatziekten. In de nieuwste richtlijnen evenals de Nederlandse Zorgstandaard voor diabetes (www.diabetesfederatie.nl), wordt aangeraden om alle risicofactoren voor het krijgen van diabetescomplicaties zoveel mogelijk te behandelen. Hoewel het dus om een totaal risicoprofiel gaat, hebben we de behandelingen gericht op optimaliseren van bloedsuiker, cholesterol en bloeddruk ook afzonderlijk geanalyseerd om een beeld te krijgen van de relatieve bijdrages van de behandelingen gericht op individuele risicofactoren.
Als alle mensen met diabetes in de laagste risicocategorie zouden zijn van hetzij bloedsuiker, hetzij cholesterol, hetzij bloeddruk, (maximum scenario’s) zou dat een vermindering betekenen in het optreden van hartziekten met respectievelijk 7%, 20% en 33% over een periode van 20 jaar. Voor beroertes zou dat respectievelijk 10%, 8% en 47% zijn. Optimaal instellen van de bloeddruk bij diabeten biedt de grootste potentiële winst. Hiervan is ongeveer 10% te realiseren (3% reductie in hartziekten en 5% voor beroertes) wanneer de helft van alle nu nog onbehandelde patiënten antihypertensiva zou krijgen (realistisch scenario). Een grotere winst is mogelijk, als daarnaast de patiënten die al behandeld worden met antihypertensiva een meer optimale medicatie zouden krijgen. De verwachte reductie in complicaties, wanneer meer mensen met diabetes cholesterolverlagende medicatie zouden krijgen, is ook 3% voor hartziektes en 5% voor beroertes. In het realistische scenario voor bloedsuiker worden alle patiënten die ondanks behandeling met twee orale bloedsuikerverlagende middelen toch een te hoog bloedsuiker hebben, overgeschakeld op insuline. In Nederland zijn de patiënten over het algemeen relatief goed ‘ingesteld’. Het gaat daarom slechts om een klein deel van de patiënten (12%). Bij dit scenario wordt in de komende 20 jaar 1% van de hartziekten en 1% van de beroertes voorkomen. Het verwachte effect van een (realistische) gecombineerde aanpak van
bloedsuiker, cholesterol en bloeddruk is bij benadering gelijk aan de som van de behandelingen gericht op de individuele risicofactoren.
Succesvolle preventie van diabetes en diabetescomplicaties leidt tot hogere totale zorgkosten doordat mensen langer leven en zorgkosten maken in gewonnen levensjaren. Echter, voor alle bestudeerde maatregelen geldt dat de gezondheidswinst de extra kosten rechtvaardigt. Verder onderzoek is gewenst naar kosten en effecten van leefstijlinterventies bij mensen met diabetes en de effecten van
verschillende preventieve maatregelen op microvasculaire complicaties. Andere aspecten die aandacht verdienen zijn effecten van interventies in de dagelijkse praktijk, langetermijneffecten van interventies, determinanten van therapietrouw, bijwerkingen van medicatie en de impact van (meervoudig)
medicijngebruik op de kwaliteit van leven.
Concluderend, om diabetes te voorkomen verdient het de aanbeveling om maatregelen gericht op gewichtsvermindering zoveel mogelijk te bevorderen. Maatregelen gericht op stoppen met roken voorkomen geen diabetes maar zijn wel belangrijk voor het terugdringen van andere chronische ziekten. De huidige maatregelen gericht op gedragsverandering leveren een fractie op van de potentiële gezondheidswinst. Het is daarom van belang (nieuwe) effectieve leefstijlinterventies te identificeren en te optimaliseren. Wat betreft preventie van macrovasculaire complicaties bij mensen met diabetes,
biedt behandeling van cholesterol en bloeddruk meer gezondheidswinst dan een verdere intensivering van de bloedglucosebehandeling bij mensen die matig zijn ingesteld. Vanuit dit perspectief dient er terughoudendheid betracht te worden in het overzetten van patiënten op insuline. Mede omdat
overschakelen op insuline behoorlijk ingrijpend kan zijn in het dagelijkse leven van de patiënt, en deze behandeling relatief duur is.
1
Introduction
In the Netherlands, 600,000 persons had diagnosed diabetes in 2003. Due to aging of the population and unfavourable lifestyle trends, this number is expected to increase to nearly a million in 2025 57. Diabetes has a large impact on quality of life, while the remaining life expectancy for a 45 year old person with diabetes is reduced by approximately ten years compared to a healthy person 57. Furthermore, the health care burden of diabetes is high. For example, the direct health care costs for diabetes and related complications in the year 2003 were estimated at 735 million euro, which is 1.3% of the total Dutch health care budget 57.
Several modifiable risk factors, such as obesity, physical inactivity and, to a lesser degree, smoking, play an important role in the development of type 2 diabetes. If favourable changes in these lifestyle factors are achieved, the disease can be prevented or delayed. Moreover, favourable lifestyle changes may also decrease the incidence of other chronic diseases such as cardiovascular disease and cancer. Prevention can either be targeted at the general population or at high risk groups. In this report we use the terms ‘universal prevention’ and ‘selective prevention’. Universal prevention targets the entire population and aims to improve lifestyle related health. Selective prevention aims to identify specific high risk groups and to conduct targeted prevention programs to improve health.
However, many persons already have diabetes and many among them will develop microvascular complications such as neuropathy, retinopathy or nephropathy as well as macrovascular complications such as coronary heart disease (CHD) and stroke. Cardiovascular disease is one of the most frequent complications of diabetes and the predominant cause of death among persons with diabetes 23. In order to prevent or delay diabetes complications, treatment for persons with diabetes should be intensive and multifactorial. This implies aiming at a healthy lifestyle (weight, activity and smoking) of the patient in combination with good glycaemic control and appropriate treatment of other important cardiovascular risk factors such as dislipidemia and hypertension. At this moment not all persons with diabetes are treated according to the most recent guidelines and thus current care is not optimal 42. The term ‘care-related’ prevention will be used throughout this report. Care-related prevention is an essential and integral part of high quality care for persons with (multiple) health problems. It aims to prevent, reduce or delay complications and to support self-management.
Our purpose in this report is to explore the potential effects of measures aimed to prevent the development of diabetes or macrovascular complications in persons with diabetes. Although many trials have been conducted to evaluate the efficacy of various preventive interventions, these trials are generally carried out under well-controlled conditions, in selected populations and with a limited duration of follow-up. Thus, although these studies may show favourable effects on risk factor levels or short-term disease incidence, the long-term consequences for morbidity, mortality and health care costs, in the population as a whole, are unclear. Therefore we used a modeling approach to calculate the long-term health effects for different prevention scenarios. Furthermore, the long-term consequences for health care costs and the cost-effectiveness of several interventions were explored. The results from this report will hopefully provide meaningful insights into the extent to which specific measures may
interventions to promote smoking cessation (chapter 2). Part two deals with the prevention of macrovascular complications in persons with diabetes through intensified medical care (care-related prevention). We will address more intensive control of blood glucose (chapter 3), cholesterol-lowering treatment (chapter 4), antihypertensive treatment (chapter 5) and a combination of these (chapter 6). Part three gives a summary of the main findings and a discussion of methodological issues and implications (chapter 7).
This report is the first of several publications that explore the costs and effects of different scenarios for prevention and treatment of diabetes.
2
General description of methods used
2.1
The Chronic Disease Model (CDM)
The CDM is a Markov-type, multistate transition model, developed at the Dutch National Institute for Public Health and the Environment (RIVM) and can be used to model developments in the Dutch general population 15428162768. In short, the model describes the development over time of demography, risk factor prevalence, disease incidence and mortality in the Dutch population. A
representation of the associations between risk factors and diseases in the CDM, relevant for this report, is given in Figure 1 below.
DIABETES BMI Physical activity CHD Smoking HbA1c SBP Total Cholesterol
Risk factors for diabetes incidence and cardiovascular diseases (Part 1) Risk factors for cardiovascular complications (Part 2)
Cardiovascular diseases (macrovascular complications of diabetes) CHF
The CDM can also be used for projections, confined to the Dutch diabetes population. A justification of the input data used for diabetes has been given by Baan et al. 4. It is important to note that
microvascular diabetes complications are not included in the model. Furthermore, the model does not include recurrent cardiovascular events. Thus, a person who survives a stroke may develop another cardiovascular complication but not a second stroke.
The associations between risk factors and disease incidence (relative risks) that are used as input parameters in the CDM are based on international cohort- and intervention studies. Input parameters for risk factor- and disease prevalence, mortality rates and transition rates between risk factor classes apply to the Dutch population. All data are age- and sex specific 74.
The Global and Dutch Burden of Disease studies were used to derive the parameters needed to compute health effects in terms of quality-adjusted life-years (QALYs) 7449674373. Health care costs in the model are based on the Dutch costs of illness study 2003 65 (More details about costs and economic evaluations with the CDM can be found in two articles by Van Baal et al. 7472). The price year for all costs is 2005. Cost-effectiveness ratios (CER) for the interventions will be expressed as costs
(intervention costs + total health care costs) per quality adjusted life year gained. Because we use a life-time perspective, costs and effects (QALYs) are discounted with 4.0% and 1.5%, respectively as recommended in Dutch guidelines. This means that future costs (and effects) have less weight than costs and effects within the first years. For example, costs count for 100% in year 1, for 47% in year 20 and for 7% in year 70, while effects count for 100% in year 1, for 75% in year 20 and for 36% in year 70.
Information about the CER of an intervention, besides other considerations, may be helpful to policy makers in deciding whether an intervention should be implemented. The threshold value for cost-effectiveness differs between countries. In the Netherlands, (preventive) interventions with a CER under €20,000 /QALY are generally considered cost-effective. The World Health Organization bases the CER threshold on the gross domestic product (GDP). Interventions with a CER lower than the GDP per capita (in the Netherlands 30,000 euro in 2004, CBS statline) are considered very cost-effective, interventions with CER one to three times GDP are considered cost-effective and interventions with CER more than three times GDP (about €90,000 /QALY in the Netherlands) are considered not cost-effective.
2.2
Simulation cohorts
The simulation cohort used to model the effects for universal and selective prevention resembles the Dutch population, 20 to 80 years, in 2005 (n=11.8 million). We use the entire adult population because universal prevention may have an impact on all adults. The simulation cohort used to model the effects of care-related prevention resembles the Dutch diabetes population, 30 to 75 years, in 2005
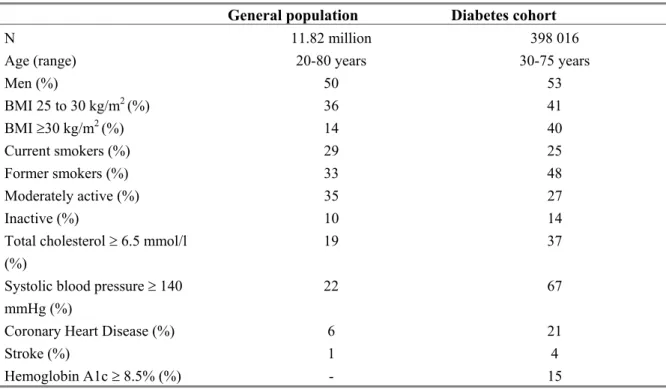
(n=398.000). Here the age-range is confined to 30-75 because there are few young persons with diabetes who will require pharmacological treatment as considered in this report, and information about risk factor distribution and treatment effects, needed for the calculations, is limited for persons over the age of 75. Characteristics for both cohorts are displayed in Table 1.
Table 1 Characteristics of the ‘general population’ and the ‘diabetes cohort’
General population Diabetes cohort
N 11.82 million 398 016
Age (range) 20-80 years 30-75 years
Men (%) 50 53 BMI 25 to 30 kg/m2 (%) 36 41 BMI ≥30 kg/m2 (%) 14 40 Current smokers (%) 29 25 Former smokers (%) 33 48 Moderately active (%) 35 27 Inactive (%) 10 14
Total cholesterol ≥ 6.5 mmol/l (%)
19 37 Systolic blood pressure ≥ 140
mmHg (%)
22 67
Coronary Heart Disease (%) 6 21
Stroke (%) 1 4
Hemoglobin A1c ≥ 8.5% (%) - 15
2.3
Risk factors in the CDM
Body Mass Index (BMI) is categorized into three classes: normal (BMI<25 kg/m2), overweight (BMI 25 to 30 kg/m2) and obese (BMI ≥ 30 kg/m2). A higher BMI increases the risk for all cause mortality, diabetes, cardiovascular diseases, musculoskeletal disorders and cancers.
Physical activity is modeled as a discrete variable with three classes: active (30 minutes of activity of
moderate intensity on at least five days of the week), moderately active (30 minutes of activity of moderate intensity on one to four days of the week) and inactive (less than one day a week of at least 30 minutes of moderate intensity activity). Low physical activity increases the risk for all cause mortality, diabetes, cardiovascular diseases, and cancers.
Smoking is modeled according to status as never smoker, former smoker or current smoker. Smoking
increases the risk for all cause mortality, diabetes, cardiovascular diseases, COPD and cancers. In addition, time-dependency of relapse risk and relative risk decrease after smoking cessation have been
Cholesterol classes are defined based on the blood level of total cholesterol (TC): < 5 mmol/l, 5.0 to
6.5 mmol/l, 6.5 to 8.0 and ≥ 8.0 mmol/l. Patients with a higher level of total cholesterol have an increased risk for coronary heart disease (CHD). Furthermore, each TC level based category is further subdivided according to whether or not patients are being treated with cholesterol-lowering medication (mostly statins). Patients with cholesterol-lowering treatment have lower risks for CHD and stroke, compared to untreated patients with the same TC level 11.
Blood pressure classes are defined based on the level of systolic blood pressure (SBP): <120 mmHg,
120 to 140 mmHg, 140 to 160 mmHg and ≥ 160 mmHg. Patients with a higher blood pressure level have an increased risk for cardiovascular diseases. Again, each category is further divided according to whether or not patients are being treated with antihypertensive treatment. Patients with treatment have lower risks for cardiovascular diseases compared to untreated patients 70.
2.4
General approach
In this report we explore the potential effects of measures aimed to prevent the development of diabetes (universal and selective prevention) or aimed to prevent macrovascular complications in persons with diabetes (care-related prevention). Chapters one to six deal with specific risk factors for diabetes or diabetes complications. We use a similar approach in these chapters, to describe and explore the risk factors and preventive measures of interest. A description of this general approach is given below.
Firstly, each chapter starts with an introduction in which we describe: 1) the strength of the association between the risk factor and the associated disease (diabetes and/or cardiovascular disease); 2) the current prevalence of the risk factor in the Dutch population. Furthermore, we provide a brief overview, based on the international literature, of the current status of interventions targeted at the risk factor considered, with respect to its contents, target population, effectiveness and costs.
After this introduction we explore the theoretically maximum gain in health that could be achieved if the risk factor would be totally eliminated. This means that results for a reference scenario (‘natural developments in the population’) are compared to the results for a scenario where everybody is and stays in the lowest risk factor class for the risk factor considered. This hypothetical ideal will be referred to as the ‘maximum scenario’. The health gains in these scenarios are determined by the size of the target population, the disease incidence rates in the population as a whole and the strength of the association between the risk factor and the disease (relative risk). For example, the maximum number of incident diabetes cases that would be prevented if everyody had a normal weight depends on by the number of people who are overweight, diabetes incidence rates in the general population and the strength of the association between body weight and diabetes development (i.e. the additional risk due to overweight). The purpose of these theoretical scenarios is to define the ‘maximum space for
improvement’. Although knowing the ‘maximum space for improvement’ provides meaningful insight, it is not realistic to assume that the maximum health gains, as derived from these theoretical scenarios, can be achieved. Several factors may limit the effect that can be reasonably attained in practice, such as the efficacy of an intervention as reported in intervention trials (how much weight loss is achieved on average through a lifestyle intervention) or the participation rate (how many people can be reached and how many can be expected to participate).
Thus, following the theoretical scenario, we define at least one realistic scenario. In these scenarios issues such as efficacy and participation rate are addressed as adequately as possible. Again, results are
compared to the reference scenario. In addition, the costs associated with the intervention are estimated. Evidence for the efficacy, participation rate and costs of interventions are derived from the international literature, but sometimes we rely on ad-hoc assumptions. We explore the impact of the particular assumptions by studying the results, when using alternative assumptions (sensitivity analyses). After describing the maximum and realistic scenarios, we present the outcomes for health and health care costs as calculated with the CDM. We present the difference in cumulative number of incident cases of diabetes, stroke and coronary heart disease (CHD) between the reference scenario and the scenario of interest, as well as the effects on total numbers of life years lived by the (diabetes) cohort. For costs, we report differences in health care costs for diabetes and cardiovascular diseases between the reference scenario and the scenario of interest as well as differences in total health care costs. Total health care costs include costs for diabetes and cardiovascular disease but also costs for other diseases such as cancer and dementia. Cost-effectiveness ratios are provided for the realistic scenarios. Each chapter ends with a brief summary of the results.
2.5
Scenarios
An overview of all the scenarios presented in this report is given in Table 2. In the subsequent chapters the scenarios will be described in more detail. The realistic scenarios are based on actual interventions that have been reported in the (international) literature and for which there is sufficient evidence of effectiveness and costs. All scenarios describe results for closed cohorts. The model starts with the general cohort or diabetes cohort as described in Table 1, and follows this cohort until extinction.
Table 2 Overview of scenarios
Scenario Assumptions
Part 1: Universal and selective prevention of diabetes
1: Weight reduction and increased physical activity
‘Normal weight’ scenario All Dutch adults (20-80 years) normal weight (BMI < 25 kg/m2)
‘Normal weight and active’ scenario All Dutch adults (20-80 years) normal weight (BMI < 25 kg/m2) and physically active
‘Community-based intervention’ scenario 80% of Dutch adults (20-80 years) are reached by a 5-year lifestyle program. Average weight loss is 0.5 kg. Ten percent of inactive persons become moderately active.
‘Lifestyle program obese adults’ scenario 10% of Dutch obese adults (= 1.4% of Dutch adults 20-80 years) participate in a 3-year lifestyle intervention. Average weight loss is 3 kg. Fifty percent of inactive persons become moderately active and ten percent of moderately active persons become active.
2: Smoking cessation
‘No smokers’ scenario All Dutch adults (20-80 years) are non-smokers ‘Smoking cessation intervention’ scenario Combined public health and individual-based
interventions
Part 2: Care-related prevention in persons with diabetes
1: Intensified blood glucose treatment
‘Low blood glucose’ scenario All diabetes patients (30-75 years) have a HbA1c < 7.0%
‘Intensified blood glucose treatment’ scenario Diabetes patients (30-75 years with HbA1c > 7.0) using two oral agents switch to insulin treatment
2: Cholesterol lowering treatment
‘Low cholesterol’ scenario All diabetes patients (30-75 years) have a total cholesterol < 5.0 mmol/l and are treated with statins ‘Cholesterol treatment’ scenario Statin treatment for 50% of untreated diabetes
patients (30-75 years) with total cholesterol > 5.0 mmol/l
3: Antihypertensive treatment
‘Low blood pressure’ scenario All diabetes patients (30-75 years) have a systolic blood pressure (SBP) < 120 mmHg and receive antihypertensive treatment
‘Blood pressure treatment’ scenario Antihypertensive treatment for 50% of currently untreated diabetes patients (30-75 years) with SBP ≥ 140 mmHg.
4: Intensified multifactorial treatment
‘Low CVD-risk’ scenario All diabetes patients (30-75 years) are in the lowest risk factor classes for HbA1c, cholesterol and blood pressure
‘Multifactorial treatment’ scenario Blood glucose-, cholesterol- and blood pressure treatment scenarios combined
PART 1: UNIVERSAL AND SELECTIVE
PREVENTION OF DIABETES
3
Weight loss and increased physical activity
The most important modifiable risk factor for diabetes is a high body weight 1837. Epidemiological studies have shown that with every one-unit increase in BMI, corresponding to a weight gain of approximately 3 kg, the risk of developing type 2 diabetes increases by approximately 10% to 30% 25. The risk of developing diabetes for a severely overweight adult (< 50 years) is more than 10 times higher than for a person with a normal weight. Physical inactivity is also an important risk factor for diabetes 3029387981. Inactive persons have an approximately twofold risk for diabetes compared to active persons. A part of the protective effect of physical activity on diabetes incidence is explained by a lower BMI and a more favourable body composition. The remaining part, however, is independent of body weight and is associated with better glucose metabolism. (This ‘remaining effect’ of physical activity, independent from BMI, is used in the CDM).
In the Dutch population cohort in the model 51% has a normal weight, 36% is moderately overweight and 13% is obese at the start of the simulations (2005). With respect to physical activity, 55% is active, 35% is moderately active and 10% is inactive.
Effects of interventions aimed at weight loss and increased physical activity have been evaluated in different target populations. A large amount of data is available about the effects of interventions within the general population (community-based lifestyle programs) and within high risk groups 347748 6. Generally, treatment and follow-up duration are five years or less, although results after seven years were recently reported for the Finnish Diabetes Prevention Study 40.
Typically, community-based programs comprise mass media campaigns, and a range of activities to promote a healthy diet and physical activity in the general population. These programs have been conducted with varying results 775. In general, effects on weight are modest, the largest effect was found in the Stanford Five City Project 69. This study found that after 5 years, weight increase was 0.7 kg less in intervention communities compared to control regions (with an average weight of 1.3 kg in control regions). Most community-based programs fail to achieve substantial effects on physical activity, but some do achieve small reductions in the prevalence of physical inactivity 547.
Interventions to reduce weight and promote physical activity in persons at high-risk for developing diabetes (persons with obesity and abnormal glucose metabolism) are typically implemented in a health care setting and comprise dietary advice, exercise programs and/or behavior modification therapy for individuals or groups. These interventions can reduce diabetes risk with 50-60% 1341. Weight loss appears to be the primary factor resulting in reduced diabetes incidence. Subsequent analyses from the US Diabetes Prevention Program showed that, for every kilogram of weight loss the risk for developing diabetes was reduced by approximately 16%, while increased physical activity helped to sustain weight loss and reduced diabetes risk in those persons who did not lose weight 2412. With these interventions, average weight losses of approximately 4 to 6 kg can be achieved within one year 6. However, the effects are generally smaller at longer term follow-up 48138366411453. After three years effects on weight range from 1.9 kg 61 to 4.5 kg 1314. Intervention programs favorably affect physical activity as
3.1
Description of the lifestyle scenarios
‘Normal weight’ scenario
In this scenario we compare the outcomes for a Dutch cohort (20-80 years) in which everybody has a normal weight with the outcomes for a Dutch cohort (20-80 years) in the reference scenario.
‘Normal weight and active’ scenario
In this scenario we compare the outcomes for a Dutch cohort (20-80 years) in which everybody has a normal weight and, in addition, is physically active, with the outcomes for a Dutch cohort (20-80 years) in the reference scenario.
‘Community-based intervention’ scenario
In this scenario we calculate outcomes for a community-based lifestyle program with duration of five years, focusing on nutrition and exercise and targeted at the general population. The effects we assume are based on average results obtained in (international) trials 776954.
We assume that the intervention reaches 80% of the Dutch adult population and that the intervention results in an average weight loss of 0.5 kg. Furthermore, we assume that 10% of the inactive persons become moderately active. Effects are achieved within the first year and maintained during and after the intervention period.
Intervention costs
Costs are based on a Dutch community based program ‘Hartslag Limburg’ (Heart Health Limburg) 62. This program aimed to decrease the incidence of cardiovascular diseases in the general population. Total intervention costs for activities focusing on nutrition and physical activity for five years were approximately €6 per 20+ adult in the target area 6033. For 80% of Dutch adults (9.4 million), total costs for the 5-year intervention in our scenario were 56 million euro.
‘Intervention program obese adults’ scenario
In this scenario we project the outcomes for an intensive intervention focusing on diet and exercise, implemented in a health care setting, with duration of three years. The effects we assume are based on average results obtained in international trials 13. We assume that 10% of the Dutch obese adults (20-80 year) participate in the intervention resulting in an average weight loss of 3 kg. Furthermore we assume that fifty percent of inactive persons become moderately active and 10% of moderately active persons become active. Effects are achieved within the first year and maintained during and after the intervention period.
Intervention costs
Costs are based on the Dutch ‘Study on Lifestyle intervention and Impaired glucose tolerance
Maastricht (SLIM)’. This lifestyle intervention aimed to improve lifestyle in overweight subjects with impaired glucose tolerance by means of 3-year dietary advice and an exercise program 5150.
participants participate in the exercise program 33. Total costs for the 3-year intervention for 160,000 participants are 112 million euro.
3.2
Long-term effects on health outcomes
Reference scenario
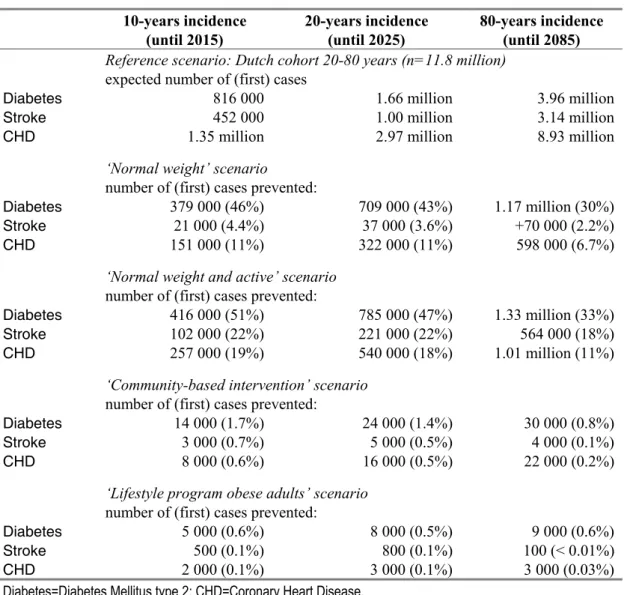
The total number of new cases of diabetes that is expected in a Dutch cohort (20-80 years) over a period from 10 and 20 years starting in 2005 is 816,000 and 1.66 million, respectively. These and other health outcomes for each scenario are given in Table 3. Total life-years expected for the cohort (that is followed until extinction) is 416 million, meaning an average life-expectancy of a cohort member is 35.3 years (416 million/11.8 million). Average life-expectancy for a 40-year old person is 40.45 years.
Table 3 Effects of lifestyle interventions on the cumulative incidence of cardiovascular disease and diabetes
10-years incidence (until 2015) 20-years incidence (until 2025) 80-years incidence (until 2085)
Reference scenario: Dutch cohort 20-80 years (n=11.8 million)
expected number of (first) cases
Diabetes 816 000 1.66 million 3.96 million
Stroke 452 000 1.00 million 3.14 million
CHD 1.35 million 2.97 million 8.93 million
‘Normal weight’ scenario
number of (first) cases prevented:
Diabetes 379 000 (46%) 709 000 (43%) 1.17 million (30%)
Stroke 21 000 (4.4%) 37 000 (3.6%) +70 000 (2.2%)
CHD 151 000 (11%) 322 000 (11%) 598 000 (6.7%)
‘Normal weight and active’ scenario
number of (first) cases prevented:
Diabetes 416 000 (51%) 785 000 (47%) 1.33 million (33%)
Stroke 102 000 (22%) 221 000 (22%) 564 000 (18%)
CHD 257 000 (19%) 540 000 (18%) 1.01 million (11%)
‘Community-based intervention’ scenario
number of (first) cases prevented:
Diabetes 14 000 (1.7%) 24 000 (1.4%) 30 000 (0.8%)
Stroke 3 000 (0.7%) 5 000 (0.5%) 4 000 (0.1%)
CHD 8 000 (0.6%) 16 000 (0.5%) 22 000 (0.2%)
‘Lifestyle program obese adults’ scenario
‘Normal weight and active’ scenario
Almost half of the 20-year cumulative incidence of diabetes and 20% of the incidence of cardiovascular disease is prevented if everybody would have a normal weight and is physically active (Table 3), while the expected life years for the Dutch cohort would increase by 6.5%. Almost the entire reduction in diabetes incidence and a large part of the reduction in CHD incidence can be attributed to the
elimination of body weight as a risk factor, while the major part of the reduction in stroke incidence can be attributed to the elimination of physical inactivity. Average life expectancy for a 40-year old person increases by 2.3 years from 40.45 to 42.75 years.
‘Community-based intervention’ scenario
A lifestyle intervention results in a reduction in the 20-year cumulative incidence of diabetes of 1.4% (24,000 cases), while 0.5% of the new cases of stroke and CHD are prevented (Table 3).
The intervention has no significant effect on average life expectancy.
‘Lifestyle program obese adults’ scenario
A lifestyle intervention for obese adults results in a reduction in the 20-year cumulative incidence of diabetes of 0.5% (8,000 cases), while 0.1% of the new cases of cardiovascular disease are prevented (Table 3). The intervention has no significant effect on average life expectancy of a 40-year old person in the total population, but life expectancy increases by 1.1 years for 40-year intervention participants.
3.3
Long-term effects for health care costs
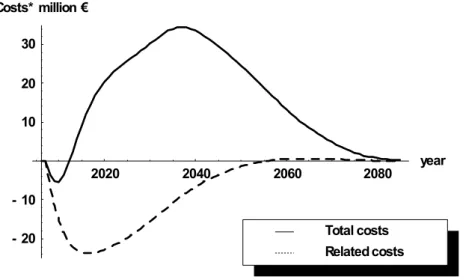
In the reference scenario, the expected life-time costs for diabetes and cardiovascular disease (related costs) in the Dutch population (20-80 years) are €205 billion. The expected life-time total health care costs are €1,200 billion (discounted with 4% annually). This means that life-time health care costs per persons are €101,400 of which €17,400 can be attributed to diabetes and cardiovascular disease. The effects on health care costs over time for the scenarios are illustrated in Figures 2a and 2b. The area under the curve represents the (cumulative) life-time costs for the cost categories of interest.
2020 2040 2060 2080 year - 20 - 10 10 20 30 Costs* million € Related costs Total costs
Figure 2a Difference in expected health care costs for ‘diabetes and CVD’ (=related costs) and life-time total health care costs between the reference scenario and the ‘community-based intervention’ scenario over time (discounted with 4% annually)
2020 2040 2060 2080 year - 20 - 10 10 20 30 Costs* million € Related costs Total costs
Figure 2b Difference in expected health care costs for ‘diabetes and CVD’ (=related costs) and life-time total health care costs between the reference scenario and the ‘intervention program obese adults’ scenario over time (discounted with 4% annually)
(compared to the reference scenario) and many of these persons will eventually develop diabetes or CVD, which is highly prevalent at advanced age. For total health care costs there is a small initial decrease compared to the reference scenario because prevented costs for diabetes and CVD are higher than additional costs for other diseases. However, within 10 years total health care costs are higher for the intervention scenario because more people survive and these people get other diseases.
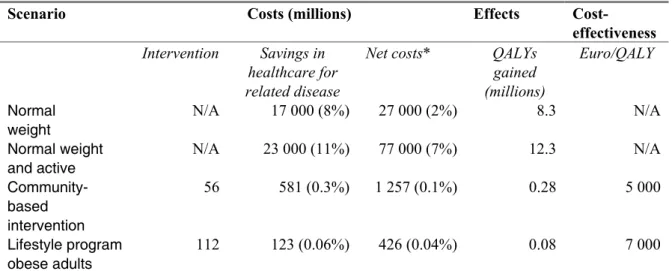
The results for intervention costs, life-time health care costs and cost-effectiveness are given in Table 4. If everybody would have a normal weight and was physically active, life-time costs for diabetes and CVD would be €23 billion lower than the expected costs in the reference scenario, meaning that the expected costs would be reduced by 11%, corresponding to approximately €2,000 per Dutch adult. A lifestyle intervention for the general population reduces the expected costs by €581 million (€52 per Dutch adult, or on average €62 per ‘participant’) and an intervention for obese adults reduces these costs by €123 million (€10 per Dutch adult, or on average €800 per participant). However, total health care costs increase.
Table 4 Expected life-time costs and efficy of lifestyle interventions
Scenario Costs (millions) Effects
Cost-effectiveness
Intervention Savings in healthcare for related disease
Net costs* QALYs gained (millions) Euro/QALY Normal weight N/A 17 000 (8%) 27 000 (2%) 8.3 N/A Normal weight and active N/A 23 000 (11%) 77 000 (7%) 12.3 N/A Community-based intervention 56 581 (0.3%) 1 257 (0.1%) 0.28 5 000 Lifestyle program obese adults 112 123 (0.06%) 426 (0.04%) 0.08 7 000
* Net costs are derived by subtracting cost savings in healthcare for related diseases from the additional costs due to healthcare for unrelated diseases (in particular in life years gained).
Costs have been discounted at a rate of 4% and effects at 1.5%. No intervention costs can be assigned to the ‘maximum’ scenarios and therefore also no cost-effectiveness ratios.
Adults in the Dutch population would gain 12.3 million quality adjusted life-years (on average 1.05 per person) if everybody would have a normal weight and was physically active. A lifestyle intervention for the general population would result in a gain of 280,000 QALYs and the intervention for obese adults would add 80,000 QALYs (on average 0.5 per intervention participant). Both ‘realistic’ intervention scenarios can be considered ‘highly cost-effective’ with ratios of 5,000 and 7,000 euro/QALY, respectively.
3.4
Sensitivity analyses
We performed several sensitivity analyses in which effects, costs, time horizon and discount rates were varied.
‘Community-based intervention’ scenario
1. Effect on BMI and physical activity: 50% (i.e. half of the effect assumed in the reference scenario). 2. Intervention costs double (€12 per adult as compared to €6).
3. Relapse in the effect on BMI and physical activity after the intervention (i.e. a gradual 50% decline in the initial effect in the first 5 years after the end of the intervention, Appendix 1).
4. Discount rates 0% or 4% for both effects and costs. 5. Time horizon 5, 10 or 20 years.
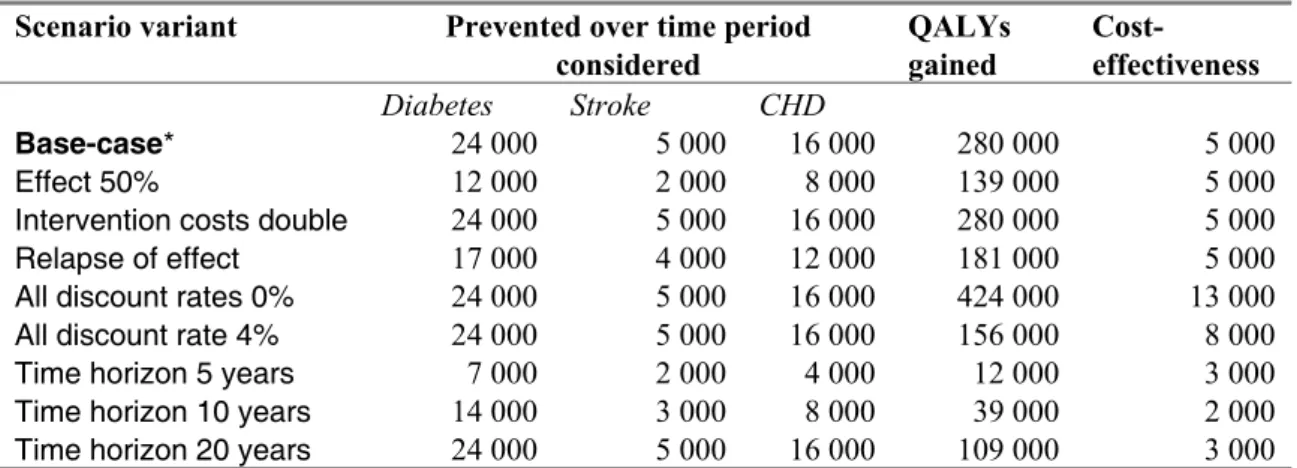
The results for the sensitivity analyses are summarized in Table 5.
Table 5 Sensitivity analysis for the ‘community-based intervention’ scenario
Scenario variant Prevented over time period
considered QALYs gained Cost-effectiveness Diabetes Stroke CHD Base-case* 24 000 5 000 16 000 280 000 5 000 Effect 50% 12 000 2 000 8 000 139 000 5 000
Intervention costs double 24 000 5 000 16 000 280 000 5 000
Relapse of effect 17 000 4 000 12 000 181 000 5 000
All discount rates 0% 24 000 5 000 16 000 424 000 13 000
All discount rate 4% 24 000 5 000 16 000 156 000 8 000
Time horizon 5 years 7 000 2 000 4 000 12 000 3 000
Time horizon 10 years 14 000 3 000 8 000 39 000 2 000
Time horizon 20 years 24 000 5 000 16 000 109 000 3 000
* Base case: time horizon 20 years for cases prevented, and 80 years for QALYs and cost-effectiveness; intervention costs €6 pp; no relapse of effect; discount rates 1.5% for QALYs and 4% for costs.
Except for the last three rows, the time horizon is that of the base case.
‘Lifestyle program obese adults’ scenario
1. Effect on BMI and physical activity 50%.
2. Intervention costs €2000 per participant as compared to €700 (i.e. the approximate costs for an intensive lifestyle program in the US, the Diabetes Prevention Program).
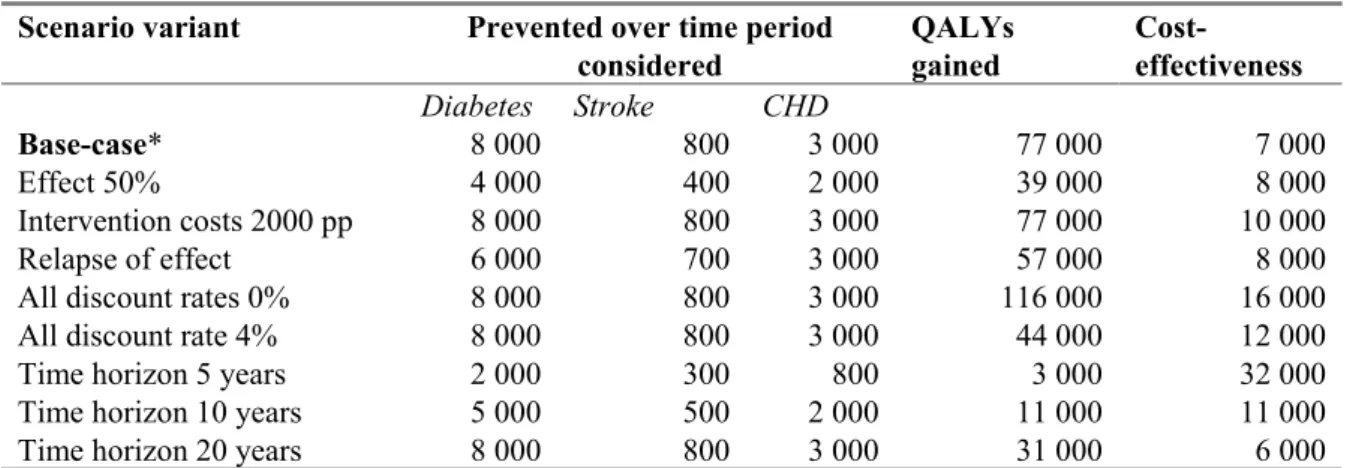
The results for the sensitivity analyses are summarized in Table 6.
Table 6 Sensitivity analysis for the ‘lifestyle program obese adults’ scenario
Scenario variant Prevented over time period
considered QALYs gained Cost-effectiveness Diabetes Stroke CHD Base-case* 8 000 800 3 000 77 000 7 000 Effect 50% 4 000 400 2 000 39 000 8 000 Intervention costs 2000 pp 8 000 800 3 000 77 000 10 000 Relapse of effect 6 000 700 3 000 57 000 8 000
All discount rates 0% 8 000 800 3 000 116 000 16 000
All discount rate 4% 8 000 800 3 000 44 000 12 000
Time horizon 5 years 2 000 300 800 3 000 32 000
Time horizon 10 years 5 000 500 2 000 11 000 11 000
Time horizon 20 years 8 000 800 3 000 31 000 6 000
* Base case: time horizon 20 years for cases prevented, and 80 years for QALYs and cost-effectiveness; intervention costs €700 pp; no relapse of effect; discount rates 1.5% for QALYs and 4% for cost.
Except for the last three rows, the time horizon is that of the base case.
3.5
Summary
Body weight is the most important modifiable risk factor for diabetes. If all Dutch adults would have a normal weight and were physically active, the impact would be enormous with a decrease in the expected long-term incidence of diabetes of approximately 50%. However, this would imply an average weight loss of approximately 25 kg in obese adults and 10 kg in persons who are moderately overweight, as opposed to average weight losses of 0.5 kg and 3.0 kg as estimated for our realistic scenarios simulating a community-based intervention and lifestyle program for obese adults, respectively. We know that weight loss is not easily achieved nor maintained 2. Based on results obtained in intervention trials, we estimated that large scale implementation of lifestyle interventions, could prevent 1.4% (community-based intervention) or 0.5% (lifestyle program for obese adults) of the 20-year cumulative diabetes incidence in the Dutch population. With these realistic interventions, the life-time costs related to diabetes and cardiovascular disease decrease, while the total health care costs increase due to longer life expectancies. The community-based intervention is cost-effective under a wide range of assumptions. An intervention for obese adults is also cost-effective, except when a time-span shorter than 10 years is considered because the short-term health effects are insufficient to counterbalance the intervention costs.
4
Smoking cessation
Smoking has been reported to increase diabetes risk, with an approximately 15% higher risk among current smokers as compared to non smokers 19. Furthermore, the finding that heavy smoking is associated with higher risks than light smoking indicates that there is a dose-effect relationship 55823159 58458056917. The risk among ex-smokers remains increased (9%), but this elevated risk disappears gradually over time. Although the association between smoking and diabetes is not strong, smoking is a major risk factor for cardiovascular disease. As the risk of cardiovascular disease is already increased considerably among individuals with diabetes, it is crucial to eliminate as much as possible any other factor that adds to the total cardiovascular risk score. Moreover, the deleterious effects of smoking might even be stronger in an already compromised cardiovascular system.
Thus, it seems that reducing smoking in the general population can have two types of benefit with regard to diabetes. Firstly, it might reduce the incidence of diabetes. Second, by reducing the proportion of smokers amongst those who do develop diabetes it might have a favourable impact on the
occurrence of cardiovascular complications. However, attempts to bring down the prevalence of smoking have, so far, been met with limited success. Hence, when estimating the relative strengths of various preventive strategies, it is especially important to take a realistic perspective on the possibilities of anti-smoking interventions.
We shall focus on attempts to stimulate smoking cessation. In this respect, a distinction can be made between interventions involving the whole population, such as mass media campaigns, and those that are aimed at the individual. We shall consider an approach in which interventions at both levels are applied simultaneously. The scenarios described in the following section, therefore, are all ‘combined scenarios’.
4.1
Description of scenarios
Maximum scenario
In the maximum scenario we compare the outcomes for a Dutch cohort (aged 20-80 years) in the reference scenario with those of an otherwise similar cohort consisting of individuals who have never smoked and never start smoking.
Realistic scenario
We assumed that a public health policy targeting smoking would not be restricted to one type of intervention and would entail an integral approach. It makes sense to combine various types of
measures that have impact on different spheres of societal interactions. We considered a combination of the following interventions, which have been described more extensively elsewhere 75.
− Minimal counseling (MC): a brief individual smoking cessation advice given by a GP or assistant during a single visit of 1-12 minutes duration, offered to 25% of smokers.
− GP support (GPS): individual smoking cessation advice given by a GP or assistant during one or two visits, according to a 5-step protocol. GP support (GPS), offered to 5% of all smokers. − Intensive counseling (40-110 minutes) by a trained counselor combined with nicotine replacement
therapy for a period of 12 weeks on average (IC+NRT), offered to 7% of all smokers.
In contrast to the maximum scenario, the modeled population in the realistic scenario is a dynamic one in which individuals may start, stop and re-start smoking. A feature implemented in the CDM is that it accounts for relapse and that the risk of relapse depends on time since smoking cessation. Moreover, also the relative risks for smoking-related diseases depend on time since cessation.
In order to estimate effects on CVD prevention, implementation of these interventions was compared with usual practice. The input prevalence in the CDM for current and former smoking were derived from 5-year age class and sex specific data from yearly population monitoring studies (STIVORO) conducted between 1997 and 2000. Start, cessation and restart rates were also derived from this source. As efficacy measure of the interventions, 12-month prolonged abstinence was taken as the end-point, assuming that this is almost equal to cessation.
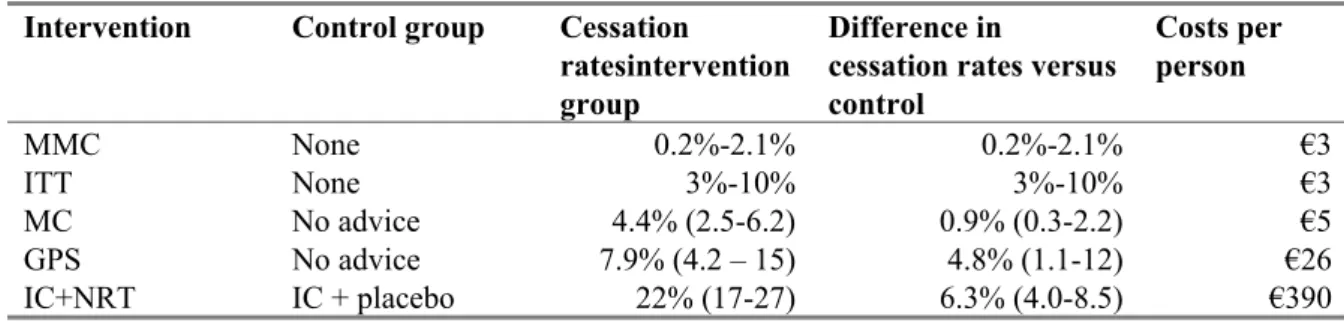
Efficacy estimates and intervention costs are summarized in Table 7 below. Costs of the combined intervention were €6 per person. We assumed that there is no interaction between efficacy and costs of interventions when they are combined.
Table 7 Efficacy and costs of the smoking cessation interventions
Intervention Control group Cessation
ratesintervention group
Difference in
cessation rates versus control Costs per person MMC None 0.2%-2.1% 0.2%-2.1% €3 ITT None 3%-10% 3%-10% €3 MC No advice 4.4% (2.5-6.2) 0.9% (0.3-2.2) €5 GPS No advice 7.9% (4.2 – 15) 4.8% (1.1-12) €26 IC+NRT IC + placebo 22% (17-27) 6.3% (4.0-8.5) €390
MMC; Mass Media Campaign; ITT: Increased Tobacco Taxes; MC: Minimal Counceling; GPS: General Practitioner Support; IC: Intensive Counseling; NRT: Nicotine Replacement Therapy.
4.2
Long-term effects of smoking cessation on health outcomes
Maximum scenario
Almost one out of every 5 cases of CHD in a 20-year period would be prevented if nobody smoked, and 3% of new diabetes cases (Table 8). Average life expectancy for a 40-year old person increases with 2.12 years.
Realistic scenario
The results for the realistic scenario consisting of the combination of public health and individual-based interventions described above are presented in Table 8 below. Average life expectancy for a 40-year old person increases only marginally.
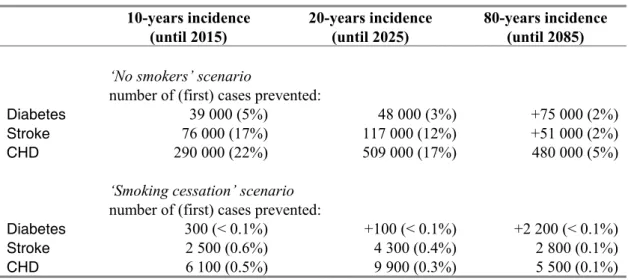
Table 8 Effects of smoking cessation interventions on cardiovascular disease and diabetes incidence 10-years incidence (until 2015) 20-years incidence (until 2025) 80-years incidence (until 2085)
‘No smokers’ scenario
number of (first) cases prevented:
Diabetes 39 000 (5%) 48 000 (3%) +75 000 (2%)
Stroke 76 000 (17%) 117 000 (12%) +51 000 (2%)
CHD 290 000 (22%) 509 000 (17%) 480 000 (5%)
‘Smoking cessation’ scenario
number of (first) cases prevented:
Diabetes 300 (< 0.1%) +100 (< 0.1%) +2 200 (< 0.1%)
Stroke 2 500 (0.6%) 4 300 (0.4%) 2 800 (0.1%)
CHD 6 100 (0.5%) 9 900 (0.3%) 5 500 (0.1%)
Diabetes=Diabetes Mellitus type 2; CHD=Coronary Heart Disease.
All figures represent differences compared to the reference scenario. Figures for the reference scenario are given in Table 3. A positive sign means more cases than in the reference scenario.
4.3
Smoking cessation and health care costs
The differences in health care costs over time between the “Smoking cessation” scenario and the reference scenario are illustrated in Figure 3. The area under the curve represents the (cumulative) life-time costs for the cost categories of interest.
Table 9 below summarizes the results regarding costs, QALYs gained and cost-effectiveness.
Table 9 Expected life-time costs and efficacy of smoking interventions
Scenario Costs (millions) Effects
Cost-effectiveness
Inter-vention
Savings related disease
Net costs* QALYs gained Euro/QALY
No smokers N/A 4 000 (4%) 51 000 (7%) 9.9 million N/A
Smoking cessation 334 180 (< 0.02%) 611 (0.06%) 0.13 7 000
* Net costs are the difference between costs savings in healthcare for related diseases and additional costs due to healthcare for unrelated diseases (in particular in life years gained).
Costs have bee discounted at a rate of 4% and effects at 1.5%. No intervention costs can be assigned to the ‘maximum’ scenarios and therefore also no cost-effectiveness ratios.
4.4
Sensitivity analyses
For the smoking cessation intervention in the general population we performed the following sensitivity analyses.
1. All effects reduced. 2. All effects increased.
3. Discount rates 0% or 4% for both effects and costs. 4. Time horizon 5, 10 or 20 years.
The results of using these alternative assumptions are displayed in Table 10.
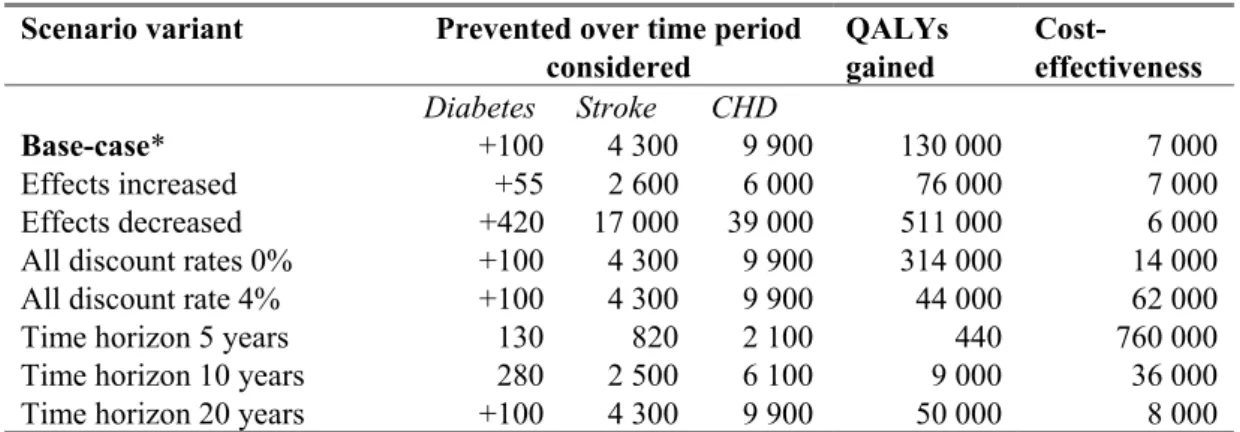
Table 10 Sensitivity analysis for the ‘smoking cessation’ scenario
Scenario variant Prevented over time period
considered QALYs gained Cost-effectiveness Diabetes Stroke CHD Base-case* +100 4 300 9 900 130 000 7 000 Effects increased +55 2 600 6 000 76 000 7 000 Effects decreased +420 17 000 39 000 511 000 6 000
All discount rates 0% +100 4 300 9 900 314 000 14 000
All discount rate 4% +100 4 300 9 900 44 000 62 000
Time horizon 5 years 130 820 2 100 440 760 000
Time horizon 10 years 280 2 500 6 100 9 000 36 000
Time horizon 20 years +100 4 300 9 900 50 000 8 000
* Base case: time horizon 20 years for cases prevented, and 80 years for QALYs and cost-effectiveness; discount rates 1.5% for QALYs and 4% for costs, time horizon 80 years.
Except for the last three rows, the time horizon is that of the base case. A positive sign means more cases than in the reference scenario.
4.5
Summary
Eliminating smoking would prevent roughly 15 to 20% of cardiovascular events over a period of 20 years with only a small effect on the incidence of diabetes. However, in reality it is very difficult to reduce the proportion of smokers in the general population. In the realistic scenario, we assumed that a combination of measures would be implemented targeting smoking, both at the level of the general population and at the level of the individual who has decided to attempt smoking cessation. The overall effect of such efforts is rather limited and the numbers of cardiovascular events prevented do not exceed 1 in 1,000 and 1 in 10,000 for diabetes incidence. However, the costs of these and similar interventions are relatively low. Therefore, investing in smoking prevention may be considered a sensible choice.
PART 2: CARE-RELATED PREVENTION OF
COMPLICATIONS
5
Blood glucose: intensive control
As the name indicates, the aim in treating diabetes with anti-glycaemic drugs is to lower the blood glucose level. Although completely normalizing the amount of sugar in the blood is -at least currently- unattainable, it seems rational to bring the glucose level as closely as possible within the normal range. The percentage glycosylated hemoglobin in whole blood (HbA1c in the following) has become a widely used and well-accepted measure of diabetes ‘control’. HbA1c more or less reflects the average level of blood glucose during the three months preceding the test. High values indicate that the effects of treatment in maintaining blood glucose within desirable bounds are insufficient. Moreover, the HbA1c level has prognostic significance. Thus, much evidence exists that the level of hyperglycemia (and thus also of HbA1c) in diabetic patients is associated directly with a greater risk of occurrence of microvascular complications, such as retinopathy, nerve disease and kidney disease. However, the evidence is more tenuous that HbA1c level is an independent risk factor for macrovascular complications. Although there is a two-fold to four-fold increased risk of cardiovascular death in diabetic patients, this increased risk is often ascribed to the greater prevalence among diabetics of other cardiovascular risk factors, such as obesity, hypertension and dysplipidedemia, rather than to the hyperglycemia itself. One meta-analysis of a small number of prospective cohort studies reported a relative risk for coronary heart disease or stroke of 1.18 (95% CI: 1.10-1.26) for a 1-percentage point increase in HbA1c 63. Other observational studies have shown that this correlation between CVD and glucose also exists at glucose levels that are below the thresholds used to define diabetes 36.
Assuming that there indeed is an independent relation between increased HbA1c and cardiovascular risk, the next question is whether improving long-term glycemic control reduces the risk for
cardiovascular disease events. Evidence of the UKPDS trial, which was the only one specifically designed to test the hypothesis that more intensive glucose-lowering therapies may reduce the risk for cardiovascular morbidity, has largely been interpreted as negative 71. Currently new studies are underway that have been designed to answer this question, in particular the ACCORD trial 21.
On the other hand, the recognition that strict glycaemic control can reduce miscrovascular complication is in itself sufficient to make effective anti-glycaemic treatment a priority. Most guidelines—including the Dutch standard for diabetes care (Zorgstandaard)—advise to aim at HbA1c levels of under 7% and that levels above ‘should serve as a call to action to initiate or change therapy’ 52. As the clinical course of type 2 diabetes is generally characterized by a gradual decline in β-cell function and hence
worsening of glycaemic control, consecutive treatment adjustments often need to be made. This process can be conceived of as a ‘step-wise’ approach, starting with lifestyle modifications, followed by oral monotherapy (usually metformin), oral combination therapy (the addition of sulfonylureas,
thiazolidinediones, or one of the newest generation drugs), and finally treatment with insulin, either as add-on to oral treatment or as monotherapy. Often, the next step is taken after dose adjustments have failed. It is obvious that to be able to implement such a course of action more intensive monitoring and more frequent visits to physicians or specialized nurses is required. Especially when the switch to insulin is made, the patient’s life becomes strongly medicalized, with the need to daily self-inject
HbA1c is modeled as a categorical variable with three levels (< 7% (Class 1); 7%-8.5% (Class 2); > 8.5% (Class 3)). Moreover, fluctuation over time and age dependency of relative risks associated with HbA1c are neglected.
5.1
Description of scenarios
Reference scenario
The Dutch diabetic population with its current distribution over HbA1c classes and treatment schedules was taken as the reference population. Data for these variables were derived from sources that have been described in more detail previously 4.
Maximum scenario
The outcomes of a hypothetical cohort of Dutch individuals with diabetes (30-75 years) who all have target HbA1c levels of 7.0% or less, were compared to the outcomes in the reference scenario.
Realistic scenario
A realistic scenario was largely based on a recent Dutch study 22. This study concerns a trial conducted in a general practice setting, in which patients with insufficient control of their diabetes despite the use of at least two oral anti-glycemic agents, were randomized to one of two insulin regimens: insulin monotherapy or insulin in combination with oral drugs. Based on the results of this trial, we assumed that switching to insulin monotherapy would result in an average HbA1c reduction of 1 percentage point. Moreover, still based on this study, we assumed that 10% of cases switching to insulin would result in treatment failure, either due to a lack of effect in some patients or to difficulties
self-administering insulin. Thus, the scenario we defined includes an intervention in which all patients using 2 oral agents and who’s HbA1c > 7.0% are started on insulin monotherapy. Further details of the scenario and intervention costs are provided in Appendix 2. Suffice it here to mention, that all ‘candidates for switching to insulin’ were in HbA1c category 7.0 to 8.5%, and that 39.000 patients switched to HbA1c class < 7%, as a result of the intervention. Total intervention costs were 148 million.
5.2
Long-term effects for health outcomes
The diabetes population in 2005 comprised 398,000 people 30-75 years, 212,000 men and
186,000 women. The expected cumulative incidence of stroke and CHD in the reference scenario is summarized in Table 11. Average life expectancy for a 40-year old person with diabetes is 30.9 years.
Maximum scenario
The results for prevented cumulative incidence of stroke and CHD, as well as life years gained are summarized in Table 11. In the maximum scenario, the average life expectancy of a 40-year old individual would increase from 30.7 years to 31.4 years, a gain of somewhat more than half a year.
Realistic scenario
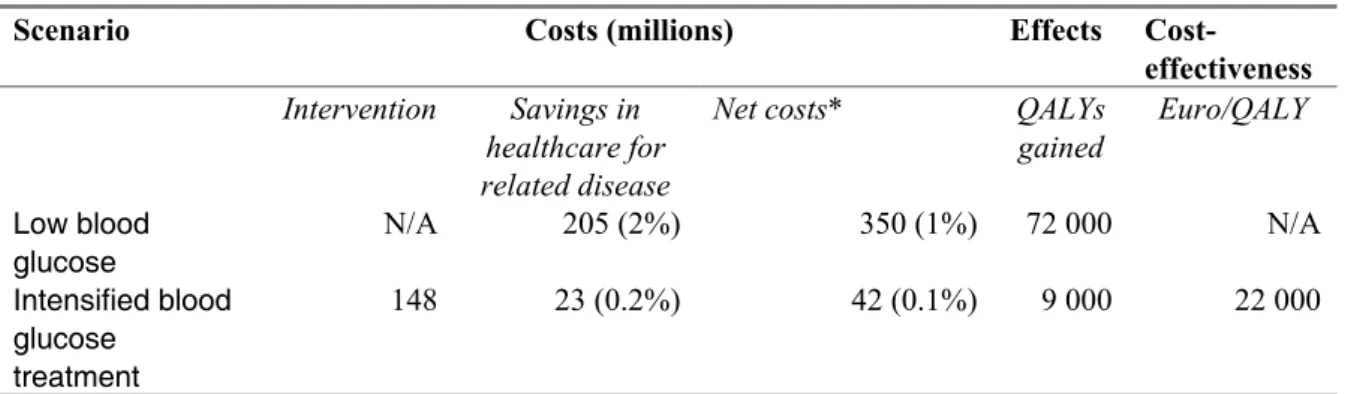
The results for prevented cumulative incidence of stroke and CHD, as well as life years gained are also summarized in Table 11. The average life expectancy of a 40-year old individual would increase from 30.72 years to 30.80 years, a marginal gain. The cost-effectiveness ratio is 22,000 euro/QALY.
Table 11 Effects of intensified blood glucose treatment on cardiovascular complications
10-years incidence (until 2015) 20-years incidence (until 2025) 80-years incidence (until 2085)
Reference scenario: Dutch cohort of diabetes patients 30-75 years (n=398 000)
expected number of (first) cases
Stroke 39 000 63 000 78 000
CHD 138 000 220 000 271 000
‘Low blood glucose’ scenario
number of (first) cases prevented:
Stroke 4 000 (11%) 6 000 (10%) 7 000 (9%)
CHD 12 000 (9%) 16 000 (7%) 18 000 (6%)
‘Intensified blood glucose treatment’ scenario
number of (first) cases prevented:
Stroke 500 (1%) 800 (1%) 900 (1%)
CHD 1 400 (1%) 1 900 (1%) 2 000 (1.6%)
CHD=Coronary Heart Disease.
The figures for the reference scenario represent the expected numbers of new cases. Those for the other scenarios represent the numbers of cases prevented.
5.3
Long-term effect on health care costs
The differences in health care costs over time between the ‘Intensified blood glucose treatment’ scenario and the reference scenario are illustrated in Figure 4. The area under the curve represents the (cumulative) life-time costs for the cost categories of interest.