Environmental risk limits for
carbendazim
Letter report 601716014/2008 Z. Dang | C.E. Smit
RIVM Letter report 601716014/2008
Environmental risk limits for carbendazim
ZhiChao Dang Els Smit
Contact: Zhi Chao Dang
Expertise Centre for Substances zhichao.dang@rivm.nl
This investigation has been performed by order and for the account of Directorate-General for
Environmental Protection, Directorate for Soil, Water and Rural Area (BWL), within the framework of the project "Standard setting for other relevant substances within the WFD".
© RIVM 2008
Parts of this publication may be reproduced, provided acknowledgement is given to the 'National Institute for Public Health and the Environment', along with the title and year of publication.
Rapport in het kort
Environmental risk limits for carbendazim
Dit rapport geeft milieurisicogrenzen voor het fungicide carbendazim in water. Milieurisicogrenzen zijn de technisch-wetenschappelijke advieswaarden voor de uiteindelijke milieukwaliteitsnormen in Nederland. De milieurisicogrenzen zijn afgeleid volgens de methodiek die is voorgeschreven in de Europese Kaderrichtlijn Water. Hierbij is gebruikgemaakt van de beoordeling in het kader van de Europese toelating van gewasbeschermingsmiddelen (Richtlijn 91/414/EEG), aangevuld met gegevens uit de openbare literatuur.
Contents
1 Introduction 7
1.1 Background and scope of the report 7
1.2 Status of the results 7
2 Methods 8
2.1 Data collection 8
2.2 Data evaluation and selection 8
2.3 Derivation of ERLs 9
2.3.1 Drinking water 9
3 Derivation of environmental risk limits for carbendazim 11 3.1 Substance identification, physico-chemical properties, fate and human toxicology 11
3.1.1 Identity 11
3.1.2 Physico-chemical properties 12
3.1.3 Behaviour in the environment 12
3.1.4 Bioconcentration and biomagnification 12
3.1.5 Human toxicological threshold limits and carcinogenicity 12
3.2 Trigger values 12
3.3 Toxicity data and derivation of ERLs for water 13
3.3.1 MPCeco, water and MPCeco, marine 13
3.3.2 MPCsp, water and MPCsp, marine 17
3.3.3 MPChh food, water 17
3.3.4 MPCdw, water 17
3.3.5 Selection of the MPCwater and MPCmarine 17
3.3.6 MACeco 17
3.3.7 SRCeco, water 17
3.4 Toxicity data and derivation of ERLs for sediment 17
4 Conclusions 18
References 19
Appendix 1. Information on bioconcentration 21
Appendix 2. Detailed aquatic toxicity data 22
Appendix 3. Description of mesocosm studies 29
1
Introduction
1.1
Background and scope of the report
In this report, environmental risk limits (ERLs) for surface water are derived for the fungicide carbendazim. The derivation is performed within the framework of the project ‘Standard setting for other relevant substances within the WFD, which is closely related to the project ‘International and national environmental quality standards for substances in the Netherlands’ (INS). Carbendazim is part of a series of 25 pesticides that appeared to have a high environmental impact in the evaluation of the policy document on sustainable crop protection (‘Tussenevaluatie van de nota Duurzame
Gewasbescherming’; MNP, 2006) and/or were selected by the Water Boards (‘Unie van Waterschappen’; project ‘Schone Bronnen’; http://www.schonebronnen.nl/).
The following ERLs are considered:
• Maximum Permissible Concentration (MPC) – the concentration protecting aquatic ecosystems and humans from effects due to long-term exposure
• Maximum Acceptable Concentration (MACeco) – the concentration protecting aquatic ecosystems
from effects due to short-term exposure or concentration peaks.
• Serious Risk Concentration (SRCeco) – the concentration at which possibly serious ecotoxicological
effects are to be expected.
More specific, the following ERLs can be derived depending on the availability of data and characteristics of the compound:
MPCeco, water MPC for freshwater based on ecotoxicological data (direct exposure)
MPCsp, water MPC for freshwater based on secondary poisoning
MPChh food, water MPC for fresh and marine water based on human consumption of fishery products
MPCdw, water MPC for surface waters intended for the abstraction of drinking water
MACeco, water MAC for freshwater based on ecotoxicological data (direct exposure)
SRCeco, water SRC for freshwater based on ecotoxicological data (direct exposure)
MPCeco, marine MPC for marine water based on ecotoxicological data (direct exposure)
MPCsp, marine MPC for marine water based on secondary poisoning
MACeco, marine MAC for marine water based on ecotoxicological data (direct exposure)
1.2
Status of the results
The results presented in this report have been discussed by the members of the scientific advisory group for the INS-project (WK-INS). It should be noted that the Environmental Risk Limits (ERLs) in this report are scientifically derived values, based on (eco)toxicological, fate and physico-chemical data. They serve as advisory values for the Dutch Steering Committee for Substances, which is appointed to set the Environmental Quality Standards (EQSs). ERLs should thus be considered as proposed values that do not have any official status.
2
Methods
The methodology for the derivation of ERLs is described in detail by Van Vlaardingen and Verbruggen (2007), further referred to as the ‘INS-Guidance’. This guidance is in accordance with the guidance of the Fraunhofer Institute (FHI; Lepper, 2005).
The process of ERL-derivation contains the following steps: data collection, data evaluation and selection, and derivation of the ERLs on the basis of the selected data.
2.1
Data collection
In accordance with the WFD, data of existing evaluations were used as a starting point. For pesticides, the evaluation report prepared within the framework of EU Directive 91/414/EC (Draft Assessment Report, DAR) was consulted (EC, 1997; further referred to as DAR). An on-line literature search was performed on TOXLINE (literature from 1985 to 2001) and Current contents (literature from 1997 to 2007). In addition to this, all potentially relevant references in the RIVM e-tox base and EPA’s ECOTOX database were checked.
2.2
Data evaluation and selection
For substance identification, physico-chemical properties and environmental behaviour, information from the List of Endpoints of the DAR was used. When needed, additional information was included according to the methods as described in Section 2.1 of the INS-Guidance. Information on human toxicological threshold limits and classification was also primarily taken from the DAR.
Ecotoxicity studies (including bird and mammal studies) were screened for relevant endpoints (i.e. those endpoints that have consequences at the population level of the test species). All ecotoxicity and bioaccumulation tests were then thoroughly evaluated with respect to the validity (scientific reliability) of the study. A detailed description of the evaluation procedure is given in the INS-Guidance (see Section 2.2.2 and 2.3.2). In short, the following reliability indices were assigned:
- Ri 1: Reliable without restriction
’Studies or data … generated according to generally valid and/or internationally accepted testing guidelines (preferably performed according to GLP) or in which the test parameters documented are based on a specific (national) testing guideline … or in which all parameters described are closely related/comparable to a guideline method.’
- Ri 2: Reliable with restrictions
’Studies or data … (mostly not performed according to GLP), in which the test parameters
documented do not totally comply with the specific testing guideline, but are sufficient to accept the data or in which investigations are described which cannot be subsumed under a testing guideline, but which are nevertheless well documented and scientifically acceptable.’
- Ri 3: Not reliable
’Studies or data … in which there are interferences between the measuring system and the test substance or in which organisms/test systems were used which are not relevant in relation to the exposure (e.g., unphysiologic pathways of application) or which were carried out or generated according to a method which is not acceptable, the documentation of which is not sufficient for an assessment and which is not convincing for an expert judgment.’
- Ri 4: Not assignable
’Studies or data … which do not give sufficient experimental details and which are only listed in short abstracts or secondary literature (books, reviews, etc.).’
All available studies were summarised in data-tables, that are included as Annexes to this report. These tables contain information on species characteristics, test conditions and endpoints. Explanatory notes are included with respect to the assignment of the reliability indices.
With respect to the DAR, it was chosen not to re-evaluate the underlying studies. In principle, the endpoints that were accepted in the DAR were also accepted for ERL-derivation with Ri 2, except in cases where the reported information was too poor to decide on the reliability or when there was reasonable doubt on the validity of the tests. This applies especially to DARs prepared in the early 1990s, which do not always meet the current standards of evaluation and reporting.
In some cases, the characteristics of a compound (i.e. fast hydrolysis, strong sorption, low water solubility) put special demands on the way toxicity tests are performed. This implies that in some cases endpoints were not considered reliable, although the test was performed and documented according to accepted guidelines. If specific choices were made for assigning reliability indices, these are outlined in Section 3.3 of this report.
Endpoints with Ri 1 or 2 are accepted as valid, but this does not automatically mean that the endpoint is selected for the derivation of ERLs. The validity scores are assigned on the basis of scientific
reliability, but valid endpoints may not be relevant for the purpose of ERL-derivation (e.g. due to inappropriate exposure times or test conditions that are not relevant for the Dutch situation). Endpoints from tests with formulated products were not selected if the results (expressed on the basis of the active substance) differed by more than a factor of 3 from the results obtained with the active substance itself. After data collection and validation, toxicity data were combined into an aggregated data table with one effect value per species according to Section 2.2.6 of the INS-Guidance. When for a species several effect data were available, the geometric mean of multiple values for the same endpoint was calculated where possible. Subsequently, when several endpoints were available for one species, the lowest of these endpoints (per species) is reported in the aggregated data table.
2.3
Derivation of ERLs
For a detailed description of the procedure for derivation of the ERLs, reference is made to the INS-Guidance. With respect to the selection of the final MPCwater an additional comment should be made:
2.3.1
Drinking water
The INS-Guidance includes the MPC for surface waters intended for the abstraction of drinking water (MPCdw, water) as one of the MPCs from which the lowest value should be selected as the general
MPCwater (see INS-Guidance, Section 3.1.6 and 3.1.7). According to the proposal for the daughter
directive Priority Substances, however, the derivation of the AA-EQS (= MPC) should be based on direct exposure, secondary poisoning, and human exposure due to the consumption of fish. Drinking water was not included in the proposal and is thus not guiding for the general MPC value. The exact way of implementation of the MPCdw, water in the Netherlands is at present under discussion within the
framework of the “AMvB Kwaliteitseisen en Monitoring Water”. No policy decision has been taken yet, and the MPCdw, water is therefore presented as a separate value in this report. The MPCwater, is thus
derived considering the individual MPCs based on direct exposure (MPCeco, water), secondary poisoning
(MPCsp, water) or human consumption of fishery products (MPChh food, water); derivation of the latter two is
Related to this, is the inclusion of water treatment for the derivation of the MPCdw, water. According to
the INS-Guidance (see Section 3.1.7), a substance specific removal efficiency related to simple water treatment should be derived in case the MPCdw, water is lower than the other MPCs. For pesticides, there
is no agreement as yet on how the removal fraction should be calculated, and water treatment is therefore not taken into account. In case no A1 value is set in Directive 75/440/EEC, the MPCdw, water is
set to the general Drinking Water Standard of 0.1 µg/L for organic pesticides as specified in Directive 98/83/EC.
3
Derivation of environmental risk limits for
carbendazim
3.1
Substance identification, physico-chemical properties, fate and human
toxicology
3.1.1
Identity
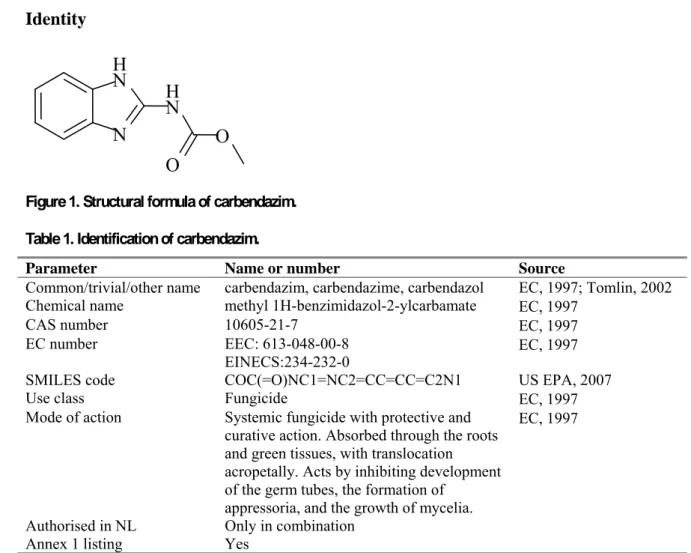
Figure 1. Structural formula of carbendazim. Table 1. Identification of carbendazim.
Parameter Name or number Source
Common/trivial/other name carbendazim, carbendazime, carbendazol EC, 1997; Tomlin, 2002 Chemical name methyl 1H-benzimidazol-2-ylcarbamate EC, 1997
CAS number 10605-21-7 EC, 1997
EC number EEC: 613-048-00-8
EINECS:234-232-0 EC, 1997
SMILES code COC(=O)NC1=NC2=CC=CC=C2N1 US EPA, 2007
Use class Fungicide EC, 1997
Mode of action Systemic fungicide with protective and curative action. Absorbed through the roots and green tissues, with translocation acropetally. Acts by inhibiting development of the germ tubes, the formation of
appressoria, and the growth of mycelia.
EC, 1997
Authorised in NL Only in combination Annex 1 listing Yes
N
N
H
N
H
O
O
3.1.2
Physico-chemical properties
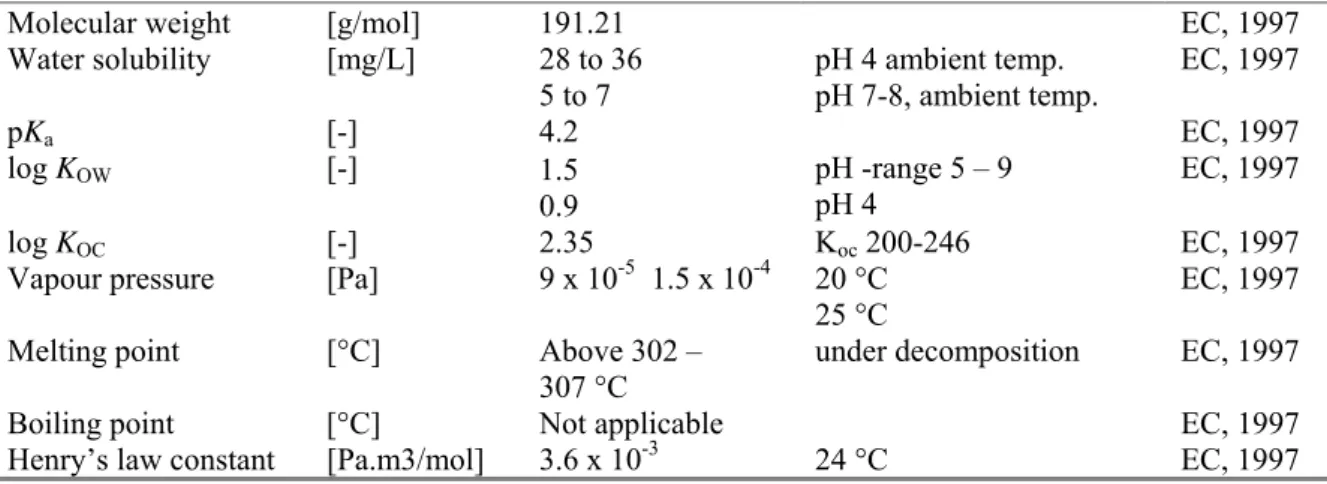
Table 2. Physico-chemical properties of carbendazim.
Parameter Unit Value Remark Reference
Molecular weight [g/mol] 191.21 EC, 1997
Water solubility [mg/L] 28 to 36 5 to 7 pH 4 ambient temp. pH 7-8, ambient temp. EC, 1997 pKa [-] 4.2 EC, 1997 log KOW [-] 1.5 0.9 pH -range 5 – 9 pH 4 EC, 1997 log KOC [-] 2.35 Koc 200-246 EC, 1997
Vapour pressure [Pa] 9 x 10⁻⁵ 1.5 x 10⁻⁴ 20 °C 25 °C
EC, 1997 Melting point [°C] Above 302 –
307 °C
under decomposition EC, 1997
Boiling point [°C] Not applicable EC, 1997
Henry’s law constant [Pa.m3/mol] 3.6 x 10⁻³ 24 °C EC, 1997
3.1.3
Behaviour in the environment
Table 3. Selected environmental properties of carbendazim.
Parameter Unit Value Remark Reference
Hydrolysis half-life DT50 [d] stable at pH 5, 7 pH 9: 22 – 124 d
22 °C 22 °C
EC, 1997
Photolysis half-life DT50 [d] stable EC, 1997
Readily biodegradable no EC, 1997
Water/sediment systems DT50 [d]] 10.8, 5.8 16.1, 73.6
water
whole system
EC, 1997 Relevant metabolites 2-AB: 6.3 % in sediment after 76 d EC, 1997
3.1.4
Bioconcentration and biomagnification
An overview of the bioaccumulation data for carbendazim is given in Table 4. Detailed bioaccumulation data for carbendazim are tabulated in Appendix 1.
Table 4. Overview of bioaccumulation data for CARBENDAZIM.
Parameter Unit Value Remark Reference
BCF (fish) [L/kg] 23 EC, 1997
BMF [kg/kg] 1 Default value for BCF < 2000 L/kg
3.1.5
Human toxicological threshold limits and carcinogenicity
The following R-phrases related to human toxicology are proposed in the DAR: R40 (Muta. Cat. 3), R62, R63 (Repr. Cat. 3). According to ESIS (http://ecb.jrc.it/esis/; date of search 26 March 2008), carbendazim is assigned R46 (Muta. Cat. 2), R60, R61 (Repr. Cat. 2). Carbendazim is not classified as being carcinogenic. The ADI is 0.02 mg/kg bw (based on developmental studies in rats and rabbits).
3.2
Trigger values
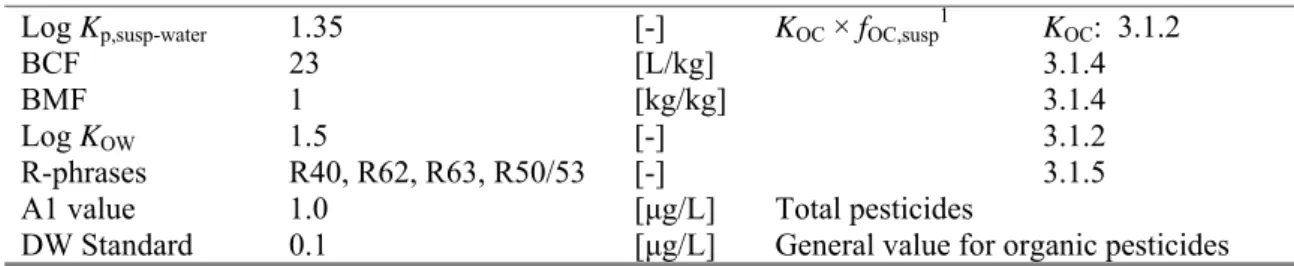
Table 5. Carbendazim: collected properties for comparison to MPC triggers.
Parameter Value Unit Method/Source Derived at section
Log Kp,susp-water 1.35 [-] KOC × fOC,susp1 KOC: 3.1.2
BCF 23 [L/kg] 3.1.4
BMF 1 [kg/kg] 3.1.4
Log KOW 1.5 [-] 3.1.2
R-phrases R40, R62, R63, R50/53 [-] 3.1.5
A1 value 1.0 [μg/L] Total pesticides
DW Standard 0.1 [μg/L] General value for organic pesticides 1 fOC,susp = 0.1 kgOC/kgsolid (EC, 2003).
o Carbendazim has a log Kp, susp-water < 3; derivation of MPCsediment is not triggered. o Carbendazim has a log Kp, susp-water < 3; expression of the MPCwater as MPCsusp, water is not
required.
o Carbendazim has a BCF < 100 L/kg; assessment of secondary poisoning is not triggered. o Carbendazim is classified and labelled with R46, R60, R61. Therefore, an MPCwater for human
health via food (fish) consumption (MPChh food, water) should be derived.
o For carbendazim, no specific A1 value or Drinking Water Standard is available from Council Directives 75/440, EEC and 98/83/EC, respectively. Therefore, the general Drinking Water Standard for organic pesticides applies.
3.3
Toxicity data and derivation of ERLs for water
3.3.1
MPC
eco, waterand MPC
eco, marineAn overview of the selected freshwater toxicity data for carbendazim is given in Table 6. There are no valid marine toxicity data. Detailed toxicity data for carbendazim are tabulated in Appendix 2.
It should be noted that the quality of reporting in the DAR (EC, 1997) is very poor: no study summaries are included, aquatic toxicity data are only reported in tables with some additional notes. Data from the DAR were only accepted with Ri 2 if the notes to the tables in the DAR did not give any reason to question the outcome. The lowest endpoints used for ERL-derivation do not originate from the DAR.
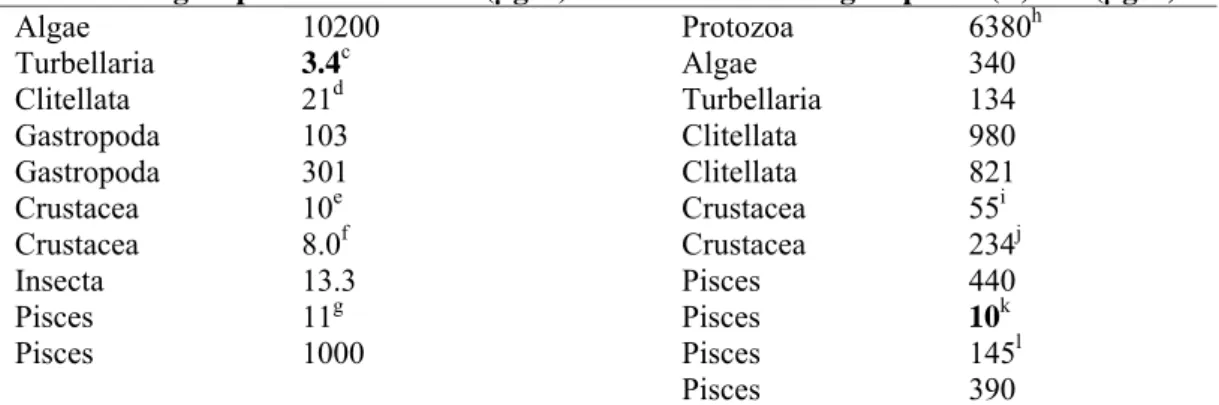
Table 6. Carbendazim: selected freshwater toxicity data for ERL derivation.
Chronica Acutea
Taxonomic group NOEC/EC10 (µg/L) Taxonomic group L(E)C50 (µg/L)
Algae 10200 Protozoa 6380h Turbellaria 3.4c Algae 340 Clitellata 21d Turbellaria 134 Gastropoda 103 Clitellata 980 Gastropoda 301 Clitellata 821 Crustacea 10e Crustacea 55i Crustacea 8.0f Crustacea 234j Insecta 13.3 Pisces 440 Pisces 11g Pisces 10k Pisces 1000 Pisces 145l Pisces 390
a For detailed information see Appendix 2. Bold values are used for risk assessment. b geometric mean of 10 and 10.4 mg/L, parameter growth for Scenedesmus subspicatus c most sensitive endpoint (# neonates) for Dugesia lugubris
d
LC10 for Stylana lacustris
e LC
10 Gammarus pulex
f geometric mean of 25.8, 13.0 and 1.5 µg/L, parameter reproduction for Daphnia magna g most relevant endpoint (mortality) and most sensitive exposure time for Oncorhynchus mykiss h most sensitive test duration (36 h) for Tetrahymena pyriformis
i most sensitive life stage Gammarus pulex
j geometric mean of 190, 390, 130, 150, 180, 350, 87, 460, 690 µg/L, parameter immobilisation or mortality for
D. magna; data for >3 mm animals (adults) omitted and most sensitive endpoint selected for <1.5 mm
k
most sensitive relevant life stage (fry) for Ictalurus punctatus l most sensitive life stage for O. mykiss
3.3.1.1 Treatment of fresh- and saltwater toxicity data
ERLs for freshwater and marine waters should be derived separately. For pesticides, data can only be combined if it is possible to determine with high probability that marine organisms are not more sensitive than freshwater organisms (Lepper, 2005). For carbendazim, no marine toxicity data are available and ERLs for the marine compartment cannot be derived.
3.3.1.2 Microcosm and mesocosm studies
For carbendazim, two cosm studies were available, a summary and evaluation is given in Appendix 3. In the first study, an indoor microcosm study described in Van den Brink et al. (2000) and Cuppen et al. (2000), the concentration was kept constant for four weeks. The NOEC of 3.3 µg/L can be considered for derivation of an MPCeco, water.
In the other study by Slijkerman et al. (2004) one dose was applied, but in view of the slow
disappearance from the system, the chronic NOEC of 1.79 µg/L can be considered for the derivation of the MPCeco, water.
From the same study, an acute NOEC of 2.17 µg/L can be derived. Fish were not included in the experiment, whereas the lowest LC50 in the acute dataset was obtained for a fish species. Therefore the
results of this mesocosm study are not considered suitable be used for derivation of the MACeco, water. 3.3.1.3 Derivation of MPCeco, water and MPCeco, marine
For carbendazim, a complete base set for toxicity to freshwater organisms is available. Moreover, long-term NOECs of at least three species representing three trophic levels are available. Therefore, the MPCeco, water is derived using an assessment factor of 10 on the lowest NOEC, i.e. the 21-d NOEC for
NOECs of 3.3 and 1.79 µg/L are available from micro/mesocosm studies, that are considered valid for derivation of the MPC (see 3.3.1.2). From a comparison of mesocosm studies with the insecticides chlorpyrifos and lambda-cyhalothrin, it can be concluded that an assessment factor of 3 may be necessary to cover variation at the level of the NOEAEC1 in case one reliable study is available (De
Jong et al., 2008, based on Brock et al., 2006).
Lepper (2005) argues that the scope of protection of an environmental quality standard under the WFD is broader than that of the “acceptable concentration” under Directive 91/414. It should be considered that the quality standard must be protective for all types of surface waters and communities that are addressed by the respective standard. Mesocosm studies performed in the context of 91/414 are normally focused on agricultural ditches that can be characterised as eutrophic shallow water bodies. Environmental quality standards under the WFD, however, must assure protection also for water bodies that significantly differ from this paradigm (Lepper, 2005). It is therefore in principle proposed to use an assessment factor of 3 on the NOEC instead of on the NOEAEC.
In addition, the variation between mesocosms is not studied in as much detail for fungicides as e.g. for insecticides. In this case, two studies available which both cover a wide range of tested species,
including Turbellaria and Cladocera, which appeared to be most sensitive in the laboratory studies. The NOEC for Dugesia lugubris, the species with the lowest laboratory NOEC, was established as 3.3 µg/L in the microcosm experiment. However, fish are not present in the cosms, while the available data indicate that fish may be very sensitive. A valid 96-h LC50 of 7 µg/L is available for yolk-sac fry of
Ictalurus punctatus (see Appendix 2). In view of the life stage, this test duration is chronic but since the
endpoint is an LC50 rather than a NOEC, it cannot be added to the chronic dataset. It indicates,
however, that there is remaining uncertainty as to whether the cosm data do fully cover the potentially sensitive species. Therefore an assessment factor of 3 is kept on the lowest NOEC, resulting in an MPCcosms of 0.60 µg/L.
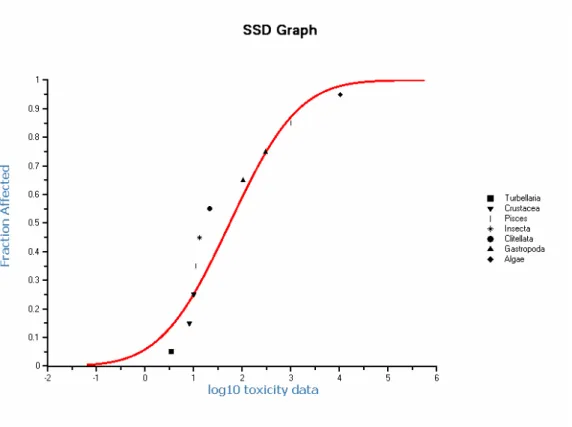
For comparison, the MPCeco, water is also derived applying Species Sensitivity Distribution (SSD) to the
chronic data. This is allowed when at least 10 NOECs (preferably 15) are available for different species covering at least eight taxonomic groups. The taxonomic groups to be covered and their representatives in the present dataset are as follows:
• fish: represented by Ictalurus punctatus (familiy Ictaluridae)
• a second family in the phylum Chordata: represented by Oncorhynchus mykiss (family Salmonidae) • crustacea: represented by Gammarus pulex and Daphnia magna
• insects: represented by Chironomus riparius
• a family in another phylum than Arthropoda or Chordata: represented by the phyla Platyhelminthes (Turbellaria)
• a family in any order of insect or any phylum not already represented: represented by Clitellata (phylum Annelida) and Gastropoda (phylum Mollusca)
• algae: represented by Scenedesmus subspicatus • macrophyta: -
The present dataset does not include macrophytes, but carbendazim was shown not to have a direct effect on macrophytes in the mesocosm study of Van den Brink et al., 2000 (see Appendix 3). Therefore, the minimum requirements for performing an SSD are considered to be met.
The data are normally distributed (P = 0.1 Anderson-Darling and Cramer von Mises test; P = 0.05 Kolmogorov-Smirnov test). The median estimate of the HC5 is 0.71 µg/L (90% CI 0.032 - 4.1 µg/L), calculated with ETX 2.0 (Van Vlaardingen et al., 2004). The SSD is shown in Figure 2.
Figure 2. Carbendazim: Species Sensitivity Distribution.
An assessment factor of 1 – 5 should be put on the HC5. The following points are considered for
determining the assessment factor (according to p. 75 of the INS-Guidance):
• The overall quality of the dataset is good, all data refer to chronic studies in which sensitive life stages were exposed.
• The dataset is considered to be representative for the aquatic ecosystem, different life forms, feeding strategies and trophic levels are included. The absence of macrophyta is not considered crucial for the estimated HC5. Macrophytes were shown not to be sensitive in the mesocosm study. It is thus
not expected that data for plants, if present, would influence the lower end of the curve. In view of the solubility of carbendazim, the NOEC for algae (10 mg/L) is at the upper range of valid NOECs. Additional NOECs for macrophytes far above this highest NOEC of the dataset are thus not expected either. Although the number of data is at the minimum of what is accepted (n = 10), it is considered that the present dataset adequately reflects the range of toxicity.
• The mode of action is known, but is not relevant for the tested species. For fungicides it is not possible to predict beforehand which taxon will be sensitive. The present data show that there is a large variation in toxicity, even within one species group (fish: factor of 90 difference between
Carassius auratus and Oncorhynchus mykiss).
• The goodness of fit is acceptable based on the statistical tests for normal distribution of data, but based on visual judgement the fit is not good. The shape of the curve is most likely influenced to a great extent by the data points in the lower left range. The confidence interval around the HC5 is rather large and spans more than a factor of 130. On the other hand, the HC5 of 0.71 µg/L is about a
factor of 5 lower than the lowest NOEC (3.4 µg/L).
• From the mesocosm studies, NOECs of 3.3 and 1.79 µg/L are available (see above) that are considered valid for derivation of the MPC. The NOECs are in good agreement with the lowest NOEC of the laboratory dataset (3.4 µg/L), but are a factor of 2.5 to about 5 higher than the HC5.
In view of the above listed points, there are reasons to apply an assessment factor to the HC5, mainly
because of the small dataset, the visual lack of fit and the large confidence interval. The remaining uncertainty is assumed to be covered by a factor of 3, leading to a MPCHC5 of 0.24 µg/L.
In the present case, the available information indicates that MPCHC5 is rather conservative. The
MPCcosm is 0.60 µg/L, which is over a factor of 5 lower than the lowest laboratory NOEC. It is
considered justified to use the MPCcosm and set the MPCeco, water to 0.60 µg/L.
No MPCeco, marine can be derived because no valid marine data are available.
3.3.2
MPC
sp, waterand MPC
sp, marineCarbendazim has a BCF < 100 L/kg, thus assessment of secondary poisoning is not triggered.
3.3.3
MPC
hh food, waterDerivation of MPChh food, water for carbendazim is triggered (Table 5). The MPChh food is calculated from
the ADI (0.02 mg/kg.bw), a body weight of 70 kg and a daily fish consumption of 115 g as MPChh food, water = 0.02 x 0.1 x 70/0.115 = 1.2 (Van Vlaardingen and Verbruggen, 2007). Subsequently the
MPChh food, water is calculated according as 1.2/BCF = 1.2/23 = 0.05 mg/L = 50 µg/L.
3.3.4
MPC
dw, waterThe Drinking Water Standard is 0.1 µg/L. Thus, the MPCdw, water is also 0.1 µg/L.
3.3.5
Selection of the MPC
waterand MPC
marineThe lowest value of the routes included (see Chapter 2.3) is the MPCeco, water. Therefore, the MPCwater is
0.60 μg/L.
No MPCmarine can be selected due to the absence of data.
3.3.6
MAC
eco3.3.6.1 MACeco, water
The MACeco, water may be derived from the acute toxicity data. Fourteen short-term values for three
trophic levels are available, carbendazim has no potential to bioaccumulate (BCF <100 L/kg), the mode of action for the tested species is non-specific and the interspecies variation is high. Therefore, an assessment factor of 100 is applied to the lowest L(E)C50, i.e. the EC50 for Ictalurus punctatus: 10
µg/L. Therefore, the MACeco is initially derived as 10 / 100 = 0.1 µg/L. However, because the MPCwater
(0.60 μg/L) is higher, the MACeco, water is put level with the MPCwater and becomes 0.60 μg/L. 3.3.6.2 MACeco, marine
Because no data are available for marine organisms, no MPCeco, marine can be derived.
3.3.7
SRC
eco, waterSince more than three long-term NOECs of three trophic levels are available, the SRCeco, water is derived
from the geometric mean of all available NOECs with an assessment factor 1. The geometric mean is 55.2 µg/L. Therefore, the SRCeco, water is derived as 55.2 / 1 = 55 µg/L.
3.4
Toxicity data and derivation of ERLs for sediment
The log Kp, susp-water of carbendazim is below the trigger value of 3, therefore, ERLs are not derived for
4
Conclusions
In this report, the risk limits Maximum Permissible Concentration (MPC), Maximum Acceptable Concentration for ecosystems (MACeco), and Serious Risk Concentration for ecosystems (SRCeco) are
derived for carbendazim in fresh water. Derivation of ERLs for the marine compartment was not possible due to lack of data. Derivation of risk limits for sediment was not triggered.
The ERLs that were obtained are summarised in the table below. The MPC value that was set for this compound until now, is also presented in this table for comparison reasons.
Table 7. Derived MPC, MACeco, and SRC values for carbendazim.
ERL Unit MPC MACeco SRC
Water, olda µg/L 0.5 - -
Water, new b µg/L 0.60b 0.60 55
Drinking waterb µg/L 0.1d - -
Marine µg/L n.d.c n.d.c n.d.c
a MPC based on total content, source: Risico’s van Stoffen http://www.rivm.nl/rvs/ b The MPC
dw, water is reported as a separate value from the other MPCwater values (MPCeco, water, MPCsp, water or MPChh food, water). From these other MPC water values (thus excluding the MPCdw, water) the lowest one is selected as the ‘overall’ MPCwater.
c n.d. = not derived due to lack of data
d provisional value pending the decision on implementation of the MPC
References
Brock TCM, Arts GHP, Maltby L, Van den Brink PJ. 2006. Aquatic risks of pesticides, ecological protection goals and common claims in EU legislation. Integrated Environmental Assessment and Management 2: E20-E46.
Cuppen JGM, Van den Brink PJ, Camps E, Uil KF, Brock TCM. 2000. Impact of the fungicide carbendazim in freshwater microcosms. I. Water quality, breakdown of particulate organic matter and responses of macroinvertebrates. Aquatic Toxicol 48: 233-250.
EC. 1997. Draft Assessment Report (DAR) Carbendazim. Rapporteur Member State Germany. EC. 2003. Technical Guidance Document in support of Commission Directive 93/67/EEC on Risk
Assessment for new notified substances, Commission Regulation (EC) No.1488/94 on Risk Assessment for existing substances and Directive 98/9/EC of the European Parliament and of the Council concerning the placing of biocidal products on the market. Part II. Ispra, Italy: European Chemicals Bureau, Institute for Health and Consumer Protection. Report no. EUR 20418 EN/2. De Jong FMW, Brock TCM, Foekema EM, Leeuwangh P. 2008. Guidance for summarizing and
evaluating aquatic micro- and mesocosm studies. A guidance document of the Dutch Platform for the Assessment of higher Tier Studies. Bilthoven, The Netherlands: National Institute for Public Health and the Environment (RIVM). Report no. 601506009/2008. 59 pp.
Lepper P. 2005. Manual on the Methodological Framework to Derive Environmental Quality Standards for Priority Substances in accordance with Article 16 of the Water Framework Directive
(2000/60/EC). 15 September 2005 (unveröffentlicht) ed. Schmallenberg, Germany: Fraunhofer-Institute Molecular Biology and Applied Ecology.
MNP. 2006. Tussenevaluatie van de nota Duurzame gewasbescherming. Bilthoven, The Netherlands: Milieu- en Natuurplanbureau. MNP-publicatienummer: 500126001.
Slijkerman DME, Baird DJ, Conrad A, Jak RG, Van Straalen NM. 2004. Assessing structural and functional plankton responses to carbendazim toxicity. Environ Toxicol Chem 23: 455-462. Tomlin CDS. 2002. e-Pesticide Manual 2002-2003 (Twelfth edition), Version 2.2. British Crop
Protection Council.
US EPA. 2007. EPI SuiteTM [computer program]. Version 3.2. Washington, DC, U.S.A: U.S. Environmental Protection Agency (EPA), Office of Pollution Prevention Toxics and Syracuse Research Company (SRC).
Van den Brink PJ, Hattink J, Bransen F, Van Donk E, Brock, TCM. 2000. Impact of the fungicide carbendazim in freshwater microcosms. II. Zooplankton, primary producers and final
conclusions. Aquatic Toxicol 48: 251-264.
Van Vlaardingen PLA, Traas TP, Wintersen AM, Aldenberg T. 2004. ETX 2.0. A program to calculate
hazardous concentrations and fractions affected, base don normally distributed toxicity data. Bilthoven, The Netherlands: National Institute for Public Health and the Environment (RIVM). Report no. 601501028/2004, 68 pp.
Van Vlaardingen PLA, Verbruggen EMJ. 2007. Guidance for the derivation of environmental risk limits within the framework of the project 'International and National Environmental Quality Standards for Substances in the Netherlands' (INS). Bilthoven, The Netherlands: National Institute for Public Health and the Environment (RIVM). Report no. 601782001. 146 pp.
report 601716014 21 Specie s Substan ce Analy sed Test Test pH Hardness/ Temp. Ex p. Ex p. BCF BCF Calcula tion Ri Notes Referen ce properti es purity ty pe w ater Salinity time con cn. ty pe method [%] [g/L ] [°C ] [m g/L ] [L/ kgww ] s h F 28 0.018 27 2 EC, 199 7 s h F 28 0.17 23 2 EC, 199 7
RIVM Letter r ep ort 601716014 2. 1. A cut e t ox ici ty o f carbe nd azim to fres hw ater orga nism s. s A Test Test Purity Test pH T Ha rdness E xp . Criterion T est Value Ri Notes Referen ce properti es ty pe compound w ater CaCO 3 time endpoint [%] [°C ] [m g/L ] [m g/L ] sph a e roides 1B N S Derosol 50 am 30±2 7d EC25 gr ow th 300 3 1,2 Chalam et al ., 1997 sph a e roides 1B N S Derosol 50 am 30±2 7d EC25 nitr ogen ease a ct 300 3 1,2 Chalam et al ., 1997 n a s pa lustri s 3A N S Derosol 50 am 30±2 7d LOEC grow th 400 3 1,2 Chalam et al ., 1997 n a s pa lustri s 3A N S Derosol 50 am 30±2 7d LOEC nitr ogen ease a ct 400 3 1,2 Chalam et al ., 1997 y ri fo rmis 20 h old cul ture N S ag am 23±1 12h EC 50 grow th 10.86 2 20 Rankin et al ., 1976 y ri fo rmis 20 h old cul ture N S ag am 23±1 36h EC 50 grow th 6.38 2 20 Rankin et al ., 1976 ido s a N S 72h EC50 grow th 0.34 4 4,8 DAR, Canton, 1976 ido s a in log pha se N S 97.4 am 24±1 96 48h EC50 grow th inhibi tion 0.34 2 4,21 ,22 Canton, 1976 s sub s pica tus N S 72h EC50 grow th 419 3 2,4 DAR, Heu sel, 1991 s sub s pica tus N S 32.7 72h EC50 grow th 43.8 3 4,9,24 DAR, Fischer 1981 s sub s pica tus 72h EC50 >8.0 4 2,4 DAR, Li st o f E ndpoi nts 2005 s sub s pica tus N S 98-99.4 am 22 96h EC50 grow th rate 54 3 29 Maslan kiew icz and Linders, 1993 e lla sub c api ta ta N S 72h EC50 grow th 1.3 3 4,7 DAR, Dougla s, Han dley , 1987 e lla sub c api ta ta Y S 72h EC50 7.7 4 3 DAR, Adde ndum 2 000 etocladia N S Bav istin 28±2 24h NOEC conidial ger mina tio n 5 3 2,10 ,11 Chandrashe kar , Ka ve riappa, 1994 etocladia N S Bav istin 28±2 24h EC100 conidial germi na tio n 2500 3 2,10 ,11 Chandrashe kar , Ka ve riappa, 1994 ticillata N S Bav istin 28±2 24h NOEC conidial ger mina tio n 5 3 2,10 ,11 Chandrashe kar , Ka ve riappa, 1994 ticillata N S Bav istin 28±2 24h EC100 conidial germi na tio n 2500 3 2,10 ,11 Chandrashe kar , Ka ve riappa, 1994 nicilloides N S Bav istin 28±2 24h NOEC conidial ger mina tio n 10 3 2,10 ,11 Chandrashe kar , Ka ve riappa, 1994 nicilloides N S Bav istin 28±2 24h EC100 conidial germi na tio n 2500 3 2,10 ,11 Chandrashe kar , Ka ve riappa, 1994 . N S Bav istin 28±2 24h NOEC conidial ger mina tio n 10 3 2,10 ,11 Chandrashe kar , Ka ve riappa, 1994 . N S Bav istin 28±2 24h EC100 conidial germi na tio n 2500 3 2,10 ,11 Chandrashe kar , Ka ve riappa, 1994 v ul a N S Bav istin 28±2 24h NOEC conidial ger mina tio n 5 3 2,10 ,11 Chandrashe kar , Ka ve riappa, 1994 v ul a N S Bav istin 28±2 24h EC100 conidial germi na tio n 2500 3 2,10 ,11 Chandrashe kar , Ka ve riappa, 1994 ces ja vani cus N S Bav istin 28±2 24h NOEC conidial ger mina tio n 1 3 2,10 ,11 Chandrashe kar , Ka ve riappa, 1994 ces ja vani cus N S Bav istin 28±2 24h EC100 conidial germi na tio n 2500 3 2,10 ,11 Chandrashe kar , Ka ve riappa, 1994 s half to fu lly grow n Y R Derosal 511 g /L dtw 7.9-8 .4 18±1 71. 2-89 .2 96h LC50 mortali ty 0.134 2 3,9 van W ijngaarde n e t al, 1998 fully grow n Y S Derosal dtw 7.9-8 .4 18±1 71.2-89 .2 48h LC50 mortali ty 0.98 2 3,9 van W ijngaarde n e t al, 1998 ris fully grow n Y R Derosal dtw 7.9-8 .4 18±1 71.2-89 .2 96h LC50 mortali ty 0.821 2 3,9 van W ijngaarde n e t al, 1998 <1.5 mm Y R Derosal dtw 7.9-8 .4 18±1 48h EC50 im mobilisa tion 0.192 2 3,9 van W ijngaarde n e t al, 1998 <1.5 mm Y R Derosal dtw 7.9-8 .4 18±1 96h EC50 im mobilisa tion 0.087 2 3,9 van W ijngaarde n e t al, 1998 <1.5 mm Y R Derosal dtw 7.9-8 .4 18±1 48h LC50 mortali ty 0.32 2 3,9 van W ijngaarde n e t al, 1998 >3 mm Y S Derosal dtw 7.9-8 .4 18±1 48h EC50 im mobilisa tion 1.34 2 3,9 van W ijngaarde n e t al, 1998 >3 mm Y S Derosal dtw 7.9-8 .4 18±1 96h EC50 im mobilisa tion 0.186 2 3,9 van W ijngaarde n e t al, 1998 >3 mm Y S Derosal dtw 7.9-8 .4 18±1 48h LC50 mortali ty >8 2 3,9 van W ijngaarde n e t al, 1998 >3 mm Y S Derosal dtw 7.9-8 .4 18±1 96h LC50 mortali ty 0.399 2 3,9 van W ijngaarde n e t al, 1998 Y S 48h EC50 immobilisa tion 0.39 2 3 DAR, Baer , 1992 N S 48h EC50 immobilisa tion 0.087 3 4,6 DAR, Hutton , 1 988
report 601716014 23 s A Test Test Purity Test pH T Ha rdness E xp . Criterion T est Value Ri Notes Referen ce properti es ty pe compound w ater CaCO 3 time endpoint [%] [°C ] [m g/L ] [m g/L ] N S 48h EC50 immobilisa tion 0.35 2 4 DAR, S tahl , 198 5 Y S 48h EC50 immobilisa tion 0.15 2 4 DAR, Fischer 1988 N S 50 48h EC50 immobilisa tion 0.13 2 4,9 DAR, Fischer 1981 N S 36 48h EC50 immobilisa tion 0.18 2 4,9 DAR, Heu sel, 1992 <24h old N S 97.4 20±1 48h LC50 mortali ty 0.46 2 4, 21 ,23 Canton, 1976 <24h old N S 98-99.4 7.4-7 .6 20 24h LC50 mo rtali ty 0.9 3 25 Maslan kiew icz and Linders, 1993 N S product 7.7 20 48h LC50 mortali ty 0.27 4 11,24 Maslan kiew icz and Linders, 1993 Y S 48h EC50 immobilisa tion 0.19 2 3 DAR, Adde ndum 2 000 Y S 500 SC 48h EC50 immobilisa tion 0.19 4 1,3 DAR, Adde ndum 2 000 5d N S 97.6 6.9 20.5 48h LC50 mortal ity 0.69 2 4,30 Przy b ylski , Rogo z, 1989 x juv enile Y S Derosal dtw 7.9-8 .4 18±1 96h LC 50 mortali ty 0.055 2 3,9 van W ijngaarde n e t al, 1998 x adult Y R Derosal dtw 7.9-8 .4 18±1 96h LC50 mo rtali ty 0.177 2 3,9 van W ijngaarde n e t al, 1998 . adults N S 50 nw 25±2 24h LC50 mort ali ty 0.101 4 1,17 Manonmani e t a l., 1989 u s subadul t Y S Derosal dtw 7.9-8 .4 18±1 71.2-89 .2 48h LC50 mortali ty > sol . 4 2,3,9 van W ijngaarde n e t al, 1998 scuri pes larv ae Y S Derosal dtw 7.9-8 .4 18±1 71.2-89 .2 EC50 ability to stay in sus p. > 3435 2 2,3,9 van W ijngaarde n e t al, 1998 rat us 40-70mm;6 .3g N S 60 7.8 22 196 96 LC50 mortal ity >1666 3 1,4,27 Maslan kiew icz and Linders, 1993 Y S 96h LC50 mortali ty 0.44 2 3,5 DAR, Fischer 1988 N S 43.6 96h LC50 mortali ty >436.0 3 2,4,9 DAR, Fischer 1981 40-100g N S 97 nw 7.1 16±1 400 96h LC50 mort ali ty > 5000 3 1,12 Lako ta e t al., 1993 eggs N S 50 0r 96 buffer (tris 0 .1 M) 7 16 96 h LC100 hatching <2.5 3 4 Gilet, Roub aud, 19 83 eggs N S 50 or 96 buffer (gly cine 0.1 M) 9 16 30 min LC100 hatching <5 3 4 Gilet, Roub aud, 19 83 62mm;3.5g N S 10.5 dw /tw 8.6 22 272 96 LC50 mort ali ty 240 3 1,2,4,28 Maslan kiew icz and Linders, 1993 N S dw /tw 8.2 22 96 LC50 mortali ty >1000 3 1,4,24 Maslan kiew icz and Linders, 1993 cta tu s 96h LC50 mortali ty 0.019 4 26 DAR, Palaw ski, 19 84 cta tu s Y olk-sa c fry N S 99 rw 7.4 22 40-48 96h LC50 mo rtali ty 0.007 2 4,19 ,31 Palaw ski, Know les, 1986 cta tu s Sw im-up fry N S 99 rw 7.4 22 40-48 96h LC50 mo rtali ty 0.012 2 4,19 Palaw ski, Know les, 1986 cta tu s Fry ; 0.2g N S 99 rw 7.4 22 40-48 96h LC50 mo rtali ty 0.01 2 4,19 Palaw ski, Know les, 1986 cta tu s Fingerling; 1 .2 N S 99 rw 7.4 22 40-48 96h LC50 mortali ty 0.019 2 4,19 Palaw ski, Know les, 1986 cta tu s Fingerling N S 99 rw 7.4 12 40-48 96h LC50 mort ali ty >0.56 3 4,19 Palaw ski, Know les, 1986 cta tu s Fingerling N S 99 rw 7.4 17 40-48 96h LC50 mortal ity 0.14 3 4,18 ,19 Palaw ski, Know les, 1986 cta tu s Fingerling N S 99 rw 7.4 22 40-48 96h LC50 mort ali ty 0.032 2 4,19 Palaw ski, Know les, 1986 cta tu s Fingerling N S 99 rw 6.5 22 40-48 96h LC50 mort ali ty 0.023 2 4,19 Palaw ski, Know les, 1986 cta tu s Fingerling N S 99 rw 7.5 22 40-48 96h LC50 mort ali ty 0.014 2 4,19 Palaw ski, Know les, 1986 cta tu s Fingerling N S 99 rw 8.5 22 40-48 96h LC50 mort ality 0.023 2 4,19 Palaw ski, Know les, 1986 cta tu s Fingerling N S 99 rw 8 22 40 96h LC50 mortali ty 0.018 2 4,19 Palaw ski, Know les, 1986 cta tu s Fingerling N S 99 rw 8 22 320 96h LC50 mortali ty 0.024 2 4,19 Palaw ski, Know les, 1986 ochi ru s Fry ; 0.2g N S 99 rw 7.4 22 40-48 96h LC50 mortali ty >3.2 2 4,19 Palaw ski, Know les, 1986 ochi ru s N S 96h NOEC mortal ity >17.25 2 4 DAR, Hutton 1984 ochi ru s 96h LC50 mortali ty 3.2 4 26 DAR, Palaw ski, 19 84 s m y k iss Y S 96h LC50 mortali ty 0.83 2 3 DAR, Fischer 1988 s m y k iss 96h LC50 mortali ty 0.87 4 26 DAR, Palaw ski, 19 84 s m y k iss N S 50 96h LC50 mortali ty 0.18 2 4,9 DAR, Heinemann , 1971 s m y k iss N S 36 96h LC50 mortali ty 0.5 2 4,9 DAR, Heu sel, 1991 s m y k iss 49mm; 1 .6g N S dw /tw 7.1 15.1 251 96h LC50 mo rtali ty 2.30 3 4,27 Masl an kiew icz and Linders, 1993
RIVM Letter r ep ort 601716014 s A Test Test Purity Test pH T Ha rdness E xp . Criterion T est Value Ri Notes Referen ce properti es ty pe compound w ater CaCO 3 time endpoint [%] [°C ] [m g/L ] [m g/L ] s m y k iss 59mm;2.9g N S 10.5 dw /tw 7.9 16. 7 96h LC50 mortali ty 2.1 3 1, 4,28 Maslan kiew icz and Linders, 1993 s m y k iss Y olk-sa c fry N S 99 rw 7.4 10 40-48 96h LC50 mortali ty 0.145 2 4,19 Palaw ski, Know les, 1986 s m y k iss Sw im-up fry N S 99 rw 7.4 10 40-48 96h LC50 mo rtali ty 0.32 2 4,19 Palaw ski, Know les, 1986 s m y k iss Fry ; 0.2g N S 99 rw 7.4 10 40-48 96h LC50 mo rtali ty 0.37 2 4,19 Palaw ski, Know les, 1986 s m y k iss Fingerling; 1 .2 N S 99 rw 7.4 10 40-48 96h LC50 mortali ty 0.87 2 4,19 Palaw ski, Know les, 1986 s m y k iss Fingerling N S 99 rw 7.4 7 40-48 96h LC50 mortal ity >1.8 3 4,18 ,19 Palaw ski, Know les, 1986 s m y k iss Fingerling N S 99 rw 7.4 12 40-48 96h LC50 mort ali ty 0.87 2 4,19 Palaw ski, Know les, 1986 s m y k iss Fingerling N S 99 rw 7.4 17 40-48 96h LC50 mortal ity 0.1 3 4,18 ,19 Palaw ski, Know les, 1986 s m y k iss Fingerling N S 99 rw 6.5 10 40-48 96h LC50 mort ali ty 0.64 2 4,19 Palaw ski, Know les, 1986 s m y k iss Fingerling N S 99 rw 7.5 10 40-48 96h LC50 mort ali ty 0.41 2 4,19 Palaw ski, Know les, 1986 s m y k iss Fingerling N S 99 rw 8.5 10 40-48 96h LC50 mort ali ty 0.34 2 4,19 Palaw ski, Know les, 1986 s m y k iss Fingerling N S 99 rw 8 10 40 96h LC50 mortali ty 0.78 2 4,19 Palaw ski, Know les, 1986 s m y k iss Fingerling N S 99 rw 8 10 320 96h LC50 mortali ty 0.88 2 4,19 Palaw ski, Know les, 1986 s m y k iss Y R 96h LC50 mortali ty 0.98 2 3 DAR, Adde ndum 2 000 s m y k iss Y R SC 500 50 96h LC50 mortali ty 5.5 4 1,3 DAR, Adde ndum 2 000 s m y k iss 3 m old N S 97.4 tw 10±1 48h LC 50 mortali ty 1.8 2 4,21 Canton, 1976 N S dw /tw 8.7 16 96 LC50 mortali ty 1 3 1,4,24 Maslan kiew icz and Linders, 1993 N 50 96h LC50 mortali ty 0.39 2 4,9 DAR, Fischer , 1981 is 0.28 g N S 50 tw 48h LC50 mortali ty 173.80 3 2, 4 Pan and Lian g, 199 3 ctyla 20mm(15-25mm); 500mg(350-800mg ) N R Bav istin 50 6.2(6 .0-6 .4) 14(12-17) 20(15-25) 96h LC 50 mortali ty 16.02 4 1,14 ,15 Khangaro t e t al., 19 85 ritten , if corre cted for puri ty 17 ste rilized pa ddy fiel d w ater cen tra tion a nd/or te st re sul t > 3 time s abov e w ater solubili ty (29 mg /L - EP IW IN, mea sure d w s: 8 mg /L) 18 too high/lo w temper ature es ul t b as ed on m ea su re d c onc en tr at io ns . 19 testing for d etermin e effe ct o f pH or Temperature or hardn ess sult ba sed o n nominal conce ntr ation s. 20 1% DMSO , bu t rep orted no t to hav e effect on cell grow th ere re cal culated by author s o f DAR 21 test sol ution minim ally aerated ere fed d uring the te st; endp oint not u sed for ri sk a ssessmen t i n D AR 22 medium accor ding W an ka, 196 5 cen tra tion in th e con trol cul tur es h av e not i ncr eased by a factor of a t least 16 w ith in 3 da ys 23 medium accor ding Fr eeman and Fow ler 1953 te descrip tion o f te st condition , tempera ture highe r th an 2 2°C, repli ca tion s "at lea st" in du plica te 24 test con cen tr at ion a nd/or te st re sul t ab ov e w ater solubili ty , but formula ted pro duct u sed repo rted as a ctiv e ingred ien ts 24
product not specifie
d solu tio n 25 T ylose as solv ent, 0.25% is no t clear ; it is al so not clear if r esul ts are repor ted in mg/L fo rmula tion or mg /L activ e ingr edient 26 figure o nly ci ted in DAR, furth er in form ation not giv en calculated form 8mv al 27 precipi ta tion of undi sso lv ed test sub sta nce ution w as ch ange on ce a w eek 28 product w ith 74.6% maneb as seco nd activ e ingre dient solu tion w as prepared in ace ton e, n o in forma tion a bout amount o f solv ent i n te st soluti on, in solv ent contro l w as n ot ob serv ed y 29 endpoint mo st li kel y based on tw o ala ge tests abov e 3mg/l 30 10 animal s i n 25 m L medium; 96-h LC 50 0 .270 mg /L ddy fiel d w ater 31 not con sider ed for ERL deriv ation because thi s is embry onal stag e
report 601716014 25 2. 2. A cut e t ox ici ty o f carbe nd azim to m arine or ganism s. s A T est T est Purity T est pH T Salin ity Ex p. Criterion Test Value Ri Notes Referen ce properti es ty pe compound w ater time endpoint [%] [°C ] [‰ ] [m g/l ] a rcki i oocy tes N S am 15 5.15h NOEC fe rtiliza tion 0.0191 4 1,2,3 Dix on et al., 1999 a rcki i oocy tes N S am 15 5.15h EC100 fe rtiliza tion 1.91 4 1,2 Dix on et al., 1999 a rcki i embry o N S am 15 6-6.5h NOEC dev elopment 0.0019 4 1,2 Dix on et al., 1999 a rcki i embry o N S am 15 6-6.5h EC100 dev elopment 1.9119 4 1,2 Dix on et al., 1999 tus Y S 96h NOEC mortali ty >1.158 2 4 DAR, Boer i, 1988 stone seaw ate r is no t clear ; it is al so not clear if r esul ts are repor ted in mg/L formula tion or mg /L activ e ingr edient are al so re sul ts o f frequen cy of a naphase abbe ratio ns es ul t b as ed on m ea su re d c onc en tr at io ns
RIVM Letter r ep ort 601716014 2. 3. C hron ic to xic it y of carbe nd azim to freshw ater orga nism s. s A Test Test Purity Test pH T Ha rdness Ex p. Criterion T est Value Ri Notes Referen ce properti es ty pe compound w ater CaCO 3 time endpoint [%] [°C ] [m g/L ] [m g/L ] s ile nse 72h old Isola te No. 13 ( Pa spalum dila tum) N S Bav istin am 30 10d NOEC N2 fix ation 2000 3 7,10 ,18,1 9 Zambre, K onde, 19 85 s ile nse 72 h old Isola te No . 16 ( Penni se tum amer ic anum) N S Bav istin am 30 10d NOEC N2 fix ation 2000 3 7,10 ,18,1 9 Zambre, K onde, 19 85 s ile nse 72 h old Isola te No . 19 ( Cy nodon dacty lon) N S Bav istin am 30 10d NOEC N2 fix ation 2000 3 7,10 ,18,1 9 Zambre, K onde, 19 85 y ri fo rmis 20 h old cul ture N S ag am 23±1 36h NOEC grow th <5.0 2 20 Rankin et al ., 1976 . N S Bav istin am 30d NOEC grow th 1 4 11,15 ,16,17,2 8 Shiv aprakash , S hetty , 1986 riabili s N S Bav istin am 30d NOEC grow th 1 4 11,15 ,16,17,2 8 Shiv aprakash , S hetty , 1986 N S am 25±3 30d NOEC grow th 1000 3 10,11 ,12,13 Gangaw ane and S aler, 1979 N S am 25±3 30d NOEC grow th 500 3 10,11 ,12,13 Gangaw ane and S aler, 1979 N S Bav istin am 30d NOEC grow th 20 4 11,15 ,16,17,2 8 Shiv aprakash , S hetty , 1986 la N S Bav istin am 30d NOEC grow th 1 4 11,15 ,16,17,2 8 Shiv aprakash , S hetty , 1986 N S Bav istin am 30d NOEC grow th 20 4 11,15 ,16,17,2 8 Shiv aprakash , S hetty , 1986 N S Bav istin am 30d NOEC grow th <1 4 11,15 ,16,17,2 8 Shiv aprakash , S hetty , 1986 N S am 25±3 30d NOEC grow th 500 3 10,11 ,12,13 Gangaw ane and S aler, 1978 e lla sub c api ta ta N S 72h NOEC grow th 0.5 3 2,22 DAR, Dougla s, Han dley , 1987 e lla sub c api ta ta Y S 72h NOEC 2.5 4 1 DAR, Adde ndum 2 000 s sub s pica tus N S 72h NOEC grow th 10 2 2 DAR, Heu sel, 1991 s sub s pica tus N S 32.7 72h NOEC grow th 10.4 2 2,23 DAR, Fischer 1988 fman i N S Bav istin am 30d NOEC grow th 5 4 11,15 ,16,17,2 8 Shiv aprakash , S hetty , 1986 s N S am 25±3 30d NOEC grow th 1000 3 10,11 ,12,13 Gangaw ane and S aler, 1978 seed s, v arieta S uh asini N S 7d NO EC germination 500 3 10,13 ,14 Gangaw ane and S aler, 1978 seed s, v arieta S urya N S 7d NOEC germination 500 3 10,13 ,14 Gangaw ane and S aler, 1978 seed s, v arieta S aty a N S 7d NOEC germination ≥ 1000 3 10,13 ,14 Gangaw ane and S aler, 1978 yc etes N R Bav istin dw 28±2 60d NOEC sporula tion 5 3 6,7,8,10 Chandrashe kar , Ka ve riappa, 1994 yc etes N R Bav istin dw 28±2 60d LOEC sporula tion 500 3 6,7,9, 10 Chandrashe kar , Ka ve riappa, 1994 s half to fu lly grow n Y R Derosal 511 g /L dtw 7.9-8 .4 18±1 71.2-89 .2 21d LC10 mortali ty 0.012 2 1,13 van W ijngaarde n e t al, 1998 s half to fu lly grow n Y R Derosal 511 g /L dtw 7.9-8 .4 18±1 71.2-89 .2 21d NOEC reprodu ction 0.0034 2 1,13 ,29 van W ijngaarde n e t al, 1998 s half to fu lly grow n Y R Derosal 511 g /L dtw 7.9-8 .4 18±1 71.2-89 .2 21d NOEC reprodu ction 0.011 2 1,13 ,30 van W ijngaarde n e t al, 1998 ris fully grow n Y R Derosal dtw 7.9-8 .4 18±1 71.2-89 .2 7d LC10 mortali ty 0.021 2 1,13 van W ijngaarde n e t al, 1998 u lat a subadul t Y R Derosal dtw 7.9-8 .4 18±1 71.2-89 .2 28d LC10 mortali ty 1.193 2 1,13 van W ijngaarde n e t al, 1998 u lat a subadul t Y R Derosal dtw 7.9-8 .4 18±1 71.2-89 .2 28 NOEC reprodu ction 0.103 2 1,13 ,31 van W ijngaarde n e t al, 1998 s subadul t Y R Derosal dtw 7.9-8 .4 18±1 71.2-89 .2 28 NOEC reprodu ction 0.301 2 1,13 ,32 van W ijngaarde n e t al, 1998 ticu s subadul t Y R Derosal dtw 7.9-8 .4 18±1 71.2-89 .2 3 1,13 van W ijngaarde n e t al, 1998 <1.5 mm Y R Derosal dtw 7.9-8 .4 25d EC10 im mobilisa tion 0.03 2 1,13 van W ijngaarde n e t al, 1998 <1.5 mm Y R Derosal dtw 7.9-8 .4 25d EC50 im mobilisa tion 0.044 2 1,13 van W ijngaarde n e t al, 1998 >3 mm Y S Derosal dtw 7.9-8 .4 25d NOEC reprodu ction 0.0258 2 1,13 van W ijngaarde n e t al, 1998 Y R tg 21d NOEC immob ilisa tion 0.027 2 1,3 DAR, Baer , 1992 Y R tg 21d NOEC reprodu ction 0.013 2 1 DAR, Hutton , 1 988 Y R tg 21d NOEC reprodu ction >0.010 2 2 DAR, Fischer , 1988
report 601716014 27 s A Test Test Purity Test pH T Ha rdness Ex p. Criterion T est Value Ri Notes Referen ce properti es ty pe compound w ater CaCO 3 time endpoint [%] [°C ] [m g/L ] [m g/L ] N R Punch CS 12.1 21d NOEC reprodu ction 0.01573 3 2,4,24 DAR, Baer , 1992 N R Punch C 12.1 21d NOEC mo rtali ty 0.0605 3 2,4,24 DAR, Baer , 1991 N R Punch C 12.1 21d NOEC reprodu ction 0.01573 3 2,4,24 DAR, Baer , 1991 N R Punch C 12.1 21d NOEC grow th 0.007623 3 2,4,24 DAR, Baer , 1991 N 97.4 18d EC50 reprodu ction ca. 0 .02 3 2,20 Canton, 1976 N 97.4 18d EC10 repr odu ction 0.016 4 2,20 Canton, 1976 N 97.4 18d NOEC repr odu ction 0.01 4 2, 20 ,25 Canton, 1976 Y R 99.5 21d NOEC reprodu ction 0.0015 2 1 DAR, Adde ndum 2 000 x adult Y R Derosal dtw 7.9-8 .4 21d LC10 mo rtali ty 0.010 2 1,13 van W ijngaarde n e t al, 1998 s Y S 500 SC 50 28d NOEC emergence 0.0133 2 4,5 List o f End Points s m y k iss N F tg 21d NOEC mort ali ty 0.018 2 2 DAR, Fischer 1988 s m y k iss Y F tg 79d NOEC mortali ty 0.011 2 1 DAR, Baer , 1993 s m y k iss N F Punch CS 12.1 21d NOEC grow th 0.01452 3 2,4,24 DAR, Hutton , 1 992 s m y k iss N F Punch C 12 21d NOEC mortal ity 0.0228 3 2,4,24 DAR, Hutton , 1 991 40-100g N R 97 nw 7.1 16±1 400 14d LC50 mortal ity 3.16 2 2,26 ,27 Lako ta e t al., 1993 40-100g N R 97 nw 7.1 16±1 400 14d NOEC mort ali ty 1 2 2,26 ,27 Lako ta e t al., 1993 40-100g N R 97 nw 7.1 16±1 400 24d LC50 mortal ity 3.16 2 2,26 ,27 Lako ta e t al., 1993 40-100g N R 97 nw 7.1 16±1 400 24d NOEC mort ali ty 1 2 2,26 ,27 Lako ta e t al., 1993 sult ba sed o n measured con ce ntra tion s. 17 in th e study they examine al so nitro gen fix ation , bu t the re i s r egular la ck of pa ttern and cha nges can be ca used by in div idual metaboli sm of algae sult ba sed o n nominal conce ntr ation s. 18 microaerop hilic ni tr ogen-fix ing ba cte riu m, in Dobereine r´s N- free semi-solid medium 0.066 mg/l; inv alid co ncer ning rep rodu ction b ecau se resu lts
ups tested are
no t pl ausi ble 19 stimula tory effe ct for puri ty (recal cula ted) 20 no in formati on a bo ut te st condi tion esul ts from list o f E nd P oints ar e th e same as in DAR 21 test con cen tra tion a nd/or te st re sul t ab ov e w ater solubili ty (29 m g/ l EP IW IN , m easure w s: 8 m g/l ) es on co ffe e and rubber leav es colle cted from a fr ee fl ow ing stream 22 cell con cen tra tion in th e con trol cul tur es h av e not i ncr eased by a factor of a t least 16 w ithin 3 da ys is no t clear ; it is al so not clear if r esul ts are repor ted in mg/L formula tion a ctiv e ingredient 23 resul ts are repo rted as a ctiv e ingred ien ts ct o f a ny of 18 speci es, at th e concen tra tion 25 mg /L sporu lated 8 te st 24 product w ith 23-24 .9% flusilazo le a s second a ctiv e ingred ient sporula tio n fo r all 18 speci es 25 read from g raph , n o sta tisti cs cen tra tion a nd/or te st re sul t ab ov e w ater sol ubili ty (29 mg/L- EPIW IN) 26 hardness re calculated form 8mv al nitr ogen fre e medium 27 test sol ution w as ch ange on ce a w eek tion fo r 8 ho urs at ligh t i nten si ty 1500lux at 25±3 a nd than a llow ed to day s 28 not clea r w hether e ffe cts are significan t repo rted as a ctiv e ingred ien ts 29 # neona te s she s moist chamber , seed s w ere irrigated w ith 10 ml o f pe sti cide o th er da ta av ailable ab out te st condi tion s; tw o con centratio ns 30 # co coo ns is not clear ; r esul ts are repor ted in mg/L formula tion 31 # egg cl utche s t/12 d ark; li ght i nten si ty 2000 flux 32 increa sed # egg clu tche s
RIVM Letter r ep ort 601716014 4. C hron ic to xic it y of carbe nd azim to m arine orga nism s. Specie s A Test Test Purity Test pH T Salinit y Ex p. Criterion Test Value Validity Notes Referen ce properti es ty pe compound w ater time endpoint [%] [°C ] [‰ ] [m g/l ] a rcki i oocy tes N S am 15 2h15min NOEC fe rtiliza tion 0.0019 4 1,2,3 Dix on et al., 1999 a rcki i oocy tes N S am 15 2h15min EC100 fe rtiliza tion 1.91 4 1,2 Dix on et al., 1999 a rcki i embry o N S am 15 48h LOEC dev elopment ≤0.0019 4 1,2 Dix on et al., 1999 a rcki i embry o N S am 15 48h EC100 dev elopment 1.91 4 1,2 Dix on et al., 1999 stone seaw ate r is no t clear ; it is al so not clear if r esul ts are repor ted in mg/L formula tion or mg /L activ e ingr edient are al so re sul ts o f frequen cy of a naphase abbe ratio ns
Appendix 3. Description of mesocosm studies
Study 1: Microcosm study with natural populations of algae, zooplankton and macroinvertebrates.
Species; Population; Community
Algae, plants, zooplankton, macroinvertebrates; decomposition Test Method Indoor microcosm
System properties Microcosms 1.1 x 1.1 m, height 70 cm, 600 L, 10 cm lake sediment and 50 cm water Formulation Derosal
Exposure regime 0, 3.3, 33, 100, 330 and 1000 µg/L in duplicate (January 1995) Analysed Y Temperature [°C] 19 ± 2 º pH range 7.9 - 10 Hardness [mg CaCO3/L] Not reported
Exposure time 4 weeks, effects followed during 11 weeks
Criterion NOEC 17
Test endpoint Community and populations of macroinvertebrates and zooplankton Value [µg/L] 3.3
GLP N Guideline Notes Ri 2
Reference Cuppen et al., 2000; Van den Brink et al., 2000
Test system. 12 indoor microcosms of glass, 1.1 x 1.1 m, height 70 cm, 600 L, 10 cm lake sediment and 50 cm water. Constant room temperature 19 ± 2 ºC 14 h light.
Natural populations of plankton and soil dwelling macroinvertebrates were introduced into the microcosms with natural sediment and well water. Elodea nuttallii and several populations of macroinvertebrates and zooplankton were deliberately introduced, and left to acclimatise during a 3 month period, in which all microcosm were interconnected. The cosms were disconnected before the start of the experiment.
Application took place on January 1995. Nominal initial dosages 0, 3.3, 33, 100, 330 and 1000 g/L in duplicate. The concentration was kept constant during 4 weeks, after which effects were followed for another 6 weeks. The formulation Derasol was sprayed evenly over the surface, mixed through the water column and water was circulated in the cosm during the whole experimental period. Carbendazim was added five times to maintain the intended concentration during the first 4 weeks of the experiment
Analytical sampling. Samples were taken at several moments after the start of the experiment.. Effect sampling.
Phytoplankton was collected several times before and on 1, 2, 3, 4, 5, 6, 7, and 9 weeks after start of exposure. Algal species were identified and counted, chlorophyll a determined. Periphyton samples were collected 1, 3, 5, 7, and 9 weeks after start of exposure using glass slides, and chlorophyll a was determined. Standing stock of aquatic macrophytes was determined at the end of the experiment. Bioassays were performed in the cosm with Lemna minor, Elodea nuttallii and Oedogonium.. Zooplankton was collected several times before and on 1, 2, 3, 4, 5, 6, 7, and 9 weeks after start of exposure, and species were identified and counted. Apart from this, bioassays with Daphnia magna were conducted in the cosm. Macroinvertebrates were sampled at 2 weekly intervals by means of artificial substrate (pebble baskets and multiplates) and from the litterbags (see below). At the end of the experiment all macroinvertebrates in the microcosms were sampled and identified. Bioassays were conducted with Gammarus pulex, Asellus aquaticus and Bithynia tentaculata. Effects on decomposition were studied using litterbags, containing E. nuttallii shoots and Populus leaves. In one experiment litterbags were left to decompose during two weeks, and then replaced by new ones. In a second experiment, litterbags were introduced at the start of the experiment, and sampled after 2, 4, 6 and 8 weeks.
Statistical analysis
Chemical analysis. The Average Exposure Concentration deviated less than 10% from the nominal concentrations. After this period the half life appeared to be dependent on the dose: 25 weeks in the lowest levels, to 6 weeks in the highest level.
Biological observations.
The PRC for phytoplankton showed a NOEC of 33 µg/L (increase). The lowest NOEC found for individual species (important for the PRC) is 100 µg/L. Chlorophyll-a also increased at the highest two treatment levels. A bioassay with Scenedesmus acutus showed a decreased growth in the highest dose. The PRC for periphyton did not show treatment related effects, and for the individual species no clear treatment related effects were found.
The biomass of the macrophytes was significantly increased at the end of the experiment for E. nuttallii in the two highest dosages. The same effect was found in the bioassays.
For zooplankton the PRC indicates a NOEC community of 33 µg/L. For individual species the lowest NOEC is found for Acroperus harpae (3.3 µg/L). The bioassay with D. magna resulted in a 28 d EC10 value of 20 µg/L.
For macroinvertebrates the PRC shows clear effects in the 33 µg/L treatment, resulting in a NOEC community of 3.3 µg/L 1, 5, 7 and 9 weeks after treatment. For 3 species a NOEC < 3.3 was found in the post treatment period. In one case (Nemertea sp.) numbers were very low and variable. In the other two cases (Lymnea stagnalis and Segmentina nitida)higher number were found in the treated
microcosms. The bioassays showed effects on B. tentaculata in the highest treatment only. For G. pulex a NOEC < 3.3 µg/L was found between weeks 3 and 6.
Decomposition: the experiments in which the decomposition period was 2 weeks showed no significant effects. The experiment with longer decomposition periods showed significant lower decomposition 4 weeks after application in the 330 and 1000 µg/L treatment.
Evaluation of the scientific reliability of the field study Criteria for a suitable (semi)field study
1. Does the test system represent a realistic freshwater community? Yes, natural populations of algae, macrophytes, micro and macroinvertebrates were present. No fish.
2. Is the description of the experimental set-up adequate and unambiguous? Yes
3. Is the exposure regime adequately described? Unclear. Not all data are reported, but results indicate that measured concentrations are close to nominal during the 4 week exposure period. 4. Are the investigated endpoints sensitive and in accordance with the working mechanism of the
compound? Unclear. Carbendazim is a fungicide. Laboratory data show that the substance is toxic to a number of different invertebrate species.
5. Is it possible to evaluate the observed effects statistically? Yes, statistical significant results are reported for community and individual species.
These criteria result in an overall assessment of the study reliability. The study is considered to be less reliable mainly due to the lack of raw exposure and effect data and (Ri 2).
Since in this study a chronic exposure of 4 weeks is maintained, the results can be used for derivation of a MPCeco. Based on this mesocosm study study, a NOEC of 3.3 µg/L can be used.
Study 2: Mesocosm study with natural populations of algae, zooplankton and macroinvertebrates.
Species; Population; Community
Algae, macro-invertebrates Test Method Outdoor mesocosm
System properties Mesocosms 1.7 (bottom) and 2.25 m (top) diameter, 1.95 m high, 3,000 L, 10 cm sand and 5 cm organic rich sediment from an artificial pond were added.
Formulation Carbendazim
Exposure regime 0 (n = 5), .3 (n = 3), 30 (n = 3) and 300 (n = 3) µg/L (October 3, 2000) Analysed Y
Temperature [°C] Not reported pH range 7.9 – 8.5 Hardness [mg
CaCO3/L]
Not reported
Exposure time 1 application, mixing during 4 h, effects followed for 4 weeks Criterion NOEC
Test endpoint Community and populations of phyto- and zooplankton Value [µg/L] 2.17
GLP N Guideline Notes Ri 2 Reference Slijkerman et al., 2004
Test system. 17 outdoor mesocosms 1.7 (bottom) and 2.25 m (top) diameter, 1.95 m high, 3000 L, 10 cm sand and 5 cm organic rich sediment from an artificial pond were added.
Natural populations of phytoplankton and zooplankton were introduced into the microcosms with natural sediment and Markermeer water. The cosms were interconnected during two weeks before exposure. The cosms were disconnected before the start of the experiment.
Application took place on October 3, 2000. Nominal initial dosages 0, 3, 30, and 300 g/L in triplo, 5 controls. Carbendazim was dosed under the water surface, and water was circulated during 4 h.
Analytical sampling. Analytical results are reported from day 0 and 29. Effect sampling.
Zooplankton was collected one day before exposure and 3, 7, 14, 21 and 28 days after exposure and species were identified and counted. Apart from this bioassays with Daphnia magna were conducted in the cosm. Feeding activity and survival were measured.
Statistical analysis
The results were analysed using multivariate analyses. RESULTS
Chemical analysis. The actual concentrations were 30% lower than nominal on day 0. The
disappearance rate of the compound was higher in the lower treatment levels than in the higher. The initial measured exposure concentration was: 0.28 µg/L in the untreated control, 2.17 µg/L in the 3 µg/L treatment, 20.67 µg/L in the 30 mg/L treatment and 226 µg/L in the 300 µg/L treatment. Concentrations after 20 days were 0.11, 1.47, 15.33 and 212 µg/L respectively and average exposure concentrations were 0.18, 1.79 µg/L 17.82, 218.8 µg/L, respectively.
Biological observations.
Feeding behaviour of D. magna was inhibited in the highest (300 µg/L) treatment only 1 and 3 days after treatment. The PRC for zooplankton showed a clear treatment related response. For the PRC and for the most sensitive group, the Cladocerans, it is clear that significant effects are seen at the 30 µg/L treatment. Effects on the 3 µg/L treatment are also seen, but the are not indicated as significant, and in the PRC the effects on the lowest treatment are more severe than on the middle treatment, until day 14 after treatment. Chlorophyll-a also increased at the highest treatment level.
Evaluation of the scientific reliability of the field study Criteria for a suitable (semi)field study
1. Does the test system represent a realistic freshwater community? No, macrophytes, macro-invertebrates and fish are not included.