RIVM letter report 11235/2007
Environmental Risk Limits for Zinc
C.W.M. Bodar
This investigation has been performed for the account Directorate-General for Environmental Protection, Directorate for Chemicals, Waste and Radiation, in the context of the project ‘International and National Environmental Quality Standards for Substances in the Netherlands (INS)’, RIVM project M/601501/06. Contact: Dr C.W.M. Bodar
Expertise Centre for Substances (SEC) E-mail: charles.bodar@rivm.nl
National Institute for Public Health and the Environment, PO Box 1, 3720 BA Bilthoven, The Netherlands. Tel 31.30.-2749111, fax 31.30-2742971
Contents
1. Outline --- 1 2. Aquatic compartment --- 3 3. Terrestrial compartment --- 21
1. Outline
In this report environmental risk limits (ERLs) are derived for zinc. The report has been prepared within the project ‘International and National Environmental Quality Standards for Substances in the Netherlands (INS)’. The aim of the project INS is to derive environmental risk limits (ERLs) for substances in the environment for the compartments air, (ground)water, sediment and soil. Environmental risk limits serve as advisory values to set environmental quality standards by the Steering Committee for Substances for various policy purposes. The term environmental quality standard is used to designate all legally and non-legally binding standards that are used in Dutch environmental policy. The various ERLs are:
• the negligible concentration (NC) for water, soil, groundwater, sediment and air
• the maximum permissible concentration (MPC) or maximum permissible addition (MPA) for water, soil, groundwater, sediment and air
• the ecotoxicological serious risk concentration (SRCeco) for water, soil, groundwater and sediment
For substances, for which toxicity data have been collected and evaluated within the European Existing Substances Regulation (EU-RAR), it was agreed that the ERLs for water, soil and sediment will be derived from the PNEC values mentioned in these reports.
The EU-RAR on zinc and zinc compounds, including all underlying data, was the principal basis for the currently proposed ERLs (only MPC/MPA values) for zinc. It should, however, be mentioned that the Scientific Committee on Health and Environmental Risks (SCHER) has not yet reviewed the EU zinc risk assessment. The SCHER will most probably release their opinion in July/August 2007. Chapter 2 of this report contains the zinc fact sheet as recently agreed upon by the SQUA working group (EG ‘Kwaliteitscriteria voor Rijnrelevante Stoffen; meeting of 22 March 2007) related to the implementation of the Water Framework Directive. This fact sheet contains quality standards (QS) for the aquatic environment. The zinc PNECs for water and sediment from the EU-RAR directly served as input for, respectively, the surface water annual average QS (AA-QS) and sediment derivation in this fact sheet. For the AA-QS in marine waters and the maximum acceptable concentration QS (MAC-QS) new values were derived on the basis of the data set in the EU-RAR. This because the EU-RAR itself did not contain equivalent PNECs. It should be noted that the QS values in the fact sheet include the natural background value (Cb) as estimated for the Rhine river catchment basin (QS = {MPA or PNECadd} + Cb). Currently derived ERLs for zinc should relate to the PNECadd, i.e. the Maximum Permissible Addition (MPA).
Chapter 3 contains the MPA (PNECadd) for the terrestrial compartment. It largely comprises an excerpt of relevant sections in the EU-RAR resulting in a PNECadd/MPA for soil for zinc.
Both the SQUA fact sheet for the aquatic compartment (draft version) and the section on soil were discussed in the ‘Scientific Advisory Group INS’ on 28 November 2006.
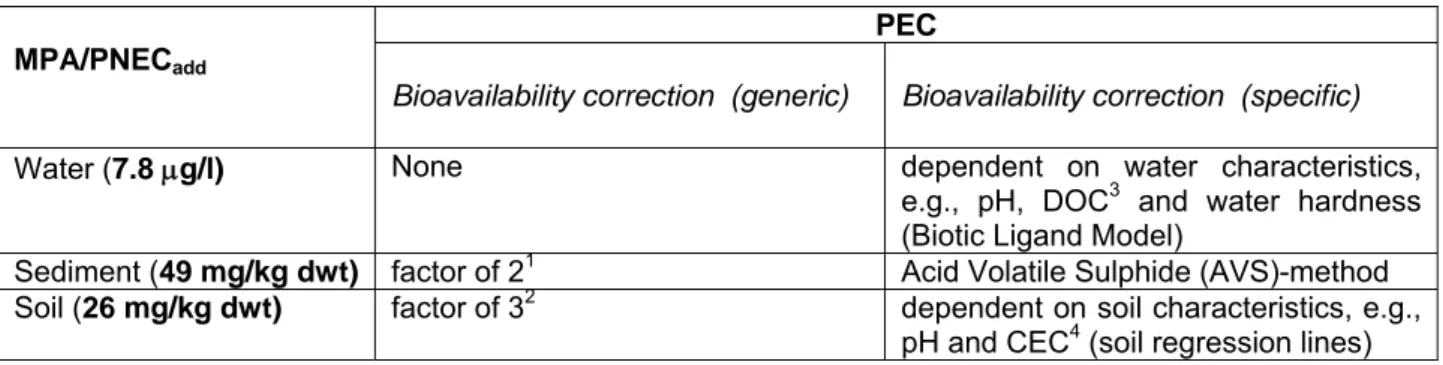
Bioavailability correction
It is well known that various physicochemical parameters in the environment may affect the bioavailability of zinc, thereby influencing the ecotoxicity. In the EU-RAR a quantitative bioavailability correction is used for both surface water, sediment and soil. The EU-RAR discriminates between generic correction factors and site- or region-specific ones (see Table 1). This all embedded in a tiered approach, starting with a first, uncorrected (worst-case) step towards more refinement in the next steps if step one indicates a potential risk (for further details: see EU-RAR). These correction steps are being applied on the predicted environmental concentrations (PECs) rather than on the predicted no effect concentrations (PNECs). Under the Water Framework Directive a similar approach is prescribed, i.e. that a potential bioavailability correction for a metal should be applied on the monitoring results. The presently proposed ERLs for zinc also refer to ‘uncorrected’ values.
2
Table 1.Bioavailability corrections for zinc as applied in the EU-RAR on zinc and zinc compounds. PEC
MPA/PNECadd
Bioavailability correction (generic) Bioavailability correction (specific)
Water (7.8 μg/l) None dependent on water characteristics,
e.g., pH, DOC3 and water hardness (Biotic Ligand Model)
Sediment (49 mg/kg dwt) factor of 21 Acid Volatile Sulphide (AVS)-method Soil (26 mg/kg dwt) factor of 32 dependent on soil characteristics, e.g.,
pH and CEC4 (soil regression lines)
1 The predicted environmental concentration (PEC) or monitoring result is divided by a factor of 2 to obtain the bioavailable concentration
of zinc in sediment. This corrected value is subsequently used in the assessment of the PEC/PNEC.
2 The predicted environmental concentration (PEC) or monitoring result is divided by a factor of 3 to obtain the bioavailable concentration
of zinc in soil. This corrected value is subsequently used in the assessment of the PEC/PNEC.
3 DOC: dissolved organic carbon 4 CEC: cation exchange capacity
From ERLs to environmental quality standards
If, and, if yes, to what extent bioavailability corrections should be implemented when setting the final environmental quality standards for zinc should be further discussed in the Steering Committee for Substances. RIVM could prepare a separate discussion document on this topic addressing both technical possibilities and more policy-related aspects. Various technical options are possible, e.g. no bioavailability correction, only the generic correction for sediment and soil, or a combination of generic and specific bioavailability corrections. Elements from the bioavailability correction on the exposure side (cf EU-RAR; Table 1) would then be transferred to the environmental quality standard. At present discussions are ongoing at EU level (Technical Meetings) on risk assessments for other metals, including alternative possibilities for taking into account the bioavailability of metals. The outcomes of these discussions will be reflected in the discussion document as they can be relevant for the final derivation of the zinc environmental quality standards as well. Policy-related aspects to be further discussed could include the pros and cons of applying one single (uncorrected) environmental quality standard for reasons of clarity etc. One could also focus on the argument stating that bioavailability correction ‘allows’ shifting the zinc load in the environment both on a temporal and spatial scale.
2. Aquatic compartment
This chapter is a copy of the fact sheet on zinc as discussed and agreed upon in the SQUA working group (March 2007). Section 2 contains the MPA/PNECadd values for surface water and sediment as
proposal for zinc ERLs (in bold).
General issues
The EU risk assessment on zinc and zinc compounds (EC Regulation 793/93), including all underlying data, is the sole basis for the currently proposed quality standards within the WFD framework. No additional literature searches were carried out. It should be additionally mentioned that the SCHER has not yet reviewed the EU zinc risk assessment. The SCHER will most probably release their opinion in spring 2007, which may then possibly affect the zinc risk assessment outcomes.
In the risk assessment on zinc and zinc compounds [1] a bioavailability correction is used for both surface water and sediment. These correction steps could also be used within the WFD framework. For surface water this correction is based on the use of Biotic Ligand Models (BLMs) and for sediment the role of Acid Volatile Sulphide (AVS) is incorporated. In the EU risk assessment [1] these correction steps were applied on the predicted environmental concentrations (PECs) rather than on the predicted no effect concentrations (PNECs). Under WFD a similar approach is prescribed, i.e. that a potential bioavailability correction for a metal should be applied on the monitoring results. The below derived ecosystem quality standards (EQS) therefore refer to ‘uncorrected’ values.
It is emphasised that the BLM correction only refers to the freshwater compartment, as the supporting BLMs are derived from ecotoxicity tests with freshwater organisms. For the comparison of monitoring data with the freshwater MAC-MPA (based on acute toxicity tests) strictly speaking no validated BLM approach is available from the EU risk assessment [1] as the BLM correction steps were derived from chronic BLM studies. Awaiting such validated ‘acute’ BLM approach, the chronic BLMs could pragmatically be used when comparing monitoring data with the MAC-MPA value. For the marine MPA no bioavailability correction of the corresponding PEC is currently available.
1
Identity of Substance
Name: Zinc CAS-Number: 7440-66-6 Classification WFD Priority List *: OSC
* PS: priority substance; PHS: priority hazardous substance; PSR: priority substance under review; OSC: other substance of concern
4
2 Proposed
Quality
Standards
2.1 Overall Quality Standards
Ecosystem Quality Standard Comment:
Inland Waters as well as transitional, coastal and territorial waters: AA-QS
Freshwater
7.8 (MPA/PNECadd) + 3 (Cb) = 10.8 µg/l (dissolved metal)
corresponding conc. in SPM for Rhine as example:
860 (MPA/PNECadd) + 140 (Cb) = 1020 mg/kg (dry wt)
Saltwater
3 (MPA/PNECadd) + 1 (Cb) = 4 µg/l (dissolved metal)
In the EU RA [1] the Cb is given as a range between 3 and 12 μg/l (total) for ‘standard’ EU waters. Based on Csusp of 15 mg/l this results in 1-4 μg/l (dissolved). For the Rhine a value of around 3 μg/l (dissolved) is considered most
appropriate.
Corresponding conc. in SPM is calculated with equilibrium partitioning method. Limitations of this approach are discussed in [1]. In [1] a PNECadd sed/susp of 49 mg/kgdw is selected based on experimental data. This yields a value of 49 + 140 (Cb) = 190 mg/kgdw
MAC-QS Freshwater
15.6 (MAC-MPA) + 3 (Cb) = 18.6 μg/l (dissolved metal)
Saltwater
No methodology in FHI guidance
If needed derived on basis of saltwater species
2.2 Specific Quality Standards
Protection Objective Quality Standard Comment:
Pelagic community
(freshwater & saltwater) See table 2.1 Benthic community
(freshwater & marine sediment)
190 mg/kgdw (freshwater)
Derivation of marine QS/MPA not possible (lack of data)
QS is based on MPA/PNECadd of
49 mg/kgdw plus background of 140 mg/kgdw
Predators (second. poisoning)
Not relevant for zinc
Food uptake by man Not relevant for zinc
Drinking water abstraction 3000 µg/l A-1 value in CD 75/440/EEC;
3 Classification
CAS No. Name R-Phrases and Labelling Reference
7440-66-6 zinc • F; R15-17, N; R50-53 S: (2-)43-46-60-61 (for zinc powder – zinc dust (pyrophoric))
• N; N; R50-53 S: 60-61 (for zinc powder – zinc dust (stabilised))
• zinc as massive metal (environment): Still under discussion (July 2006)
[1] Note: These classifications (except for the environmental classification for zinc as massive metal) were already agreed at the CMR group meeting of September 2002 and the environment meeting of June 2001, and are already included in the draft version of the 29th ATP of Annex 1 under 67/548/EEC.
4
Physical and Chemical Properties
Property Value Ref. Comments
Water Solubility Insoluble [1]
5
Environmental Fate and Partitioning
Property Value Ref. Comments
Partition coefficients Kp log Kp (sediment-water) log Kp (SPM-water) Kd Rhine values:
The median solids-water partition coefficients in suspended matter (Kpsusp) calculated with measured Rhine data over the period 1988-1992 in the Netherlands accounts to 84,000 l/kg..
On the basis of monitoring data the following Kpsusp values are available for Germany (UBA, 1994): Rhine (at Lobith, mean value period 1983-1986): 81,000 l/kg; Rhine (1988, vertical section: 91-863 km): 113,000 l/kg.
[1]
In the EU RAR [1] the overall used Kp values between water and suspended matter and between water and sediment were selected to be, respectively 110,000 (log Kpsusp=5.04) l/kg and 73,000 (log Kpsed=4.86) l/kg Bioaccumulation BCF fish: BCF molluscs: BCF crustaceans: BCF insects: Biomagnification:
Not relevant [1] See below.
Bioaccumulation and biomagnification
In the EU risk assessment report [1] it is concluded that secondary poisoning is considered to be not relevant for zinc. Major decision points for this conclusion are the following. The accumulation of zinc, an essential element, is regulated in animals of several taxonomic groups, for example in molluscs, crustaceans, fish and mammals. In mammals, one of the two target taxonomic groups for secondary poisoning, both the absorption of zinc from the diet and the excretion of zinc, are regulated. This allows mammals, within certain limits, to maintain their total body zinc level (whole body homeostasis) and to maintain physiologically required levels of zinc in their various tissues, both at low and high dietary zinc intakes. The results of field studies, in which relatively small differences were found in the zinc levels of small mammals from control and polluted sites, are in accordance with the homeostatic mechanism. These data indicate that the bioaccumulation potential of zinc in both herbivorous and carnivorous mammals will be low.
6
Based on the above data, secondary poisoning and the related issues bioaccumulation and biomagnification are not further discussed in the EU RAR [1].
6
Effect Data (aquatic environment
)Freshwater, acute
In [1] acute zinc toxicity data were used for classification and labelling purposes. Table 6.1 contains the data for algae, crustaceans and fish that met the quality criteria as defined in [1]. Most of the tests were conducted with either zinc chloride or zinc sulphate. The LC50 values range from 0.070 mg/l to 7,800 mg/l. Lowest LC50 values were found for crustaceans (0.070 mg/l). Higher LC50 values were mostly related to fish (less sensitive). Rejected studies, i.e. not used for classification and labelling of zinc, can be found in [1].
Saltwater, acute
In [1] the following text is included on acute toxicity to saltwater organisms:
The combined data reported by Mance (1987) and by the U.S. EPA (1987) show 24/96-h LC50 and EC50 values of 0.17 to 950 mg/l for invertebrates. Most of these values range from about 1 to 10 mg/l, but a number of these values is below 0.5 mg/l. Lower LC50 and EC50 values, 0.065 to 0.12 mg/l, have been reported for early life stages of invertebrates (Janus, 1993). Fish generally appear to be less sensitive than invertebrates. The combined data reported by Mance (1987) and by the U.S. EPA (1987) show acute LC50 and EC50 values of 0.19 to 83 mg/l for fish, the majority of the values ranging from 3 to 30 mg/l.
The acute saltwater data are not further elaborated and used in [1]. Marine LC50 and EC50-values seem to be within the same order of magnitude as freshwater data. Furthermore, also for the marine compartment invertebrates seem to be more sensitive than fish. Lowest value from marine dataset (65 μg/l) also equals lowest freshwater acute toxicity value of 68 μg/l.
Freshwater, chronic
Many data on chronic toxicity of zinc for freshwater algae, invertebrates and fish are reported in [1] (Annex 3.3.2.A). Data were checked on meeting the quality (Q) or relevance (R) criteria, as defined in [1], for deriving a PNEC surface water for EU waters. (Rejected studies are included in [1] as well). If for one species several chronic NOEC values (from different tests) based on the same toxicological endpoint are available, these values are averaged by calculating the geometric mean, resulting in the “species mean” NOEC. With respect to this it is noted that the NOEC values should be from equivalent tests, for example from tests with similar exposure times. The “species mean” NOEC values, based on studies that were used for PNEC derivation (freshwater PNECadd, aquatic), range from 17 to 660 µg/l (Table 6.2). In case there is only one test for a specific organism, the “species mean” NOEC simply is the NOEC (for the most sensitive endpoint), derived from that test. With respect to the aquatic toxicity data base, “species mean” NOEC values are used as input in the ecotoxicological extrapolation methods to derive PNECadd values in [1].
The NOEC values are based on nominal (added) concentrations (Cn), if possible. In a number of studies the NOEC values are based on the actual concentrations; for most of these data, especially for the tests performed in artificial test waters, it is known that the background zinc concentration in the test water was very low compared to the concentrations tested, thus the actual concentrations will have been very similar to the nominal (i.e. added) concentrations.
Below, somewhat more detailed data are given on the “species mean” NOEC values for freshwater algae, invertebrates and fish.
Algae
For freshwater unicellular algae there is only one “species mean” NOEC (17 µg/l, for
Pseudokirchneriella subcapitata, formerly known as Selenastrum capricornutum or Raphidocelis subcapitata). This value is the geometric mean value of 25 NOEC values from different tests
For freshwater multicellular algae there is also only one “species mean” NOEC (60 µg/l, for the filamentous alga Cladophora glomerata). This “species mean” NOEC is based on only one test result (single NOEC from one test; endpoint growth).
Invertebrates
The “species mean” NOEC values for freshwater invertebrates range from 37 µg/l for the water flea
Ceriodaphnia dubia (crustacean; geometric mean value of 13 NOEC values from different tests;
endpoint reproduction) to 400 µg/l for the zebra mussel Dreissena polymorpha (molluscs; single NOEC from one test; endpoint survival). The data on freshwater invertebrates include porifera, mollucs, crustaceans and insects. Most data on freshwater invertebrates are available for the water flea species Daphnia magna and Ceriodaphnia dubia (crustaceans).
Fish
The “species mean” NOEC values for freshwater fish range from 44 µg/l for the flagfish Jordanella
floridae (geometric mean value of 2 NOEC values from different tests; endpoint growth) to 660 µg/l
for the zebrafish Brachydanio rerio (geometric mean value of 9 NOEC values from different tests; reproductive endpoint hatching).
Saltwater, chronic
Data on chronic toxicity tests resulting in NOEC values for saltwater algae and invertebrates are presented in [1]. The “species mean” NOEC values range from 10 to 2700 µg/l (Table 6.2). Most values are based on nominal concentrations (Cn). Below, somewhat more detailed data are given on the “species mean” NOEC values for saltwater algae and invertebrates. Useful data for saltwater fish were not available.
Algae
The “species mean” NOEC values for saltwater algae (all but one tests: unicellular algae) range from 10 µg/l for Schroederella schroederi (single NOEC from one test) and Thalassiosira rotula (single NOEC from one test) to 2700 µg/l for Phaeodactylum tricornutum (geometric mean value of 3 NOEC values from different tests).
Invertebrates
The “species mean” NOEC values for saltwater invertebrates range from 10 µg/l for the echinoderm
Arbacia lixula (single NOEC from one test) to 1000 µg/l for the mollusc Scrobicularia plana (single
value from one test). The data on saltwater invertebrates include coelenterates, annelids, molluscs, crustaceans and echinoderms.
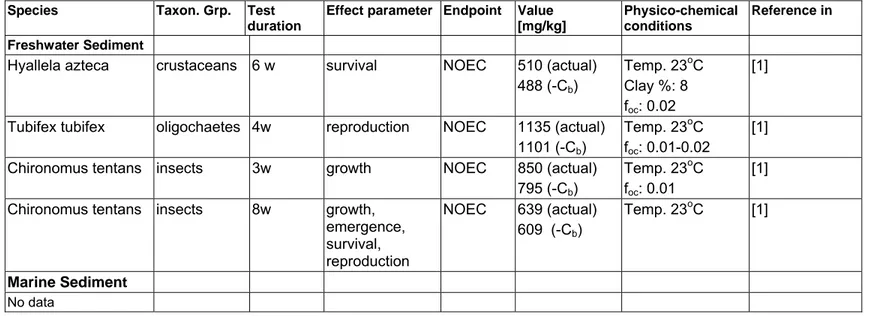
Sediment
Table 6.3 contains the four sediment studies with zinc that met the relevance and quality criteria in [1]. All other studies (rejected for PNEC derivation) can be found in [1].
8
Table 6.1. Acute zinc toxicity data for freshwater organisms from [1].
Species Test
type pH hardness exp. time Criterion value (mg/l) reference
Algae
Selenastrum capricornutum* S 7.5 24 72 h ErCg50 0.136 Van Ginneken, 1994a
Selenastrum capricornutum* S 7.4 24 72 h ErCg50 0.150 Van Woensel, 1994a
Crustacea
Daphnia magna F 6.95 130 48 h
96 h LC50 LC50 0.80 0.068 Attar & Maly, 1982
Daphnia magna S 7.7 45.3 48 h LC50 0.10 Biesinger & Christensen, 1972
Daphnia magna S s 7.55 45 48 h LC50 0.28 Cairns et al., 1978
Daphnia magna S s 8.5 180-200 48 h LC50 0.86 Magliette et al., 1995 Daphnia magna S s 7.2-7.4 45 48 h LC50 0.068 Mount & Norberg, 1984
Daphnia magna - 8.4 52 72 h LC50 0.14 Paulauskis & Winner, 1988
Daphnia magna - 8.3 102 72 h LC50 0.21 Paulauskis & Winner, 1988
Daphnia magna - 8.3 197 72 h LC50 0.34 Paulauskis & Winner, 1988
Daphnia magna S s 7.7 262 48 h EC50 0.15-0.5 Vos, 1994
Daphnia pulex S s 7.55 45 48 h LC50 0.50 Cairns et al., 1978
Daphnia pulex S s 7.2-7.4 45 48 h LC50 0.107 Mount & Norberg, 1984 Ceriodaphnia reticulata S 7.2-7.4 45 48 h LC50 0.076 Mount & Norberg, 1984
Ceriodaphnia dubia S 6-6.5 280-300 48 h LC50 > 0.530 Schubauer-Berigan et al., 1993 Ceriodaphnia dubia S 7-7.5 280-300 48 h LC50 0.360 Schubauer-Berigan et al., 1993 Ceriodaphnia dubia S 8-8.5 280-300 48 h LC50 0.095 Schubauer-Berigan et al., 1993
Pisces
Cyprinus carpio S 8.0 55 96 h LC50 7.8 WHO, 1996
Oncorhynchys kisutch, 0.47 g S 7.1-8.0 41 96 h LC50 0.82 Buhl & Hamilton, 1990 Oncorhynchys kisutch, 0.63 g S 7.1-8.0 41 96 h LC50 1.81 Buhl & Hamilton, 1990 Oncorhynchys kisutch, 0 94 g S 7.1-8.0 41 96 h LC50 1.65 Buhl & Hamilton, 1990 Oncorhynchus mykiss, 0.6 g S 7.1-8.0 41 96 h LC50 0.17 Buhl & Hamilton, 1990 Oncorhynchus mykiss, juvenile F 7.1 23 96 h LC50 0.136 WHO, 1996
Oncorhynchus mykiss, juvenile F 6.8 26 96 h LC50 0.43 WHO, 1996 Oncorhynchus mykiss 25-70 g, F 7.3 137 96 h LC50 2.6 WHO, 1996 Oncorhynchus mykiss,
160-290 g
F 7.1 143 96 h LC50 2.4 WHO, 1996
Pimephales promelas S 6-6.5 280-300 96 h LC50 0.780 Schubauer-Berigan & Dierkes, 1993
Species Test type pH hardness exp. time Criterion value (mg/l) reference
Pimephales promelas S 7-7.5 280-300 96 h LC50 0.330 Schubauer-Berigan & Dierkes, 1993
Pimephales promelas S 8-8.5 280-300 96 h LC50 0.500 Schubauer-Berigan & Dierkes, 1993
Pimephales promelas, 0.0 8 g F 7.8 220 96 h LC50 2.61 WHO, 1996
Thymallus arcticus, 0.20 g S 7.1-8.0 41 96 h LC50 0.14 Buhl & Hamilton, 1990 Thymallus arcticus, 0.85 g S 7.1-8.0 41 96 h LC50 0.17 Buhl & Hamilton, 1990 * currently known as Pseudokirchneriella sp.
g: growth (r= growth rate; b = biomass)
s: conducted according to standard test method, i.e EPA or OECD S: static test
F: flow through test
Table 6.2: Toxicity data (species mean values) for freshwater and saltwater organisms from [1] (n is number of studies species mean is based upon).
Species Taxon. Grp. Endpoint Value [μg/l] N
Freshwater
Pseudokirchneriella subcapitata algae NOEC 17 25
Cladophora glomerata algae (multicellular) NOEC 60 1
Ephydatia fluviatilis poriferans NOEC 43 1
Ephydatia muelleri poriferans NOEC 43 1
Spongilla lacustris poriferans NOEC 65 1
Eunapius fragilis poriferans NOEC 43 1
Dreissena polymorpha molluscs NOEC 400 1
Potamopyrgus jenkinsi molluscs NOEC 75 1
Ceriodapnia dubia crustaceans NOEC 37 13
Daphnia magna crustaceans NOEC 88 27
Hyalella azteca crustaceans NOEC 42 1
Chironomus tentans insects NOEC 137 1
Brachidanio rerio fish NOEC 660 9
Jordanella floridae fish NOEC 44 2
Oncorhynchus mykiss fish NOEC 189 15
10
Pimephales promelas fish NOEC 78 ?
Salvelinus fontinalis fish NOEC 530 ?
Saltwater
Amphidinium carteri algae NOEC 100 1
Asterionella japonica algae NOEC 15 7
Chaetoceros compressum algae NOEC 10 1
Gymnodinium splendens algae NOEC 500 1
Nitzchia closterium algae NOEC 20 2
Scrippsiella faeroense algae NOEC 100 1
Phaeodactylum tricornutum algae NOEC 2700 3
Prorocentrum micans algae NOEC 100 1
Rhizosolenia spp. algae NOEC 15 1
Schroederella schroederi algae NOEC 10 1
Skeletonema costatum algae NOEC 32 9
Thalassiosira pseudonana algae NOEC 140 2
Thalassiosira rotula algae NOEC 10 1
Thalassiosira guillardii algae NOEC 200 1
Laminaria hyperborea algae (multicellular) NOEC 100 1
Eirene viridula coelenterates NOEC 300 1
Capitella capitata annelids NOEC 320 1
Ctenodrilus serratus annelids NOEC 100 2
Nereis arenaceodentata annelids NOEC 100 1
Ophryotrocha diadema annelids NOEC 100 2
Crassostrea gigas molluscs NOEC 50 1
Haliotis refescens molluscs NOEC 19 1
Mercenaria mercenaria molluscs NOEC 50 1
Scrobicularia plana molluscs NOEC 1000 1
Callianassa australiensis crustaceans NOEC 440 1
Holmesimysis costata crustaceans NOEC 18 1
Mysidopsis bahia crustaceans NOEC 120 1
Table 6.3: Toxicity data for sediment dwelling organisms
Species Taxon. Grp. Test
duration
Effect parameter Endpoint Value [mg/kg]
Physico-chemical conditions
Reference in Freshwater Sediment
Hyallela azteca crustaceans 6 w survival NOEC 510 (actual) 488 (-Cb)
Temp. 23oC Clay %: 8 foc: 0.02
[1]
Tubifex tubifex oligochaetes 4w reproduction NOEC 1135 (actual) 1101 (-Cb)
Temp. 23oC foc: 0.01-0.02
[1]
Chironomus tentans insects 3w growth NOEC 850 (actual) 795 (-Cb)
Temp. 23oC
foc: 0.01
[1]
Chironomus tentans insects 8w growth, emergence, survival, reproduction NOEC 639 (actual) 609 (-Cb) Temp. 23oC [1] Marine Sediment No data
12
Summary on Endocrine Disrupting Potential
There are no indications that zinc has any endocrine disrupting potential.
7
Effect Data (human health)
Zinc is not classified for any of the human health endpoints (see section 3) and, additionally, the A1 value for drinking water from Council Directive 75/440/EEC is much higher than EQS values for other objectives of protection. Furthermore, bioconcentration of zinc in biota is not considered relevant. As none of the triggers for deriving an EQShh are met, this section on human health effect data is not further elaborated. Detailed information on human health effects of zinc can be found in [1].
8
Calculation of Quality Standards
8.1 Maximum Permissible Addition (MPA) for Water Derived by the TGD Assessment
Factor Method
Maximum Permissible Addition for Freshwater
Applying an assessment factor of 10 (more than three NOECS from various taxonomic groups available) on the lowest zinc species mean NOEC from Table 6.2 results in a MPA/PNECadd of 17/10 = 1.7 μg/l. The lowest species mean of 17 μg/l is based on algae Pseudokirchneriella
subcapitata (n = 25). It should be noted that a number of individual studies with this algae species
have lower NOEC values than 17 μg/l (around 5 μg/l). As is outlined below preference is given in [1] to use the MPA/PNECadd from the statistical extrapolation method for freshwater organisms.
Maximum Permissible Addition for Transitional, Coastal and Territorial Waters
Applying an assessment factor of 10 (more than three NOECs from various taxonomic groups available) on the lowest zinc species mean NOEC from Table 6.2 results in a MPA/PNECadd of 10/10 = 1 μg/l. The lowest species mean of 10 μg/l is based on three algae species and one echinoderm species. In contrast to freshwater the lowest species mean values for marine organisms are based on only one study result (n=1). As is outlined below preference is given to use the MPA/PNECadd from the statistical extrapolation method for marine organisms.
Maximum Permissible Addition for Transient Concentration Peaks (MAC-MPA)
Applying an assessment factor of 100 on the lowest LC50 value of 0.07 mg/l zinc for crustaceans (Table 6.1) results in an MAC-MPA of 0.7 μg/l. This value is below the MPA/PNECadd of 7.8 μg/l (see section below) making it less relevant. There may be reasons to deviate from the standard assessment factor of 100, e.g. the relatively low acute-to-chronic ratios for zinc (see below). This would result in a factor lower than 100. On the other hand the data set is limited to algae, crustaceans and fish, making a factor of 10 unrealistic. However, extrapolating from the chronic data set it may be concluded that the most sensitive taxonomic groups are included in the acute data set, i.e. algae and daphnids. (It should be emphasised that a factor of 10 would result in a MAC-MPA value of 7 μg/l, being almost equal to the MPA). For the MAC-MPA derivation of zinc preference is given to an ad hoc approach as described in section 8.1.1.
8.1.1 Maximum Permissible Addition Derived by Statistical Extrapolation MPA
Freshwater
A comparison of the database of freshwater “species mean” NOEC values (Table 6.2) with the TGD criteria on applying statistical extrapolation shows the following:
• The number of chronic zinc NOEC values (n = 18; “species mean” NOEC values) meets the general requirement for the number of input data (minimum requirement: 10 NOEC values, preferably more than 15 NOEC values).
• Chronic zinc NOEC values are available for 1 unicellular algal species, 1 multicellular algal species (macro alga), 4 sponge species, 2 mollusc species, 3 crustacean species, 1 insect species and 6 fish species. The database includes all 8 taxonomic groups (families) mentioned in the EPA list that has been taken as a starting point.
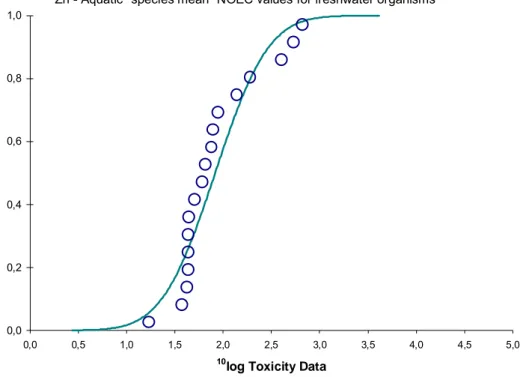
Based on the above, the use of statistical extrapolation is preferred for zinc for MPA/PNECadd derivation rather than the use of an assessment factor on the lowest NOEC. The 5th percentile value is set at the 50% confidence level, using a log-normal distribution function, which would result in a value of 15.6 µg/l for dissolved zinc in freshwater (lower 95% C.I. is 7.2 and higher 95% C.I. is 26.2). It is noted that the Anderson-Darling test indicates that there is only goodness-of-fit for the log-normal distribution at a low significance level (1%). The Kolmogorov-Smirnov test, however, accepts both the log-normal and log-logistic distribution at a higher significance level (5%). The species sensitivity distribution of zinc for freshwater organisms is shown in Figure 6.1.
Figure 6.1. Freshwater organisms: species sensitivity distribution based on “species mean” chronic NOEC values.
Based on uncertainty considerations the London workshop recommended to apply an assessment factor on the 50% confidence value of the 5th percentile value (thus PNEC = 5th percentile value/AF), with an AF between 5 and 1, to be judged on a case by case basis. Arguments for the use of a factor of 2 in case of zinc are provided extensively in [1] and this results in a MPA/PNECadd, aquatic of 15.6/2= 7.8 µg/l for dissolved zinc in freshwater. By adding the average Cb of 3 µg/l for EU lowland waters like the Rhine [1] the AA-QS becomes 10.8 µg/l.
Zn - Aquatic "species mean" NOEC values for freshwater organisms
0,0 0,2 0,4 0,6 0,8 1,0 0,0 0,5 1,0 1,5 2,0 2,5 3,0 3,5 4,0 4,5 5,0 10
log Toxicity Data
C u mu la ti ve d e n s it y
14
In addition to the ‘normal’ freshwater PNEC also a PNEC for soft water is derived in [1]. The soft water PNECadd amounts to 3.1 µg/l for dissolved zinc. It is emphasised that the soft water PNECadd only be applied only to waters with a low hardness, i.e. less than 24 mg/l (as CaCO3).
Saltwater
In [1] no PNEC saltwater is derived based on the available data. In addition, freshwater and saltwater were not merged for deriving the PNEC freshwater. The saltwater toxicity data that are included in [1] were not scrutinized to the extent the freshwater data have, and therefore were ‘only’ given in [1] for comparison with the freshwater data. Pragmatically, in [1] the freshwater PNEC was also used in some local risk assessments where emissions to the marine environment occurred.
As for freshwater the database on saltwater organisms also meets the criteria on number of species and taxonomic diversity allowing the use of statistical extrapolation (see Table 6.2). The species sensitivity distribution of zinc for saltwater organisms is shown in Figure 6.2. Based on the log-normal distribution a median 5th percentile value of 6.1 µg/l is calculated for dissolved zinc in saltwater (lower 95% C.I. is 2.6 and higher 95% C.I. is 11.6). Using either the Anderson-Darling Goodness-of-Fit test for normality (modified A^2) or the Kolmogorov-Smirnov test, a log-normal distribution is accepted at significance levels up to 10%, indicating that the probability that these data derive from a normal distribution is high (10%). Using the Kolmogorov-Smirnov test, a log-logistic distribution is rejected at a significance level of 1%, indicating that the probability that these data derive from a log-logistic distribution is very small (<1%).
Figure 6.2. Saltwater organisms: species sensitivity distribution based on “species mean” chronic NOEC values.
The saltwater data were not as intensively checked in [1] as were the freshwater data. Relevance criteria, e.g. meeting EU surface water abiotic conditions, will however be less relevant for saltwater data because the EU marine coast water (abiotic) environment is much more homogenous. It is therefore felt that an MPA for saltwater organisms can be derived within the WFD framework based on the available information. Chronic fish data are lacking in the marine data set. This is of course a shortcoming, but on the other hand acute toxicity for marine fish indicate that they have a rather low sensitivity to zinc compared to other species being sufficiently
Zn - "species mean" NO EC values for saltw ater organisms
0,0 0,2 0,4 0,6 0,8 1,0 -1,0 0,0 1,0 2,0 3,0 4,0 5,0 10
log Toxicity D ata
P o te nt ia ll y A ff ect e d F rac ti o n
covered in the marine data set. In addition, read across to the freshwater data set also points to a lower zinc sensitivity for fish compared to algae and invertebrates.
Based on the present information for chronic toxicity saltwater organisms tend to be slightly more sensitive than freshwater organisms. This is based on the following observations:
• A lower 5th percentile value from the species sensitivity distribution for saltwater, 6.1 versus 15.6 μg/l
• Lower species mean values for saltwater organisms, i.e. 10 μg/l (for four marine species) versus 17 μg/l (for one freshwater species). It should be emphasized here that the marine species mean values only rely on one test result (n=1), whereas the species mean for freshwater algae is composed of 25 test results, including values below 10 μg/l;
• Based on a statistical test (t-test) the 50th percentile values from both distributions differ significantly from each other, i.e. the saltwater 50th percentile being significantly lower than the freshwater value.
The median 5th percentile value of 6.1 µg/l is taken as a starting point for the saltwater MPA derivation. The following considerations should be taken into account when selecting on the use of an additional assessment factor. The impact on the height of the assessment factor is given by ↓ and ↑.
• The marine data set contains a large number (28) of species mean values from various taxonomic groups; ↓ AF
• Lack of marine fish data; ↑ AF
• Anderson-Darling Goodness-of-Fit test shows good statistical fit of marine 5th percentile value (better than freshwater data set); ↓ AF
• No individual data from the marine data set were found to be lower than the 5th percentile value of 6.1 μg/l. The lowest species mean NOEC values of 10 μg/l are even very close to the higher 95% C.I. limit value of 11.6 μg/l; ↓ AF
• Less underpinned reliability check on marine data compared to freshwater data set; ↑ AF • Field or meso/microcosm data are not available: ↑ AF
In conclusion an assessment factor of 2 is considered most appropriate for the derivation of the marine MPA, resulting in a value of 3 μg/l.
In [1] natural background concentrations of zinc are presented for marine environments. Reported values for the natural concentrations in coastal seas are 0.5 and 1 µg/l. Lower natural zinc levels are reported for open oceans (surface) with values of 0.001-0.06 µg/l. The dissolved background concentration for the Atlantic Ocean is reported to be 0.1±0.4 µg/l. The background concentration for the North Sea is estimated to be 1 µg/l. On average, natural background concentrations of zinc in marine waters tend to be lower than freshwater concentrations. A background value of 1 µg/l is used for the QS marine for zinc, resulting in an overall marine AA-QS value of 3 µg/l + 1 µg/l = 4 µg/l.
16
MAC-MPA
Freshwater
In contrast to the chronic data the set for acute toxicity does not meet the criteria for applying a species sensitivity distribution (number of taxonomic groups is too low: only one algae species, only cladocerans for invertebrates).
As the TGD assessment factor method does not result in a reliable MAC-MPA and the use of the SSD-method is not valid for the MAC-MPA, an alternative method is used that is based on acute-to-chronic toxicity ratios (ACR). This ratio could be used to extrapolate the MAC-MPA from the MPA. Table 6.4 indicates a number of ACRs based on (aggregated) data in [1]. ACRs were estimated in three different ways:
1. Species mean NOEC versus range LC50 values
A comparison is made between the aggregated chronic and acute data in [1]. For the chronic data species mean values are available, whereas for the acute data this was considered not allowable. For the latter the range of individual data is used, resulting in range for ACRs as well. For algae the ACR is between 8 and 9. For daphnids and fish a more or less similar range is found ranging from just below one to around ten. It is realized that this is not a valid ‘like-to-like’ comparison, but it provides (some) insight in ACR ratios.
2. Pairs within one study
From [1] those studies were selected in which both an acute and a chronic test was conducted with the same test species and under the same test conditions. Two studies were found meeting this criterion, both related to Daphnia magna. ACRs varied between 2 and 4. This pair wise approach is the most reliable way of estimating ACRs. Daphnids were additionally found to be the critical (sensitive) test species in both the acute and chronic data set.
3. Species sensitivity distributions (acute versus chronic)
In [1] a 5th percentile of 15.6 μg/l was calculated based on chronic freshwater data. Applying a species sensitivity distribution for the acute data would yield a median 5th percentile value of 45 μg/l. This value is based on all individual data from Table 6.1, except for the unbounded value of > 0.530 mg/l (Ceriodaphnia dubia) and the range value of 0.15-0.50 mg/l (Daphnia magna). In contrast to the chronic data no species means are calculated in [1] for the acute data. The goodness of fit of the distribution meets the TGD criteria (not shown). An ACR of 3 is calculated for the species sensitivity distributions. Limitations of this SSD comparison are the ‘illegal’ application of the SSD for the acute data set (see above) and the difference in input data (individual data versus species mean).
Table 6.4. Acute-to-chronic toxicity ratios for zinc data for freshwater organisms from [1].
Chronic (μg/l) Acute (μg/l) A-C ratio 1. Species mean NOEC versus range LC50s species mean (n) range (n)
Selenastrum capricornutum 17 (25) 136 – 150 (2) 8 – 9
Daphnia magna 88 (27) 70 – 860 (10) 0.8 – 10
Oncorhynchus mykiss 189 (15) 140 – 2600 (5) 0.7 – 14
2. Pairs within one study NOEC LC50
Daphnia magna (Biesinger and Christensen, 1972) 35 100 3 Daphnia magna (Paulauskis and Winner, 1988) 33 140 4 Daphnia magna (Paulauskis and Winner, 1988) 89 210 2 Daphnia magna (Paulauskis and Winner, 1988) 159 340 2 3. Species sensitivity distributions
5th percentile median estimate 15.6 44.9 3
Despite the various limitations as described above this analysis seems to indicate that ACRs for zinc are well below 10. Roex (2000) reports some additional zinc ACRs, ranging from 2.9 for the
cladoceran Moina macrocopa to more than 5,000 for guppy fish (the latter value is most probably erroneous).
As a pragmatic approach this information on ACRs can be used to extrapolate the ‘unknown’ MPA value (acute) from the well-founded MPA value (chronic). It is proposed to derive the MAC-MPA for zinc from the MAC-MPA applying a rather conservative A-C ratio of 2, resulting from the pair wise Daphnia magna comparison (supported by the Moina macrocopa value of 2.9). This results in a MAC-MPA value of 7.8 μg/l * 2 = 15.6 μg/l. The MAC-QS then becomes 15.6 (MAC-MPA) + 3 (Cb) = 18.6 μg/l.
8.2 Quality Standard for Sediment
Calculation of the MPAsediment
QSsediment based on equilibrium partitioning
Applying equilibrium partitioning the MPA/PNECadd for sediment is calculated as follows: 1. Ksusp-water : Fwatersusp + (Fsolidsusp x Kpsusp x RHOsolid) =
0.9 m3/m3 + (0.1 m3/m3 x 110 m3/kg x 2,500 kg/m3) =
0.9 m3/m3 + 27,500 m3/m3 =
27,501 m3/m3
2. PNECadd, sed = PNECadd, susp : (Ksusp-water / RHOsusp) x PNECadd, aquatic = (27,501 m3/m3 / 1,150 kg/m3) x 7.8 mg/m3 =
187 mg/kg wet sediment Where:
Ksusp-water = volumetric suspended matter / water partition coefficient (m3/m3) Fwatersusp = volume fraction water in suspended matter (m3/m3)
Fsolidsusp = volume fraction solids in suspended matter (m3/m3) Kpsusp = suspended matter / water partition coefficient (m3/kg) RHOsolid = density of the solid fraction (kg/m3)
PNECadd, sed = Predicted No Effect Concentration in sediment (mg/kg wet sediment)
PNECadd, susp = Predicted No Effect Concentration in suspended matter (mg/kg wet
suspended matter)
RHOsusp = bulk density of wet suspended matter (kg/m3) PNECadd, aquatic= Predicted No Effect Concentration in water (mg/m3)
The above MPA/PNECadd, sediment of 187 mg/kg wet sediment (22% solids by weight) is equivalent to a MPA/PNECadd, sediment of 860 mg/kg dry sediment.
The Cb for average EU sediments amounts to 140 mg/kg dwt, resulting in a QS of 140+ 860= 1020 mg/kg dry wt.
QSsediment based on toxicity data for sediment dwelling organisms
The EP method, in which the PNECadd. sediment has been estimated from the PNECadd, aquatic, results in a PNECadd, sediment of 860 mg/kg d.w., which is nearly 2-times higher than the lowest NOEC for benthic species (488 mg/kgdw; Table 6.3). This would support an assessment factor of <10 on the lowest NOEC for benthic organisms. It is emphasised, however, that the EP-method has limitations for the derivation of a reliable PNECadd, sediment, especially for metals, because of the uncertainties (assumptions) that are elaborated in [1].
The available benthic studies for zinc (Table 6.3) with Hyallela azteca, Chironimus tentans and
Tubifex tubifex represent three taxonomic groups of invertebrates with different living and feeding
conditions, thus according to the TGD an assessment factor of 10 should be used on the lowest chronic NOEC. Based on this and some other considerations in [1], an assessment factor of 10 is
18
applied on the study with H. azteca (488 mg/kg d.w, for added Zn; based on single-species laboratory studies), leading to a MPA/PNECadd, sediment of 49 mg/kg dry weight.
The Cb for average EU sediments amounts to 140 mg/kgdw, resulting in a QS of 140+ 49 = 190 mg/kgdw.
Conclusion
Based on all data, preference is given to the MPA/PNECadd, sediment (49 mg/kg dwt) and QS (190 mg/kgdw) based on the sediment toxicity data for freshwater benthic organisms.
As no data on marine sediments are available, no QS for marine benthic organisms can be derived. Pragmatically, in [1] the freshwater PNEC for sediment was also used in some local risk assessments where emissions to the marine environment occurred.
8.3 Secondary Poisoning of Top Predators
Not relevant, see section 5.
8.4 QS Referring to Food Uptake by Humans
Not relevant, see section 7.
8.5 QS for drinking water abstraction
The imperative A1 value for zinc referring to drinking water abstraction by simple treatment is 3000 µg/l (Council Directive 75/440/EEC). Council Directive 98/83/EC does not contain a standard for zinc.
Quality standards (or respective MPAs) required for the other objectives of protection are considerably lower and therefore the derivation of a quality standard addressing drinking water abstraction is not necessary.
8.6 Overall Quality Standard
Drinking water: 3000 µg/l
Inland Waters: 10.8 µg/l (dissolved metal)
9 References
[1] RAR Zinc and zinc compounds (EC Regulation 793/93). Draft version of June 2006.
[2] Roex, E. 2000. Acute versus chronic toxicity of organic chemicals to the zebrafish, Danio rerio. PhD Thesis Amsterdam, the Netherlands 2000.
3.
Terrestrial compartment
This chapter mainly is an excerpt from relevant sections of the EU-RAR on zinc and zinc compounds. Section 3.2 contains the MPA/PNECadd value for soil as proposal for the zinc ERL (in
bold).
3.1 Effect data for soil
For soil, a large number of toxicity data on terrestrial species (invertebrates and plants) as well as for micro-organisms are available in the EU-RAR on zinc and zinc compounds [1]. The toxicity data on invertebrates and plants are from single-species tests that study the common ecotoxicological parameters survival, growth and/or reproduction. The toxicity data on micro-organisms are from tests in which microbe-mediated soil processes, including C-mineralization and N-mineralization (the major, intertwined soil processes that are involved in the degradation of organic matter), were studied. The soil ecotoxicity studies are elaborately discussed in [1]. Some details are presented below.
Micro-organisms
The nominal NOEC values (Cn) for microbe-mediated processes, based on studies that were used for PNEC derivation, range from 17 to 2623 mg/kg dry weight (d.w.). These values are all from tests with soluble zinc salts and include a relatively large number of estimated NOEC values. The lowest NOEC (17 mg/kg d.w.) was derived from C-mineralization (respiration) tests in two different soils (Chang & Broadbent, 1984; Lighthart et al., 1983) and the highest NOEC (2623 mg/kg d.w) was derived from a test for phoshatase activity (Doelman & Haanstra, 1989). When comparing the data for the different major processes, the lowest NOEC values are similar: 17 mg/kg d.w. for C-mineralization (including C-C-mineralization of specific substrates), 38 mg/kg d.w. for N-mineralization and 30 mg/kg d.w. for enzyme activities. The highest NOEC values for these processes are also similar: 1400, 1000 and 2623 mg/kg d.w., respectively. Based on this, it is assumed that there is no significant difference in sensitivity between the different microbe-mediated processes.
Invertebrates
The nominal NOEC values (Cn) for invertebrate species, based on studies that were used for PNEC derivation, range from 32 mg/kg d.w. for the insect Folsomia candida to 1000 mg/kg d.w. for both F. candida and the earthworm Eisenia fetida. These values (of which both the lowest and highest NOEC value were from the study by Lock et al, 2003) are based on tests with soluble test compounds. The “species mean” NOEC values calculated from these data range from 280 mg/kg d.w. for the earthworm E. fetida (based on 25 NOEC values for this species) to 600 mg/kg d.w. for the earthworm Aporrectodea caliginosa (being the only NOEC value for this species).
Plants
The nominal NOEC values (Cn) for plant species, based on studies that were used for PNEC derivation, range from 32 mg/kg d.w. for two species (Trifolium pratense (red clover) and Vicia sativa (vetch)) to 400 mg/kg d.w. for four species (Lactuca sativa (lettuce), Avena sativa (oat),
Pisum sativum (Alaska pea) and Lycopersicon esculentum (tomato)). These values are based on
tests with soluble test compounds. The “species mean” NOEC values calculated from these data also range from 32 to 400 mg/kg d.w., with the lowest value for V. sativa and the highest value for
L. sativa, P.sativum and L. esculentum. It is noted that for each of these four species only one
NOEC value is available.
In addition to the laboratory studies a number of field studies are available for zinc.
In [1] it was concluded that normalization methods lack sufficient scientific validity to use for metals. However, based on the results of a recent, integrative research program, quantitative regressions are available to correct the PEC for abiotic parameters, i.e. to correct for bioavailability. A tiered approach is used in the EU risk assessment of zinc and zinc compounds in which both a lab-to-field correction (ageing aspects) and a soil properties correction should be applied on the PEC. The lab-to-field factor has a standard value of 3, whereas the factor for soil properties on average ranges between 1 (sandy soils) and 1.5 (river clay/peaty soils). See [1] for further details.
22
3.2
MPA/PNEC
addderivation
Separate PNECs for plants/invertebrates and micro-organisms
Both the tests on terrestrial species (plants and invertebrates) as well as the tests on microbe-mediated processes can be used to derive the PNEC for the terrestrial compartment. It is proposed to treat them separately in this calculation process, for the following reasons. Tests on microbe-mediated processes usually pertain to multiple-species tests, whereas the statistical extrapolation method in its original form pertains to species test results only. Separate use of the single-species data and the multiple-single-species microbial data is made because of the possible differences in sensitivity between species-specific parameters such as growth and reproduction (that are measured in single-species toxicity tests such as the invertebrate and plant tests) and functional parameters such as soil respiration (that are measured in multiple-species microbial toxicity tests). The multiple-species microbial tests focus on functions of the indigenous communities in substrates (soil or litter) from various origins rather than at sensitivities of species. Each multiple-species (function) test can be considered to yield a result as if it were a single-multiple-species test, namely they yield a single NOEC for each test. Each tested community is unique, like each species in the structure-based approach. So, a range of such tests yields a range of sensitivities of communities, especially regarding functions, that can be treated in statistical extrapolation methods to obtain a PNEC, that protects against functional loss across a range of ecosystems. Although not original, this concept is theoretically fully in line with the very basis of the extrapolation method, namely that the collection of tested sensitivities can be statistically treated as representative for a whole system, either structurally or functionally.
PNECadd derivation
The results of both the TGD assessment factor approach and the statistical extrapolation method are shown in Table 1 (microbe-mediated processes) and Table 2 (plants and invertebrates), and footnotes.
The use of an assessment factor of 10 according to the TGD results in a PNECadd, terrestrial of 1.7 mg/kg d.w. based on the lowest NOEC for microbe-mediated processes and 3.2 mg/kg d.w. based on the lowest NOEC for plant/invertebrate species. The use of statistical extrapolation results in median 5th percentile values (and “equivalent” values, see footnotes) ranging from 27 to 38 mg/kg d.w. and 31 to 52 mg/kg d.w., based on the individual NOEC values for microbe-mediated processes and species, respectively.
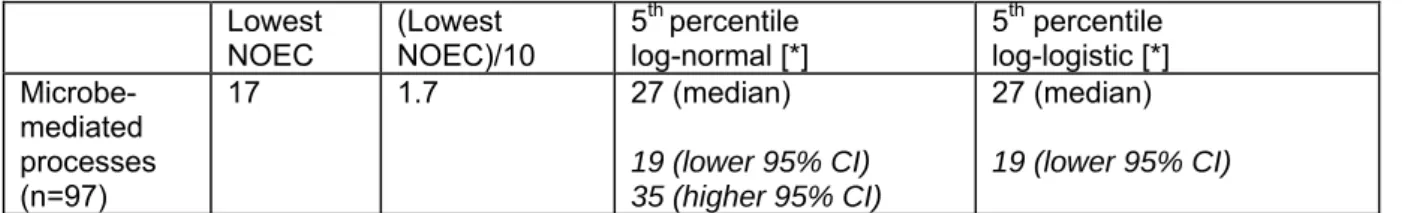
Table 1. Lowest NOEC and 5th percentile values of microbe-mediated processes for PNEC add, terrestrial derivation. All values in mg/kg d.w.
Lowest
NOEC (Lowest NOEC)/10 5
th percentile log-normal [*] 5 th percentile log-logistic [*] Microbe-mediated processes (n=97) 17 1.7 27 (median) 19 (lower 95% CI) 35 (higher 95% CI) 27 (median) 19 (lower 95% CI)
[*]: Using either the Anderson-Darling Goodness-of-Fit test for normality (modified A^2) or the Kolmogorov-Smirnov test, a log-normal distribution is rejected at a significance level of 1%, indicating that the probability that these data derive from a log-normal distribution is very small (<1%). Using the Kolmogorov-Smirnov test, a log-logistic distribution is also rejected at a significance level of 1%.
Results non-parametric 5th percentile value estimate: Referring to the overall and enlarged probability plots, we can interpolate at the cumulative density of 0.05 to find non-parametric estimates. For the NOEC values for microbe-mediated processes (97 data points), the cumulative density of 0.05 is very near the 5th data point, which is 30 mg/kg d.w. Linear interpolation for log-concentrations also yields a 5th percentile value of 30 mg/kg d.w.
Table 2. Lowest NOEC and 5th percentile values of plants and invertebrates for PNEC add, terrestrial derivation. All values in mg/kg d.w.
Lowest
NOEC (Lowest NOEC)/10 5
th percentile log-normal 5 th percentile log-logistic Invertebra-tes and plants (n=74, all individual values) [*] 32 3.2 52 (median) 39 (lower 95% CI) 65 (higher 95% CI) 52 (median) 37 (lower 95% CI) Invertebra-tes and plants (n=20, geometric mean values) [**] 32 3.2 58 (median) 34 (lower 95% CI) 84 (higher 95% CI) 57 (median) 32 (lower 95% CI)
[*]: Using either the Anderson-Darling Goodness-of-Fit test for normality (modified A^2) or the Kolmogorov-Smirnov test, a log-normal distribution is rejected at a significance level of 1%, indicating that the probability that these data derive from a normal distribution is very small (<1%). Using the Kolmogorov-Smirnov test, , a log-logistic distribution is also rejected at a significance level of 1%.
Results non-parametric 5th percentile value estimate: Referring to the overall and enlarged probability plots, we can interpolate at the cumulative density of 0.05 to find non-parametric estimates. For the individual NOEC values for plants and invertebrates (74 data point), the cumulative density of 0.05 is between the 3d and 4th data point, which are both 32 mg/kg d.w. Linear interpolation for log-concentrations also yields a 5th percentile value of
32 mg/kg d.w.
Results triangular distribution (included in ETX 1.3a): “Chronic value” is 32 mg/kg d.w.
[**]: Using either the Anderson-Darling Goodness-of-Fit test for normality (modified A^2) or the Kolmogorov-Smirnoff test, a log-normal distribution is accepted at significance levels up to 2.5% and rejected at a significance level of 5%, indicating that the probability that these data derive from a normal distribution is rather small (between 1% and 2.5%). Using the Kolmogorov-Smirnov test, a log-logistic distribution is accepted at significance levels of 1%-10%, indicating that the probability for a logistic distribution is considerably higher than that for a normal distribution.
Results non-parametric 5th percentile value estimate: Referring to the overall and enlarged probability plots, we
can interpolate at the cumulative density of 0.05 to find non-parametric estimates, but not very reliable for this small sample size, i.e. small with respect to the use of non-parametric extrapolation. For the “species mean” NOEC values for plants and invertebrates (20 data points), the cumulative density of 0.05 is at the 1th data point which is 32 mg/kg dw. Linear interpolation for log-concentrations also yields a 5th percentile value of 32 mg/kg dw. It must be noted that the non-parametric extrapolation method is under discussion for relatively small sample sets, because in such a case this method does not efficiently use the information on the entire ‘tail’ but heavily relies on only the few data points at the left tail (Van der Hoeven, 2001).
Results triangular distribution (included in ETX 1.3a): “Chronic value” is 31 mg/kg.
PNEC based on microbe-mediated processes
A comparison of the microbial database of NOEC values with the major TGD recommendations on statistical extrapolation shows that:
• The number of NOEC values (n = 97) meets the general requirement for the number of input data (minimum requirement: 10 NOEC values; preferably more than 15 NOEC values).
• NOEC values are available for the two major soil microbe-mediated soil processes, i.e. C-mineralization (respiration, including C-C-mineralization of specific substrates) and N-mineralization (including ammonification and nitrification), and for a number of enzyme activities. Data on microbe-mediated processes are considered to be more relevant than data on single microbial soil species, since soil-mediated processes (which are performed by a variety of microbial species) are important for soil functions such as the mineralization of litter. No recommendations are given by the TGD for the required diversity of microbial data (neither for microbe-mediated processes nor for microbial species), but based on the recommendations for the freshwater compartment to include at least 8 taxonomic groups (families), the microbial toxicity database is considered to be sufficiently large to meet the
24
“taxonomic” requirement (although based on these data, diversity in microbial species must be interpreted as diversity in microbe-mediated processes).
• It is noted that the goodness-of-fit for both a log-logistic and a log-normal distribution are rejected at a significance level of 1%. The use of these distributions results in the same median 5th percentile value and this value is close to the results of the non-parametric distribution and the triangular distribution, see Table 1 .
Based on the above, the use of statistical extrapolation is preferred for PNECadd derivation rather than the use of an assessment factor on the lowest NOEC. In accordance with the TGD the 5th percentile valueis set at the 50% confidence level, using a log-normal distribution function, which would result in a value of 27 mg/kg d.w.
Based on uncertainty considerations the TGD recommends to apply an assessment factor on the 50% confidence value of the 5th percentile value (thus PNECadd = median 5th percentile value/AF), with an AF between 1 and 5, to be judged on a case by case basis. Based on the available data, there are several reasons to use an assessment factor smaller than 5.
• There is a large microbial database, resulting in a relatively high reliability of the median 5th percentile value; this is also shown by the small difference between the 50% confidence level and the 95% confidence limits found for both the log-normal and log-logistic calculation. In both cases less than a factor of 2. This supports an AF smaller than 5.
• In most microbial tests the exposure time ranged from some weeks to some months and in a number of tests, e.g. for enzyme activities, the effect was measured 30 minutes after the addition of zinc, added as soluble zinc salt. This may overestimate the risk since the exposure time may have been too short for adaptation of the microbial communities and for reduced bioavailability. This also supports an AF smaller than 5.
• The microbial data origin from tests in a variety of soils, both EU soils and non-EU soil, covering the wide range of soil types and soils characteristics (pH value, clay content, organic matter content and background zinc concentration) that are normally found in European soils. This also supports an AF smaller than 5.
• Each tested community is unique, similar as each species in a structure-based approach. So, the range of tests yields a range of sensitivities of communities, especially regarding functions. The results from these tests can be treated in statistical extrapolation methods to obtain a PNEC that protects against functional loss across a range of ecosystems. This also supports an AF smaller than 5.
• The median 5th percentile value of 27 mg/kg d.w. may not be sufficiently protective, as a NOEC of 17 mg/kg d.w. was found in 2 of the 97 tests that were used for PNECadd derivation, i.e. the respiration test by Chang and Broadbent (1981) and one of the respiration tests by Ligthart et al. (1983), see Table 3.3.3..a in Annex 3.3.3.A. Since the median 5th percentile value is higher than all remaining 95 NOEC values, an AF smaller than 5 and slightly higher than 1 should be used.
• The use of the log-logistic and log-normal distribution results in the same median 5th percentile value and this value is close to the results of the non-parametric distribution and the triangular distribution, see Table 3.3.3.3-A. Based on this, there is no need for an assessment factor. • With respect to laboratory to field extrapolation there is no need for an assessment factor, see
sections 3.3.3.1.1 and 3.3.3.1.4. Actually: AF <1, but the lower toxicity in the field is taken into account in the lab-to-field factor that is applied to the PEC, see section 3.3.3.1.1.
In conclusion, the above procedure results in a median 5th percentile value of 27 mg/kg d.w. and justifies the use of an assessment factor of 1, based on the data for microbe-mediated processes. Arguments for the factor 1 are provided above and result in a PNECadd, terrestrial of 27 mg/kg d.w., that is sufficiently protective for most of the sensitive microbial species and processes and for the field situation.
PNEC based on invertebrates and plants
A comparison of the species database of NOEC values for invertebrates and plants, combined) with the major TGD recommendations on statistical extrapolation shows that:
• The number of chronic NOEC values (n = 74, for a total of 20 different species) meets the general requirement for the number of input data (minimum requirement: 10 NOEC values; preferably more than 15 NOEC values).
• Chronic NOEC values are available for 4 invertebrate species (3 earthworm species
(Oligochaetes) and 1 insect species (springtail Folsomia candida, Collembola)) and 16 plant
species. The invertebrates database is limited to 4 species of 2 families and does not include data on two other major taxa, namely Gastropoda (snails) and Crustacea (e.g. woodlice). However, snails and woodlice are living more on the soil than in the soil and are feeding especially on plants and litter/organic detritus, respectively. The plants database is considerably larger, including 16 species of 7 families. Furthermore, unbounded NOEC values (>500 mg/kg d.w.) are available for 2 plant species not included in the selected database. No recommendations are given by the TGD for the required diversity of terrestrial species, but based on the recommendations for the freshwater compartment to include at least 8 taxonomic groups (families), the combined invertebrates and plants database is considered to be sufficiently large to meet the “taxonomic” requirement (a total of 9 families is represented in the combined invertebrates and plants database).
• Furthermore, the species data for plants are from tests in a variety of soils, covering a considerable part of the wide range of soil types and soils characteristics (pH value, clay content, organic matter content and background zinc concentration) that are normally found in European soils (although most plant studies were performed in non-EU soils). A relatively large number of the tests with invertebrates were not conducted in natural soils but in artificial (OECD) soils. However, the characteristics of the artificial soils were within the ranges of those found in EU soils.
• It is noted that there is no goodness-of-fit for both the log-normal and the log-logistic distribution at a significance level of 1% (based on the distributions for the individual NOEC values). The use of these distributions results in the same median 5th percentile value; this value is 1.6-times higher than the results of the non-parametric extrapolation and the triangular distribution, see Table 2.
Based on the above, the use of statistical extrapolation is also preferred for PNECadd derivation when using the combined invertebrates and plants dataset. Combined with the earlier mentioned preference for the use of the individual NOEC values this would result in a 5th percentile value of 52 mg/kg d.w., when set at the 50% confidence value of the log-normal distribution.
Based on uncertainty considerations the TGD recommends to apply an assessment factor on the 50% confidence value of the 5th percentile value (thus PNEC = median 5th percentile value/AF), with an AF between 1 and 5, to be judged on a case by case basis. Based on the available data, there are several reasons to use an assessment factor larger than 1 and smaller than 5.
• The limited number of data for invertebrates, being a very large and important taxonomic group, would support an AF greater than 1.
• The fact that in the plant studies reproduction was not included as toxicological endpoint, with the exception of the study with Avena sativa (oat) in which grain yield was studied, would also support an AF greater than 1.
• It is noted that there is no goodness-of-fit for both the log-normal and the log-logistic distribution at a significance level of 1% (based on the distributions for the individual NOEC values). The use of these distributions results in a median 5th percentile value that is 1.6-times higher than the results of the non-parametric extrapolation and the triangular distribution. This supports an AF greater than 1.
• The median 5th percentile value of 52 mg/kg d.w. may not be sufficiently protective, as a lower NOEC was found in 7 of the 74 tests that were used for PNECadd derivation, i.e. a NOEC of 32 mg/kg d.w. in one of the tests with invertebrate Folsomia candida (Lock et al., 2003), a NOEC of 32 mg/kg d.w. in four of the tests with plant Trifolium pratense (Van den Hoeven and
26
Henzen, 1994b,c; Hooftman and Henzen, 1996), a NOEC of 32 mg/kg d.w. in the test with plant Vicia sativa and one of the tests with plant Hordeum vulgare (Luo and Rimmer, 1995), see Annex 3.3.3.A in [1]. Since the median 5th percentile value is lower than all remaining 67 NOEC values , an AF smaller than 5 and higher than 1 should be used.
• With respect to laboratory to field extrapolation there is no need for an assessment factor, see [1] for details. Actually: AF <1, but the lower toxicity in the field is taken into account in the lab-to-field factor that is applied to the PEC.
In conclusion, the above procedure results in a median 5th percentile value of 52 mg/kg d.w. and justifies the use of an assessment factor of 2, based on the data for species. Arguments for the factor 2 are provided above and result in a PNECadd, terrestrial of 26 mg/kg d.w. that is sufficiently protective for the most sensitive species and for the field situation.
Overall conclusion on PNECadd, terrestrial
In conclusion, the above procedures results in a PNECadd, terrestrial of 26 mg/kg dry soil, derived
from the median 5th percentile value (52 mg/kg d.w.) for species and applying an assessment factor of 2. This PNECadd, terrestrial is just below (but nearly equal to) the value derived from the data for microbe-mediated processes (27 mg/kg d.w, being the median 5th percentile value; assessment factor of 1) and therefore selected as PNECadd, terrestrial.
For comparison, using all terrestrial NOEC values (n = 171) i.e. those for microbe-mediated processes (n = 97) and those for invertebrates and plants (n = 74) combined in one data set, this would result in a median 5th percentile value of 35 mg/kg d.w.
In wet soil containing 60% solids (density 2,500 kg/m3), 20% water and 20% air by volume, i.e. 88% solids by weight, the above PNECadd, terrestrial of 26 mg/kg dry soil is equivalent to a PNECadd, terrestrial of 23 mg/kg wet soil.
The PNECadd is equal to an MPA, and analogous to water and sediment a “QS” for soil comprises both this MPA and the natural background concentration of zinc in a specific soil(type) (QS=MPA+Cb). In [1] ranges are presented for natural background zinc concentrations in various soils.
![Table 6.2: Toxicity data (species mean values) for freshwater and saltwater organisms from [1] (n is number of studies species mean is based upon)](https://thumb-eu.123doks.com/thumbv2/5doknet/3067433.9067/13.1263.87.1024.85.245/table-toxicity-species-freshwater-saltwater-organisms-studies-species.webp)

![Table 6.4. Acute-to-chronic toxicity ratios for zinc data for freshwater organisms from [1]](https://thumb-eu.123doks.com/thumbv2/5doknet/3067433.9067/20.892.89.778.803.1098/table-acute-chronic-toxicity-ratios-zinc-freshwater-organisms.webp)