Sexually
trans mitted
infections
including HIV,
in the Netherlands
in 2014
Sexually transmitted
infections, including HIV,
in the Netherlands in 2014
A.A.M. van Oeffelen1 F. van Aar1
I.V.F. van den Broek1 E.L.M. Op de Coul1 P.J. Woestenberg1 J.C.M. Heijne1 C. den Daas1 S.H.I. Hofstraat1 A.I. van Sighem2 M.M.J. Nielen3 B.H.B. van Benthem1
Department: STI department, Epidemiology and Surveillance Unit, Centre for Infectious Disease Control
Institute: 1. National Institute for Public Health and the Environment (RIVM) 2. Stichting HIV Monitoring
3. Netherlands Institute for Health Services Research (NIVEL) Contact: Louise van Oeffelen, Epidemiology and Surveillance Unit,
Colophon
RIVM report number: 2015-0041 Report prepared by:
Centre for Infectious Disease Control, National Institute for Public Health and the Environment In collaboration with:
Sexual Health Centres
Stichting HIV Monitoring and HIV treatment centres OSIRIS
A publication by the
National Institute for Public Health and the Environment P.O. Box 1
3720 BA Bilthoven The Netherlands www.rivm.nl/en All rights reserved © 2015 RIVM-CIb-EPI
Publiekssamenvatting
Seksueel overdraagbare aandoeningen, waaronder hiv, in Nederland in 2014
Het aantal mensen dat zich bij een Centrum Seksuele Gezondheid (CSG) heeft laten testen op een seksueel overdraagbare aandoening (soa) blijft stijgen. Het percentage bij wie een soa wordt aangetroffen neemt eveneens toe, tot 15,5 procent in 2014. De stijgende lijn is ook te zien bij huisartsen, waar nog steeds de meeste soa-consulten worden verricht. Net als in voorgaande jaren is chlamydia de meest voorkomende soa.De CSG bieden hoog-risicogroepen de mogelijkheid om zich gratis te laten testen op soa’s. Daarnaast verstrekken zij medicatie als een soa wordt aangetroffen. In totaal waren er in 2014 141.191 consulten bij de CSG, een stijging van 6 procent ten opzichte van 2013. De meeste soa’s zijn geconstateerd bij personen die voor een soa waren gewaarschuwd door een (voormalige) partner en bij hiv-positieve mannen die seks hebben met mannen (MSM).
Chlamydia
In 2014 had 12,6 procent van de CSG-bezoekers een chlamydia-infectie (17.753 diagnoses); een stijging van 0,8 procent ten opzichte van 2013. De grootste toename was te zien bij heteroseksu-ele mannen (van 12,8 procent in 2013 naar 13,9 procent in 2014). Chlamydia wordt nog steeds het meest aangetroffen bij vrouwen en bij heteroseksuele mannen onder de 25 jaar (15,6 procent had chlamydia). Bij MSM blijft het percentage chlamydia al jaren stabiel, rond de 10 procent. Gonorroe
Sinds 2012 is het percentage CSG-bezoekers met gonorroe stabiel. Het bedroeg 3,6 procent in 2014 met in totaal 4.594 diagnoses. Gonorroe komt ruim vier keer zo vaak voor bij MSM als bij vrouwen en heteroseksuele mannen. In diverse Europese landen is gonorroe waargenomen die resistent is tegen de voorgeschreven antibiotica. In Nederland is deze resistentie nog niet aangetroffen. Het blijft van belang dit nauwkeurig in de gaten te houden.
Syfilis
Syfilis werd bij de CSG vooral vastgesteld bij MSM (93 procent van de 742 syfilis-diagnoses in 2014). Het percentage MSM met een syfilis-infectie steeg van 2,0 procent in 2013 naar 2,3 procent in 2014. De stijging was het grootst bij hiv-positieve MSM: van 5,8 procent in 2013 naar 6,6 procent in 2014. Van alle MSM met syfilis wist 41 procent dat ze hiv hadden.
Hiv
Het aantal nieuwe hiv-diagnoses bij de CSG is in 2014 met 9 procent gedaald (323 versus 358 in 2013), waarvan bijna 90 procent werd aangetroffen bij MSM. Het percentage nieuwe hiv-diagno-ses bij MSM daalde van 3,0 procent in 2008 naar 1,1 procent in 2014. Het aantal nieuwe hiv-diag-noses daalde ook bij de Nederlandse hiv-behandelcentra (van 1.311 in 2008 naar 992 in 2013).
Kernwoorden: soa, MSM, chlamydia, gonorroe, hiv, antibioticaresistentie, jongeren, monitoring, centrum seksuele gezondheid.
Synopsis
Sexually transmitted infections, including HIV, in the Netherlands in 2014
The number of people who got tested for a sexually transmitted infection (STI) at a Dutch STI clinic increased further in 2014. In addition, the percentage of consultations resulting in an STI diagnosis increased slightly to 15.5 per cent in 2014. General practitioners, who carry out the majority of STI consultations in the Netherlands, report a similar upward trend. As in previous years, chlamydia was the most frequently diagnosed STI.STI clinics offer free STI testing to high-risk groups and provide care and treatment if an STI is diagnosed. The total number of STI clinic consultations in 2014 was 141,191, an increase of 6 per cent compared to 2013. In 2014, STI clinic attendees who were diagnosed with an STI were mainly people who had been warned of possible STI exposure by their (former) partner, and known HIV-positive men who have sex with men (MSM).
Chlamydia
In 2014, 12.6 per cent of STI clinic attendees had a chlamydia infection (17,753 diagnoses). This figure represents an increase of 0.8 percentage points compared to 2013. The greatest increase was observed in heterosexual men (from 12.8 per cent in 2013 to 13.9 per cent in 2014). Chlamydia was primarily diagnosed in women and in heterosexual men below 25 years of age (15.6 per cent diagnosed with chlamydia). The percentage of MSM diagnosed with chlamydia has remained stable for years at around 10 per cent.
Gonorrhoea
The percentage of STI clinic attendees with a gonorrhoea infection has remained stable since 2012, and amounted to 3.6 per cent in 2014 with a total of 4,594 diagnoses. Gonorrhoea is over four times more common in MSM than in women and heterosexual men. Increased resistance to the antibiotics prescribed to treat gonorrhoea infections has been observed in several European countries, but not yet in the Netherlands. It remains important to closely monitor antibiotic resistance.
Syphilis
Syphilis was mainly diagnosed among MSM, who accounted for 93 per cent of the 742 cases diagnosed at STI clinics in 2014. The percentage of MSM with a syphilis infection increased from 2.0 per cent in 2013 to 2.3 per cent in 2014. The greatest rise was observed in known HIV-positive MSM: from 5.8 per cent in 2013 to 6.6 per cent in 2014. Of all MSM with syphilis, 41 per cent were known HIV-positives.
HIV
In 2014, the number of people newly diagnosed with HIV at STI clinics decreased by 9 per cent (from 358 cases in 2013 to 323 in 2014). MSM accounted for nearly 90 per cent of this group. The percentage of new HIV diagnoses in MSM decreased from 3.0 per cent in 2008 to 1.1 per cent in 2014. The number of new HIV diagnoses at Dutch HIV treatment centres also declined (from 1,311 in 2008 to 992 in 2013).
Keywords: STI, MSM, chlamydia, gonorrhoea, HIV, resistance, young people, monitoring, STI clinic
Preface
This annual report provides an overview of the epidemiology of sexually transmitted infecti-ons (STI), including HIV, in the Netherlands in 2014. The data presented are derived from the national STI surveillance database and other sources registering STI and HIV in the Netherlands, such as general practices, the antenatal screening programme and HIV treatment centres, and from notifications. For every STI, a summary of recent trends (‘key points’) is presented, followed by tabulations and figures relating to STI analysed in relation to a range of relevant characteristics. Finally, an overview of the major conclusions and a set of recommendations are given.
We hope that this report will contribute to further awareness of the distribution and causes of STI, including HIV, in the Netherlands, resulting in the development and targeting of (preven-tative) interventions, and enabling an assessment of the effectiveness of control activities on STI transmission. The information aims to support policy makers and researchers in the field of STI and related subjects, as well as others interested in STI trends in the Netherlands. More information on STI and HIV trends in the Netherlands is available at www.soahiv.nl and www.hiv-monitoring.nl. This report can also be downloaded in PDF format from www.soahiv.nl.
Acknowledgements
We gratefully acknowledge the cooperation of a large number of physicians, public health doctors and nurses, microbiologists, epidemiologists, dermatologists, behavioural scientists, prevention workers and other professionals working in the field of STI and HIV. We would like to thank the following organizations for their continuing collaboration in collecting data: the STI clinics (STI clinics and Public Health Services), Stichting HIV Monitoring (SHM) and GGD Nederland. We also thank SOA AIDS Nederland, Rutgers WPF, HIV Vereniging, the Netherlands Institute for Health Services Research (NIVEL), general practices participating in the NIVEL Primary Care Database, the Dutch Working Group on Clinical Virology and the other units at the Centre for Infectious Disease Control – the Laboratory for Infectious Disease and Screening (CIb/IDS) and the Preparedness and Response Unit (CIb/LCI) – for their support. Furthermore, we would like to thank Petra Oomen for the data on pregnant women (Praeventis),
Joke Korevaar, Gé Donker and Rodrigo Davids for NIVEL Primary Care Database (PCD) data and analysis, Paul van Beek and Anouk Urbanus for the data on participants in the HBV vaccination programme and Alies van Lier and Scott McDonald for their help with the Burden of Disease calculation. Also, Daan Notermans, Audrey King (all CIb/IDS) and Silke David (CIb/LCI) are thanked for their contributions.
Comments
Contents
Samenvatting 13 Summary 17 Introduction 21
1 Methodology of STI and HIV surveillance 23
1.1 National surveillance at STI clinics 23
1.2 Sense 25
1.3 STI surveillance in general practice 25
1.4 Laboratory surveillance 27
1.5 Antimicrobial resistance of gonococci 27
1.6 Congenital syphilis 27
1.7 Antenatal screening 28
1.8 National registration of patients registered at HIV treatment centres 28
1.9 HIV incidence data 29
1.10 Notification of hepatitis B and C 29
1.11 Hepatitis B vaccination programme for risk groups 29
1.12 Blood donors 30
1.13 Burden of Disease 30
2 STI and Sense consultations 33
2.1 Key points 33
2.2 Consultations and characteristics of STI clinic attendees 35
2.3 Repeated testing at the STI clinic 46
2.4 Trends in STI clinic consultations 48
2.4.1 Trends in specific risk groups 48
2.4.2 Partner notification trends 52
2.5 General practice 53
2.6 Sense 56
3 Chlamydia, including lymphogranuloma venereum 61
3.1 Key points 61
3.2 STI clinics: characteristics, risk groups and trends 62
3.3 General practice 70
3.4 Laboratory surveillance 71
4 Gonorrhoea 75
4.1 Key points 75
4.2 STI clinics: characteristics, risk groups and trends 76
4.3 General practice 85
4.4 Antimicrobial resistance of gonococci in the Netherlands 86
5 Syphilis 89
5.1 Key points 89
5.2 STI clinics: characteristics, risk groups and trends 90
5.3 Antenatal screening 96
5.4 Blood donors 97
5.5 Congenital syphilis 98
6 HIV and AIDS 101
6.1 Key points 101
6.2 STI clinics: characteristics, risk groups and trends 102
6.3 HIV treatment centres 107
6.3.1 Newly diagnosed HIV cases in care in 2014 107
6.3.2 AIDS cases and deaths among HIV patients 115
6.4 Other sources 120
6.4.1 Antenatal screening 120
6.4.2 Blood donors 121
6.4.3 HIV incidence in MSM and IDU in the Amsterdam Cohort Studies 122
6.4.4 General practice 123
7 Genital warts 125
7.1 Key points 125
7.2 STI clinics: characteristics, risk groups and trends 126
7.3 General practice 132
8 Genital herpes 133
8.1 Key points 133
8.2 STI clinics: characteristics, risk groups and trends 134
8.3 General practice 140
9 Hepatitis B 143
9.1 Key points 143
9.2 Notification data: characteristics, risk groups and trends 144
9.3 Infectious hepatitis B diagnoses at the STI clinics 146
9.4 Antenatal screening 151
9.5 Blood donors 152
10 Hepatitis C 155
10.1 Key points 155
10.2 Notification data: characteristics, risk groups and trends 156
10.3 Blood donors 156
11 Burden of Disease 159
11.1 Key points 159
11.2 Burden of Disease: Disability Adjusted Life Years 160
12 General conclusions and recommendations 165
Appendices
Appendix A List of abbreviations 172
Appendix B National Surveillance of STI clinics 173
Appendix C Stichting HIV monitoring 175
Appendix D NIVEL Primary Care Database (NIVEL-PCD) 183
Samenvatting
In 2014 werden in totaal 141.191 soa-consulten uitgevoerd bij de Centra Seksuele Gezondheid (CSG), een stijging van 6 procent ten opzichte van 2013. Ook het percentage personen met een positieve soa-test (chlamydia, gonorroe, infectieuze syfilis, hepatitis B of hiv) nam toe, van 14,7 procent in 2013 naar 15,5 procent in 2014. De CSG zijn bedoeld voor hoogrisicogroepen die in de reguliere zorg niet voldoende bereikt worden. Om deze groepen te bereiken passen de CSG een landelijk afgestemd triagesysteem toe. De hoogrisicogroepen - waaronder mannen die seks hebben met mannen (MSM) (21 procent van de bezoekers in 2014), personen afkomstig uit soa/hiv-endemische gebieden (24 procent van de bezoekers in 2014) en jongeren tot 25 jaar (49 procent van de bezoekers in 2014) - worden gratis getest.
Huisartsendata laten zien dat het totaal aantal soa-gerelateerde episodes die bij de huisarts worden geregistreerd (gebaseerd op een selectie van huisartspraktijken en geëxtrapoleerd naar de Nederlandse populatie) groter is dan het aantal bij de CSG, met naar schatting 290.000 soa-gerelateerde episodes (soa-infecties en ‘angst voor soa/hiv’) in 2013 (data van 2014 zijn nog niet beschikbaar). Ook dit aantal is toegenomen tussen 2012 en 2013. De huisarts bereikt sommige hoogrisicogroepen goed, zoals jongeren onder de 25 jaar, maar andere hoogrisico-groepen, zoals MSM en sekswerkers, naar verhouding minder goed.
Bacteriële soa
In 2014 was chlamydia opnieuw de meest gediagnosticeerde bacteriële soa bij de CSG met 17.753 gerapporteerde gevallen. Het percentage positieve testen steeg van 11,8 procent in 2013 naar 12,6 procent in 2014. De hoogste percentages positieve testen werden gezien onder vrouwen en heteroseksuele mannen (respectievelijk 12,9 en 13,9 procent). De meerderheid van de chlamydia-infecties werd bij jongeren onder de 25 jaar gediagnosticeerd (59 procent).
Lymphogranuloma venereum (LGV), een agressieve variant van anale chlamydia die met name bij hiv-geinfecteerde MSM voorkomt, wordt sinds de eerste diagnose in 2004 nog steeds regel-matig gevonden. In 2014 was er een lichte toename in het percentage LGV-positieven onder de geteste MSM met anorectale chlamydia: 7,4 procent versus 6,7 procent in 2013. Het geschatte aantal chlamydia-episodes bij de huisarts is in 2013 onder vrouwen licht gedaald (22.400 versus 24.100 in 2012); bij mannen was juist een lichte stijging te zien (15.800 versus 14.400 in 2012).
Gonorroe was na chlamydia de meest gediagnosticeerde bacteriële soa bij de CSG. In 2014 werden 4.594 gonorroe diagnoses gesteld, waarvan 61,9 procent bij MSM, 22,6 procent bij vrouwen en 15,5 procent bij heteroseksuele mannen. Tussen 2008 en 2012 was er een toename te zien in het percentage positieve gonorroetesten bij de CSG. Sinds 2012 is dit percentage stabiel gebleven, tussen de 3,4 en 3,6 procent. Gonorroe werd vooral gediagnosticeerd bij MSM: 9,5 procent testte positief (9,3 procent in 2013), vergeleken met 1,9 procent van de heteroseksuele mannen (1,7 procent in 2013) en 1,8 procent van de vrouwen (1,8 procent in 2013). Ook komt gonorroe vaak voor bij sekswerkers (4,3 procent). Het geschatte aantal gonorroe-episodes bij de huisarts is tussen 2009 en 2013 sterk toegenomen, zowel bij vrouwen als bij mannen (van in totaal 4.900 in 2009 naar 8.300 in 2013). Tot nu toe is er in Nederland
nog geen resistentie gerapporteerd voor ceftriaxone, de huidige eerste keus-cefalosporine voor de behandeling van gonorroe. Monitoring van antibioticaresistentie bij gonorroe blijft van belang, zeker gezien de gerapporteerde resistentie tegen derde generatie-cefalosporines in Europa.
Na stabilisering van het percentage positieve testen voor infectieuze syfilis bij de CSG tussen 2011 en 2013 (2,0 procent), steeg het percentage in 2014 licht naar 2,3 procent. Deze stijging was het grootst bij hiv-positieve MSM: van 5,8 procent in 2013 naar 6,6 procent in 2014. In totaal werden er in 2014 742 infectieuze syfilis diagnoses gesteld, waarvan 93 procent bij MSM. Van alle MSM met syfilis was 41 procent bekend hiv-positief.
Virale soa, inclusief hiv
In 2014 werden bij de CSG 323 nieuwe hiv-diagnoses gesteld, waarvan 86 procent bij MSM. Het percentage positieve hiv-testen bij MSM neemt nog steeds af: van 3,0 procent in 2008 naar 1,1 procent in 2014. Bij heteroseksuele mannen en vrouwen bleef dit percentage lager dan 0,1 procent. Bij 24 procent van de nieuw gediagnosticeerde hiv-positieve MSM die de CSG bezochten werd bij hetzelfde consult ook een chlamydia-infectie gevonden, bij 20 procent een gonorroe-infectie en bij 7 procent een syfilis-infectie.
In 2014 werden 1.076 nieuwe aanmeldingen van hiv-positieve personen in zorg gerapporteerd in de nationale hiv-registratie bij de Stichting HIV Monitoring (een afname van 9 procent vergeleken met 2013), waarvan er 719 ook gediagnosticeerd waren in 2014. Van alle nieuw geregistreerde hiv-patiënten was 68 procent MSM en 25 procent heteroseksueel. Eind 2014 waren in totaal 22.948 personen met hiv in Nederland geregistreerd in zorg. Hiv-positieve MSM geregistreerd in zorg werden meestal gediagnosticeerd bij één van de CSG (42 procent), terwijl dit bij hiv-positieve vrouwen en heteroseksuele mannen het vaakst in een ziekenhuis werd gedaan (respectievelijk 47 en 52 procent). Het aandeel personen met hiv dat laat in zorg kwam (<350 CD4 cellen/mm3) is tussen 2012 en 2014 gedaald bij vrouwen en MSM (tot respec-tievelijk 52 en 29 procent in 2014), maar gestegen bij heteroseksuele mannen (tot 78 procent in 2014). Het totale aantal aids-diagnoses is de laatste jaren gedaald van 358 in 2005 naar 216 in 2013. In 2014 waren dit er tot nu toe 134 (nog onvolledig door rapportagevertraging). Het aantal diagnoses van genitale wratten en genitale herpes bij de CSG nam in 2014 af naar respectievelijk 2.029 en 479 (dit was 2.057 en 612 in 2013). Hierbij moet worden opgemerkt dat onderzoek naar genitale wratten en genitale herpes alleen op indicatie gebeurt, waardoor het aantal diagnoses niet vergelijkbaar is met die van bacteriële soa en hiv, waarop routinematig getest wordt. Het merendeel van de diagnoses voor genitale wratten en genitale herpes wordt gesteld bij de huisarts: hier waren 36.500 geschatte diagnoses voor genitale wratten en 22.400 geschatte diagnoses voor genitale herpes in 2013 (een stijging van respectievelijk 36 en 38 procent ten opzichte van 2009).
Het aantal gerapporteerde acute hepatitis B-gevallen in de aangiftecijfers nam met 13 procent af van 144 in 2013 naar 126 in 2014; het aantal gerapporteerde acute hepatitis C-gevallen nam in deze periode met 20 procent af van 62 naar 50.
Concluderend, het aantal soa-consulten neemt nog steeds toe. Na stabilisatie van het percen-tage CSG-bezoekers met een soa in 2013, is er in 2014 weer een stijging te zien. Dit is voorna-melijk toe te schrijven aan het toegenomen percentage bezoekers met een chlamydia-infectie. De meeste soa worden bij de huisarts gediagnosticeerd en het aantal diagnoses neemt ook hier toe (vooral door de stijging in het aantal gonorroe-, genitale wratten- en genitale herpes-diagnoses). Een intensieve soa-surveillance blijft essentieel om zicht te houden op opkomende soa, uitbraken en trends. De bestrijding zou daarnaast ondersteund kunnen worden door: het verder faciliteren van toegankelijke soa-zorg (bijvoorbeeld E-health); het verbeteren van tijdige waarschuwing voor mogelijke soa-uitbraken in het nationale soa-surveillancesysteem; gerichte interventies tot het verminderen van stigma rondom soa en hiv; het opsporen van ongediagnosticeerde hiv-infecties; het inzichtelijk maken van lange termijngevolgen van chlamydia; het systematisch kweken van de gonorroe die wordt gevonden bij hoogrisicogroe-pen om overdracht van resistente stammen te voorkomen; het integreren van soa-screening met hiv-zorg; en het voorbereiden op de mogelijke invoering van Pre-Exposure Prophylaxis (PrEP).
Summary
In 2014, 141,191 STI consultations were performed at Dutch STI clinics, an increase of 6 per cent over 2013. The percentage of people testing positive for STI (chlamydia, gonorrhoea, infectious syphilis, hepatitis B or HIV) also increased, from 14.7 per cent in 2013 to 15.5 per cent in 2014. The STI clinics target high-risk groups by patient selection based on a standardized list of criteria. High-risk groups, such as men having sex with men (MSM) (21 per cent of all attendees in 2014), people originating from STI/HIV-endemic areas (24 per cent of all attendees in 2014), and people under 25 years of age (49 per cent of all attendees in 2014) are tested free of charge. Data from general practices show that the total number of STI-related episodes at general practices (based on a selection of general practices in the Netherlands and extrapolation to the total Dutch population) is much larger than the numbers reported at STI clinics, with an estimation of 290,000 STI-related episodes (STI infections and ‘fear of STI/HIV’) in 2013 (data from 2014 are not available yet). This number also increased between 2012 and 2013. General practices reach certain high-risk groups quite well, like people under 25 years of age, but other high-risk groups, like MSM and commercial sex workers (CSW), are reached better by STI clinics. Besides data from the STI clinics and general practices, data from facilities providing regular care, such as HIV treatment centres and other surveillance sources, are also reported. Bacterial STI
With 17,753 reported cases, chlamydia remained the most commonly diagnosed bacterial STI at STI clinics in 2014. The overall positivity rate increased from 11.8 per cent in 2013 to 12.6 per cent in 2014. The highest positivity rates were found in women and heterosexual men (12.9 per cent and 13.9 per cent, respectively). The majority of chlamydia cases were diagnosed in people younger than 25 years of age (59 per cent). Lymphogranuloma venereum (LGV), an aggressive strain of anal chlamydia mainly present in HIV-infected MSM, has been found frequently since the first LGV case in 2004. In 2014, there was a slight increase in the percentage of LGV positives among MSM with anorectal chlamydia: 7.4 per cent versus 6.7 per cent in 2013. In general practices, a slight decline in estimated chlamydia episodes was reported in women (24,100 in 2012 versus 22,400 in 2013); in men there was a slight increase (14,400 in 2012 versus 15,800 in 2013).
Gonorrhoea was the second most common bacterial STI identified at STI clinics. In 2014, 4,594 gonorrhoea cases were reported, 61.9 per cent in MSM, 22.6 per cent in women and 15.5 per cent in heterosexual men. After an increase in positive gonorrhoea tests between 2008 and 2012 at STI clinics, this percentage has remained stable since 2012, between 3.4 and 3.6 per cent. Gonorrhoea was most prevalent among MSM: 9.5 per cent tested positive (9.3 per cent in 2013), compared with 1.9 per cent of the heterosexual men (1.7 per cent in 2013) and 1.8 per cent of the women (1.8 per cent in 2013). Gonorrhoea was also frequently diagnosed in CSW (4.3 per cent). The estimated number of gonorrhoea episodes at general practices increased markedly between 2009 and 2013, in both men and women (from 4,900 in 2009 to 8,300 in 2013). Monitoring antimicrobial resistance in gonorrhoea remains important, especially given the reports of resistance to third-generation cephalosporins in Europe. So far, no resistance to ceftriaxone,
the first-choice cephalosporin to treat gonorrhoea, has been found in the Netherlands.
After a stabilization of positive infectious syphilis tests at STI clinics between 2011 and 2013 (2.0 per cent), this percentage increased slightly, to 2.3 per cent, in 2014. The greatest increase was seen among HIV-positive MSM: from 5.8 per cent in 2013 to 6.6 per cent in 2014. A total of 742 infectious syphilis cases were diagnosed in 2014, 93 per cent of them in MSM. Of all MSM with syphilis, 41 per cent were also known HIV-positive.
Viral STI, including HIV
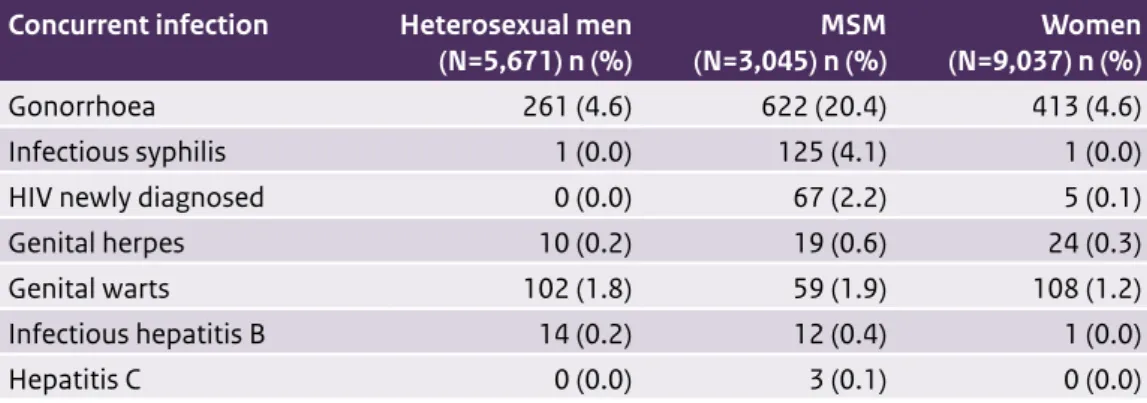
At the STI clinics, 323 HIV infections were diagnosed in 2014, of which 86 per cent were MSM. The HIV positivity rate among MSM continued to decrease: from 3.0 per cent in 2008 to 1.1 per cent in 2014. The positivity rate in heterosexual men and women remained lower than 0.1 per cent. Of the newly diagnosed HIV-positive MSM consulting the STI clinics, 24 per cent were co-infected with chlamydia, 20 per cent with gonorrhoea and 7 per cent with syphilis. In 2014, 1,076 HIV-infected people in care were newly registered in the national database of the HIV treatment centres (SHM) (a decline of 9 per cent compared with 2013); 719 of them were diagnosed in 2014. The proportion of MSM among the newly registered was 68 per cent; 25 per cent were heterosexuals. At the end of 2014, a cumulative total of 22,948 HIV patients had been registered in care in the Netherlands. Whereas HIV-positive MSM in care were most often diagnosed at STI clinics (42 per cent), HIV-positive women and HIV-positive heterosexual men were most often diagnosed in hospitals (47 and 52 per cent, respectively). The proportion of patients diagnosed late (<350 CD4 cell counts/mm3) decreased between 2012 and 2014 in women and MSM (to 52 and 29 per cent in 2014, respectively), but increased in heterosexual men (to 78 per cent in 2014). The number of AIDS diagnoses declined from 358 in 2005 to 216 in 2013. In 2014, there were 134 cases so far (incomplete due to reporting delay).
The number of genital warts and genital herpes diagnoses at STI clinics decreased in 2014 to 2,029 and 479, respectively (from 2,057 and 612 in 2013). These two STIs are tested on indica-tion only, so the number of diagnoses is not comparable with those of bacterial STI and HIV (routinely screened). The majority of genital warts and genital herpes cases are diagnosed at general practices: in 2013, there were 36,500 diagnoses of genital warts and 22,400 diagnoses of genital herpes estimated (an increase of 36 and 38 per cent since 2009, respectively). The number of cases of acute hepatitis B in the notification data decreased by 13 per cent, from 144 in 2013 to 126 in 2014; the number of reported cases of acute hepatitis C declined in this period by 20 per cent, from 62 to 50.
In conclusion, the number of STI consultations shows an increasing trend. Among consultati-ons at STI clinics, the percentage of clients with a positive STI test, which had stabilized in 2013, rose again in 2014. This increase is mainly accountable to an increase in the percentage of people with a chlamydia infection. The majority of STIs are diagnosed at general practices and this number is also increasing (mainly accountable to a rise in gonorrhoea, genital warts and genital herpes diagnoses). Strong STI surveillance remains essential to monitor emerging STIs and relevant trends. STI control could be supported by: further facilitating access to STI care (e.g. E-health); improving the efficiency of the national surveillance system for earlier warning
sequelae of chlamydia infection; systematically culturing gonorrhoea diagnosed in high-risk groups to prevent the transmission of drug-resistant strains; integrating STI screening into HIV care; and preparing for the possible implementation of Pre-Exposure Prophylaxis (PrEP).
Introduction
This report describes current trends in the epidemiology of STIs, including HIV, in the Netherlands. It was prepared by the Centre for Infectious Disease Control (CIb) at the National Institute for Public Health and the Environment (RIVM). The CIb collaborates with various partners in the field of STI to collect data for surveillance and to generate insights into trends and determi-nants: the STI clinics, the Stichting HIV Monitoring (SHM), public health laboratories, general practices participating in the NIVEL-PCD and other health care providers.
The data systematically collected among high-risk groups by the nationwide network of STI clinics, under the responsibility of the Public Health Services, are the backbone of the Dutch STI surveillance on STI trends and risk factors. Other STI data – from general practices, surveys, screening programmes, national registries, cohort studies and other surveillance systems – are included where possible. Together they provide an overview of the current state of STI, including HIV, in the Netherlands. Preliminary data were presented in the Thermometer Seksuele
Gezondheid (April 2015). Outline of the report
Section 1 describes the methodology of each data source used for STI surveillance in the Netherlands. In Section 2, the characteristics of the STI clinic attendees and data from sexual health consultations among young people (Sense) in 2014 are presented, along with data from general practices for 2009-2013 and trends in specific risk groups between 2004 and 2014. Sections 3-5 present data on bacterial STI (chlamydia, gonorrhoea and syphilis) and Sections 6-10 focus on viral STI (HIV, genital warts, genital herpes and hepatitis B and C). Section 11 shows the Burden of Disease for STIs since 2007. Conclusions and recommendations are given in Section 12.
1
Methodology of STI and
HIV surveillance
The tables and figures in this report are based on a variety of data sources in order to present an up-to-date overview of the sexually transmitted infections (STI)/human immunodeficiency virus (HIV) situation in the Netherlands. The foundation of this overview is the systematic surveillance of high-risk groups carried out by the nationwide system of STI clinics. Data from general practices, who perform the bulk of STI consultations, are extrapolated from the Netherlands Institute for Health Services Research (NIVEL) Primary Care Database (NIVEL-PCD). We have also included data from the HIV treatment clinics (Stichting HIV Monitoring (SHM)) to gain insights into trends among HIV patients in care. Other data sources include Sense, weekly virological laboratory reports, the Gonococcal Resistance to Antimicrobials Surveillance programme (GRAS), antenatal screening, data on hepatitis B and C notifications, the hepatitis B vaccination programme for risk groups and the blood donor registry.
1.1 National surveillance at STI clinics
Since 1995, STI diagnoses in the Netherlands have been registered in an STI database at the National Institute for Public Health and the Environment (Rijksinstituut voor Volksgezondheid en Milieu, RIVM). In 2003, an STI sentinel surveillance system was put in place and this
achieved national coverage with the inclusion of all STI clinics in 2004. Since 2006, reporting to the national STI surveillance system has been organized into eight regions. One of the STI clinics in each region is responsible for the coordination of STI surveillance (Figure 1.1). In total, 26 STI clinics, mostly within the Public Health Services’ Centres for Sexual Health, provide low-threshold STI/HIV testing and care, which is free of charge and targeted at high-risk groups. People meeting any of the following criteria are considered to be at high risk of STI acquisition: (1) reporting STI-related symptoms, (2) notified or referred for STI testing, (3) aged below 25 years, (4) MSM, (5) involved in commercial sex, (6) originating from an HIV/STI-endemic area, (7) reporting three or more sexual partners in the previous six months, (8) reporting a partner from one of these risk groups. Since 2012, people who do not meet any of the risk criteria, but want to be tested anonymously, have no longer been eligible for STI testing at an STI clinic. Attendees are routinely tested for chlamydia, gonorrhoea and syphilis and there is an opt-out policy for HIV testing. Since 2012, attendees below the age of 25 years who do not meet any of the other high-risk criteria have been tested initially for chlamydia only. If the chlamydia test result is positive, further testing for gonorrhoea, syphilis and HIV will take place. These changes in testing policy in 2012 may have caused a break in trend data for this group. This needs to be taken into account when interpreting trends. Hepatitis B (HBV) and hepatitis C (HCV), genital warts, genital herpes, trichomonas and Lymphogranuloma
Figure 1.1 The eight regions, with their coordinating STI clinics indicated
Regio Noord - GGD Groningen
Regio Noord-Holland en Flevoland - GGD Amsterdam Regio Noordelijk Zuid-Holland - GGD Den Haag, Dienst OCW Regio Zuidelijk Zuid-Holland - GGD Rotterdam-Rijnmond Regio Zeeland Brabant - GGD Hart voor Brabant
Regio Utrecht - GG & GD Utrecht
Regio Oost - GGD Nijmegen Regio Limburg, GGD Zuid Limburg
2011, ethnicity is based on the country of birth of the client and client’s parents. The 2011-2014 data can therefore not be directly compared with those of previous years.
All consultations and corresponding diagnoses are reported online to the RIVM for surveillance purposes, a process that is facilitated by a web-based application (SOAP). The unit of analysis is ‘new STI consultation’ and anonymized reports contain epidemiological, behavioural, clinical and microbiological data on a wide range of STI. In 2014, an identification number was added to the data collection, which allows the identification of clients who test repeatedly. However, since the scheme underwent an implementation phase in the first six months of 2014, the data that include these identification numbers are incomplete for 2014. We discuss the number of repeated testers and STI positivity by number of consultations in Section 2. Since the data with the identification numbers are incomplete for 2014, the number of repeated testers indicated may be an underestimation.
In this report, data from the national surveillance of STI clinics are presented with respect to the number and nature of new consultations and diagnoses. Trends in positivity rates by risk profile (based on demographic and behavioural indicators) are based on data from the STI clinics under national surveillance from 2004 to 2014. Where data were not complete for a specific period or STI clinic, this is indicated. We focus on the major bacterial and viral STI, including HIV infection.
1.2 Sense
To strengthen primary prevention and to promote sexual health among young adults (<25 years), a nationwide network of consultation centres (Sense) was established, under the coordination of the same Public Health Services (PHSs) that coordinate the STI clinics. Young adults can anonymously address themselves to these Sense locations for information and personal consultations on a broad range of subjects relating to sexual health, including (problems with) sexual intercourse, unwanted pregnancy, birth control, STI, homosexuality or sexual violence. Data on the number and the demographics of Sense visitors are presented. In 2014, demo-graphic information and the subject of Sense consultations were added to the national STI/HIV database.
1.3 STI surveillance in general practice
Data on the incidence of STIs in general practice are obtained through the primary care surveil-lance network maintained at NIVEL, based on electronic patient registers in a network of general practices, the NIVEL-PCD (NIVEL Zorgregistraties eerste lijn).1,2 The network uses routinely recorded data from health care providers to monitor health and the utilization of health services in a representative sample of the Dutch population. All complaints and illnes-1 See website: https://www.nivel.nl/NZR/zorgregistraties-eerstelijn.
2 Verheij, R.A. Over NIVEL Zorgregistraties; geschiedenis en achtergrond. In: NIVEL Zorgregistraties eerste lijn [internet]. 2013 [updated 11-11-2014; accessed 09-04-2015]. URL: www.nivel.nl/node/3464
ses are recorded using the International Classification of Primary Care (ICPC-1). Since 2010, the network of general practices has gradually expanded from 120 to over 400 practices. Data on the incidence of STI episodes in the population covered by this network from 2009 to 2013 are included in this annual report. This is restricted to data from practices with good quality morbidity data, which numbered 69 in 2009, 103 in 2010, 191 in 2011, 312 in 2012 and 356 in 2013. From these data, incidence figures were calculated using an adjusted (improved) proce-dure based on the number of reported episodes per 1,000 patient-years.3 Annual estimates of the total number of episodes seen at general practices in the Netherlands were made by extrapolating the incidence rates in these practices to the total number of Dutch residents, obtained from Statistics Netherlands (CBS), and are reported by gender.
For syphilis and HIV, the number of cases reported was too small for reliable estimates of the incidence at general practices. For HIV we report prevalence data based on estimates from the NIVEL-PCD. HIV is defined as a ‘chronic, non-reversible morbidity’, which remains prevalent as long as the patient is registered in the network.
For chlamydia, which does not have a main ICPC code, we looked at ‘chlamydia-related’ ICPC codes, which include the codes for vaginitis (X84), cervicitis (X85) and Pelvic Inflammatory Disease (PID) (X74) in women, and for orchitis/epididymitis (Y74) and other genital diseases (Y99) in men.4 For each code we calculated the proportion of:
• ICPC-specific subcodes for chlamydia (subcodes are not consistently registered by all general practices and are not required to fulfil quality criteria).
• ICPC main codes with an appropriate chlamydia-related prescription, i.e. azithromycin or doxycycline, combined with an ICPC code for chlamydia-related diseases, urethritis or penile discharge in the prescription database, among practices with good quality morbidity and prescription data (from 67 to 340 practices in 2009-2013). This is different from previous years, when we included six different prescriptions.
• Laboratory results, i.e. a positive outcome of a chlamydia test, also restricted to a selection of practices with sufficient laboratory reports (from 26 to 140 practices in 2009-2013). The sum of these proportions was used to estimate the number of chlamydia episodes within each of the five ICPC main codes.
More detailed data on STI consultations at general practices are also reported. These derive from a subgroup of practices within the NIVEL-PCD, who participate in a more intensive data collection programme for surveillance (NIVEL peilstations). Since 2008, the 45 general practi-ces participating in this specific sentinel network have completed a questionnaire for new consultations concerning STI/HIV issues. The information recorded includes background details on patient characteristics with reference to ethnicity, sexual preference and sexual
3 Nielen M.M.J., Spronk I., Davids R., Zwaanswijk M., Verheij R.A., Korevaar J.C. Verantwoording incidentie en prevalentie cijfers van gezondheidsproblemen in de Nederlandse huisartsenpraktijk in 2013. In: NIVEL
Zorgregistraties eerste lijn [internet]. 2013 [updated 17-12-2014; accessed 09-04-2015]. URL: www.nivel.nl/node/3619 4 van den Broek I.V.F., Verheij R.A., van Dijk C.E., Koedijk F.D.H., van der Sande M.A.B., van Bergen J.E.A.M. Trends in
behaviour, the STI testing carried out and the diagnosis made.5 We report the main results regarding patient profiles, testing rates and positivity, as well as trends from 2008 to 2013.
1.4 Laboratory surveillance
The only national laboratory surveillance data available for STI are those from the weekly virological reports, which include the total number of Chlamydia trachomatis positive tests. Data from 20 laboratories (covering an estimated 40 per cent of the virology laboratories in the Netherlands) consistently reporting since 2000 were analysed.6 There is overlap between the laboratories reporting in this system and the laboratories connected to the STI clinics.
1.5 Antimicrobial resistance of gonococci
Concern that there was increasing resistance to quinolones at (inter)national level led to an RIVM laboratory survey of the resistance of gonococci in 2002. The results indicated a need for systematic nationwide surveillance of gonococcal antimicrobial resistance, and the Gonococcal Resistance to Antimicrobials Surveillance (GRAS) was implemented in the Netherlands in 2006. This surveillance consists of the systematic collection of data on gonorrhoea and resistance patterns, linked with epidemiological data. Almost 80 per cent of the STI clinics participate. The diagnosis of gonorrhoea is made by culture or PCR on patients’ materials. Susceptibility testing of the isolates is performed by E-tests for penicillin, tetracycline, ciprofloxacin and cefotaxime; in 2011, ceftriaxone, azithromycin and spectinomycin were added to the panel and testing for penicillin and tetracycline became optional. In 2014, testing for spectinomycin was also made optional. Resistance levels are calculated using the EUCAST breakpoints for resistance.7
1.6 Congenital syphilis
The RIVM-IDS (Centre for Infectious Diseases Research, Diagnostics and Screening) offers Immunoglobulin M (IgM) diagnostics for neonates and young infants (<1 year) who may have been exposed to syphilis. In this report, the results from 1997–2014 are presented.
5 Trienekens S.C., van den Broek I.V., Donker G.A., van Bergen J.E., van der Sande M.A. Consultations for sexually transmitted infections in the general practice in the Netherlands: an opportunity to improve STI/HIV testing. BMJ Open. 2013 Dec 30;3(12):e003687. doi: 10.1136/bmjopen-2013-003687.
6 Virologische weekstaten, http://www.rivm.nl/Onderwerpen/Onderwerpen/S/Surveillance_van_infectieziekten/ Virologische_weekstaten, [accessed 29-3-2015].
7 European Committee on Antimicrobial Susceptibility Testing (EUCAST). Breakpoint tables for interpretation of MICs and zone diameters. Version 3.1, 2013. Växjö: EUCAST; 2013. Available from: http://www.eucast.org/fileadmin/src/ media/PDFs/EUCAST_files/Breakpoint_tables/Breakpoint_table_v_3.1.pdf [accessed 2-9-2014].
1.7 Antenatal screening
Each year, around 185,000 pregnant women are screened for syphilis, HBV and HIV in the Netherlands. The blood sample is collected during the first midwife appointment (<13th week of the pregnancy) according to the opting-out principle, whereby pregnant women undergo the test, after being provided with information, unless they explicitly state that they do not wish to be tested. Almost all pregnant women in the Netherlands participate in this infectious diseases screening programme.8,9 The screening programme is coordinated by the Centre for Population Screening (CvB) at the RIVM.
1.8 National registration of patients registered at HIV treatment centres
In January 2002, an anonymous HIV/AIDS reporting system for patients entering care was implemented in the Netherlands. Longitudinal data of all newly registered HIV-infected individuals are collected by SHM (www.hiv-monitoring.nl). The goal of SHM is to monitor HIV-infected individuals registered in the 27 recognized HIV treatment centres and four children’s centres in the Netherlands in order to study changes in the epidemic, the natural history of HIV and the effects of treatment.
All HIV-infected individuals registered in this cohort are followed from the time of reporting in care. HIV-infected individuals in care who were diagnosed before the start of SHM have been included in the cohort retrospectively. HIV cases diagnosed before 1996 include only people who survived up to the start of the AIDS Therapy Evaluation in the Netherlands (ATHENA) clinical cohort in 1996. The epidemiological data on newly reported HIV infections, as well as trends in new AIDS diagnoses since 2000, are reported in collaboration with the CIb at the RIVM. Between 1987 and 2002, AIDS cases were reported on a voluntary basis to the Inspectorate of Health (National AIDS Registry, IGZ). With the start of the SHM monitoring system in 2002 the National AIDS Registry was ended. In this report, AIDS cases from 1999 or earlier are obtained from the National AIDS Registry. From 2000, AIDS cases recorded through the SHM monitoring system are used. Data on deaths among HIV/AIDS patients from 2002 onwards are obtained through the SHM; before 2002 from National Statistics Netherlands (www.cbs.nl).
8 van der Ploeg C.P.B. (TNO), Schonbeck Y. (TNO), Hirschberg H. (RIVM). Procesmonitor PSIE 2013. Belangrijkste resultaten Prenatale Screening Infectieziekten en Erytrocytenimmunisatie (PSIE). TNO/RIVM 2015.
1.9 HIV incidence data
HIV incidence data are obtained from the Amsterdam Cohort Studies (ACS) on HIV/AIDS, which started in 1984 with men who have sex with men (MSM) and were expanded in 1985 to include drug users (DU). The original aims were to investigate the epidemiology, psychosocial determi-nants, natural history and pathogenesis of HIV-1 infection and AIDS, as well as to evaluate the effect of interventions in HIV-negative and HIV-positive men and women. In the past decade, the focus has broadened to include the epidemiology and natural history of blood-borne infections and STIs other than HIV. In recent years, this research has been extended to include prospective testing for STI and human papillomavirus infection.
From the outset, research in the ACS has taken a multidisciplinary approach. The collaborating institutes within the ACS framework are the Sanquin Blood Supply Foundation, the Public Health Service of Amsterdam (PHS Amsterdam; GGD Amsterdam), the Academic Medical Centre of the University of Amsterdam, the University Medical Centre Utrecht, the Jan van Goyen Medical Centre, the HIV Focus centre (DC clinics) in Amsterdam, and Stichting HIV Monitoring (SHM). The ACS infrastructure is financed primarily through a contribution from the RIVM; each participating institute also makes a financial contribution. The scientific studies are funded separately by external bodies.
1.10 Notification of hepatitis B and C
The obligatory notification includes epidemiological data on newly diagnosed acute HBV infections (since 1976), chronic HBV infections and acute HCV infections (both since April 1999). Since 2002, all PHS have notified HBV and HCV infections by using the web-based application OSIRIS.
1.11 Hepatitis B vaccination programme for risk groups
Being a low-endemic country, the Netherlands adopted a vaccination programme targeted at behavioural high-risk groups. The programme offers free vaccination to MSM and commercial sex workers (CSW). Heterosexuals with an STI indication were also considered a risk group until October 2007, and drug users until January 2012. PHS and STI clinics offer free vaccination according to the six-month schedule. Participants are tested serologically for markers of a previous or current HBV infection during their consultation for a first vaccination. Data are collected from a registration system especially developed for the vaccination programme. Although universal childhood vaccination was adopted in 2011, the current targeted risk group vaccination programme will be continued in the coming years.
1.12 Blood donors
Since 1985, blood donated by (new and regular) blood donors has been screened for HIV, HBV, HCV and syphilis. Volunteers are screened according to quality and safety guidelines and people who report specific risk factors for blood-transmitted infections are not accepted as donors. Records are kept in the national donor registry, which provides good information on the prevalence and incidence of these infections in a low-risk population. Data from 1998 onwards are reported here (www.sanquin.nl).
1.13 Burden of Disease
The Burden of Disease (BoD) of chlamydia, gonorrhoea, HBV, HCV, HIV and syphilis was determined by calculating Disability Adjusted Life Years (DALY). The DALY is the sum of the number of ‘Years of Life Lost’ (YLL; premature mortality) and the number of ‘Years Lived with Disability’ (YLD; morbidity) associated with all health outcomes attributed to a specific STI. The result is a single measure that quantifies the years of healthy life lost due to a certain STI. Several methods are available for BoD estimation. In this report, the European BCoDE model and the pathogen- and incidence-based approach are used, which incorporates all health outcomes that can be causally attributed to all new cases of a specific STI. In 2014, for the first time, the Netherlands calculated the BoD for all infectious diseases for which the BCoDE method was already available, including STIs. For detailed information regarding the BoD calculation, the RIVM report ‘State of Infectious Diseases in the Netherlands, 2013’ can be consulted.10, 11
The pathogen is used as the starting point for the BoD calculation. In this way, the focus is on all health outcomes that can be causally attributed to that specific pathogen. For this approach, ‘outcome trees’ are developed for each STI. Outcome trees represent the natural history of a disease, linking incident cases to all associated health outcomes, including acute effects, sequelae and death. Outcome trees provide a representation of disease progression by ordering all relevant health outcomes associated with the pathogen along a timeline. The chance of developing a subsequent health outcome is quantified by transition probabilities. As opposed to working with prevalence data, the burden is calculated using incidence data. In this way, all new cases of a particular STI are counted, and the burden associated with all potential health outcomes (including those that might occur in future years) attributable to the initial infection is included, and assigned to the year of initial infection. However, the incidence approach does not take into account the BoD among patients who have contracted the STI in 10 van Lier A., McDonald S., Bouwknegt M., Bijkerk P., Havelaar A. et al. (2014 (RIVM report 150205001)
http://www.rivm.nl/bibliotheek/rapporten/150205001.pdf) Disease burden of infectious disease in the Netherlands. In: Bijkerk P., van Lier A., McDonald S., Kardamanidis K., Fanoy E.B. et al. State of infectious diseases in
the Netherlands, 2013. Bilthoven: National Institute for Public Health and the Environment (RIVM). 11 Bijkerk P., van Lier A., McDonald S., Wallinga J., de Melker H.E. (2014 (Appendix RIVM report 150205001).
the past, and still suffer from the health consequences (e.g. HIV and HBV). The incidence data are derived from different data sources depending on the specific STI. For chlamydia and gonorrhoea, incidence data reported by STI clinics (2007-2014) and estimated incidence rates based on data from the NIVEL-PCD (2009-2013) are combined. For HBV and HCV, notification data on acute cases from Osiris (2007-2014) are used; for HIV, data on newly diagnosed cases are retrieved from the SHM (2007-2014). For syphilis, incidence data registered by STI clinics are used (2007-2014). Multiplication factors (derived by disease surveillance specialists through literature review and expert opinion) are applied to adjust for underestimation, asymptomatic cases and incomplete coverage of the incidence data sources. Underestimation can be the result of under-ascertainment (caused by cases that do not contact health services) and/or under-reporting (caused by cases that do contact health services, but whose conditions are incorrectly reported). The resulting ‘estimated annual number of new cases’ is averaged over the periods 2007-2011 and 2012-2014 to smooth out any annual fluctuations.
The estimated number of DALYs is presented per year and per 1,000 cases to reflect the BoD at the population level (depending on morbidity, mortality and the number of new cases per year) and at the individual level (depending on morbidity and mortality only), respectively. Version 0.94 of the BCoDE software toolkit is used to estimate the BoD. It should be noted that in future years, the underlying models might be further optimized.
2
STI and Sense
consultations
2.1 Key points
STI clinics
• In 2014, 141,191 new consultations were registered by STI clinics under national surveillance, an increase of 5.7 per cent over 2013. The increase was highest among MSM (8.9 per cent); there was no increase among heterosexual men.
• In 2014, 17,612 young people (<25 years) with no other risk factors were tested for chlamydia only; 5,584 (31.7 per cent) of those used a chlamydia home sampling kit provided by the STI clinic.
• The key characteristics of attendees were as follows: young age (48.9 per cent under 25 years), Dutch origin (68.9 per cent), female (49.8 per cent), three or more sexual partners in the previous six months (53.5 per cent), previously tested for HIV (58.3 per cent), STI/ HIV-related symptoms (32.0 per cent), and no condom use at last casual sex contact (64.4 per cent).
• The percentage of attendees with at least one STI increased slightly: from 14.7 per cent in 2013 to 15.5 per cent in 2014. This increase was highest among heterosexual men (13.9 per cent in 2013 and 15.2 per cent in 2014).
• The STI positivity rate was higher among low-educated attendees (19.5 per cent) than among high-educated attendees (14.1 per cent), especially in the younger age groups. • In 66 per cent of all consultations (n=93,001) a unique ID number was registered, which
allows the monitoring of repeated testing. Of all the consultations by heterosexual men, 8 per cent were by men who had already been tested in 2014. Among MSM and women, the proportions were 24 and 11 per cent, respectively. Among MSM, the percentage of positive STI tests increased with the number of visits.
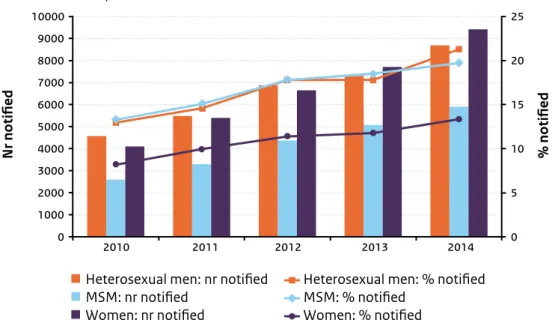
• The percentage of STI clinic attendees who reported having been notified of their possible exposure to STI has increased from 10.8 per cent in 2010 to 17.0 per cent in 2014. In 2014, this percentage was highest among heterosexual men (21.3 per cent, compared with MSM: 19.7 per cent; women: 13.4 per cent).
• Among all individuals diagnosed with an STI, 34.2 per cent were detected through partner notification (31.4 per cent in 2013).
• In 2014, the number of Sense consultations declined by 31 per cent to 8,106, of which 83 per cent were by women. Among women, the most common topic was birth control, among men sexuality.
General practice
• The number of STI-related episodes at general practices (based on ICPC codes for episodes of fear of STI and diagnosed STI) was estimated at 290,000 in the Netherlands in 2013, an increase of 20 per cent since 2009. Of these episodes, 47 per cent were in men and 53 per cent in women.
• There were an estimated 122,000 STI diagnoses (chlamydia, gonorrhoea, syphilis, HIV, trichomonas, genital herpes, genital warts or non-specific urethritis) registered at general practices in 2013.
• The more detailed data from the questionnaires completed by the sentinel practices in the NIVEL-PCD also show that patients with STI-related consultations at general practices were more often women than men (61 versus 39 per cent in 2013). The majority (80 per cent) were of Dutch descent and 39 per cent were under 25 years of age. Seven per cent of male STI patients reported a homosexual preference, which is much lower than at STI clinics, where 40 per cent of male clients reported being MSM. The most common reason for visiting a general practice for STI issues was STI symptoms or complaints (52 per cent).
• In 2013, general practices requested an STI test (chlamydia, gonorrhoea, syphilis or HBV) in 72 per cent of STI consultations, and an HIV test in 19 per cent. The HIV test request rate continues to decline for heterosexual men and women, while this is not the case for MSM. The overall STI test positivity rate (chlamydia, gonorrhoea, syphilis, HBV, HIV) was 33 per cent, but the rate was higher in MSM (90 per cent) and notified people (72 per cent).
2.2 Consultations and characteristics of STI clinic attendees
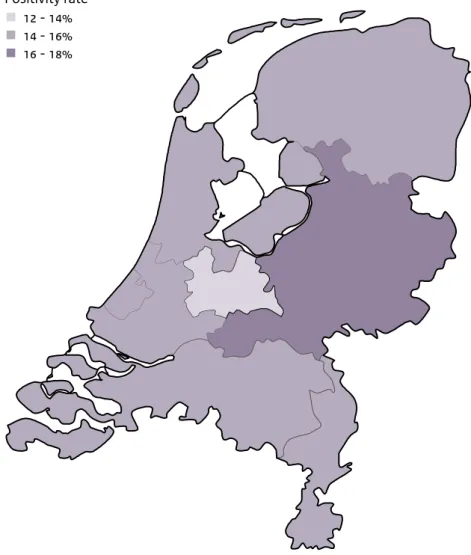
Figure 2.1 Positivity rates of STI by region, the Netherlands, 2014 Positivity rate
12 - 14%
14 - 16%
16 - 18%
Figure 2.2 Number of consultations and percentage of positive STI in the national STI surveillance in the Netherlands, 1995–2014
8 9 10 11 12 13 14 15 16 0 25000 50000 75000 100000 125000 150000 % positive Nr of consultations Nr of consultations 1995 1996 1997 199819992000 2001 200220032004 200520062007 2008 20092010 20112012 20132014 % positive STI
Footnote: 1995–2002: STI registration; 2000: STI clinic Erasmus Medical Centre Rotterdam was included; 2003: Implementation of STI sentinel surveillance network; 2004–2014: National STI surveillance network. STI include: chlamydia, gonorrhoea, infectious syphilis, HIV and infectious hepatitis B.
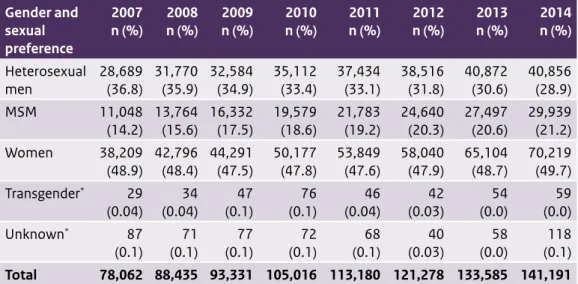
Table 2.1 Number of consultations by sexual risk group, 2007–2014
Gender and sexual preference 2007 n (%) n (%)2008 n (%)2009 n (%)2010 2011n (%) 2012n (%) n (%)2013 n (%)2014 Heterosexual men 28,689 (36.8) 31,770 (35.9) 32,584 (34.9) 35,112 (33.4) 37,434 (33.1) 38,516 (31.8) 40,872 (30.6) 40,856 (28.9) MSM 11,048 (14.2) 13,764 (15.6) 16,332 (17.5) 19,579 (18.6) 21,783 (19.2) 24,640 (20.3) 27,497 (20.6) 29,939 (21.2) Women 38,209 (48.9) 42,796 (48.4) 44,291 (47.5) 50,177 (47.8) 53,849 (47.6) 58,040 (47.9) 65,104 (48.7) 70,219 (49.7) Transgender* 29 (0.04) (0.04)34 (0.1)47 (0.1)76 (0.04)46 (0.03)42 (0.0)54 (0.0)59 Unknown* 87 (0.1) (0.1)71 (0.1)77 (0.1)72 (0.1)68 (0.03)40 (0.0)58 (0.1)118 Total 78,062 88,435 93,331 105,016 113,180 121,278 133,585 141,191
Figure 2.3 Number of consultations and percentage of positive STI tests in the national STI surveillance in the Netherlands by gender and sexual preference, 2004–2014
Heterosexual men: nr of consultations Heterosexual men: % positive STI
MSM: nr of consultations MSM: % positive STI
Women: nr of consultations Women: % positive STI
0 5 10 15 20 25 0 10000 20000 30000 40000 50000 60000 70000 80000 2004 2005 2006 2007 2008 2009 2010 2011 2012 2013 2014 % positive Nr of consultations
Footnote: STI include: chlamydia, gonorrhoea, infectious syphilis, HIV and infectious hepatitis B.
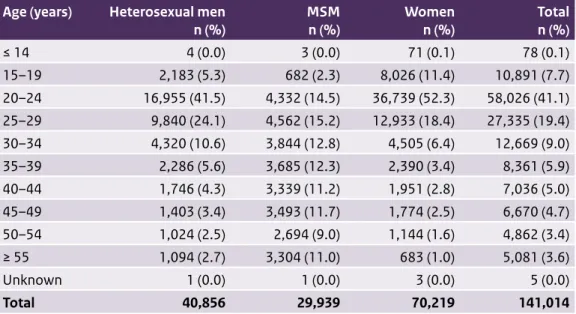
Table 2.2 Number of consultations by age, gender and sexual preference, 2014
Age (years) Heterosexual men
n (%) MSM n (%) Womenn (%) Totaln (%) ≤ 14 4 (0.0) 3 (0.0) 71 (0.1) 78 (0.1) 15–19 2,183 (5.3) 682 (2.3) 8,026 (11.4) 10,891 (7.7) 20–24 16,955 (41.5) 4,332 (14.5) 36,739 (52.3) 58,026 (41.1) 25–29 9,840 (24.1) 4,562 (15.2) 12,933 (18.4) 27,335 (19.4) 30–34 4,320 (10.6) 3,844 (12.8) 4,505 (6.4) 12,669 (9.0) 35–39 2,286 (5.6) 3,685 (12.3) 2,390 (3.4) 8,361 (5.9) 40–44 1,746 (4.3) 3,339 (11.2) 1,951 (2.8) 7,036 (5.0) 45–49 1,403 (3.4) 3,493 (11.7) 1,774 (2.5) 6,670 (4.7) 50–54 1,024 (2.5) 2,694 (9.0) 1,144 (1.6) 4,862 (3.4) ≥ 55 1,094 (2.7) 3,304 (11.0) 683 (1.0) 5,081 (3.6) Unknown 1 (0.0) 1 (0.0) 3 (0.0) 5 (0.0) Total 40,856 29,939 70,219 141,014
Figure 2.4 Percentage of positive tests in the national STI surveillance in the Netherlands by age and sexual preference, 2014
Heterosexual men 0 5 10 15 20 25 % positive Age (years) 15-19 20-24 25-29 30-34 35-39 40-44 45-49 50-54 ≥ 55 MSM Women
Footnote: STI include: chlamydia, gonorrhoea, infectious syphilis, HIV and infectious hepatitis B.
Table 2.3 Number of consultations by ethnicity, generation, gender and sexual preference, 2014
Ethnicity Heterosexual men
n (%) MSMn (%) Womenn (%) Totaln (%) The Netherlands 26,047 (63.8) 21,279 (71.1) 49,893 (71.1) 97,219 (68.9) Turkey 1,045 (2.6) 388 (1.3) 636 (0.9) 2,069 (1.5) First generation 304 (29.1) 155 (39.9) 107 (16.8) 566 (27.4) Second generation 740 (70.8) 231 (59.5) 528 (83.0) 1,499 (72.5) Unknown 1 (0.1) 2 (0.5) 1 (0.2) 4 (0.2) North Africa/Morocco 1,604 (3.9) 336 (1.1) 1,136 (1.6) 3,076 (2.2) First generation 400 (24.9) 171 (50.9) 184 (16.2) 755 (24.5) Second generation 1,200 (74.8) 164 (48.8) 948 (83.5) 2,312 (75.2) Unknown 4 (0.2) 1 (0.3) 4 (0.4) 9 (0.3) Surinam 3,029 (7.4) 907 (3.0) 3,679 (5.2) 7,615 (5.4) First generation 988 (32.6) 474 (52.3) 968 (26.3) 2,430 (31.9) Second generation 2,033 (67.1) 431 (47.5) 2,694 (73.2) 5,158 (67.7) Unknown 8 (0.3) 2 (0.2) 17 (0.5) 27 (0.4)
Table 2.3 (continued) Number of consultations by ethnicity, generation, gender and sexual preference, 2014
Ethnicity Heterosexual men
n (%) MSMn (%) Womenn (%) Totaln (%) Netherlands Antilles/Aruba 1,590 (3.9) 612 (2.0) 1,621 (2.3) 3,823 (2.7) First generation 909 (57.2) 461 (75.3) 763 (47.1) 2,133 (55.8) Second generation 680 (42.8) 151 (24.7) 854 (52.7) 1,685 (44.1) Unknown 1 (0.1) 0 (0.0) 4 (0.2) 5 (0.1) Eastern Europe 557 (1.4) 666 (2.2) 2,608 (3.7) 3,831 (2.7) First generation 445 (79.9) 607 (91.1) 2,349 (90.1) 3,401 (88.8) Second generation 111 (19.9) 58 (8.7) 252 (9.7) 421 (11.0) Unknown 1 (0.2) 1 (0.2) 7 (0.3) 9 (0.2) Sub-Saharan Africa 1,449 (3.5) 265 (0.9) 1,410 (2.0) 3,124 (2.2) First generation 789 (54.5) 170 (64.2) 651 (46.2) 1,610 (51.5) Second generation 658 (45.4) 93 (35.1) 757 (53.7) 1,508 (48.3) Unknown 2 (0.1) 2 (0.8) 2 (0.1) 6 (0.2) Latin America 637 (1.6) 942 (3.1) 1,561 (2.2) 3,140 (2.2) First generation 434 (68.1) 853 (90.6) 1,149 (73.6) 2,436 (77.6) Second generation 203 (31.9) 87 (9.2) 409 (26.2) 699 (22.3) Unknown 0 (0.0) 2 (0.2) 3 (0.2) 5 (0.2) Europe other 2,170 (5.3) 2,278 (7.6) 3,576 (5.1) 8,024 (5.7) First generation 1,199 (55.3) 1,768 (77.6) 1,733 (48.5) 4,700 (58.6) Second generation 965 (44.5) 508 (22.3) 1,836 (51.3) 3,309 (41.2) Unknown 6 (0.3) 2 (0.1) 7 (0.2) 15 (0.2) Asia 1,960 (4.8) 1,653 (5.5) 2,827 (4.0) 6,440 (4.6) First generation 956 (48.8) 894 (54.1) 986 (34.9) 2,836 (44.0) Second generation 1,000 (51.0) 757 (45.8) 1,835 (64.9) 3,592 (55.8) Unknown 4 (0.2) 2 (0.1) 6 (0.2) 12 (0.2) Else 353 (0.9) 342 (1.1) 627 (0.9) 1,322 (0.9) First generation 179 (50.7) 279 (81.6) 255 (40.7) 713 (53.9) Second generation 173 (49.0) 63 (18.4) 371 (59.2) 607 (45.9) Unknown 1 (0.3) 0 (0.0) 1 (0.2) 2 (0.2) Unknown 415 (1.0) 271 (0.9) 645 (0.9) 1,331 (0.9) Total 40,856 29,939 70,219 141,014
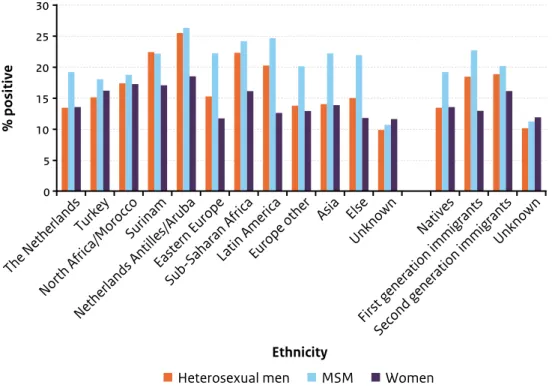
Figure 2.5 Percentage of positive STI tests in the national STI surveillance in the Netherlands by ethnicity and sexual preference, 2014
0 5 10 15 20 25 30 % positive The Netherlands Turkey North Africa/Morocco Surinam Netherlands Antilles/Aruba Eastern Europe Sub-Saharan Africa
Latin AmericaEurope other
Asia Else Unknown Natives First generation immigrants Second generation immigrantsUnknown Ethnicity
Heterosexual men MSM Women
Table 2.4 Number of consultations by (sexual) behavioural characteristics, demographics, gender and sexual preference, 2014
Heterosexual men
n (%) MSMn (%) Womenn (%) Totaln (%)
Number of partners in past 6 months
0 partners 202 (0.5) 143 (0.5) 447 (0.6) 792 (0.6)
1 partner 7,202 (17.6) 2,807 (9.4) 19,564 (27.9) 29,573 (21.0)
2 partners 8,615 (21.1) 3,319 (11.1) 18,674 (26.6) 30,608 (21.7)
3 or more partners 24,319 (59.5) 22,665 (75.7) 28,523 (40.6) 75,507 (53.5)
Unknown 518 (1.3) 1,005 (3.4) 3,011 (4.3) 4,534 (3.2)
Condom use if last sexual contact was steady*
No 13,428 (77.9) 7,674 (71.7) 25,361 (81.6) 46,463 (78.8)
Yes 3,711 (21.5) 2,877 (26.9) 5,556 (17.9) 12,144 (20.6)
Table 2.4 (continued) Number of consultations by (sexual) behavioural characteristics, demographics, gender and sexual preference, 2014
Heterosexual men
n (%) MSMn (%) Womenn (%) Totaln (%)
Condom use if last sexual contact was casual*
No 15,337 (67.4) 8,638 (49.6) 25,710 (69.6) 49,685 (64.4)
Yes 7,246 (31.8) 8,503 (48.8) 10,943 (29.6) 26,692 (34.6)
Unknown 178 (0.8) 275 (1.6) 279 (0.8) 732 (0.9)
Previous gonorrhoea/chlamydia/syphilis in anamnesis
No 33,538 (82.1) 21,601 (72.2) 57,031 (81.2) 112,170 (79.5)
Yes 3,885 (9.5) 7,195 (24.0) 8,252 (11.8) 19,332 (13.7)
Do not know 1,630 (4.0) 388 (1.3) 2,102 (3.0) 4,120 (2.9)
Unknown 1,803 (4.4) 755 (2.5) 2,834 (4.0) 5,392 (3.8)
Previous HIV test
No 20,268 (49.6) 3,461 (11.6) 33,133 (47.2) 56,862 (40.3)
Yes, positive 44 (0.1) 4,248 (14.2) 86 (0.1) 4,378 (3.1)
Yes, negative 19,888 (48.7) 21,995 (73.5) 35,676 (50.8) 77,559 (55.0)
Yes, result unknown 63 (0.2) 56 (0.2) 118 (0.2) 237 (0.2)
Unknown 593 (1.5) 179 (0.6) 1,206 (1.7) 1,978 (1.4)
CSW
No 40,441 (99.0) 29,162 (97.4) 64,312 (91.6) 133,915 (95.0)
Yes, in past 6 months 197 (0.5) 519 (1.7) 5,446 (7.8) 6,162 (4.4)
Unknown 218 (0.5) 258 (0.9) 461 (0.7) 937 (0.7)
Client of CSW, men
No 36,367 (89.0) 28,545 (95.3) 64,912 (91.7)
Yes, in past 6 months 4,218 (10.3) 734 (2.5) 4,952 (7.0)
Unknown 271 (0.7) 660 (2.2) 931 (1.3)
Swinger**
No 15,666 (91.3) 8,268 (86.2) 23,929 (90.7) 47,863 (90.1)
Yes 1,459 (8.5) 1,074 (11.2) 2,355 (8.9) 4,888 (9.2)
Heterosexual men
n (%) MSMn (%) Womenn (%) Totaln (%)
Injecting drug use
No 39,901 (97.7) 29,146 (97.4) 66,124 (94.2) 135,171 (95.9)
Yes, ever 83 (0.2) 153 (0.5) 105 (0.1) 341 (0.2)
Yes, in past 6 months 24 (0.1) 140 (0.5) 32 (0.0) 196 (0.1)
Unknown 848 (2.1) 500 (1.7) 3,958 (5.6) 5,306 (3.8) Socioeconomic status Very high 5,386 (13.2) 4,345 (14.5) 9,642 (13.7) 19,373 (13.7) High 10,693 (26.2) 8,234 (27.5) 18,834 (26.8) 37,761 (26.8) Medium 11,496 (28.1) 7,747 (25.9) 19,896 (28.3) 39,139 (27.8) Low 6,757 (16.5) 5,218 (17.4) 10,966 (15.6) 22,941 (16.3) Very low 4,161 (10.2) 2,407 (8.0) 5,862 (8.3) 12,430 (8.8) Unknown 2,363 (5.8) 1,988 (6.6) 5,019 (7.1) 9,370 (6.6) Educational level# High 16,651 (40.8) 11,624 (38.8) 28,182 (40.1) 56,457 (40.0) Low 10,475 (25.6) 5,661 (18.9) 16,250 (23.1) 32,386 (23.0) Other 301 (0.7) 289 (1.0) 678 (1.0) 1,268 (0.9) Unknown 13,429 (32.9) 12,365 (41.3) 25,109 (35.8) 50,903 (36.1)
* Type of sexual contact was missing for 3% (n=4,869). ** Voluntary question, answered by 38% (n=53,139).
# Low level of education: no education, elementary school, lbo, mavo, vmbo, mbo; high level of education: havo, vwo, university of applied sciences, university. Table 2.5 Reported indication by gender and sexual preference, 2014
Indication Heterosexual men
n (%) MSMn (%) Womenn (%) Totaln (%)
STI/HIV-endemic area 11,871 (29.1) 5,769 (19.3) 15,478 (22.0) 33,118 (23.5)
Symptoms 13,614 (33.3) 7,152 (23.9) 24,313 (34.6) 45,079 (32.0)
Partner in risk group 10,899 (26.7) 28,524 (95.3) 18,133 (25.8) 57,556 (40.8)
Notified 8,689 (21.3) 5,903 (19.7) 9,416 (13.4) 24,008 (17.0)
No indication 620 (1.5) 0 (0.0) 1,223 (1.7) 1,843 (1.3)
Footnote 1: Percentages do not add up to 100% since one client can have more than one indication. Table 2.4 (continued) Number of consultations by (sexual) behavioural characteristics, demographics, gender and sexual preference, 2014
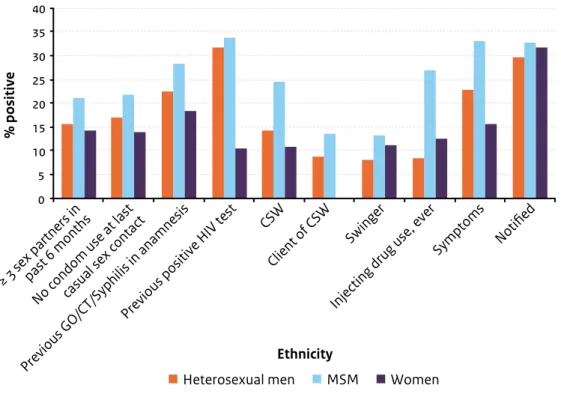
Figure 2.6 Percentage of positive STI tests in the national STI surveillance in the Netherlands by risk factor and sexual preference, 2014
0 5 10 15 20 25 30 35 40 % positive
≥ 3 sex partners inpast 6 months
No condom use at lastcasual sex contact
Previous GO/CT/
Syphilis in anamnesis
Previous positive HIV test Injecting drug
use, ever Symptoms Notified CSW
Client of CSW
Swinger
Ethnicity
Heterosexual men MSM Women
Table 2.6 Number of consultations and percentage of positive tests by age, level of education, gender and sexual preference, 2014
Age group
(years) Low level of Heterosexual men MSM Women education* n (%) High level of education** n (%) Low level of education* n (%) High level of education** n (%) Low level of education* n (%) High level of education** n (%) ≤ 14 4 (0.0) (0.0)0 (0.0)1 (0.0)2 (17.0)47 (0.0)12 15–19 1,025 (24.4) (14.3)669 (24.9)265 (15.3)262 (25.4)3,132 (15.8)3,040 20–24 4,324 (22.4) 7,922 (15.6) (24.5)1,024 (17.0)2,001 (20.3)7,442 16,976 (13.2) 25–29 2,127 (20.4) 4,000 (14.0) (22.7)837 (18.5)2,013 (15.9)2,272 (11.8)4,860 30–34 961 (17.7) 1,510 (11.0) (26.1)602 (20.5)1,581 (10.9)1,001 (10.0)1,407