Composition and sources of fine
particulate matter (PM
) in the
Report 863001007/2008
RIVM Report 863001007/2008
Composition and sources of fine particulate matter
(PM
2.5
) in the Netherlands
H.J.Th. Bloemen D. Mooibroek F.R. Cassee E.M. van Putten
Contact:
H.J.Th. Bloemen
Laboratory for Environmental Monitoring henk.bloemen@rivm.nl
This investigation has been performed by order and for the account of Ministry of Housing, Spatial Planning and Environment, within the framework of project M863001 Air Pollution and Health.
© RIVM 2008
Parts of this publication may be reproduced, provided acknowledgement is given to the 'National Institute for Public Health and the Environment', along with the title and year of publication.
Abstract
Composition and sources of fine particulate matter (PM2.5) in the Netherlands
Traffic emissions were the most important source of particulate matter (PM) for the period 1998 through 1999. Secondary aerosol formation fuelled by precursors emitted from traffic, energy production and agricultural sources was also a major contributor. This is the conclusion of a source apportionment study carried out on PM2.5 (PM with a diameter smaller than 2.5 μm) for this period by
the National Institute for Public Health and the Environment (RIVM) of the Netherlands.
The negative impacts of PM on human health, such as increased risk of cardio-respiratory disease and decreased life expectancy, are well recognized. The RIVM has determined the source contributions to PM2.5 during the period 1998–1999 with the aim of providing the government with data that would
contribute to the development of an appropriate abatement strategy for PM. The results support the current government policy of reducing pollution on a source contribution basis.
On average, traffic emissions contributed 38% (12% diesel, 26% petrol) of the PM2.5 mass
concentrations in urban areas during the period 1998–1999. Residual oil combustion and related sources contributed 7%, while 10% of the mass was emitted from natural sources (sea spray and crustal material). The remaining 45% of the PM2.5 mass consists of secondary aerosol formation fuelled by
precursors emitted from traffic, energy production and agriculture.
The six sites studied were all located in the geographic centre of the Netherlands. Each location was primarily affected by one of the following PM sources: heavy traffic, urban environment, industrial area, rural area close to the sea and agricultural area. The relative contributions of each source differed considerably between locations and displayed seasonal variations. The PM concentrations were higher in the winter than in the summer, which could be explained in urban areas by the increased contribution from traffic in the winter.
To link these outcomes with epidemiological data and to provide a more accurate estimation of the source contributions at a location, it will be necessary to carry out more frequent sampling over a longer period of time.
Key words:
Rapport in het kort
De samenstelling en bronnen van fijn stof (PM2,5) in Nederland.
Tussen 1998 en 1999 vormde de uitstoot van wegverkeer de voornaamste bijdrage aan fijn stof. Andere belangrijke bijdrages waren indirecte emissies van alle vormen van gemotoriseerd verkeer (fijn stof gevormd uit gassen), energieproductie en landbouw. Dit blijkt uit een onderzoek van het RIVM naar de bronbijdragen aan PM2,5 (fijn stof met een diameter kleiner dan 2,5 micrometer) over deze periode.
De negatieve gevolgen van fijn stof op de volksgezondheid, zoals een verkorte levensduur en een toename in ernst en omvang van luchtwegaandoeningen, zijn onderkend. Om passende
beleidsmaatregelen tegen de uitstoot van fijn stof te kunnen bepalen heeft het RIVM onderzocht welke bronnen in de periode 1998-1999 aan deze uitstoot bijdragen. Hiermee wordt het beleid van de
overheid, dat de vervuiling bij bron aanpakt, ondersteund.
Gemiddeld is in een bebouwd gebied in Nederland in de periode 1998-1999 de bijdrage van verkeer 38 procent (12 procent diesel, 26 procent benzine). De bijdrage van olieverbranding en daaraan gerelateerde bronnen bedraagt 7 procent. De bijdrage van natuurlijke bronnen (zeezout en bodemstof) bedraagt 10 procent. De resterende 45 procent zijn indirecte emissies van verkeer, energieproductie en landbouw.
De zes onderzochte meetlocaties lagen in het midden van het land. Elke locatie werd voornamelijk door een van de volgende fijnstofbronnen belast: drukke verkeersweg, stedelijke omgeving, industrieel gebied, landelijk gebied nabij de zee of nabij intensieve veehouderij. De relatieve bronbijdragen verschilden aanzienlijk per locatie en per seizoen. De concentraties fijn stof zijn groter in de winter dan in de zomer, wat in bebouwde gebieden vooral door verkeersbijdragen kan worden verklaard.
Voor een koppeling met gezondheidseffecten en een nauwkeurigere schatting van de bronbijdragen op een locatie zijn uitgebreidere metingen noodzakelijk.
Trefwoorden:
Contents
Summary 7
1 Introduction 9
2 Sampling and analysis 11
3 Data preprocessing 13
3.1 Outliers 13
3.2 Missing data – imputation 13
3.3 Uncertainty matrix 14
3.4 Feature selection 14
3.5 Positive matrix factorization 15
3.6 Optimal number of relevant sources 16
4 Results and discussion 17
4.1 Data validation 17
4.2 Source profile identity 20
4.3 Predicted mass 25
4.4 Correlation of factors 26
4.5 Temporal variation of source contributions 27 4.6 Annual average source contribution 32
5 Conclusion and recommendations 33 References 35 Appendix 1: Interreceptor correlation of all source profiles 39 Appendix 2: Intrareceptor correlation of all source profiles 41 Appendix 3: Source contributions (µg/m3) 45 Appendix 4: Source contributions (OC scaled) 47 Appendix 5: Concentration wind sector plots 49 Appendix 6: Source contributions street, marine and agricultural sites 53
Summary
Ambient particulate matter (PM) is consistently associated with premature mortality and increased morbidity. Toxicological research has not yet identified causal agents of the health effects of PM at its current concentrations in the air. Since PM has many components, focussing on the emission sources is an alternative to guide policymakers in developing optimally cost-effective policies.
To identify source contributions, we applied Positive Matrix Factorization to concentrations and compositions of the PM2.5 measured in a field study. The sampling sites were chosen for the
characteristics (industrial, rural, agricultural, subject to heavy traffic, etc.) of various locations geographically spread in the centre of the Netherlands.
Analysis revealed eight factors describing the PM2.5 data optimally. However, most factors are
mixtures of source profiles correlated to such a degree that this limited data set (six sites and 79 days) has insufficient statistical power to separate more profiles. The profiles were identified either by their main sources or by the main atmospheric processes generating the particles in the profile.
The PM2.5 mass concentrations on urban locations contain particulate traffic emissions (12% diesel,
26% petrol, which includes resuspension and other related processes) and 7% residual oil combustion and related sources. While 10% of the mass is emitted from natural sources (sea spray and crustal material), 45% of the mass entails secondary aerosol formation fuelled by precursor traffic emissions, energy production, and agriculture (21% sulphate-rich and 24% nitrate-rich profiles). The
carbonaceous aerosol at all six sites caused by traffic (64%–79%) is considered primary organic aerosol, and the sulphate-rich carbonaceous aerosol (15%–21%), is considered substantially secondary aerosol. Other sources contribute maximally 10% of the carbonaceous aerosol.
The sum of PM2.5 mass (the traffic – petrol and the correlated unknown factor, the sea spray, the
nitrate-rich, and the oil combustion factors) is clearly greater in winter than in summer. The sulphate-rich factor is greater in summer than in winter. For the traffic diesel only, the urban and suburban receptor sites exhibit greater average concentrations in winter.
The study shows the power of source apportionment methodology in calculating quantitative source contributions. However, we recommend a procedure with more frequent and longer sampling, and possibly a wider range of parameters, for a new study with more statistical power to link the outcomes to epidemiological data.
1
Introduction
For decades now, particulate matter (PM) has been seen as one of the main ambient constituents of air pollution that is associated with adverse health effects on humans. Coherent and repeated findings of epidemiological studies indicate that health effects occur at the concentrations of PM currently found in ambient air (WHO, 2004; CEC, 2005; Schwarze et al., 2006; Pope and Dockery, 2006). Despite substantial efforts to understand the biological mechanisms underlying these effects, the causal agents have not been identified. Instead of trying to identify individual components, a strategy to identify the contribution of the sources of the PM emission and their effects on health might be more efficient to reduce health risks.
To achieve compliance with air quality standards for PM10 (EU, 1999), in force since 2005 and those
currently considered for PM2.5, source directed abatement measures are being developed nationally and
in local action plans. In this chain of directives, international and national regulations, abatement strategies and emission reduction measures information about the origin of PM is a prerequisite to operate optimally cost-effective.
In a new line of research, source contributions are being directly associated with the health effects observed in populations. The report of the Workgroup on Source Apportionment of Particulate Matter Health Effects (Thurston et al., 2005) concludes that the source apportionment methodology has matured far enough to derive reliable insights into the source components that contribute to PM2.5
health effects.
A comparable line of research focuses on the relationship between source contributions and various health end-points. Hannigan et al. (2006) link mutagenicity in human cells and bacterial assays to the contribution of urban sources. Several European studies, including HEPMEAP (Bloemen et al., 2005) and RAIAP (Cassee et al., 2003; Steerenberg et al., 2006; Gerlofs-Nijland et al., 2006), have
investigated the relationship of the composition and source contributions with various end-points. For all these approaches, describing air pollution in terms of source identities and contributions rather than in terms of concentrations of single air pollutants is required. Projects to collect data suitable for source apportionment, however, are laborious, costly, and therefore rare.
For the Netherlands, the last study collecting speciation data was conducted in 1998-1999. It was set up to better the understanding of the substantial difference of 50% between dispersion model calculations and the observations of the Dutch National Air Quality Monitoring Network (Bloemen et al., 1998) but no source apportionment methods were used at that time for the interpretation of the data (Visser et al., 2001). As the source apportionment methodology has progressed to more reliable and sound tools, re-examining the speciation data is expected to produce more insight in the sources of particulate air pollution in the Netherlands relevant for defining abatement strategies for the non-compliance situation the Dutch authorities are now confronted with.
To this end, we reprocessed PM2.5 speciation data of the 1998-99 project using Positive Matrix
Factorization (Paatero and Tapper, 1994) to describe the air pollution in general and especially for the currently most relevant policy issue in the Netherlands, including traffic emission contribution, sea salt
the set-up of the 1998-99 project for exposure assessment as part of epidemiological studies and for studying the correlation of health end-points and source contribution in toxicological studies.
2
Sampling and analysis
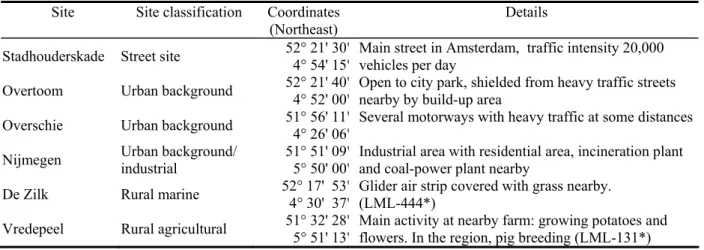
The sampling sites were selected on the basis of the characteristics of the type of location: heavy traffic street or urban background, nearby industrial activities, or rural background such as that close to the seashore or in a natural and agricultural area (Table 1). The sites were located in the west part of the country and in the east (Figure 1).
Figure 1: Locations of the Bronstof project shown on the map of the Netherlands: 1 – De Zilk, 2 – Vredepeel, 3 – Overschie, 4 – Nijmegen, 5- Amsterdam – Stadhouderskade, 6 – Amsterdam - Overtoom.
Table 1: Sampling site details
Site Site classification Coordinates
(Northeast) Details
Stadhouderskade Street site 52° 21' 30"4° 54' 15" Main street in Amsterdam, traffic intensity 20,000 vehicles per day Overtoom Urban background 52° 21' 40" 4° 52' 00" Open to city park, shielded from heavy traffic streets nearby by build-up area Overschie Urban background 51° 56' 11" 4° 26' 06" Several motorways with heavy traffic at some distances Nijmegen Urban background/ industrial 51° 51' 09"5° 50' 00" Industrial area with residential area, incineration plant and coal-power plant nearby De Zilk Rural marine 52° 17' 53" 4° 30' 37" Glider air strip covered with grass nearby. (LML-444*)
Vredepeel Rural agricultural 51° 32' 28"5° 51' 13" Main activity at nearby farm: growing potatoes and flowers. In the region, pig breeding (LML-131*) * LML-xxx: Code of monitoring station of the National Air Quality Monitoring Network.
De Zilk, one of the two rural sites, is part of the National Air Quality Monitoring Network (NAQMN) and is located only a few kilometres from the shore of the North Sea. It is set up on a grass field that is occasionally used as a glider air strip and is bordered by low bushes. The other rural site is Vredepeel, which also belongs to the NAQMN, is close to farm land where potatoes and flowers are grown. Intensive pig breeding is an important agricultural activity in the region. Of the two sites in Amsterdam, one is only a few metres from the kerb on a street (Stadhouderskade) with a traffic intensity of 20,000 vehicles per day, and the other at the edge of a city park (Vondelpark), shielded from a heavy traffic street (Overtoom) by a built-up area (height approximately 14 m). Two other urban background sites are located in Rotterdam-Overschie with heavy traffic (highways) at some distance and in Nijmegen near an industrial site and close to the city centre.
Sample collection and analysis are described in detail elsewhere (Bloemen et al., 2008), and we give only a brief description. Fine and coarse PM are collected with the versatile air pollutant sampler (VAPS; URG, Chapel Hill, North Carolina, USA). The VAPS includes two filter holders for the PM2.5
fraction. Using Dzubay and Stevens’s (1988) method, we analysed the elements of the PM collected on the Teflon filter elements by means of energy dispersive X-ray fluorescence [EDXRF; MiTac,
University of Antwerp and National Exposure Research Laboratory (NERL) of the U.S. Environmental Protection Agency (U.S. EPA)].
Material from the prefired quartz filter was analyzed by Sunset Laboratory (Tigard Oregon, USA) for elemental carbon (EC) and organic carbon (OC) using the method described by Birch and Cary (1996). Ion chromatography was used for the determination of ammonium nitrate, sulphate, sodium, and chloride in PM collected with a dichotomous sampler (model 244 Sierra Instruments Inc, Carmel Valley, California, USA) on Teflon filters (Gelman Teflo R2PJ047 filters; pore size 2 µm). Mass was determined by weighing the Teflon filter of the VAPS before and after sample collection after conditioning to determine the total mass. The meteorological parameters wind speed, wind direction, and temperature were collected from three weather stations of the Royal Netherlands Meteorological Institute (KNMI, De Bilt) at the airports at Schiphol, Rotterdam, and Volkel, which roughly enclose the study area.
3
Data preprocessing
Although proper quality control and quality assurance practices optimize the quality of the data, we believe that exploration of the data before applying any model is required for the identification of outliers, not solely because of statistical considerations, but because of thematic knowledge as well. In practice, this exploration and validation includes outlier identification, reconstructed mass calculation and mass closure analysis, factor examination for consistency and correlation with known emission profiles, profile identification, correlation in time of source contributions at the different sites and correlation of the different source contributions at a site, wind directional analysis, and temporal variation. Many of the recently published studies include at least some, if not all, of these steps.
3.1
Outliers
Samples were excluded from the dataset based on analytical or technical reasons. Extreme values, which could be linked to unusual activities near the sampling site, were also removed. For example, samples collected on New Year’s Eve at the urban sites (all sites except De Zilk and Vredepeel) showed extreme high particulate air pollution concentration and could be linked to the emissions of fireworks. Samples collected at the day before Queen’s Day at the street station Stadhouderskade in Amsterdam showed unusually high concentrations compared to concentrations on other days that month and were linked to the celebrations in that street.
3.2
Missing data – imputation
PMF is designed to deal with a ‘complete-case’ data set (for all samples data is available for all measured parameters), a condition rarely met in environmental surveys. Hence, the missing data phenomenon needs to be dealt with. We consider omission of incomplete cases or simple imputation (e.g. 67% of detection limits) both wasteful and inefficient or ignoring existing correlations. Multiple imputation (MI), first proposed by Rubin (1976, 1977) and frequently applied in the fields of
environmental research and biostatistics (Hopke et al., 2001; Baccarelli et al., 2005; Ibrahim et al., 2005; Yang et al., 2005) was used to acknowledge the statistical features of the data set.
We used the average and standard deviations from the log-transformed data to draw randomly new data from the normal distribution and recalculated the average and standard deviations of the new data set including the imputed data. The iterations are repeated 500 times. To obtain a full reflection of
uncertainty, the entire process is repeated four times using rather extreme starting values. The standard deviation between the four replicates is used as an uncertainty estimate for each sample. In our data set high percentages of missing data exists for silicon and sulphur (>90%), and titanium and chromium (~70%) and for zinc and bromine (~50%). For all other parameters the percentage of missing data was less than ~10%.
3.3
Uncertainty matrix
PMF requires a matrix with corresponding uncertainties. Previous work on an artificial database (Mooibroek et al., 2007) gave good results with the full variance model, which estimated the
uncertainty matrix based on the relative uncertainty and the measurement determination limit (MDL) using:
(
)
⎟
⎟
⎠
⎞
⎜
⎜
⎝
⎛
⎟
⎠
⎞
⎜
⎝
⎛
+
×
=
2 i 2 i ij ij3
MDL
u
x
σ
(1)where xij is the concentration value for species i in sample j, ui represents the relative uncertainty for species i, and MDLi represents the measurement detection limit for species i. The right-hand term provides the uncertainty estimates for high concentrations and the left-hand term provides uncertainty estimates for values below the MDL, respectively. If the MI technique is applied, uncertainty estimates are multiplied by an arbitrary factor of three to down-weight their influence on the overall solution.
3.4
Feature selection
Paatero and Hopke (2003) find that including all species in factor analytical models may degrade the solution and suggest applying the signal-to-noise ratio (S/N) for each species to qualify species as strong enough to be included in the model; bad enough to be severely down-weighted, if not removed; or weak (between strong and bad), but retainable in the model and slightly down-weighted. In this study, various species with a large proportion of missing values are used.
Instead of using the S/N, we used the missing-value percentage to determine the status of the species: if less than 25% of the values were missing, the species was labelled strong, if more than 25% of the values were missing, the species was labelled weak and the uncertainties are increased by a factor of three before modelling.
3.5
Positive matrix factorization
The objective of multivariate receptor modelling is to determine (i) the number of aerosol sources, p, (ii) the chemical composition profile of each source, and (iii) the amount that each of the p sources contributes to the measured concentration. This general receptor modelling problem is solved by PMF with constrained, weighted least-squares, which is most simply written in matrix notation as:
X
=
GF
+
E
(2)where X is a n by m data matrix consisting of the measurements of m chemical species in n samples,
F is a p by m matrix of source chemical compositions (mass fractions or source profiles), and G is a n
by p matrix of source contributions (also named factor scores) of the samples. Since each sample is an observation along the time axis, G also describes the temporal variation of the sources. Matrix E represents the part of the data variance not modelled by the p factor model.
In this study we used the PMF version EPA-PMF 1.1, developed by NERL-US.EPA (Research Triangle Park, North Carolina, USA). EPA-PMF 1.1 calculates in robust mode, which means that outliers are not allowed to influence solutions. EPA-PMF 1.1 tries to minimize the sum of squares (the objective function; Paatero, 1997), which is defined by:
∑∑
∑
= = =⎥
⎥
⎥
⎥
⎦
⎤
⎢
⎢
⎢
⎢
⎣
⎡
−
=
n 1 i m 1 j 2 ij p 1 k kj ik ijs
f
*
g
x
Q(E)
(3)3.6
Optimal number of relevant sources
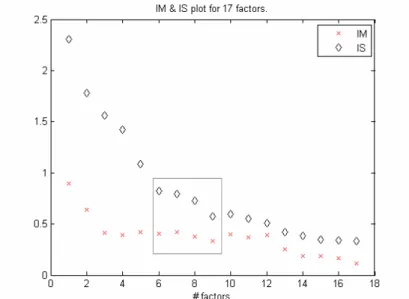
Lee et al. (1999) proposed the use of the scaled residual matrix (R) to determine the number of factors. For each specific number of factors, two indicators to identify the species having the least fit and the most imprecise fit are obtained from R: IM, the maximum individual column mean, and IS, the maximum individual column standard deviation. When the number of factors is increased to a critical value, both IM and IS drop significantly and the optimal number of factors can be determined. If the drop is not sharp, a range of number of factors must be evaluated by processing the data and examining the resulting profiles and the temporal variation of the individual contributions.
In this study, the plot of the IM and IS (Figure 2) was inconclusive about the number of profiles: EPA-PMF 1.1 processing resulted in a number of profiles describing the data set optimally or suboptimally that ranged from 6 to 9. On the basis of the evaluation of the profiles and the temporal contribution at the various sites, we decided that the solution with eight factors was optimal and realistic, and we evaluated this PMF solution further. The composition of the profiles is presented numerically in Table 2 and schematically in Figure 3 for easy comparison with other studies.
Figure 2: Determination of the number of factors by maximum individual column mean (IM) and standard deviation (IS) of the standardized residuals. The box represents the number of factors describing the data set optimally or suboptimally (6 – 9 factors)
4
Results and discussion
4.1
Data validation
A detailed evaluation of the measurement data is published elsewhere (Bloemen et al., 2008). A brief summary is given here. The PM2.5 concentrations at the project sites did not show large differences.
A geographic gradient ran from west to east (PM2.5 mass concentration: 14 µg/m3 at De Zilk to
18–21 µg/m3 in the east). The temporal variation expressed as the ratio of the average and the
95th percentile was approximately 2 for PM2.5 mass and all the components. The mass and component
concentrations agreed fairly well with those found in other studies in Europe and North America. The reconstructed mass included sea salt particles, secondary aerosol (ammonium nitrate and sulphate), carbonaceous aerosol, crustal material, and the sum of the remaining elements and agreed well (92% – 114%) with the measured mass. This confirmed that all major components were included in the measurements.
For estimating the contribution of the sources to the PM2.5 mass, multiple linear regressions was
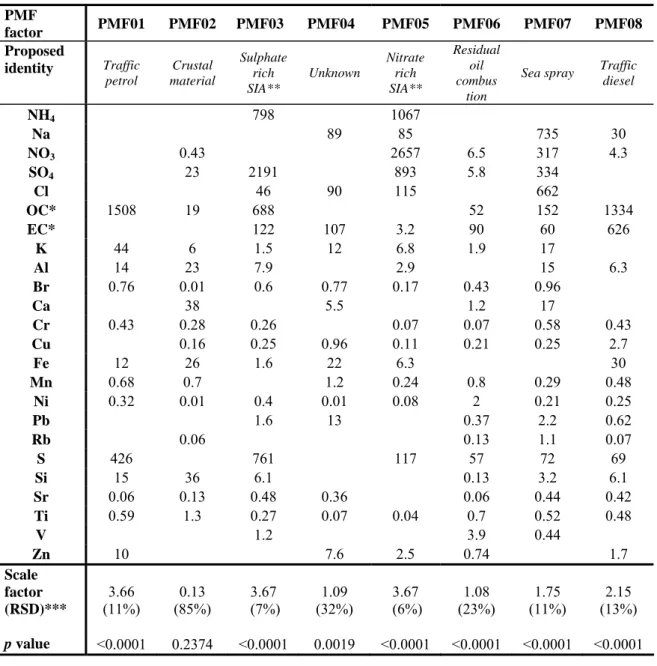
applied to the profiles (Table 2) and the measured mass. The resulting factor, with the relative standard deviation and the p values, are given in the last rows of Table 2. The overall regression coefficient (R2) is 0.94. All but the crustal material factor (factor 2) and the unknown factor (factor 4) are significant (p<0.0001).
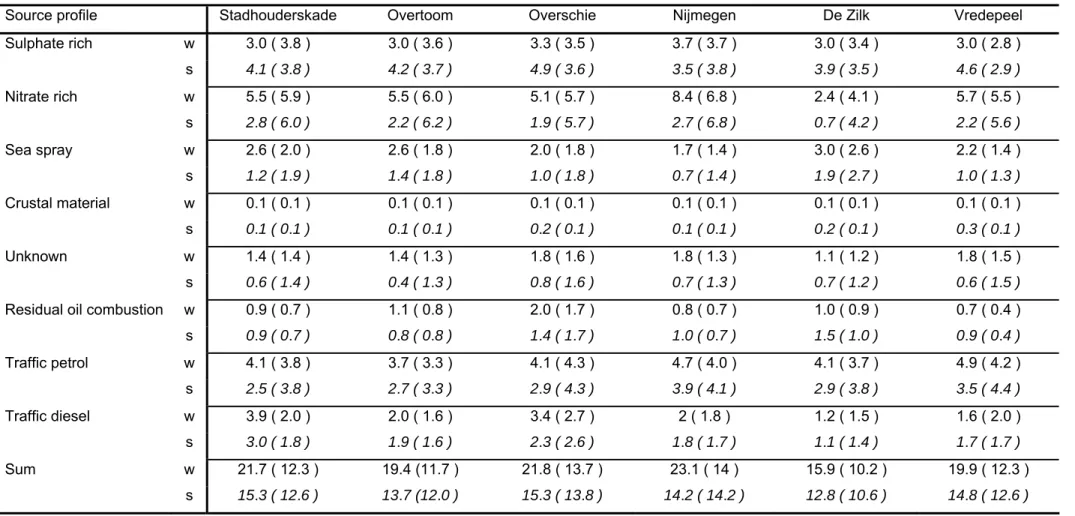
Table 2: Composition of factors from the eight-factor solution PMF factor PMF01 PMF02 PMF03 PMF04 PMF05 PMF06 PMF07 PMF08 Proposed identity Traffic petrol Crustal material Sulphate rich SIA** Unknown Nitrate rich SIA** Residual oil combus tion
Sea spray Traffic diesel NH4 798 1067 Na 89 85 735 30 NO3 0.43 2657 6.5 317 4.3 SO4 23 2191 893 5.8 334 Cl 46 90 115 662 OC* 1508 19 688 52 152 1334 EC* 122 107 3.2 90 60 626 K 44 6 1.5 12 6.8 1.9 17 Al 14 23 7.9 2.9 15 6.3 Br 0.76 0.01 0.6 0.77 0.17 0.43 0.96 Ca 38 5.5 1.2 17 Cr 0.43 0.28 0.26 0.07 0.07 0.58 0.43 Cu 0.16 0.25 0.96 0.11 0.21 0.25 2.7 Fe 12 26 1.6 22 6.3 30 Mn 0.68 0.7 1.2 0.24 0.8 0.29 0.48 Ni 0.32 0.01 0.4 0.01 0.08 2 0.21 0.25 Pb 1.6 13 0.37 2.2 0.62 Rb 0.06 0.13 1.1 0.07 S 426 761 117 57 72 69 Si 15 36 6.1 0.13 3.2 6.1 Sr 0.06 0.13 0.48 0.36 0.06 0.44 0.42 Ti 0.59 1.3 0.27 0.07 0.04 0.7 0.52 0.48 V 1.2 3.9 0.44 Zn 10 7.6 2.5 0.74 1.7 Scale factor (RSD)*** 3.66 (11%) 0.13 (85%) 3.67 (7%) 1.09 (32%) 3.67 (6%) 1.08 (23%) 1.75 (11%) 2.15 (13%) p value <0.0001 0.2374 <0.0001 0.0019 <0.0001 <0.0001 <0.0001 <0.0001 The data are given in ng/m3.
*EC, Elemental carbon; OC, organic carbon; **SIA, secondary inorganic aerosol; ***RSD, relative standard deviation
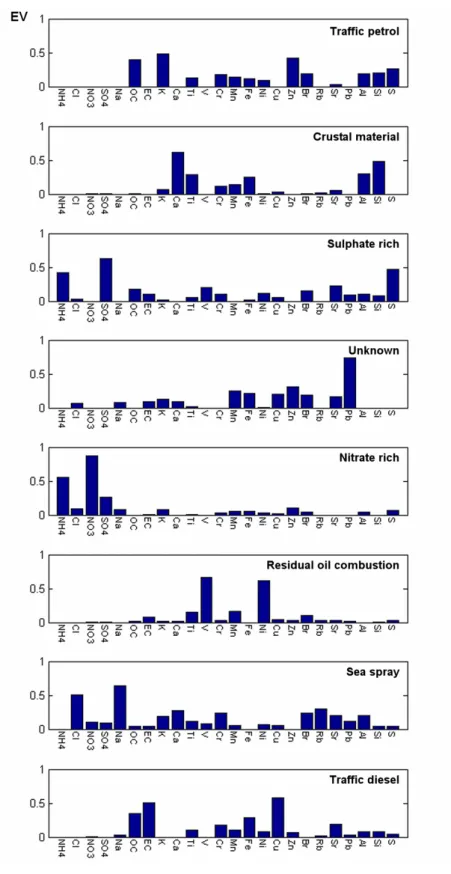
Figure 3: Profiles of the eight-factor solution showing the explained variance (EV) for the species included in the model. The dimensionless quantity EV is a measure of the contribution of each chemical
4.2
Source profile identity
The identities of the sources are explored by examination of the source profiles where the constituents can be compared with known identified source profiles or with a priori knowledge on the composition of sources.
Factor 1 is made up mainly of organic carbon (OC), but no elemental carbon (EC), and some crustal
material. The large contribution of OC, along with some Fe, suggests that factor 1 can be labelled as traffic emission. However, usually some of the EC is associated with the traffic emission profile and it ranges from 20% to 50% of the OC (EPA, 1999). Factor 4 contains some EC, but no OC, and plausible labelling is not possible. Splitting the traffic emission profile into factor 1 and factor 4, where factor 4 contains a signature of other sources as well, is a possibility. For example, Lewis et al. (2003) found a ‘gasoline engine’ profile containing mainly OC and EC (the OC:EC ratio was 3:1) and some Fe (the Fe:OC ratio was 0.047). The petrol-fuelled traffic profile found by Ramadan et al. (2003) contained EC that made up 25% of the total carbonaceous aerosol. It is not surprising that crustal material is included in this factor as traffic is a strong urban source of resuspension of dust particles. In this project, the average source contribution estimate (SCE) ranged from 16% to 23% (Table 3). It is noted that the relative contribution of factor 1 to the total mass is less at street and urban sites than at rural sites. This illustrates the presence of additional local sources in urban environments. In other studies the relative SCEs at urban locations are similar: Atlanta, 22% (Kim et al., 2003); St. Louis, 16% (Lee et al., 2006); Phoenix, 33% (Lewis et al., 2003); and Baltimore-Washington, 32% (Chen et al., 2002). The last SCE is the sum of two profiles; one for the summer (with no nitrate in the profile) and one for the winter. In our study, factor 1 is labelled ‘traffic – petrol’ although it also contains other source contributions related to traffic.
Factor 2 contains the typical elements of crustal material (particularly Si and Al, but also Ca and Fe). It
also includes some organic carbon (OC), as is reported by many authors (Lewis et al., 2003; Lee et al., 2006) and points to detritus from vegetation and other organic soil constituents. The relative SCE is approximately 1%. In other studies the relative SCE reflects the type of environment very well. The SCEs are high for the desert type of environment in Phoenix (22%; Lewis et al., 2003) and the dry urban environment during summer in New York (25%; Li et al., 2004) in contrast to annual averages in Atlanta (1%; Kim et al., 2003) and St. Louis (4%; Lee et al., 2006). Factor 2 is labelled ‘crustal material (CRM)’.
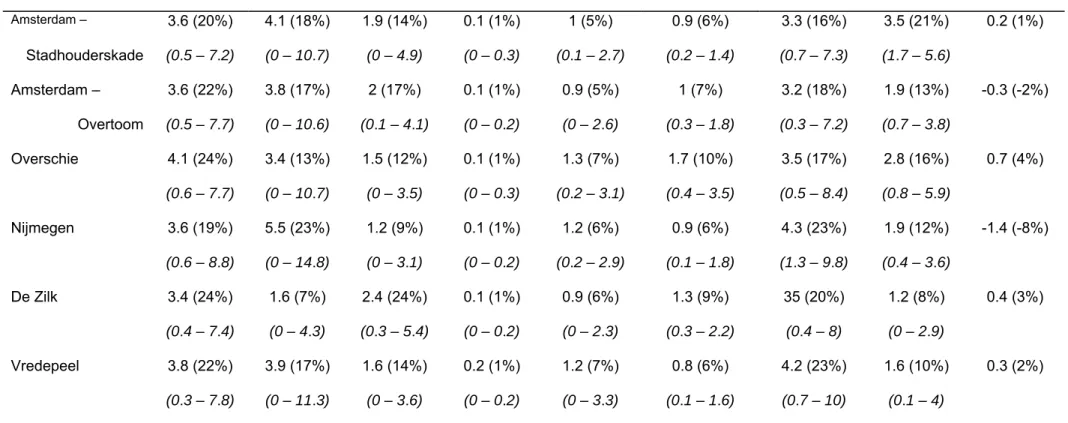
Table 3: Contributions to the total mass at the different sites and the mass missing Total PM2.5 mass Sulphate rich Nitrate rich
Sea Spray Crustal material
Unknown Residual oil combustion Traffic petrol Traffic diesel Missing Amsterdam – 3.6 (20%) 4.1 (18%) 1.9 (14%) 0.1 (1%) 1 (5%) 0.9 (6%) 3.3 (16%) 3.5 (21%) 0.2 (1%) Stadhouderskade (0.5 – 7.2) (0 – 10.7) (0 – 4.9) (0 – 0.3) (0.1 – 2.7) (0.2 – 1.4) (0.7 – 7.3) (1.7 – 5.6) Amsterdam – 3.6 (22%) 3.8 (17%) 2 (17%) 0.1 (1%) 0.9 (5%) 1 (7%) 3.2 (18%) 1.9 (13%) -0.3 (-2%) Overtoom (0.5 – 7.7) (0 – 10.6) (0.1 – 4.1) (0 – 0.2) (0 – 2.6) (0.3 – 1.8) (0.3 – 7.2) (0.7 – 3.8) Overschie 4.1 (24%) 3.4 (13%) 1.5 (12%) 0.1 (1%) 1.3 (7%) 1.7 (10%) 3.5 (17%) 2.8 (16%) 0.7 (4%) (0.6 – 7.7) (0 – 10.7) (0 – 3.5) (0 – 0.3) (0.2 – 3.1) (0.4 – 3.5) (0.5 – 8.4) (0.8 – 5.9) Nijmegen 3.6 (19%) 5.5 (23%) 1.2 (9%) 0.1 (1%) 1.2 (6%) 0.9 (6%) 4.3 (23%) 1.9 (12%) -1.4 (-8%) (0.6 – 8.8) (0 – 14.8) (0 – 3.1) (0 – 0.2) (0.2 – 2.9) (0.1 – 1.8) (1.3 – 9.8) (0.4 – 3.6) De Zilk 3.4 (24%) 1.6 (7%) 2.4 (24%) 0.1 (1%) 0.9 (6%) 1.3 (9%) 35 (20%) 1.2 (8%) 0.4 (3%) (0.4 – 7.4) (0 – 4.3) (0.3 – 5.4) (0 – 0.2) (0 – 2.3) (0.3 – 2.2) (0.4 – 8) (0 – 2.9) Vredepeel 3.8 (22%) 3.9 (17%) 1.6 (14%) 0.2 (1%) 1.2 (7%) 0.8 (6%) 4.2 (23%) 1.6 (10%) 0.3 (2%) (0.3 – 7.8) (0 – 11.3) (0 – 3.6) (0 – 0.2) (0 – 3.3) (0.1 – 1.6) (0.7 – 10) (0.1 – 4) The data are given as averages and percentiles – P10 and P90 –in μg·m-3 and percentages of the total measured mass
Factor 3 contains secondary aerosol (mainly sulphate and some nitrate) and chloride. The ionic balance
(cation/anion) is 0.94, which indicates a small deficit of cations. This deficit might be made up of transition metals in the form of chlorides rather than oxides. Furthermore, this factor contains
substantial amounts of OC and EC, and the indicators for oil combustion V and Ni are also present. The origin of the sulphate is the atmospheric oxidation of SO2, a photochemical process, and it is associated
with long-range transport. Considering the nature of the process, a seasonal variation is expected, and this is indeed observed for this factor (Table 4) for which the SCEs are greater in the summer than in the winter. A similar factor with a similar seasonal pattern is observed in Phoenix (Lewis et al., 2003), in the mid-Atlantic region in the USA (Lee et al., 2003), in the Baltimore-Washington area (Chen et al., 2002) and at the St. Louis Supersite (Lee et al., 2006). All these factors are correlated with SO2 rich
sources. The high OC:EC ratio in the profile found in this study indicates a secondary organic aerosol contribution, similar to the profiles in the studies cited, and this is in line with the photochemical nature of the profile. The concurrence of the secondary aerosol and the indicators for oil combustion suggests oil combustion as the source of the precursor SO2. Factor 3 is labelled ‘sulphate rich’.
Factor 4 contains sea salt indicators (Na and Cl) and the combustion and smelter indicators EC, Fe, Cu,
Zn, and Pb. As already mentioned, this factor might partially come from the traffic factor (factor 1). The heavy metal contribution might be due to a mixed profile that includes non-ferrous smelter emissions (Lee et al., 2006). As insufficient conclusive information is available, this factor is labelled ‘unknown’.
Factor 5 is made up mainly of secondary aerosol and sea salt particles – 66% nitrate, 29% sulphate,
and 5% chloride with counter ions consisting of 94% NH4 and 6% Na. The mass of the other elements
is negligible. The ratio of these cations and anions (ionic balance) is 0.98 – only a minor deficit of cations possibly to be found in the remaining elements. The depletion of chloride, indicating the ‘age’ of the aerosol, is 25%. A seasonal pattern is expected as temperature greatly affects the equilibrium of ammonium nitrate, ammonia, and nitric acid. Low temperature during winter favours the formation of the particulate form. The concentration of ammonia in the Dutch atmosphere is such that NO3 is fully
neutralized, as is sulphate. The origin of nitrate is the oxidation of NO2 emitted by combustion
processes, mainly traffic. Although some EC and OC would be expected to be associated with this profile, only a trace of EC, and no OC, is coupled to this profile in this study. Lee et al. (2006) report a correlation of OC with some EC, as do Kim et al. (2003).The average local relative SCE in our study ranged from 7% (De Zilk) to 23% (Nijmegen). Lee et al. (2006) report 15% in St. Louis, whereas Kim et al. (2003) report only 7% in Atlanta, and Li et al.(2004) reports 8% in New York during the month of July. Again, the temperature during the study period explains the difference of the SCEs. In our study, factor 5 is labelled ‘nitrate rich‘.
Factor 6 contains more EC than OC; EC and OC are found together with the tracers for oil combustion
and incineration, namely, V and Ni. Factor 6 also contains some sulphate and nitrate without counter ions such as ammonium or sodium. The anions may be primarily emitted by the oil combustion and incineration process. In other studies, this factor is not always part of the suite of source profiles. Factor 6 is labelled ‘residual oil combustion’.
(Sheesley et al., 2004; Avery et al., 2006; Teinilä et al., 2003; Kerminen et al., 1999). The EC
associated with this factor is thought to be adsorbed during transport over sites where EC is emitted or to be mixed with air masses loaded with EC. The traces of potassium and calcium are mainly
associated with the sea salt particles, but this profile also contains some non-sea-salt potassium or calcium. Silicon and aluminium are crustal tracers, so they indicate some crustal material in this factor. Moderate to high wind speed is the common factor in processes generating sea spray aerosol and resuspension of dust. The label for factor 7 is ‘sea spray’.
Factor 8 is characterized by large proportions of both OC and EC (making up 93% of the mass of the
factor) and the large proportion of iron without the corresponding high concentrations of the other crustal indicators Si and Al. These characteristics suggest diesel traffic as the source of this profile. The low concentration of the crustal indicators Si and Al indicate a trace of crustal material in this factor. As heavy traffic is mainly fuelled by diesel, the association of crustal material is in line with Bloemen’s (Bloemen and Van Putten, 1998) and Moosmuller’s (Moosmuller et al.1998) findings that mainly heavy trucks cause resuspension of dust deposited on the road and the road shoulders. Although no sulphate is associated with this factor, some sulphur-containing compounds are (69 ng/m3). The average SCE in this study ranges from 8% (De Zilk) to 21% (Amsterdam – Stadhouderskade). Factor 8 is labelled ‘traffic – diesel’.
The basic assumption of source apportionment techniques, such as PMF, is that the data set of mass concentrations can be reconstructed with a limited number of factors that are restricted by the non-negativity of the factors themselves and the terms of the factors. The driving force in processing the data is the variance caused by the variability of the source strength and/or the dispersion capability of the atmosphere. The variation of the strengths of the different sources might be correlated.
Examples of such sources are tailpipe emissions and resuspension of road dust and the atmospheric gas-to-particle conversion processes generating secondary inorganic and organic aerosol from precursors originating from different, uncorrelated sources. In limited data sets, the probability of simultaneous variation of source strength and specific meteorological conditions is considerable so that factors may contain emissions from different sources.
The present data set contains the composition of 79 samples for six sites. As the meteorological conditions over the project area usually differ only slightly, correlation of the mass concentration and the composition is likely. This fact is in line with the observation that most of the factors are probably a mix of different source profiles and, consequently, we must consider this in evaluating the various contributions.
The studies cited in this report are usually based on samples collected at a single site for long periods (1 to 3 years), which have produced 700 to 1000 more or less independent samples. Only in some instances are fewer samples used: Li et al. (2004) have successfully evaluated 140 valid samples collected in only 1 month, but they used unusually short 6-h intervals. Thurston et al. (2005) have recently published the results of a workshop stating that continuous daily samples over at least 1 year are required to successfully apportion the sources for its main purposes, which now include
longitudinal health-effect studies.
Another complication is the identity of the factors 3 and 5 (sulphate rich and nitrate rich). As already discussed, these profiles are the result of gas-to-particle-conversion atmospheric processes that involve
A clear distinction between these profiles is rarely found with tools other than source apportionment. The distinction, based on the composition and the temporal behaviour, is the result of the combination of atmospheric conditions and the temporal pattern of the different sources. Consequently, it can not lead to the identification of the various real sources of the inorganic precursors (SO2, NOX and NH3).
The main sources can be found only indirectly.
The precursors are emitted mainly by traffic, energy production processes, and agricultural activities. Bloemen et al. (1998) quantify the annual averaged contributions to the total PM10 secondary aerosol
concentrations. Of all the Dutch sources, traffic and agriculture contributed the most (19% of the total PM10 secondary aerosol concentrations), and of all the foreign sources, energy production and traffic
were the most dominant (61% of the total PM10 secondary aerosol concentrations) – a total of 80%. In
addition, natural emissions, particularly gaseous organic compounds, are converted to particles in the same atmospheric processes that are the basis for the formation of inorganic secondary aerosol. Although these are modelled PM10 contributions, we expect that they are similar to the PM2.5 fraction.
0% 10% 20% 30% 40% 50% 60% 70% 80% 90% 100%
Stadhouderskade Overtoom Overschie Nijmegen De Zilk Vredepeel
Traffic diesel Traffic petrol mix Residual oil combustion Crustal material Sea spray Nitrate rich Sulphate rich
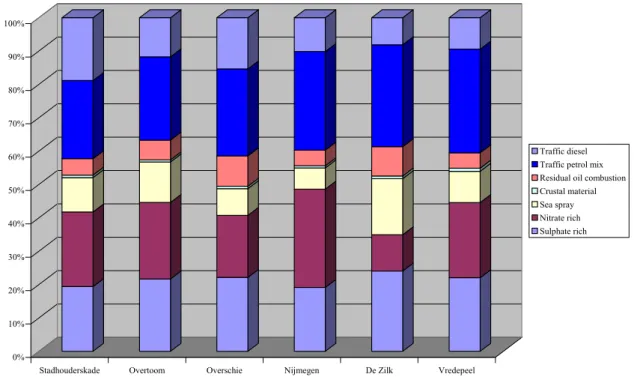
Figure 4: Relative source contributions for each of the six sampling sites. The Traffic petrol mix profile is a combination of the unknown and the Traffic petrol profile.
4.3
Predicted mass
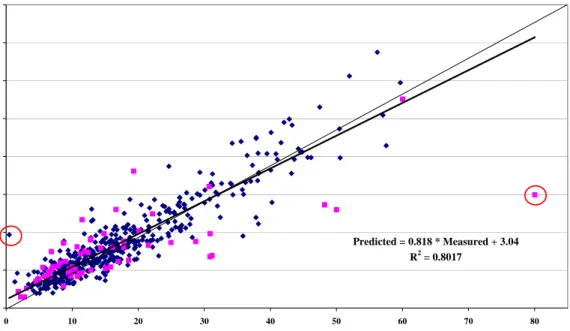
Figure 5 presents the comparison of the sum of the contributions of all factors to the PM2.5 mass and the
measured mass. In total, 61 samples have been completed by imputation (pink dots). Two samples have been omitted from the regression calculation as outliers (circled in the graph): one sample had a low measured mass but a substantial predicted mass, and the imputed mass of one sample was too large. The regression is characterized by:
Masspred = 0.818 x Massmeas + 3.04, N = 472 and R2 = 0.80
The model underestimates the mass by 18% on average. Other studies report similar results: Lee et al. (2006) in St Louis: 88%, R2 = 0.89 and a ten-factor solution; Kim et al. (2003) in Atlanta: 68%, R2 = 0.83 with an eight-factor solution; 87%, R2 = 0.91 with a nine-factor solution; Lewis et al. (2003)
in Phoenix: 100%, R2 = 0.97, but without the low-concentration samples.
Predicted mass versus Measured mass
Predicted = 0.818 * Measured + 3.04 R2 = 0.8017 0 10 20 30 40 50 60 70 80 0 10 20 30 40 50 60 70 80 Measured mass (µg/m3) Pre d icte d (µ g/m 3 )
Figure 5: Comparison of measured mass and predicted mass based on the contributions of all factors. The pink dots are the results from imputed sample composition of one or more of the components. Two samples (circled dots) are excluded from the model. The diagonal is the 1:1 line.
4.4
Correlation of factors
Interreceptor correlation of SCEs (see Appendices 1 and 2) can be interpreted as temporal correlation and is expected to be non-zero, as would be in the case for conventional principal component analysis that requires physically unrealistic orthogonality. Meteorological conditions create some correlation among emissions that are not necessarily related. Other factors that define interreceptor correlation are their temporal source-strength pattern and the geographical orientation relative to the receptor. Inverse interreceptor correlation indicates processes that have an opposite effect on the dispersion of the emissions. Finally, interreceptor correlation can be the result of a split of PMF factors due to the selection of too many factors.
Evaluation of the interreceptor correlation revealed that good correlation exists between the traffic – petrol factor and the unknown factor at all sites, which lends itself to the suggestion that these factors are linked and possibly the result of a split in the PMF processing. The interreceptor correlation of the sea spray factor with all the other factors is negative and ranges from -0.04 to -0.66, which is in line with the notion that high dispersion conditions favour the decrease of the concentrations of all the factors but sea spray.
Intrareceptor correlation of SCEs for the various factors at the different receptor sites can be interpreted as the spatial correlation. It reflects the local or regional nature of the factors and is useful for
substantiating the identity of the factors. Evaluation of the intrareceptor correlation indicates that the sum of the PM2.5 masses, both secondary inorganic aerosol, and sulphate and nitrate rich, are well
correlated (R2 > 0.7) in space. This illustrates the regional nature of these sources. The traffic-petrol and unknown factors are also well intrareceptor correlated. The sea spray factor is correlated only across relatively short distances; at the receptors in Nijmegen and Vredepeel in the east of the country, this factor shows some correlation and it is separated from the cluster of the factors at the western receptor sites. We found no correlation whatsoever for the oil combustion and crustal material factors, which shows that the proximity of the source and/or the local conditions influence these factors. The wind directional analysis (see Appendix 5) shows that for each of the urban and street receptor sites the patterns for the traffic profiles (petrol, diesel and unknown) are similar. At the rural and marine site the diesel pattern shows different behaviour. Crustal material contributions (CRM) are more locally determined, in line with the intrareceptor correlation analysis. Sulfate-rich source profile contributions are mainly from the north-east and the south-west direction, the two main wind directions over the year, transporting air pollution over long distances. Sea spray contribution is found only in the westerly wind directions. Residual oil combustion contributions are found over a wide range of wind directions as is expected from (partially) local source type. The results of the wind directional analysis supports the results of the correlation analysis.
4.5
Temporal variation of source contributions
Table 4, presented on the following page, gives the seasonal variation of the SCEs. The sum of PM2.5 mass (the traffic – petrol and the correlated unknown factor, the sea spray, the nitrate-rich, and
the oil combustion factors) is clearly greater in winter than in summer. The sulphate-rich factor is greater in summer than in winter. For the traffic diesel only, the urban and suburban receptor sites exhibit greater average concentrations in winter. We observed no differences at the rural sites De Zilk and Vredepeel.
Figures 6 and 7 shows the day-to-day source contributions of the eight factors for respectively the street and marine locations. The low- and high-frequency sampling protocols (high in February and June 1999) show up in the graphs, but do not necessarily reflect the day-to-day variance; this effect is merely the consequence of the type of graph used here. In general, the temporal variation of the total mass reflects the sum of the contributions. However, especially for days with high mass concentrations, the summed contributions underestimate the total PM2.5 mass concentration. This might be a consequence
of having to deal with mixed source profiles. In general, when two or more profiles of a mix exist in a rather stable ratio in high PM mass conditions, this ratio may shift, and part of the mass of one of the profiles is not accounted for. With the available data, no conclusive identification of the profile is feasible. The levels of the SCEs on the sites have approximately the same temporal pattern.
Two periods of high concentrations occurred during the project period. The first period (20 November to 8 December 1998) is characterized by high contributions from both secondary inorganic aerosol profiles (sulphate rich and nitrate rich), whereas the contribution of nitrate-rich profiles dominates in the second period (6 March to 30 March 1999). Both traffic sources contribute more on days in these periods than on low-concentration days. The sea spray source forms an exception. The contribution is high when the contribution of the others is relatively low. This fits in with the discussion about the model profiles: wind is a factor that generates the sea spray aerosol and at the same time increases the dispersion of other sources. The CRM would follow the same pattern, but its contribution to the PM2.5 mass is rather low (1% – 2%). An exception to this is the CRM contribution on 23 April at the
Vredepeel site (34% and a total mass of 14 μg/m3). The meteorological conditions (wind velocity of 1 – 4 m/s and a temperature of 12°C) are not extreme, and therefore do not explain this large
Table 4: Seasonal source contributions to the mass concentrations
Source profile Stadhouderskade Overtoom Overschie Nijmegen De Zilk Vredepeel Sulphate rich w 3.0 ( 3.8 ) 3.0 ( 3.6 ) 3.3 ( 3.5 ) 3.7 ( 3.7 ) 3.0 ( 3.4 ) 3.0 ( 2.8 ) s 4.1 ( 3.8 ) 4.2 ( 3.7 ) 4.9 ( 3.6 ) 3.5 ( 3.8 ) 3.9 ( 3.5 ) 4.6 ( 2.9 ) Nitrate rich w 5.5 ( 5.9 ) 5.5 ( 6.0 ) 5.1 ( 5.7 ) 8.4 ( 6.8 ) 2.4 ( 4.1 ) 5.7 ( 5.5 ) s 2.8 ( 6.0 ) 2.2 ( 6.2 ) 1.9 ( 5.7 ) 2.7 ( 6.8 ) 0.7 ( 4.2 ) 2.2 ( 5.6 ) Sea spray w 2.6 ( 2.0 ) 2.6 ( 1.8 ) 2.0 ( 1.8 ) 1.7 ( 1.4 ) 3.0 ( 2.6 ) 2.2 ( 1.4 ) s 1.2 ( 1.9 ) 1.4 ( 1.8 ) 1.0 ( 1.8 ) 0.7 ( 1.4 ) 1.9 ( 2.7 ) 1.0 ( 1.3 ) Crustal material w 0.1 ( 0.1 ) 0.1 ( 0.1 ) 0.1 ( 0.1 ) 0.1 ( 0.1 ) 0.1 ( 0.1 ) 0.1 ( 0.1 ) s 0.1 ( 0.1 ) 0.1 ( 0.1 ) 0.2 ( 0.1 ) 0.1 ( 0.1 ) 0.2 ( 0.1 ) 0.3 ( 0.1 ) Unknown w 1.4 ( 1.4 ) 1.4 ( 1.3 ) 1.8 ( 1.6 ) 1.8 ( 1.3 ) 1.1 ( 1.2 ) 1.8 ( 1.5 ) s 0.6 ( 1.4 ) 0.4 ( 1.3 ) 0.8 ( 1.6 ) 0.7 ( 1.3 ) 0.7 ( 1.2 ) 0.6 ( 1.5 )
Residual oil combustion w 0.9 ( 0.7 ) 1.1 ( 0.8 ) 2.0 ( 1.7 ) 0.8 ( 0.7 ) 1.0 ( 0.9 ) 0.7 ( 0.4 ) s 0.9 ( 0.7 ) 0.8 ( 0.8 ) 1.4 ( 1.7 ) 1.0 ( 0.7 ) 1.5 ( 1.0 ) 0.9 ( 0.4 )
Traffic petrol w 4.1 ( 3.8 ) 3.7 ( 3.3 ) 4.1 ( 4.3 ) 4.7 ( 4.0 ) 4.1 ( 3.7 ) 4.9 ( 4.2 ) s 2.5 ( 3.8 ) 2.7 ( 3.3 ) 2.9 ( 4.3 ) 3.9 ( 4.1 ) 2.9 ( 3.8 ) 3.5 ( 4.4 )
Traffic diesel w 3.9 ( 2.0 ) 2.0 ( 1.6 ) 3.4 ( 2.7 ) 2 ( 1.8 ) 1.2 ( 1.5 ) 1.6 ( 2.0 ) s 3.0 ( 1.8 ) 1.9 ( 1.6 ) 2.3 ( 2.6 ) 1.8 ( 1.7 ) 1.1 ( 1.4 ) 1.7 ( 1.7 )
Amsterdam-Stadhouderskade 0 10 20 30 40 50 60 70 80 28/8 11/9 25/9 9/10 23/10 6/11 20/11 4/12 18/12 1/1 15/1 29/1 12/2 26/2 12/3 26/3 9/4 23/4 7/5 21/5 4/6 18/6 2/7 16/7 30/7 13/8 27/8 date: 1998-1999 c ont ri bu tion (µ g/m 3) Traffic Diesel Traffic Petrol Mix Res Oil Combustion Unknown CRM Sea Salt Mix Nitrate Rich Mix Sulfate Rich Total Mass
Figure 6: Source contributions (in μg/m3) at the Amsterdam street site Stadhouderskade
De Zilk 0 10 20 30 40 50 60 70 80 28/8 11/9 25/9 9/10 23/10 6/11 20/11 4/12 18/12 1/1 15/1 29/1 12/2 26/2 12/3 26/3 9/4 23/4 7/5 21/5 4/6 18/6 2/7 16/7 30/7 13/8 27/8 date: 1998-1999 c ont ri bu tion (µ g/m 3) Traffic Diesel Traffic Petrol Mix Res Oil Combustion Unknown CRM Sea Salt Mix Nitrate Rich Mix Sulfate Rich Total Mass
Figure 7: Source contributions (in μg/m3) at the marine site De Zilk.
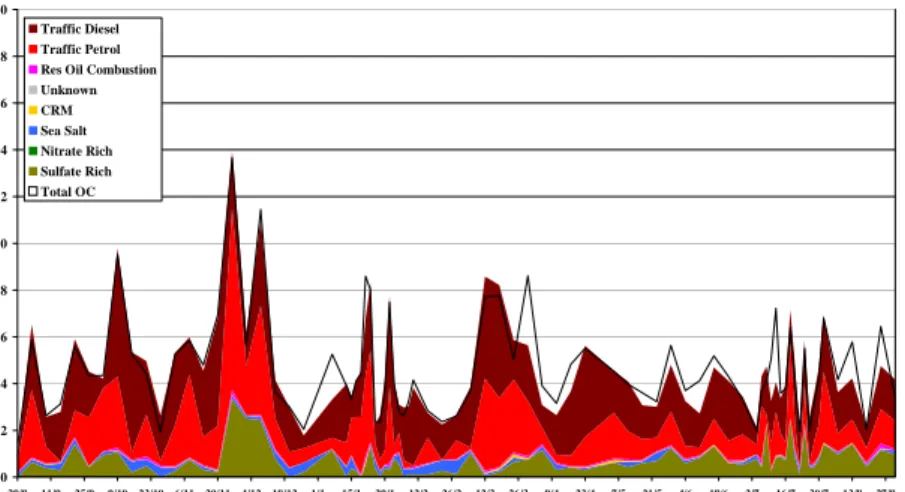
If not mass but the OC content of PM2.5 is normalized, the contribution of the various sources to the OC
can be calculated. Figure 8 and 9 show the day-to-day variation and Table 5 shows the average contribution for the period. If the emissions of both traffic sources and the oil combustion source are considered primary organic aerosol and the organic portion of the sulphate-rich, CRM and sea spray profiles are considered secondary, the ratio at the Amsterdam – Stadhouderskade site is 79% primary to 21% secondary, and the ratio at the De Zilk site is 64% primary to 36% secondary aerosol. The values are similar to estimates for other European locations (Castro et al., 1999).
Amsterdam-Stadhouderskade 0 2 4 6 8 10 12 14 16 18 20 28/8 11/9 25/9 9/1023/106/1120/114/12 18/12 1/1 15/1 29/1 12/2 26/2 12/3 26/3 9/4 23/4 7/5 21/5 4/6 18/6 2/7 16/7 30/7 13/8 27/8 date 1998-1999 cont ri but io n ( µ g/m 3) Traffic Diesel Traffic Petrol Res Oil Combustion Unknown CRM Sea Salt Nitrate Rich Sulfate Rich Total OC
Figure 8: Contribution to the OC carbonaceous mass at the traffic location in the Amsterdam street site Stadhouderskade. De Zilk 0 2 4 6 8 10 12 14 16 18 20 28/8 11/9 25/9 9/1023/106/1120/114/12 18/12 1/1 15/1 29/1 12/2 26/2 12/3 26/3 9/4 23/4 7/5 21/5 4/6 18/6 2/7 16/7 30/7 13/8 27/8 date 1998 - 1999 cont ri but io n ( µ g/m 3) Traffic Diesel Traffic Petrol Res Oil Combustion Unknown CRM Sea Salt Nitrate Rich Sulfate Rich Total Mass
Table 5: Contribution to concentrations of organic carbon at the various sites and the mass missing Total organic carbon Sulphate rich Nitrate rich
Sea spray Crustal material
Unknown Residual oil combustion Traffic petrol Traffic diesel Missing Amsterdam- 0.7 (15%) 0 (0%) 0.16 (5%) 0.03 (1%) 0 (0%) 0.06 (2%) 1.43 (28%) 2.12 (49%) 0.12 (3%) Stadhouderskade (0.09 - 1.41) (0 - 0) (0 - 0.4) (0.01 - 0.05) (0 - 0) (0.02 - 0.1) (0.3 - 3.13) (1.05 - 3.41) Amsterdam- 0.7 (20%) 0 (0%) 0.16 (7%) 0.02 (1%) 0 (0%) 0.07 (2%) 1.38 (35%) 1.19 (35%) 0.04 (1%) Overtoom (0.11 - 1.52) (0 - 0) (0.01 - 0.33) (0 - 0.05) (0 - 0) (0.02 - 0.12) (0.15 - 3.09) (0.41 - 2.34) Overschie 0.8 (21%) 0 (0%) 0.12 (5%) 0.03 (1%) 0 (0%) 0.12 (3%) 1.51 (30%) 1.74 (40%) -0.21 (-5%) (0.12 - 1.51) (0 - 0) (0 - 0.29) (0.01 - 0.06) (0 - 0) (0.03 - 0.24) (0.22 - 3.62) (0.51 - 3.63) Nijmegen 0.7 (18%) 0 (0%) 0.1 (4%) 0.03 (1%) 0 (0%) 0.06 (2%) 1.84 (44%) 1.15 (30%) 0.14 (4%) (0.12 - 1.73) (0 - 0) (0 - 0.25) (0 - 0.05) (0 - 0) (0.01 - 0.12) (0.55 - 4.21) (0.23 - 2.2) De Zilk 0.68 (23%) 0 (0%) 0.2 (12%) 0.02 (1%) 0 (0%) 0.09 (4%) 1.49 (38%) 0.71 (22%) -0.14 (-4%) (0.08 - 1.44) (0 - 0) (0.02 - 0.44) (0 - 0.05) (0 - 0) (0.02 - 0.15) (0.16 - 3.45) (0 - 1.75) Vredepeel 0.75 (21%) 0 (0%) 0.13 (6%) 0.04 (1%) 0 (0%) 0.05 (2%) 1.82 (44%) 0.99 (25%) -0.04 (-1%) (0.06 - 1.53) (0 - 0) (0 - 0.3) (0 - 0.05) (0 - 0) (0.01 - 0.11) (0.31 - 4.29) (0.06 - 2.42)
4.6
Annual average source contribution
Figure 10 presents the mean annual average source contributions at urban background sites (Overtoom, Overschie, and Nijmegen). At the Stadhouderskade location (street type), the contribution of diesel traffic is approximately 30% higher, whereas the contribution at the marine and agriculture sites are 70% and 50% lower, respectively, than the annual average. The contributions of the other sources are more or less similar at the sites except for De Zilk. Here the contribution of sea spray is 50% higher and the contribution of the nitrate-rich profile 60% lower than the annual average of this type of site. These results illustrate the great similarity between the sites, which is greater than would be expected on the basis of the characteristics of the sites.
Sulphate rich 21% Nitrate rich 24% Sea spray 9% Crustal material 1% Residual oil combustion
7% Traffic petrol mix
26%
Traffic diesel 12%
Figure 10: Annual average source contribution (in percentages) for the urban background sites (averaged contributions from the sites Overtoom, Overschie and Nijmegen). The Traffic petrol mix profile is a combination of the unknown and the Traffic petrol profile.
5
Conclusion and recommendations
We have successfully applied current state-of-the-art source apportionment methodology to data obtained in a previous study. An appropriate mass closure confirmed the completeness of the list of components. This re-analysis of the data revealed eight factors that describe the PM2.5 data optimally.
However, most, if not all, of these factors are probably a mixture of source profiles correlated to such a degree that this limited data set (six sites and 79 days) has insufficient statistical power to separate all relevant profiles. Two factors (factors 1 and 4) were the result of a profile split in the processing and needed to be evaluated in combination.
Nevertheless, the remaining seven mixed profiles were identifiable either by their main sources or by the main atmospheric processes generating the particles in the profile. The contributions of these factors explained the observed mass well. The intrareceptor and interreceptor correlations of the SCEs pointed out the temporal and spatial nature of the source and confirmed the proposed identity based on the composition of the profiles. In this study and in a number of studies conducted in Europe and North America, we found remarkable agreement between the profiles, the relative contributions, and in most cases, the absolute contributions as well.
No large differences exist between source contributions at the various sites in this study: significant site-type-related differences were measured only for the diesel traffic contributions at the street location and for the sea spray and nitrate-rich profile contributions at the marine site. Overall, 38% of the PM2.5 mass concentrations on urban background sites is accounted for by the particulate traffic
emissions (12% diesel and 26% petrol, which include resuspension and other related processes) and 7% is accounted for by residual oil combustion and related sources. Ten percent of the mass on urban background sites is related to emission from natural sources – sea spray and crustal material, the latter probably wind driven. Forty-five percent of the mass on urban background sites is related to the secondary aerosol formation processes fuelled by precursor emissions from traffic, energy production, and agriculture (21% sulphate-rich and 24% nitrate-rich profiles). Some of the organic aerosol might be of natural origin. While 64% – 79% of the carbonaceous aerosol on all six sites is accounted for by traffic and is considered primary organic aerosol, 15% – 23% is accounted for by the sulphate-rich profile and is considered substantially secondary aerosol. Other sources contribute a maximum of 10% to the carbonaceous aerosol. The sum of PM2.5 mass (the traffic – petrol and the correlated unknown
factor, the sea spray, the nitrate-rich, and the oil combustion factors) is clearly greater in winter than in summer. The sulphate-rich factor is greater in summer than in winter. For the traffic diesel only, the urban and suburban receptor sites exhibit greater average concentrations in winter. Although the data dates back more than 10 years, we consider the overall picture of the PM in this study still valid.
The results of this study illustrate the potency of the source apportionment methodology in finding quantitative source contributions. The close examination of the results confirms the identity and contribution of the mixed sources and shows the similarity in composition and behaviour of the profiles found in other studies located elsewhere.
A relevant shortcoming of this study is the lack of sufficient statistical power to separate major sources from minor ones. This can only be overcome by a more frequent and longer sampling plan (preferably daily for at least 1 year) and possibly a wider range of parameters, elements, and certainly a selection of the many organic compounds that many researchers nowadays identify in PM. The number of sites is mainly defined by the spatial resolution expected to be realistic for studying the relationship of exposure to sources of PM and adverse health effects.
References
Avery Jr., G.B., Kieber R.J., Witt M., Willey J.D., (2006). Rainwater monocarboxylic acid concentration in southern North Carolina, USA, as a function of air-mass back-trajectory. Atmospheric Environment, 40(9), 1683-1693.
Baccarelli A., Pfeiffer R., Consonni D., Pesatori A.C., Bonzini M., Patterson D.G., Bertazzi P.A., Landi M.T., 2005. Handling of dioxin measurement data in the presence of non-detectable values: Overview of available methods and their application in the Seveso chloracne study. Chemosphere 60, 898 – 906.
Birch M.E. and Cary R.A.,1996. Elemental Carbon-based method for monitoring occupational exposures to particulate diesel exhaust. Aerosol Science and Technology, 25: 221 – 241. Bloemen H.J.Th., Gerlofs-Nijland M.E., Janssen N.A.H., Sandstrom T., Bree L. van, Cassee F.R.,
2005. Chemical characterization and source apportionment estimates of particulate matter collected within the framework of EU project HEPMEAP. RIVM Report 863001002.
Bloemen H.J.Th , Putten E.M. van, Tenbrink H., 2008. The Bronstof project technical report and data evaluation. RIVM Report in preparation.
Bloemen H.J.Th., Bree L. van, Buringh E., Fischer P.H., Loos S. de, Marra M., Rombout P.J.A., 1998. Particulate matter in the Netherlands. A mid-term review. RIVM Report 650010006.
Bloemen H.J.T. and Putten E.M. van, 1998. Mobile Emission Factor Determination through Ambient Air Monitoring - MEDAM project. RIVM Report 723301008.
Cassee F.R., Fokkens P.H.B., Leseman D.L.A.C, Bloemen H.J.Th., Boere A.J.F., 2003. Respiratory Allergy and Inflammation Due to Ambient Particles (RAIAP) Collection of Particulate Matter samples from 5 European sites with High Volume Cascade Impactors. RIVM Report 863001001. Castro L.M., Pio C.A., Harrison R.M., Smith D.J.T., 1999. Carbonaceous aerosol in urban and rural
European atmospheres: estimation of secondary organic carbon concentrations. Atmospheric Environment 33: 2771-2781.
CEC, 2005. Thematic Strategy on Air pollution – COM (2005) 1132 Final. Available at http://eur-lex.europa.eu/ (February 4th, 2008).
Chen L.W.A, Doddridge B.G, Dickerson R.R., Chow J.C., Henry R.C., 2002. Origins of fine aerosol mass in the Baltimore-Washington corridor: implications from observation, factor analysis and ensemble air parcel back trajectories. Atmospheric Environment 36, 4541-4554.
Chen L.W.A., Doddridge B.G., Dickerson R.R., Chow J.C., Henry RC., 2002. Origins of fine aerosol mass in the Baltimore-Washington corridor: implications from observation, factor analysis, and ensemble air parcel back trajectories. Atmospheric Environment, 36: 4541 – 4554.
Coulter T.C., Wagoner R.A., Lewis C.W., 2004, Chemical Mass Balance Model: EPA-CMB8.2. EPA Report 452/R-04-11.
Council Directive 1999/30/EC of 22 April 1999 relating to limit values for sulphur dioxide, nitrogen dioxide and oxides of nitrogen, particulate matter and lead in ambient air.
Dzubay T.G. and Stevens R.K., 1988. A Composite Receptor Model Applied to Philadelphia Aerosol. Environ. Sci. Technol., 22, 46-52, 1988.
EU, Council Directive 1999/30/EC of 22 April 1999, Official Journal of the European Communities L163 at http://eur-lex.europa.eu.
EPA, 1999. Composition of Particulate Matter Source Emissions. Appendix D in: Air quality criteria for particulate matter, Volume 1. EPA/600/P-99/002aF.
EPA, 2006. EPA-SPECIATE: database and report available at
http://www.epa.gov/ttn/chief/software/speciate/ (February 4th, 2008).
Gerlofs-Nijland M.E., Dormans J.A.M.A., Bloemen H.J.Th., Janssen N.A.H., Sandström T., Bree, L. van, Cassee F.R., 2006. Health effects caused by coarse and fine PM from sites with contrast in traffic density II: pathological effects in lungs of spontaneously hypertensive rats. Publication in preparation.
Gleit A., 1985. Estimation for small normal data sets with detection limits. Environmental Science & Technology 19, 1201 – 1206.
Hannigan M.P., Busby jr. W.F., Cass G.R., 2006. Source contributions to the mutagenicity of urban air pollution. Journal of the Air & Waste Management Association 55, 339-410.
Helsel D.R., 1990. Less than obvious - statistical treatment of data below the detection limit. Environmental Science & Technology 24, 1766 – 1777.
Henry R.C., Lewis C.W., Collins J.F., 1994. Vehicle-related hydrocarbon source compositions from ambient data: The GRACE/SAFER method. Environmental Science and Technology 28, 823 – 832.
Hopke P.K., Liu C., Rubin D.B., 2001. Multiple imputation for multivariate data with missing and below-threshold measurements: time-series concentrations of pollutants in the Arctic. Biometrics 57, 22 – 33.
Hopke P.K., Ito K., Mar T., Christensen W.F., Eatough D.J., Henry R.C., Kim E., Laden F., Lall R., Larson TV., Liu H., Neas L,. Pinto J., Stolzel M., Suh H., Paatero P., Thurston G.D., 2006. PM source apportionment and health effects: 1. Intercomparison of source apportionment results. Journal of Exposure Science and Environmental Epidemiology 16 (3), 275-286.
Ibrahim J.G., Chen M-H., Lipsitz S.R., Herring A.H., 2005. Missing-data methods for generalized linear models: a comparative review. Journal of the American Statistical Association (100), 332 – 346.
Jaarsveld J.A. van, 1995. Modelling the long-term atmospheric behaviour of pollutants on various spatial scales. Ph.D. Thesis, Utrecht University, the Netherlands.
Kerminen V.M., Teinila K., Hillamo R., Makela T., 1999. Size segregated chemistry of particulate dicarboxylic acids in the Arctic atmosphere. Atmospheric Environment 33 (13), 2089 - 2100. Kim E. and Hopke P.K., 2005. Identification of fine particle sources in mid-Atlantic US area. Water
Air and Soil Pollution 168, 391 – 421.
Kim E., Hopke P.K., Edgerton E.S., 2003. Source identification of Atlanta aerosol by positive matrix factorization. Journal of the Air and Waste Management Association, 53, 731-739.
Kim E., Hopke P.K., Paatero P., Edgerton E.S., 2003. Incorporation of parametric factors into multilinear receptor model studies of Atlanta aerosol. Atmospheric Environment 37(36), 5009-5021.
Lee J.H., Yoshida Y., Turpin B.J., Hopke P.K., Poirot R.L., Lioy P.J., Oxley J.C., 2003. Identification of Sources Contributing to Mid-Atlantic Regional Aerosol. Journal of the Air & Waste
Management Association 52, 1186 – 1205.
Lee J.H., Hopke P.K., Turner J.R., 2006. Source identification of airborne PM2.5 at the St. Louis-Midwest Supersite. Journal of Geophysical Research Atmospheres 111, 1-12.
Lee E., Chan C.K., Paatero P., 1999. Application of positive matrix factorization in source
apportionment of particulate pollutants in Hong Kong. Atmospheric Environment 33 (19), 3201-3212.
Lewis C.W., Norris G.A., Conner T.L., Henry R.C., 2003. Source apportionment of Phoenix PM2.5 aerosol with the Unmix receptor model. Journal of the Air and Waste Management Association. 53 (3), 325-339.