The Future of the Global Environment: A Model-based Analysis Supporting UNEP's First Global Environment Outlook
170
0
0
Hele tekst
(2) The Future of the Global Environment: A Model-based Analysis Supporting UNEP's First Global Environment Outlook Jan Bakkes and Jaap van Woerden (eds.) Joseph Alcamo Marcel Berk Pieter Bol Gert Jan van den Born Ben ten Brink Jean-Paul Hettelingh Louis Niessen Fred Langeweg Rob Swart. research for man and environment. RIJKSINSTITUUT VOOR VOLKSGEZONDHEID EN MILIEU NETHERLANDS INSTITUTE OF PUBLIC HEALTH AND THE ENVIRONMENT. United Nations Environment Programme. UNEP.
(3) Units, conversion factors and symbols kilo (k) Mega (M) Giga (G) Tera (T) Peta (P) Exa (E). 103 106 = million 109 = billion 1012 = trillion 1015 1018. ton Mton 1 ha J cal ppmv. metric ton = 1000 kg million ton = 1012 g = Tg 10,000 m2 Joule calorie = 4.2 J parts per million by volume. N P S C CO2 SO2 NOx. Nitrogen Phosphorus Sulpur Carbon Carbon dioxide Sulphur dioxide Nitrogen oxides. GDP GNP GWP. Gross Domestic Product Gross National Product Gross World Product. ISBN: 92-807-1633-6 For bibliographic and reference purposes this publication should be referred to as: RIVM/UNEP (1997). Bakkes, J.A. and J.W. van Woerden (eds.). The Future of the Global Environment: A model-based Analysis Supporting UNEP’s First Global Environment Outlook. RIVM 402001007 and UNEP/DEIA/TR.97-1 Division of Environment Information and Assessment (DEIA) United Nations Environment Programme (UNEP) P.O. Box 30552, Nairobi, Kenya National Institute of Public Health and the Environment (RIVM) P.O. Box 1, 3720 BA Bilthoven, The Netherlands For comments: fax +31. 30.274 4435 or email jan.bakkes@rivm.nl. The views expressed in this publication are not necessarily those of the United Nations Environment Programme. The designations employed and the presentations do not imply the expressions of any opinion concerning the legal status of any country, territory, city or area or its authority, or concerning the delimitation of its frontiers or boundaries. This publication may be reproduced in whole or in part and in any form for educational and non-profit purposes provided acknowledgement of the source is made. UNEP would appreciate receiving a copy of any publication that uses this publication as a source..
(4) CONTENTS Units and abbreviations Table of contents. i. Preface. vi. Acknowledgements. viii. List of reviewers. ix. Key findings. x. 1. Social and economic development and protection of environmental resources: the core questions and how to address them 1.1 Key questions, methods, and definitions 1.2 A world in transition 1.3 Structure of this report. 1 1 6 9. 2. Environmental pressure: socioeconomic driving forces and derived demands 2.1 The issue 2.2 Economic activity and population 2.3 Environmental pressures: energy, material use and emissions 2.4 Environmental pressures: demand for land and water 2.5 The goals: Agenda 21 and the Conventional Development scenario 2.6 Are the goals considered potentially achievable?. 15 15 20 25 30 32 33. 3. Interactions between land, water and the atmosphere 3.1 The issue 3.2 The main causes of acidification and climate change: energy consumption, industry and deforestation 3.3 Acidification 3.4 Climate change 3.5 Linkage of acidification and climate change 3.6 The goals 3.7 Are the goals considered potentially achievable? 3.8 Response options. 37 37 37 38 42 43 45 46 47. Use of land and water 4.1 The issue 4.2 Food production and land use: past and present 4.3 Food consumption and production: the future 4.4 Implications for land use 4.5 Fresh water 4.6 Are the goals considered potentially achievable? 4.7 Response options. 53 53 53 54 59 63 68 69. 4. i.
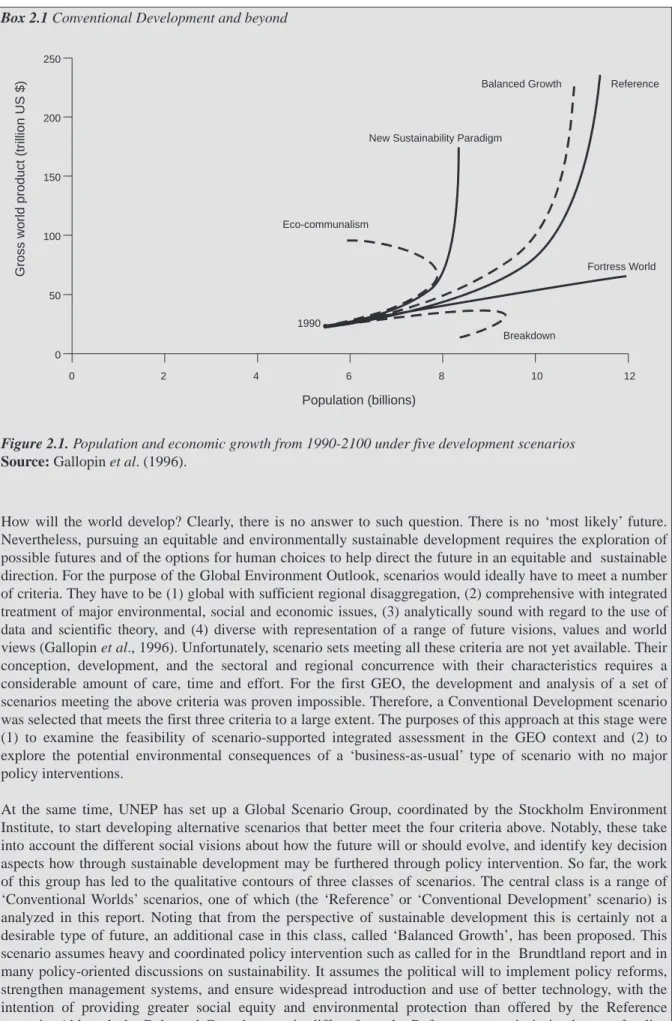
(5) 5. Nature and its diversity 5.1 The issue 5.2 The main causes of nature loss 5.3 The development of nature and its diversity 5.4 Discussion 5.5 Response options. 6. Effects on human health 6.1 The issue 6.2 The relative importance of health determinants 6.3 The health status of the world’s populations 6.4 Are goals considered potentially achievable? 6.5 Possible responses. 89 89 89 93 99 102. 7. Responses: priorities and strategies for making progress in implementing Agenda 21 7.1 Taking stock: assessing previous findings 7.2 Transitions to more sustainable forms of development 7.3 Assessing regional challenges 7.4 Policy strategies to enhance sustainable development 7.5 Cost indications of policies to promote sustainable development 7.6 Conclusions. 105 105 108 112 115 121 124. Introducing the appendices: The forecasting process Appendix I. Core data sets for integrated environment assessment and modelling Appendix II. Scenario interpretation Appendix III. Model descriptions A. The IMAGE 2 model B. The TARGETS 1.0 model C. The TARGETS Population and Health model D. The RAINS model E. The water demand satisfaction model F. The pressure index for non-domesticated areas. 73 73 73 74 85 86. 129 131 138 142 142 143 145 148 149 152. Boxes Box 1.1. Box 2.1. Box 2.2 Box 3.1. Box 4.1. Box 4.2. Box 6.1. Box 6.2. Box 6.3. Box 6.4. Box 6.5. Box 6.6.. A world in Transition: a model-based exploration of linkages. Conventional Development and beyond. Increases in efficiency and increases in demand: the remaining challenge Disruption of biogeochemical cycles. Food security, poverty and malnutrition. Models and expert systems applied to longer term projections of agriculture and landuse related issues. Improvements in health preceded modern medicine. Health development and a multitude of pressures. Competing causes of disease and death. Diseases: declines and increases. Entrapped populations in Africa. Urbanization: growing population, growing pollution.. ii. 8 19 31 38 55 56 91 92 92 99 100 100.
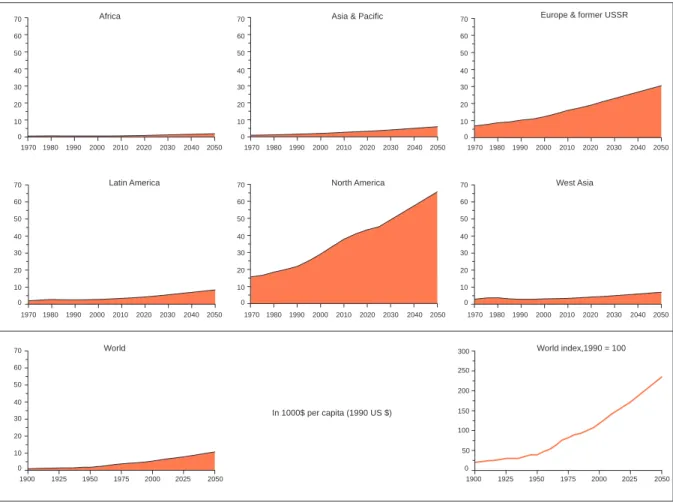
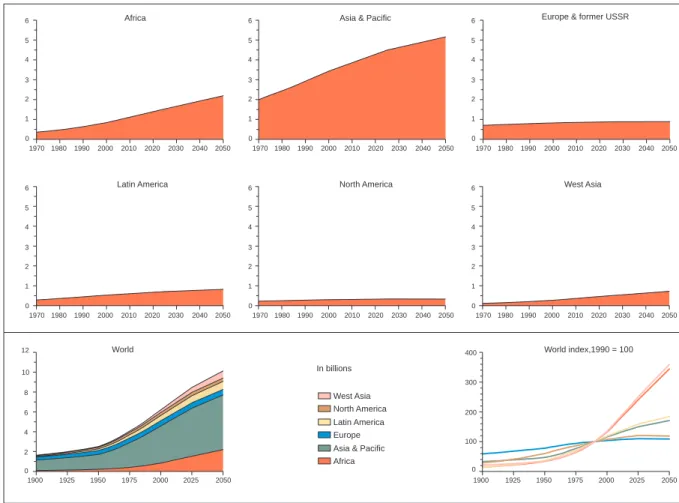
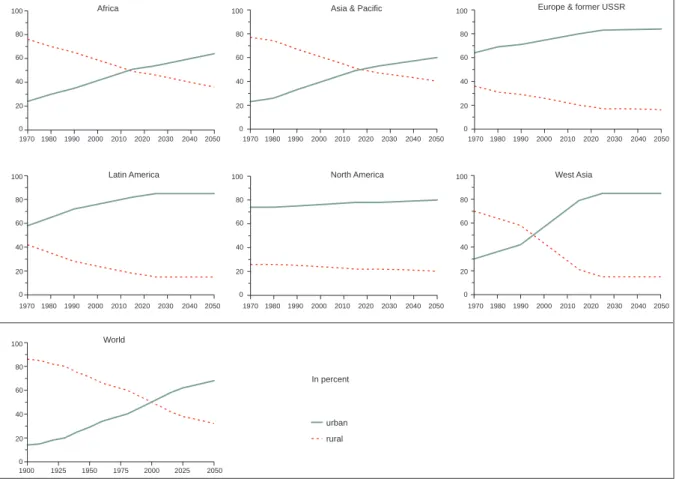
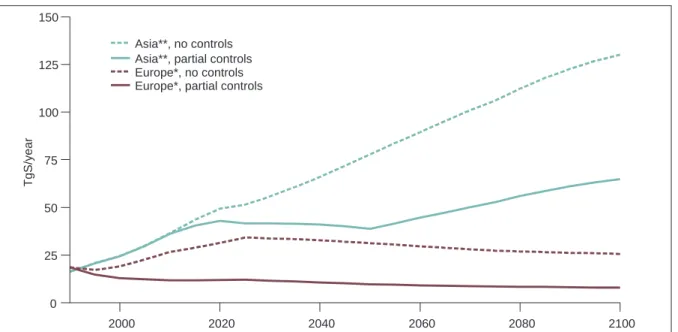
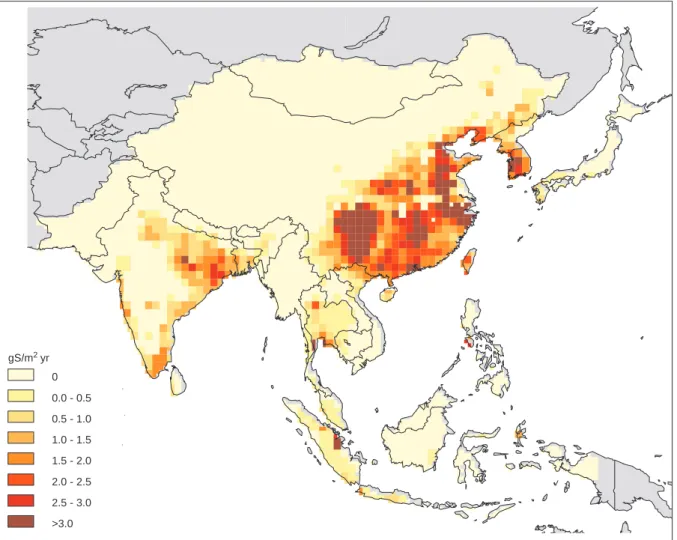
(6) Box 6.7. Box 7.1. Box 7.2.. A health problem in rural areas: acute agricultural intoxications and long-term health. Ecological limits and the exchangeability between different types of ‘capital’. The consequences of economic globalization.. 101 109 112. Figures Figure 1.1. Figure 1.2. Figure 1.3. Figure 1.4. Figure 1.5. Figure 1.6.. A systems analysis view of the world. 2 A simple representation of the pressure - state - impact - response framework. 3 The pressure - state - impact - response framework in the context of development. 3 The concept of transitions as a function of positive and negative feedbacks. 4 GEO regional breakdown. 11 Elements of the pressure - state - impact - response framework covered in this report 12. Figure 2.1. Population and economic growth from 1990-2100 under five development scenarios. Figure 2.2. Economic growth in GDP per capita: past growth and future assumptions in the Conventional Development scenario. Figure 2.3. Past population trends and future assumptions according to the Conventional Development scenario. Figure 2.4. The part of the population living in urban agglomerations: past data and future trends according to Conventional Development scenario assumptions. Figure 2.5. Past primary energy consumption and future assumptions. Figure 2.6. Production of fossil fuels up to 1990. Figure 2.7. Production of selected metals up to 1990. Figure 2.8. Past fertilizer consumption and projections following the Conventional Development scenario. Figure 2.9. Past energy intensity of economies and projections following the Conventional Development scenario. Figure 2.10. Index of global emissions of sulphur dioxide, nitrogen oxides and carbon dioxide following the assumptions of the Conventional Development scenario. Figure 2.11. Caloric intake, projections following the Conventional Development scenario. Figure 2.12. Projected water withdrawals following the assumptions of the Conventional Development scenario.. 19 22 23 24 25 26 26 27 27 28 30 32. Figure 3.1. Projected sulphur dioxide emissions for Europe and Asia. Figure 3.2. Asian areas where critical loads of sulphur deposition are exceeded in 2050 assuming partial controls of sulphur dioxide emissions. Figure 3.3. Projected increase of global average surface temperatures. Figure 3.4. Areas where yields of maize are projected to significantly decrease or increase because of climate change between 1990 and 2050. Figure 3.5. Areas in Europe and Asia affected by both acidification and climate change.. 44 45. Figure 4.1. Figure 4.2. Figure 4.3a. Figure 4.3b. Figure 4.3c. Figure 4.4.. 58 60 65 65 65 67. Recent and projected production of cereals. Past and projected land use. Water satisfaction ratio per catchment area in 1990. Projected water satisfaction ratio per catchment area in 2015. Projected water satisfaction ratio per catchment area in 2050. Water discharge: projected changes caused by climate change.. iii. 40 41 43.
(7) Figure 5.1. The generalized relation between human influence and number of original species. Figure 5.2. Main causes of biodiversity gains and losses. Figure 5.3. Historical habitat loss due to conversion from non-domesticated to domesticated area, 1700 - 1980. Figure 5.4. States of exploitation of major fish stocks. Figure 5.5. State of various whale populations compared with their estimated original state. Figure 5.6. Coastal ecosystems threatened by development, in particular population density, road and pipeline density, cities and major ports. Figure 5.7. Projected extent of non-domesticated area, 1970 to 2050. Figure 5.8. Spatial distribution of the main non-domesticated areas projected according to the Conventional Development scenario. Figure 5.9. Spatial distribution of the main origins of crop plants and the 20 countries with highest species diversity. Figure 5.10. Projected percentage of non-domesticated area under different degrees of pressure from the human population and associated activities. Figure 5.11. Historical and projected per capita non-domesticated area. Figure 6.1. Figure 6.2. Figure 6.3. Figure 6.4. Figure 6.5.. The three stages of the health transition. Disability Adjusted Life Years (DALYs) lost, 1990. Past and projected Disability Adjusted Life Expectancy Years (DALEs). Past and projected population change. Death by cause in 1990.. Figure 7.1. Projections of pressure, state and impact indicators of the Conventional Development scenario. Figure 7.2. Environmental efficiency transitions. Figure 7.3. Potential environmental gains of two different policy strategies. Figure A.1. Schematic representation of the forecasting process. Figure A.2. A schematic overview of IMAGE 2. Figure A.3. A conceptual representation of the modular perspective of TARGETS, version 1.0. Figure A.4. Linkages of the population and health model with the other TARGETS submodels. Figure A.5. A pressure-state-impacts-response representation of the TARGETS population and health module. Figure A.6. A schematic overview of RAINS. Figure A.7. Estimation of agricultural water demand.. 73 74 75 76 77 78 79 80 81 83 85 90 94 95 96 97. 106 116 119 130 142 144 145 146 148 150. Tables Table 2.1. Table 2.2.. Selected historical data and scenario assumptions, absolute figures. Selected historical data and scenario assumptions, per capita.. 16 17. Table 3.1. Table 3.2.. Recent and projected sulphur dioxide emissions estimated by various sources. Emissions of sulphur compounds projected under Conventional Development.. 39 40. iv.
(8) Table 4.1. Table 4.2. Table 4.3. Table 4.4a.. Recent and projected agricultural area used per capita. Projection of agricultural supply required. Past and projected crop yields for wheat and coarse grains. Distribution of catchment areas by satisfaction ratio of water demand under the assumptions of Conventional Development. Table 4.4b. Number of people by satisfaction ratio of water demand under the assumptions of Conventional Development.. 54 56 57. Table 5.1. Table 5.2.. 78. Table 6.1.. Table 7.1. Table 7.2. Table 7.3.. Table A.1. Projected extent of non-domesticated land. Projected percentage of non-domesticated area under different degrees of pressure from the human population and associated activities. Selected factors affecting health for most world populations in the first two stages of the health transition. The Conventional Development scenario: achievements, threats and remaining problems. Main regional challenges with respect to environmental transitions. Estimated global costs of policy measures promoting transitions towards sustainable development. Core data sets underlying this report.. v. 66 66. 82. 91. 105 113 123 133.
(9) PREFACE Integrated assessment is one of the more powerful information tools to rational environmental policy. Integrated assessment distills practical messages for policy from available, but often fragmented scientific understanding and data. It is ‘integrated’ because of the linkages between the different environmental problems themselves and between the forces that drive those problems and the options available for our responses. Moreover, integrated assessment aims at providing a - be it crude - look at the whole, rather than a detailed picture of those issues we understand best. Integrated assessments in support of environmental policy have already been applied to a number of countries and regions, and to international negotiations. UNEP's first Global Environment Outlook (GEO-1) can be seen as a step towards making the tool of integrated assessment more widely available as a means for focusing action. The technical report before you documents RIVM's contribution to UNEP's first Global Environment Outlook report. The RIVM contribution focuses on one particular element of integrated assessment: looking ahead (Chapter 4 in GEO-1). Current patterns in production and consumption typically manifest their environmental and resource consequences only after important delays. This is because many environmental and resource processes are slow and cumulative. Also in the whole process of taking remedial action there are considerable inherent delays. As is illustrated by this report, a ‘what if’ analysis helps us to look beyond the delays as well as we can. In policy preparation, ‘what if’ analysis buys time so as to consider options and take preventive action. And obviously, the earlier action is taken, the more cost-effective it is. And, equally important, contemporary modelling makes regional differences part and parcel of such an analysis. A draft version of the present report was reviewed by individual scientists between April and August 1996. Extensive comments on the report were also received in policy-oriented consultations in all six UNEP regions. Besides contributing significantly to the end result, both rounds of comments were of key importance in extracting the messages from the present analysis for GEO-1. The comments also guided the revision of the April draft leading to the present report. One particular revision has been the addition of a brief reconnaissance in Chapter 7 on the potential impact of enhanced policies world-wide. An account of the regional consultations held on the entire draft Global Environment Outlook will be published separately in this series. This report illustrates that integrated assessment and modelling techniques can be excellent tools for environment and development policy-setting. The methodology, however, will need to be further developed and adapted to the realities and expectations of diverse regions, incorporating alternative policy strategies and development scenarios. The GEO Working Groups dealing with models and scenarios will also need to expand the scope of the analysis to address social and eventually - institutional issues. Furthermore, environmental quality issues, such as pollution, need more attention in comparison to quantity issues only. Data, scale and uncertainty analysis will need to be improved.. vi.
(10) However, we believe it justifiable to provide this contribution on a limited but timely basis as a start in the GEO process. The emerging network of collaborating centres for integrated assessment in all regions will be the starting point for broadening the base, both for consecutive GEO reports and for applications of integrated model-based analysis in support of regional, national or local policy issues. We sincerely hope to receive many more comments on this report to guide the GEO process.. R.B.J.C. van Noort Director General RIVM, The Netherlands National Institute of Public Health and the Environment. Elizabeth Dowdeswell Executive Director United Nations Environment Programme. vii.
(11) ACKNOWLEDGEMENTS Various sections and aspects of this report represent the work of different RIVM staff members: Chapter 1 (methodology): Rob Swart with inputs by Jan Rotmans (currently with DPCSD) Chapter 2 (the scenario): Rob Swart with inputs by Bert de Vries Chapter 3 (interactions between land, water and the atmosphere): Joseph Alcamo (at present with the Center for Environmental Systems Research, University of Kassel); acidification by Jean-Paul Hettelingh; response options by Rob Swart Chapter 4 (use of land and water): Gert Jan van den Born, with modelling of fresh water demand and availability by Olivier Klepper Chapter 5 (nature and its diversity): Ben ten Brink Chapter 6 (effects on human health): Louis Niessen, building on the work of Pieter Bol Chapter 7 (responses): Marcel Berk, building on work by Rob Swart and inputs by Fred Langeweg Appendices: Jaap van Woerden Overall structure: Fred Langeweg Project management: Jan Bakkes and Bert-Jan Heij, with Marcel Berk as project secretary. Editors: Jan Bakkes (substantive editing) and Jaap van Woerden. Data aspects and input-output processing were coordinated by Jaap van Woerden, who, with Jos Diederiks, Kees Klein Goldewijk and Raymond de Niet, acquired and processed most of the data. Eric Kreileman performed the calculations with the IMAGE model. This report was enhanced by comments from many individual experts and organizations. Moreover, consultations in all UNEP regions during the summer of 1996 provided valuable comments. The reports of these consultations will appear as a separate background report to GEO-1. Layout: RIVM’s Studio, with the special assistance of Martin Middelburg. Marc van Leeuwen assisted with manuscript preparation. English language editing: Ruth de Wijs-Christensen and Michael Gould (Michael Gould Associates).. viii.
(12) LIST OF REVIEWERS The following list comprises people who participated in a review of a draft of this report and provided us with many useful comments and suggestions. We tried to incorporate these in the final version as much as possible. However, due to limitations of time, space and divergence in views on some issues not all comments and suggestions have been taken into account. Nevertheless, the present report did much benefit from the various suggestions made by: Prof. Robert Ayres, INSEAD, France Dr. Dirk Bryant, World Resources Institute, USA Mr. Munyaradzi Chenje, on behalf of Environmental Resource Centre for Southern Africa/IMERCSA, Zimbabwe Mr. Clement Dorm-Adzobu, together with other reviewers from the Network on Environment and Sustainable Development Africa (NESDA), Ivory Coast Dr. James Edmonds, Pacific Northwest National Laboratory, USA Prof. Genady Golubev, together with other reviewers at Moscow State University, Russia Dr. Gilberto Gallopin, CIAT, Colombia Prof. Lekan Oyebande, University of Lagos, Nigeria Prof. Tony McMichael, London School of Hygiene and Tropical Medicine, United Kingdom Prof. Ruben Mnatsakanian, Central European University, Hungary Dr. Fred Muchena, ETC-Kenya, Kenya Mr. Francis Ng, Center for International Forestry Research (CIFOR), Indonesia Dr. Shuzo Nishioka, National Institute for Environmental Studies, Japan Mr. Dennis O’Farrell, Environment Canada, Canada Prof. Jyoti Parikh, Indira Gandhi Institute of Development Research, India Dr. R K. Pachauri, Tata Energy Research Institute (TERI), India Dr. Dhira Phantumvanit, together with other reviewers at the Thailand Environmental Institute (TEI), Thailand Prof. Jan Rotmans, United Nations/DPCSD, USA Dr. George Davis together with other reviewers at the National Botanical Institute, South Africa Dr. Kamal A. Sabet, together with other reviewers at the Centre for Environment and Development for the Arab Region and Europe (CEDARE), Egypt Mr. Richard Tol, Institute for Environmental Studies, The Netherlands Mr. Keimpe Wieringa, European Environmental Agency Dr. Zhang Shigang, together with other reviewers coordinated by the National Environmental Protection Agency, China Dr. Veerle Vandeweerd, together with other staff of UNEP. ix.
(13) KEY FINDINGS Inequality increases in a wealthier and healthier world In the Conventional Development scenario analyzed in this report, global per capita income increases by 50% and 100%, and life expectancy by 5% and 8%, by 2015 and 2050, respectively. However, inequalities in income between regions become larger in the scenario up to 2015, after which the gap begins to narrow. In some of the poorest regions the demographic transition stagnates and health problems persist. Environmental pressures build up Growth in consumption and production exceeds gains from improvements in productivity. In the scenario, energy efficiency is projected to increase by a factor of 1.2 by 2015 and 1.8 by 2050. At the same time, total demand for energy increases by a factor of 1.8 by 2015 and 2.6 by 2050. Agricultural efficiency is projected to increase by a factor of 1.2 by 2015 and 1.4 by 2050. At the same time, total food demand increases by a factor of 1.5 by 2015 and 2.0 by 2050. However, the regional differences in environmental pressures are great. Renewable resources at risk of depletion While depletion of exhaustible resources in the seventies was considered as a major threat to development, integrated assessment based on the Conventional Development scenario suggests that the degradation of renewable resources such as water, land and forests now creates risks that are much more urgent. This may increasingly hinder development on local and regional scales. In the scenario, social and economic capital seems to increase globally, while natural capital is being depleted. Climate goals are not being achieved Interacting biogeochemical cycles are increasingly disturbed by human activities. For example, the current commitments of the Climate Convention are insufficient to stabilize atmospheric concentrations in the coming century. Emissions of greenhouse gases from developing regions, notably Asia, will grow rapidly, leading to a 50% increase in 1990 of global carbon dioxide emissions by 2015, and more than a doubling by 2050. Consequently, in addition to increased preventive efforts to control emissions, preparing for adaptation to projected climate impacts becomes urgent. This is particularly true for areas vulnerable to climate impacts in developing regions in low latitudes. Another example is acidification, becoming more important in developing regions with vulnerable soils and accelerating economic development. Can a ‘second’ world be fed? The key challenge for the world’s agricultural sector will be how to feed double the present population by 2050. Increasing demand for animal products will further boost total agricultural demands. Theoretically, increasing productivity, extending agricultural land and reversing land degradation can provide sufficient food on a global scale. Achieving this and ensuring the adequate distribution of food pose a formidable challenge. Regions such as Asia, West Asia and Africa are projected as being able to increase their food imports, enlarging the scale of agricultural trade significantly. A serious threat to development by water scarcity confirmed In many regions, water demand from industry and households is in increasing competition with water for agricultural production. Preliminary global analysis at the catchment level confirms that water scarcity is affecting increasingly large areas, particularly in West Asia and Africa. This may lead to serious security problems, conflicts and large-scale migration. Integrated water management at the riverbasin level and adequate water pricing form the key to alleviating these pressures.. x.
(14) Further conversion of natural lands appears inevitable In the Conventional Development scenario, agricultural land increases from one-third to almost one-half of the earth’s land mass by 2050. This increase is concentrated in tropical and subtropical zones. The remaining natural areas are formed to a large extent by mountainous, boreal, subpolar, arid and semi-arid lands, which are less suitable for human settlement. Simultaneously, these remaining natural areas will be under increasing pressure from population growth, economic development and associated environmental stresses such as climate change. Consequently, biodiversity will be severely affected in the scenario, both in terms of quantity and quality. Environmental degradation may threaten global health in the long term In the Conventional Development scenario, life expectancy increases worldwide, up to 70 years. Morbidity declines drastically, especially in developing countries. Expected improvements in income, education, nutrition and water supply will stimulate the decline in fertility needed to stabilize the global population, but how much and how fast is by no means certain. Unfortunately, in many areas (notably, Sub-saharan Africa and many urbanized areas) environment-related health problems will persist or be aggravated. Also, in the long term, an increased population, older in composition and more demanding, will further increase environmental pressures and is likely to undermine its own resource base, which may eventually threaten global health. In this context, increased environmental protection, especially in developing countries, will be essential in the prevention of an increase of disease. Environmental transitions needed and, in some cases, already started With current technology - where appropriately coupled to behaviourial changes - major progress can be made to reverse the negative developments outlined above and accelerate transitions towards the sustainable use of energy, raw materials, land and water. While the onset of these transitions can be discerned, adequate social, economic and institutional conditions have to be met for realizing these transitions in working towards the Agenda 21 goals. Linking issues and boosting efficiency in a comprehensive approach To promote transitions, linking of issues provides new options for joint gains by the different actors implicated. Many environmental problems can be addressed by focusing efforts on integrated energy and agriculture policies rather than on single-issue policies. Just to keep pressures at current levels, resource efficiencies would have to increase by a factor of 4 to 5 globally by 2050. To reduce pressures towards sustainable levels and re-allocate available resources more equitably, this factor on a regional level may have to be as high as 20. Impact of enhanced policies would be large Technically, there is much room for mitigating future increases in pollution, resource use and pressure on natural areas. That is: if best available technology could be applied to all new investments, the projected environmental impacts would be much less severe. More structural changes in production and consumption patterns - such as a shift to renewable energy resources and a change of diets - would give humankind even more space. Obviously, this will require broad access to capital and knowledge, and most of all it requires the political determination to make the world a sustainable one. Integrated assessment: not a solution but a framework for analysis and debate. The integrated assessment in this report is based on a quantitative systematic framework for analyzing future global and regional developments, and their interlinkages. However, this assessement is based on a limited set of methodologies and only one scenario depicting neither the most probable nor the most desirable future. To cover regional and disciplinary insights, as well as scientific uncertainties, more comprehensively than possible in this contribution to the first Global Environment Outlook and to focus more on communication between stakeholders and scientists, future analyses should make use of a wider set of methodologies, sensitivity analyses and scenarios. xi.
(15)
(16) 1. SOCIAL AND ECONOMIC DEVELOPMENT AND PROTECTION OF ENVIRONMENTAL RESOURCES: THE CORE QUESTIONS AND HOW TO ADDRESS THEM. 1.1. Key questions, methods, and definitions. Introduction and key questions What kind of world will future generations inherit? Which of our present problems are likely to persist and what new problems can we expect to emerge, where and when? What are the main driving forces behind these problems, to what extent can they be solved and what will viable solutions cost? Does rapid economic growth and globalization exacerbate these problems, offer solutions, or perhaps do both at the same time? These are questions that the Global Environment Outlook process will address in order to identify emerging issues and support priority setting for international action. Chapter 2 of the Global Environment Outlook surveys regional priorities and current responses. The present contribution attempts to address the above questions by exploring the future in a structured fashion. The sheer complexity of the issues may well overwhelm decision-makers. One of the ways to simplify and structure the issues and their interactions is to apply modelling techniques and scenario analysis. Focus and methods The above questions are far-reaching because they examine issues — changes in conditions that affect human health, the depletion of natural resources, and a serious loss of biodiversity as a result of developments in other sectors — that will have a major impact on human lives. While there are many environmental changes and impacts associated with social and economic developments, this contribution to the first Global Environment Outlook is not primarily intended to deal with all of these. Rather, the intention is to demonstrate the advantages and feasibility of model-based assessment1 applied to two important areas where environment and development interact, namely global cycles and the use of the earth’s limited land resources2. Even with these limitations, this is no easy task. There are a number of factors which may influence the accuracy of the results of such an assessment: gaps in knowledge3, related deficiencies in the structure of the models, and the fragmentary nature and, in some cases, limited reliability of available data. Nevertheless, the seriousness of the problems outlined in the other contributions to the Global Environment Outlook report makes it all the more urgent to start indicating and assessing systematically both current and future risks to the environment and to development.. 1. To analyze the real world it is necessary to assess the multiple and complex interactions between the environment and the socioeconomic fabric of life. This requires the integration of diverse sets of information derived from many different sources. Systems analysis models provide one set of tools that can support such an analysis. No single model can, of course, capture all the facets of sustainable development at all levels, and for many interactions no models are as yet available. In this chapter, models developed at the Netherlands’ National Institute of Public Health and the Environment (RIVM) and the Stockholm Environment Institute (SEI) have been applied to a selected number of environment—development interactions. Through the establishment and operation of a GEO modelling working group (DPCSD, 1996), further models need to be developed and applied on both global and regional scales. This is to ensure more diversity of insights and priorities in future editions of the GEO report e.g. in terms of long-range economic models.. 2. Evidently, there are many other environmental changes and impacts associated with social and economic developments, including emissions of pollutants and waste, and depletion of non-renewable resources. Because of time and resource constraints these issues are not dealt with in detail in this report, which does not even pretend to be comprehensive. Its primary intention is to demonstrate the advantages and feasibility of a model-based assessment. Secondly, important issues such as the environmental implications of inequity, increasing trade volumes and economic globalization are not analyzed in detail beyond the one scenario analyzed in the report.. 3. Uncertainties come in all kinds. There are technical uncertainties related to deficiencies in measurement, and gaps in knowledge about how the human and environmental systems related to the design of the analytical tools used work. There are also uncertainties related to ‘unknowable’ developments in the future that scenario analysis attempts to address. Finally, there are uncertainties related to people’s different interpretation of what is known depending on their perspectives. The results in this chapter have to be seen against the background of these uncertainties. No attempt will be made to quantify the uncertainties or attach probabilities to the results.. 1.
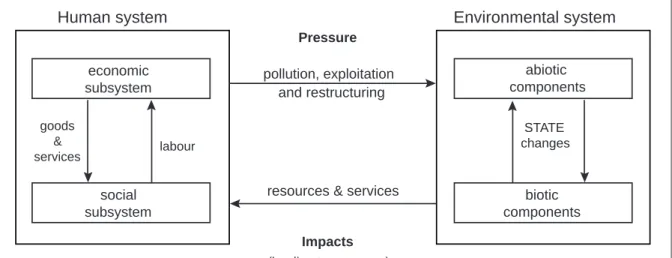
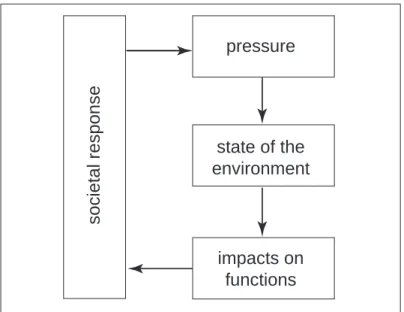
(17) THE FUTURE OF THE GLOBAL ENVIRONMENT. Human system. Environmental system Pressure. economic subsystem goods & services. pollution, exploitation and restructuring. STATE changes. labour. social subsystem. abiotic components. resources & services. biotic components. Impacts (leading to response). Figure 1.1. A systems analysis view of the world Source: Swart and Bakkes (1995).. Analytical approach The general approach behind the model-based assessment in this chapter is systems analysis, in particular the analysis of environmental changes that result from interactions between the human and environmental systems (Figure 1.1). It is necessary to ensure that the social, economic and environmental aspects of development are, as far as possible, brought onto a level playing field. One way of doing this is to use indicators to summarize the findings4. The World Bank distinguishes between human man-made and natural capital (Serageldin, 1996)5. However, current understanding of social factors prevents their full and direct inclusion in systems analysis models. In order to structure the analysis of the interaction between the human and environmental systems, the dynamic nature of these interactive systems are assessed within a driving forces pressure - state - impact - response framework (Figure 1.2): Social and economic developments exert pressure on the environment, and, as a consequence, the state of the environment changes. These changes then have impacts on the social and economic functions of the environment, such as the provision of adequate conditions for health, resources availability and biodiversity. Finally, these impacts may elicit a societal response that feeds back on the driving forces (or on the state or impacts directly, through adaptation or curative rather than preventive action). Obviously, the real world is more complex and dynamic than can be expressed in simple causal relations in systems analysis. There is arbitrariness in the distinction between human and environmental systems, and, depending on the context, a considerable number of phenomena may, for example, play a role as either pressure or impact variable. Moreover, many interactions between environmental and societal systems, and several facets of development, are not sufficiently understood or are difficult to capture in the simple systematic framework shown in Figure 1.2. This is illustrated in Figure 1.3, where the pressure and response elements of the framework are positioned as part of a wider ‘development’ context and two-way interactions are. 4. Indicators are defined here as pieces of information forming part of a specific management process (e.g. in this case the pursuance of sustainable development as outlined in Agenda 21) that can be compared with the objectives of that management process, and have been assigned a significance beyond their face value (Bakkes et al., 1994).. 5. However, unlike the World Bank’s monetization of all forms of capital, in this report the different forms of capital are expressed in their own units: ‘monetary’ for economic capital, ‘people’ for human and social capital, and ‘physical’ for environmental capital.. 2.
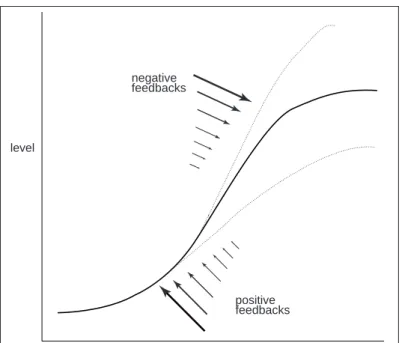
(18) THE CORE QUESTIONS. societal response. pressure. state of the environment. impacts on functions Figure 1.2. A simple representation of the pressure - state - impact - response framework Source: Swart and Bakkes (1995).. indicated instead of the simplified one-way cycle in Figure 1.2. Nevertheless, it is argued here that the simple pressure - state - impact - response cycle does provide an understandable structure within which available knowledge can best be organized and analyzed at this stage (Swart and Bakkes, 1995). The concept of transitions is used to provide a systematic context for describing and understanding the dynamics and interactions between the human and environmental systems. A transition is defined here broadly as a process in which a system undergoes a rapid change, followed by a slow-down to a situation where conditions are qualitatively and quantitatively different from the initial stage. Evidently, this concept has to be applied with care to real-world observations. However, it is used to provide an impressionistic description of some of the major past and possible future developments in the world. The strongly non-linear dynamics of transitions can be understood in terms of the changing relative strength of positive and negative feedbacks (Figure 1.4). In a typical transition, a ‘take-off’ phase represents the early stages of an acceleration, which involves considerable investment efforts and relatively little profit. In this stage, positive feedbacks reinforce the response signal. Policy interventions are the most effective. STATE/IMPACT. PRESSURE. RESPONSE DEVELOPMENT. Figure 1.3. The pressure - state - impact - response framework in the context of development. 3.
(19) THE FUTURE OF THE GLOBAL ENVIRONMENT. negative feedbacks. level. positive feedbacks. time. Figure 1.4. The concept of transitions as a function of positive and negative feedbacks. here. An ‘acceleration phase’, characterized by rapid change, follows. This might become autonomous as soon as a threshold value is exceeded and thereby reduce the effectiveness of policy interventions. Finally, negative feedbacks increasing relative to the positive feedbacks within the system lead to a ‘stability’ phase. Clearly, stability is relative and does not mean permanence: smaller changes can occur and a new transition may follow. The elements of the pressure - state - impact - response cycle can be seen as part of the feedbacks. The Pressure component may trigger the take-off phase of a transition, followed by rapid changes in the State component. This, and the associated instability of the system, may lead to Impacts (positive feedbacks). Policy measures or autonomous Responses may counteract these impacts and dampen the rate of change in the stability phase (negative feedbacks). As we have learned from the past, transitions are no law of nature and, if presented as a historical or future inevitability, would represent a mere example of determinism. Rather, the concept is used here as a stylized way of visualizing and understanding ongoing changes in world dynamics. Integrated models In the early seventies, rapid development of computer technology combined with increasing scientific understanding prompted the development of a first generation of systems analysis models attempting to describe and analyze possible future developments in the complex relationships between the various components of the human and environmental system at the global level. UNEP (Swart and Bakkes, 1995) has provided a concise overview of these models. While these models increased understanding and awareness, they had a number of deficiencies related to serious gaps in scientific knowledge at the time and the inherent unpredictability of the future. While the future remains uncertain, new insights can address some of the deficiencies of the first generation of systems models. This has led in the eighties and nineties to the development of new models, some of which were designed to study specific global or regional topics such as acidification and climate change, usually applying the pressure - state - impact response framework. Others attempt, in addition to the pressure - state - impact - response cycle for a particular theme, to capture as many interlinkages as possible between the economic, social and environmental systems on a global scale. Some of these computer models are used in this chapter.. 4.
(20) THE CORE QUESTIONS. The IMAGE model, supplemented by RAINS and TARGETS model calculations, functioned as the basic model for the assessments in this report (see also Appendix III). PoleStar had been used in the compilation of the scenario to enhance consistency between the different components of the driving forces in SEI’s accounting framework. RIVM’s IMAGE model and the RAINS model (developed at IIASA) are applied jointly to analyze the interaction between climate change and acidification. RIVM’s TARGETS model is applied to illustrate the interlinkages between the systems’ components at a long-term aggregate level. Results from the TARGETS Health and Population submodel are also reported. The IMAGE model is also used to provide a provisional sketch of the technical space allowed for enhanced policies, described in chapter 7. These models are briefly described in Appendix III. Furthermore, results from the Asian Integrated Model (AIM) of the Japanese National Institute of Environmental Studies (NIES) are used in this report. The aim of the current analysis is to explore the environmental risks of selected socioeconomic developments after the ‘Rio conference’. At this stage, no rigorous analysis of different response scenarios using economic models will be attempted. (However, UNEP in collaboration with DPCSD and other organizations, are setting up a Global Modelling Forum for global modelling activities to analyze Agenda 21-related issues, including economic analysis. See also Appendix I) Of course, model-based analysis does not provide specific answers to today’s pressing questions but does provide structure, consistency and, hopefully, a better understanding of the complexity of these questions so as to support rather than replace decision-making. Other contributions to GEO will obviously address the key questions from a different perspective in different ways. Scenario analysis Current environmental problems are, to a large extent, caused by human activities in the past, while future difficulties are being generated now. Therefore, in the next chapter, historical trends will be briefly discussed to provide a better understanding of the causes of environmental changes and the relative contributions of the various regions. It is also crucial to note that the response of both societal and environmental systems to changes in other systems is necessarily delayed. (The delays are caused by factors ranging from residence times of chemicals in the environment, to depreciation times of the capital stock and to the time it takes to educate and train the next human generation.) One consequence of this is that to identify emerging issues and priorities, and to analyze the implications of alternative policy strategies, it is necessary to assess a wide range of possible future developments. This is done using scenarios. Scenarios are hypothetical sequences of events, constructed for the purpose of focusing attention on causal processes and decision points (Kahn and Wiener, 1967). They are descriptions of alternative futures, possibly based on different views of how the world works. Thus scenarios are images of the future created from mental maps or perspectives on the past and present. They are not deterministic predictions of what is likely to occur or what should occur, nor are they stories about the future akin to science fiction or probabilistic ranges around a central trend. The role of scenarios is to examine different perspectives, to challenge conventional thinking and to offer a systematic and disciplined way of discussing crucial issues. Different possible policy strategies can also be analyzed by way of scenarios. The selection of the scenario is not a choice for or against a certain future. The development and selection of scenarios is an iterative process involving users and analysts. In deviation from the principle that scenario analysis should consider alternative futures, the present analysis for the first Global Environment Outlook is only applied to one scenario, the socalled Conventional Development scenario (see Chapter 2). This is because of the present lack of sufficiently elaborated global scenarios. However, this limitation should not be explained in the sense that the Conventional Development Scenario would be more plausible or desirable than. 5.
(21) THE FUTURE OF THE GLOBAL ENVIRONMENT. other futures. Meanwhile, UNEP has set up yet another Global Working Group to address this gap (see Box 2.1 in Chapter 2). North and south, past and future Time is also important in another respect. In the international debate about environment and development, the industrialized countries in the North have focused primarily on environment and sustainability, whereas the developing countries in the South emphasize the importance of economic growth and development. From the perspective of industrialized countries, the momentum of population and economic growth in the South foreshadows future global environmental degradation. The South, with primarily short-term economic and local environmental problems to address, places these global environmental concerns primarily in the context of the asymmetric distribution of impacts and responsibilities: the main risks in the South, and the past and present responsibilities in the North. For this reason, this analysis supporting the Global Environment Outlook has to consider not only the future, but also the past and present. Evidently, the future will be different from the past. However, one can learn both from the past, as the origin of the main driving forces of the global societal and environmental changes, and from the way in which interactions between system components have evolved.. 1.2. A world in transition. Introduction How can the above concepts and methods6 be combined to provide a systematic and comprehensive framework for exploring the key issues set out at the beginning of this chapter? A dynamic framework of linked social, economic and environmental transitions is envisaged to address this question. Box 1.1 provides a model-based illustration. Referring to the illustration in Box 1.1, transitions in population and economic dynamics are discussed first, followed by changing demands for energy, raw materials, food and water, derived from developments in population and economy. Third, possible implications of these demands for the environment are considered, taking into account transitions in the type and efficiency of resource use. Finally, closing the loop, it has been established that important elements of human response be implicate or explicate included in forward projections. Social and economic resources: dynamics of population and production The dynamics of the human population are sufficiently well understood to estimate fairly precisely its expected development over the next two to three decades. In the longer term, it is much more difficult to predict the pathway along which a demographic transition may take place. Almost all researchers, however, agree that there will be a further decline in birthrates along with declining death rates. This will result in a population growth moving towards some 10 billion people by the end of next century . As important as the numbers is the quality of human life for which life expectancy and disease-adjusted life expectancy are widely used as indicators. These are determined by a complex pattern of social and economic changes, ranging from income distribution, and literacy, as well as access to safe water, sanitation and medical services. If the correlations observed in the past between such patterns, and a general indicator of economic welfare like GDP per capita, are accepted as a rough guide for the future, a further increase in disease-adjusted life expectancy is to be expected. In effect, the trajectories shown in Box 1.1. 6. Pressure-state-impact-response framework; social, economical and environmental systems; transitions; integrated models; and scenarios.. 6.
(22) THE CORE QUESTIONS. combine two transitions: the demographic and the epidemiological. These global smooth curves hide significant regional variations. The economic system constitutes the second major driving force in the global human-environment system. Driven by the re-investment of some of the industrial output and sales of natural resources into agricultural and manufacturing production facilities, this economic growth process feeds on a stream of productivity-raising innovations and a gradual infrastructural unfolding of roads, schools, hospitals and other facilities. Together, these comprise the stocks of man-made capital. It is well acknowledged that the adequate functioning of this man-made capital has to be accompanied by investments to maintain and enhance other, less tangible forms of capital. This comprises what is called ‘human capital’ (including aspects such as education) and maybe even ‘social capital’ (such as community and governance structures) as well. It has become equally evident that the system can only be sustained by a continuous influx of energy and material derived from ‘environmental capital’. History has shown time and again that a proper balance between these three forms of capital and their use is an important condition for the human aspiration to a healthy, fulfilling and prosperous life. Underlying the growth of aggregate economic output is the transition from a largely agricultural to an industrial economy, and then towards a service and information-oriented economy - the economic transition (compare Box 1.1, see also Maddison, 1991). Derived demands for energy, raw materials, food and water The mutually interacting dynamics of human population and economic growth will be henceforth referred to as pressure components, generating a demand for food, water, energy and raw materials. These derived demands, as they are called in the economic sciences, have to be delivered by a great variety of natural systems. Given the common expectation of population and economic growth (Box 1.1), one can make forward projections of the demand for food, water and energy. A common procedure is to use the present intensities, measured as physical fluxes per unit of activity, to depict a future in which there are no qualitative changes apart from population and economic transitions. This would, at least after some time, lead to a slow decline in the growth of the demand for food, water, energy and raw materials due to the dynamics of the demographic and epidemiological transition, and the relatively low intensity of services and information-oriented activities. To meet the derived demands, part of the economic output must be invested in the expansion and maintenance of the capital stocks (agricultural land and equipment for the supply, transport and processing of water and fuels) that generate these outputs. Clearly, the assumption of constant intensities is at odds with the historical evidence, which suggests that these intensities are also subject to transitions. For food, there are the trends to a higher share of meat in the average diet and to more processing; in agriculture, the trend is to more intensive farming. Water demand is expected to rise parallel to increased access to safe water, while at the same time water intensity may start to decline, as is already evidenced by current developments in water treatment, re-use and irrigation. For energy, the trend towards increasing intensity with the onset of industrialization is reversed once services and informationoriented activities start to dominate, and new and more efficient technologies diffuse to new users. The changes in intensity reflect a complex pattern of economic, social and cultural changes intricately related to the quality of human life and underlying aspirations and values - as is the case with population transitions. Hence, their historical interpretation is controversial and their future development is hotly disputed. Obviously, calculation of the food, water and energy intensities is fraught with controversies and uncertainties. Yet, using prevailing insights and expectations, it is possible to make reference projections of plausible transitions. From the illustrative model simulations presented in Box 1.1, we can see two major features for food: 1) food intake per capita may be slowly saturated and 2) the fraction of animal products in the. 7.
(23) THE FUTURE OF THE GLOBAL ENVIRONMENT. average diet is likely to increase. For health expenditures, another determinant of demographic changes, a persistent rise over the next century has already begun. For water, the key components number an increase in public water supply and in the water used by industry. For energy, the most important aspects of a possible transition are the decreasing energy use per unit of economic output and the shift away from carbon-based fuels, both after an initial period of increase. Environmental pressures Combining these intensities with the demographic and economic developments yields the simulated time path for the use of important natural capital stocks and flows: arable land, water reservoirs and fluxes, and energy resources and fluxes. This by a set of important pressures on the environment which result from the need to satisfy the demands for food, water, energy and raw materials. These include the amount of fertilizer used in agriculture, the amount of polluted water discharged onto surface waters and the emissions of various substances into the air (Box 1.1). The changing state of the environment Will the earth be able to meet humanity’s demand for these resources in a sustainable manner? This question can only be explored on the basis of the best available, yet still deficient insights into the operation of the earth’s life-support systems. Even then, in view of the normative nature. Box 1.1 A World in Transition: a model-based exploration of linkages This chapter proposes a framework of linked social, economic and environmental transitions to provide one possible way of organizing and analyzing the complex relationships between different aspects of world development and the sustainability of these relationships. The graphs in this box illustrate these relationships for a kind of ‘middle of the road’ scenario for long-term developments at the global aggregate level using a systems analysis approach. The model has been calibrated using historical data for the period 1800-1990. Derived from preliminary analysis with the TARGETS model (for a model description see Appendix III), the graphs emphasize the relationships, not data or figures. From left to right, the graphs illustrate possible linkages between different system components, such as different environmental compartments (Rotmans and de Vries, 1997). From top to bottom, the graphs illustrate a chain involving driving forces, derived demands, environmental pressure, a changing state of the environment and impacts. Various responses are part of the overall dynamics but not shown here. The top graphs illustrate possible developments of the driving forces population and economy; they also include the notions of a demographic transition towards higher healthy life expectancy and a growing economy that changes its composition from agricultural through industrial to service-dominated. The derived demands for energy, raw materials, food and water can be characterized by a ‘transition’ towards greater efficiency. At the global level, the associated environmental pressures are related to these demands through decreasing emissions or landuse changes per unit of demand and increasing resource productivity. This process will be fastest for pressures that can be mitigated relatively easily, such as sulphur emissions, slower for other emissions, such as nitrogen oxides, and as in the example, slowest for greenhouse gases. The resulting changes in the state of the environment and associated impacts are dependent on whether, and if so, how and how fast, these transitions take place. Implicitly, any forward calculation, like the hypothetical one in the graphs, includes important response elements. The illustrations are not intended to describe the most likely future, nor a desirable one. In the real world, developments will be different from those in the illustrations. Perhaps even more important, they will be very different at the regional and subregional levels, dependent on regional and subregional characteristics. Different developments of the various feedback processes - including the ways they are influenced by human choices - lead to different shapes of the curves. The illustrate the importance of the linkages between the social, economic and environmental components of a world that is undergoing rapid changes. The analysis of the linkages suggests that in some instances social, economic and environmental goals may be compatible. In other cases, trade-offs seem unavoidable.. 8.
(24) THE CORE QUESTIONS. Box 1.1 continued. population. 1990US$ basemortal. lifestyle poverty only environment healthy life expectancy. 100. 10.109. 5.10. economic capital. morbidity and mortality components year. persons. 50. 9. industry services. 6.1014 4.1014. 2 .1014 0 1900. 1950. 2000. 2050. 0 1900. 2100. GWP per capita. 1950. 2000. 2050. 2100. 1900. MJ/$ agriculture industry services. 20. 0 1900. 1950. 2000. 2050. 20. 1950. 2000. 2050. 2100. water use per capita. domestic irrigation industry. 500. 0 1900. 2100. 2050. 1000. 100. 2050. 2000. dping dped. 200. 2000. 2000. 1950. m3 /cap. animal products. 1950. NOx. 0 1900. 2100. N. 4000. 0 1900. SO2. 100. N fertilizer use. food consumption per capita k cal/cap day vegetable products. 2100. 50. 0 1900. 2100. 2050. million ton S resp. N non fossil fossil. 10. 10. 2000. SO2 /NOx emission from fossil fuel use. energy use per $ of GWP. 1000 $ / cap. 1950. 1950. 2000. 2050. 0 1900. 2100. 1950. untreated waste water. 2000. 2050. 2100. CO 2 emission from fossil fuel use. m3. Pg C domestic industrial. 12. 2.10. 20 15 10. 12. 1.10. 5 0 1900. 1950. 2000. 2050. 1900. 2100. land area developing regions. million km 2 80. million km2 80 forest grass arable irrigated other. 60. 1950. 2000. 2050. 2100. quality distribution surface water. land area developed regions 1.0. high. forest grass arable irrigated other. 60. med-high med-low low. 0.5 40. 40. 20 1900. 20 1950. 2000. 2050. 2100. 1900. sea level rise (glob.avg.). 0.0 1950. 2000. 2050. 2100. 1900. ppmv. 1.0. 2000. 2050. 2100. temperature increase (glob.avg.). atmospheric CO2 concentration. meter. 1950. oC. 800. 3.0. 600. 2.0. 400. 1.0. 0.5. 0.0 1900. 1950. 2000. 2050. 2100. 200 1900. 0.0 1950. 2000. 9. 2050. 2100. 1900. 1950. 2000. 2050. 2100.
(25) THE FUTURE OF THE GLOBAL ENVIRONMENT. of the notion of sustainability, any answer to this question will contain value-loaded judgments. The supply of food, both for humans and animals, will cause a further extension of the land used for cultivation (Box 1.1). Use of inputs per ha may rise steadily too, leading to higher yields. Effluents to land and water will increase, especially with regard to nitrogen compounds. Placing higher demands on water resources will lead to an increase in the average costs of supplying water and to a decline in the available groundwater. Finally, the supply of energy in various forms will cause a decline in the fossil-fuel resource base. Supply costs are expected to eventually increase as the high costs of new deposits are no longer compensated for by cost-reducing innovations. New sources and technologies will slowly penetrate into the market which, in combination with abatement measures, will tend to slow down or reverse current trends in emissions of carbon, sulphur and nitrogen compounds (Box 1.1). The changes in environmental capital are related in complex ways to a whole set of characteristics, the change of which impacts on the human-economy system. Some of these interfere directly with its functioning, while others have a less direct impact in the sense that they have to be accommodated by altering the patterns of activities and investments. Mutual interactions between changes and responses Finally, the illustrative projection reported in Box 1.1 already contains important elements of human response behaviour. Declining productivity of land is counteracted by additional fertilizer use; the rising marginal costs of water supply require additional investments; depletion of fossilfuel resources combined with the expectation of global warming encourages energy conservation and a switch to renewable energy sources. It is possible to evaluate different transition paths, which have an ‘acceptable’ impact on the natural environment, in the provision of energy, materials, food and water resulting from the same driving forces scenario. Acceptability here is interpreted in the context of Agenda 21 statements about the quest for sustainable development. Several possible orientations for this exploration are indicated in this report, but contributions to future editions of the GEO are envisaged to elaborate further on these issues. Two general remarks are pertinent here. First, the economic, political and cultural circumstances needed for successful implementation of desirable transitions are not extensively discussed in this report. Nor is it suggested that they involve major or disruptive political measures or socioeconomic changes. In fact, some of the transitions may already have started and may evolve further as a consequence of current or emerging technologies, insights and attitudes. Second, this chapter does not analyze the feedbacks that would result from the transitions discussed or from the impacts of the socioeconomic driving forces through the environment system. The reason for this is that these feedbacks are extremely complex including changes in trade and consumption patterns, and income distribution within and between nations. Using the mental framework illustrated above, the following chapters explore possible developments at global and regional levels for a number of selected themes using a different, more detailed scenario for future developments.. 10.
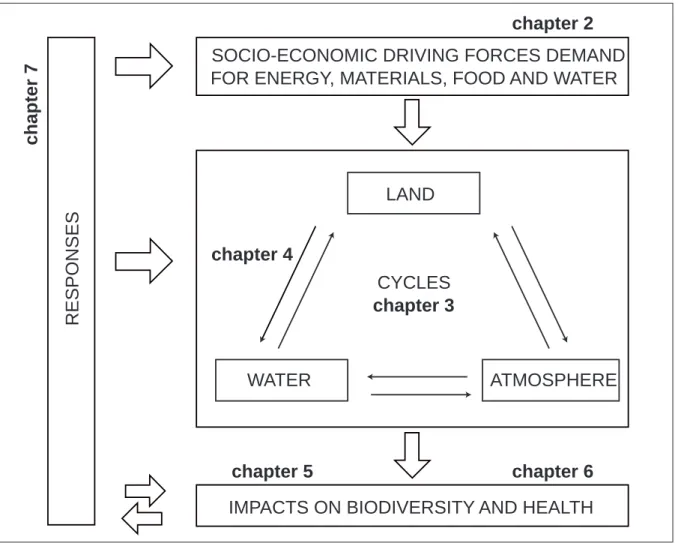
(26) THE CORE QUESTIONS. 1.3. Structure of this report. This report focuses primarily on the period 1970-2015. This is because reliable historical data are often only generally available from 1970 onwards and the year 2015 is believed to match the time perspective of decision-makers. In the assessment, this time period is placed in the perspective of the 1900-2050 period to account for the significance of the slow-moving dynamics in environmental and socio-economic developments, while acknowledging the historical data before 1950 as less certain and making the scenario assumptions beyond 2015 even more speculative. The findings of the analysis are reported in terms of six regions, corresponding with the division of the UNEP regional offices (Figure 1.5). This chapter has been structured using the pressure - state - impact - response framework. Questions asked are: - How will socioeconomic driving forces affect freshwater and land resources, and how will these changes mutually interact, for example, through element cycles? (Figure 1.6). - Why are these changes important for society? To begin with, Chapter 2 deals with the development of the social and economic driving forces. Chapters 3 and 4 discuss how this pressure influences selected aspects of the environment. Chapter 3 alone addresses the importance of selected elements of the interacting global element cycles for environmental quality, while Chapter 4 addresses land resources, their potential for food production and associated dependence on freshwater resources. The impacts on selected components of natural areas (Chapter 5) and society (Chapter 6) are subsequently addressed. Finally, Chapter 7 looks at how society can respond to these projected changes. The appendices provide background information on the data, models and scenarios used.. Europe and former USSR. Latin America. Asia and Pacific. West Asia. North America. Africa. Figure 1.5. GEO regional breakdown. 11.
(27) THE FUTURE OF THE GLOBAL ENVIRONMENT. chapter 2 chapter 7. SOCIO-ECONOMIC DRIVING FORCES DEMAND FOR ENERGY, MATERIALS, FOOD AND WATER. RESPONSES. LAND chapter 4 CYCLES chapter 3. WATER. ATMOSPHERE. chapter 5. chapter 6. IMPACTS ON BIODIVERSITY AND HEALTH Figure 1.6 Elements of the pressure-state-impact-response framework covered in this report. 12.
(28) THE CORE QUESTIONS. References Bakkes, J.A., G.J. van den Born, J.C. Helder, R.J. Swart, C.W. Hope and J.D.E. Parker (1994). An Overview of Environmental Indicators: State of the Art and Perspectives. UNEP/RIVM. UNEP Environment Assessment Technical Reports nr. UNEP/EATR.94-01; RIVM/402001001. Environmental Assessment Sub-Programme, UNEP, Nairobi. DPCSD (1996). Report of the first meeting of the Global Modelling Forum for Sustainable Development. New York (in preparation). Kahn, H. and A. Wiener (1967). The Year 2000. MacMillan, New York. Maddison, A. (1991). Dynamic Forces in Capitalist Development - a Long-run Comparative View. Oxford University Press, Oxford. Rotmans, J. and H.J.M. de Vries (eds.) (1997, forthcoming). Perspectives on global futures. Cambridge University Press, Cambridge. Serageldin, I. (1996). Sustainability and the Wealth of Nations: First steps in an ongoing journey. Environmentally sustainable development studies and monographs series; no. 5. World Bank, Washington D.C. Swart, R.J., J.A. Bakkes (eds.), L.W. Niessen, J. Rotmans, H.J.M. de Vries and R. Weterings (1995). Scanning the Global Environment: A framework and methodology for integrated environmental reporting and assessment. UNEP/RIVM. UNEP/EATR. 95-01; RIVM/402001002. Environmental Assessment Sub-Programme, UNEP, Nairobi.. 13.
(29)
(30) 2. ENVIRONMENTAL PRESSURE: SOCIOECONOMIC DRIVING FORCES AND DERIVED DEMANDS. 2.1. The issue. Introduction This chapter focuses on the pressure element of the pressure-state-impact-response cycle. The main cause of pressure on the environment is the growing demand for energy, raw materials, food and water. The basic driving forces behind this demand are increased production and consumption, and population growth. Pressures on the environment resulting from these driving forces and derived demands have led to a change in land cover around the world and a depletion of the stocks of natural resources and ecosystems. More recently, there has been a significant disturbance of natural cycles and fluxes of substances like nutrients and toxic compounds between the environmental compartments (land, water and the atmosphere). From the perspective of environmentally sustainable development, it is crucial to understand the linkages between driving forces and their consequences. To do this, it is necessary, first of all, to take a look at the past1. Scenario analysis methods will then be applied to explore how these linkages and developments may turn out in the future. The previous chapter introduced the concept of transitions. From a historical perspective, two types of transitions in the socioeconomic driving forces can be inferred. The first is an economic transition: from an often inequitable, agriculture-based economy through a phase of materialintensive industrialization towards a more equitable, service-based and material-extensive economy. Some industrialized countries are in an advanced stage of this transition. The second is the related health transition2 from a low-density, agricultural-based society with high fertility and mortality rates in which communicable diseases are the main cause of poor health, through to an industrialization phase, with decreasing mortality rates, and on to an urbanized, service-based society with low fertility and mortality rates and where the trend has shifted to chronic diseases. It is uncertain whether and, if so, when, other regions want to, or will be able to, go through the same type of transitions. In the previous chapter the concept of transition was broadened beyond the economic and health transitions so as to catch environmental changes in the fields of energy, raw materials, land and water too. For example, in the energy field, a major transition from renewable to fossil fuels took place in the past, while a new transition to a different energy system may take place in the future, meaning a possible return to renewable sources as a result of environmental concerns or eventually - due to a scarcity of fossil fuels. Concerning land, the transition of predominantly non-domesticated lands to tightly planned and managed domesticated land use has now taken place in many regions. In the following chapters, these and other changes will be discussed in more detail. A multitude of economic, technological and environmental forecasts has been developed. However, most of these are limited in scope, either focusing on a particular subsystem or theme (population, economy, energy and climate change, etc.). A conventional development scenario is used in this report to describe one possible future for (1) the growth of population and economies 1. Information on the past has been used to calibrate the models. The model used most extensively for this chapter, RIVM’s IMAGE model, has been calibrated against post-1950 data on the economy, demography, energy and land use, while improved calibration using a 100-year database is currently in progress (Klein Goldewijk and Battjes, 1995).. 2. Health transition comprises demographic and an epidemiological transitions.. 15.
(31) THE FUTURE OF THE GLOBAL ENVIRONMENT. Table 2.1. Selected historical data and scenario assumptions, absolute figures 1950. 1990. 2015. 2050. 1950-1990 %. 1990-2015 %. 2015-2050 %. Population (in billions) Africa Asia & Pacific Europe Latin America North America West Asia Developed regions Developing regions World. 0.22 1.32 0.57 0.16 0.17 0.07 0.74 1.77 2.51. 0.64 2.93 0.79 0.45 0.28 0.20 1.07 4.21 5.28. 1.26 4.07 0.86 0.64 0.32 0.41 1.18 6.38 7.56. 2.20 5.16 0.89 0.82 0.33 0.73 1.22 8.91 10.13. 2.7 2.0 0.8 2.5 1.3 2.7 0.9 2.2 1.9. 2.7 1.3 0.4 1.5 0.6 2.9 0.4 1.7 1.4. 1.6 0.7 0.1 0.7 0.1 1.6 0.1 1.0 0.8. Gross Domestic Product (in trillion 1990 US$) Africa Asia & Pacific Europe Latin America North America West Asia Developed regions Developing regions World. 1950 0.1 0.4 1.7 0.2 1.7 0.1 3.4 0.8 4.2. 1990 0.4 4.7 8.1 1.1 6.0 0.6 14.2 6.8 21.0. 2015 1.0 12.0 15.1 2.4 13.1 1.6 28.1 17.0 45.1. 2050 4.3 30.8 27.3 6.9 21.6 6.9 48.9 47.1 96.0. 1950-1990 3.6 6.4 4.0 4.7 3.2 5.3 3.6 5.6 4.1. 1990-2015 3.6 3.9 2.5 3.1 3.1 4.1 2.8 3.7 3.1. 2015-2050 4.2 2.7 1.7 3.0 1.4 4.3 1.6 3.0 2.2. Primary energy* consumption (in EJ) Africa Asia & Pacific Europe Latin America North America West Asia Developed regions Developing regions World. 1950 1.2 4.8 30.7 1.9 37.4 0.4 68.1 8.4 76.5. 1990 7.4 68.7 129.9 14.3 88.8 11.4 218.8 101.8 320.6. 2015 16.5 185.1 185.5 25.1 132.7 26.4 318.1 253.2 571.3. 2050 58.9 336.1 205.5 55.4 121.6 59.1 327.1 509.5 836.6. 1950-1990 4.6 6.9 3.7 5.1 2.2 8.8 3.0 6.4 3.6. 1990-2015 3.3 4.0 1.4 2.3 1.6 3.4 1.5 3.7 2.3. 2015-2050 3.7 1.7 0.3 2.3 -0.2 2.3 0.1 2.0 1.1. Caloric intake (in trillion kcal/day) Africa Asia & Pacific Europe Latin America North America West Asia Developed regions Developing regions World. 1970 0.8 4.1 2.3 0.7 0.7 0.3 3.0 5.9 8.9. 1990 1.5 7.3 2.7 1.2 1.0 0.6 3.7 10.5 14.3. 2015 3.2 10.8 3.0 1.8 1.2 1.2 4.1 17.0 21.1. 2050 6.2 14.1 3.1 2.4 1.2 2.2 4.3 24.9 29.1. 1970-1990 1.6 1.4 0.4 1.3 0.8 1.9 0.5 1.5 1.2. 1990-2015 3.1 1.6 0.3 1.6 0.6 3.0 0.4 1.9 1.6. 2015-2050 1.9 0.8 0.1 0.9 0.1 1.7 0.1 1.1 0.9. Total water withdrawal (in 1000 km3/yr) Africa Asia & Pacific Europe Latin America North America West Asia Developed regions Developing regions World. 1950 n.a. n.a. n.a. n.a. n.a. n.a. n.a. n.a. n.a.. 1990 0.15 1.30 0.72 0.18 0.51 0.13 1.23 1.75 2.98. 2015 0.20 1.65 0.87 0.24 0.58 0.17 1.45 2.26 3.72. 2050 0.28 2.05 0.91 0.30 0.57 0.21 1.49 2.84 4.33. 1950-1990 n.a. n.a. n.a. n.a. n.a. n.a. n.a. n.a. n.a.. 1990-2015 1.3 1.0 0.8 1.2 0.5 1.1 0.7 1.0 0.9. 2015-2050 1.0 0.6 0.1 0.7 0.0 0.7 0.1 0.7 0.4. Energy intensity** (in MJ/1990 US$) Africa Asia & Pacific Europe Latin America North America West Asia Developed regions Developing regions World. 1950 12.1 12.2 17.9 10.5 21.7 5.3 19.8 11.1 18.2. 1990 17.9 14.7 16.0 12.5 14.7 20.0 15.4 15.0 15.3. 2015 16.4 15.4 12.3 10.3 10.1 16.8 11.3 14.9 12.7. 2050 13.7 10.9 7.5 8.0 5.6 8.6 6.7 10.8 8.7. 1950-1990 1.0 0.5 -0.3 0.4 -1.0 3.4 -0.6 0.8 -0.4. 1990-2015 -0.4 0.2 -1.0 -0.8 -1.5 -0.7 -1.2 0.0 -0.8. 2015-2050 -0.5 -1.0 -1.4 -0.7 -1.7 -1.9 -1.5 -0.9 -1.1. Production of Maize (in Tg) Africa Asia & Pacific Europe Latin America North America West Asia Developed regions Developing regions World. 1970 21.4 49.2 46.1 36.8 125.3 1.8 171.4 109.2 280.6. 1990 36.7 116.6 70.5 55.9 202.1 3.1 272.6 212.3 484.9. 2015 82.7 220.5 91.8 91.6 224.1 4.3 315.9 399.0 714.9. 2050 186.8 296.5 121.0 153.7 251.5 3.8 372.5 640.7 1013.2. 1970-1990 2.7 4.4 2.1 2.1 2.4 2.7 2.3 3.4 2.8. 1990-2015 3.3 2.6 1.1 2.0 0.4 1.3 0.6 2.6 1.6. 2015-2050 2.4 0.8 0.8 1.5 0.3 -0.4 0.5 1.4 1.0. * ** n.a.. Exclusive of modern biofuels (compare Figure 2.5) Energy intensity = Primary energy consumption divided by Gross Domestic Product = data not available. 16.
(32) ENVIRONMENTAL PRESSURE. Table 2.2. Selected historical data and scenario assumptions, per capita 1950. 1990. 2015. 2050. 1950-1990 %. 1990-2015 %. 2015-2050 %. Gross Domestic Product per capita (in 1000 $/cap; (1990 US$)) Africa 0.5 0.6 Asia & Pacific 0.3 1.6 Europe 3.0 10.3 Latin America 1.1 2.6 North America 10.4 21.8 West Asia 1.1 2.8 Developed regions 4.7 13.3 Developing regions 0.4 1.6 World 1.7 4.0. 0.8 2.9 17.5 3.8 40.8 3.8 23.8 2.7 6.0. 2.0 6.0 30.5 8.4 65.5 9.5 40.0 5.3 9.5. 0.8 4.3 3.1 2.1 1.9 2.5 2.7 3.4 2.2. 0.9 2.5 2.1 1.6 2.5 1.2 2.4 2.0 1.6. 2.6 2.0 1.6 2.3 1.4 2.6 1.5 2.0 1.3. Primary energy* consumption per capita (in GJ/cap) Africa Asia & Pacific Europe Latin America North America West Asia Developed regions Developing regions World. 1950. 1990. 2015. 2050. 1950-1990. 1990-2015. 2015-2050. 5.6 3.6 53.7 11.8 225.3 5.6 92.3 4.7 30.5. 11.6 23.5 164.5 32.1 321.2 56.5 205.1 24.2 60.7. 13.2 45.5 215.1 39.2 414.2 64.3 269.0 39.7 75.6. 26.8 65.1 229.9 67.6 368.5 81.4 267.3 57.2 82.6. 1.8 4.8 2.8 2.5 0.9 5.9 2.0 4.2 1.7. 0.5 2.7 1.1 0.8 1.0 0.5 1.1 2.0 0.9. 2.1 1.0 0.2 1.6 -0.3 0.7 0.0 1.0 0.3. Caloric intake per capita (1000 kcal/cap day) Africa Asia & Pacific Europe Latin America North America West Asia Developed regions Developing regions World. 1970 2.2 2.1 3.3 2.5 3.2 2.4 3.3 2.1 2.4. 1990 2.4 2.5 3.4 2.7 3.6 2.9 3.5 2.5 2.7. 2015 2.6 2.7 3.4 2.8 3.7 3.0 3.5 2.7 2.8. 2050 2.8 2.7 3.4 2.9 3.6 3.0 3.5 2.8 2.9. 1970-1990 0.4 0.9 0.3 0.4 0.6 0.9 0.4 0.8 0.6. 1990-2015 0.3 0.3 0.0 0.2 0.0 0.1 0.0 0.3 0.1. 2015-2050 0.3 0.1 0.0 0.1 0.0 0.0 0.0 0.1 0.1. Total water withdrawal per capita (in 1000 m3/cap yr) Africa Asia & Pacific Europe Latin America North America West Asia Developed regions Developing regions World. 1950. 1990. 2015. 2050. 1950-1990. 1990-2015. 2015-2050. n.a. n.a. n.a. n.a. n.a. n.a. n.a. n.a. n.a.. 0.23 0.44 0.91 0.40 1.85 0.64 1.15 0.42 0.56. 0.16 0.41 1.01 0.38 1.82 0.41 1.23 0.35 0.49. 0.13 0.40 1.02 0.37 1.74 0.29 1.21 0.32 0.43. n.a. n.a. n.a. n.a. n.a. n.a. n.a. n.a. n.a.. -1.4 -0.4 0.4 -0.3 -0.1 -1.8 0.3 -0.6 -0.5. -0.6 -0.1 0.0 -0.1 -0.1 -1.0 0.0 -0.3 -0.4. Energy intensity** per capita (in J/$ cap; (1990 US$)) Africa Asia & Pacific Europe Latin America North America West Asia Developed regions Developing regions World. 1950. 1990. 2015. 2050. 1950-1990. 1990-2015. 2015-2050. 55.3 9.2 31.2 64.1 130.8 77.1 26.8 6.3 7.3. 28.0 5.0 20.2 28.0 53.2 99.1 14.5 3.6 2.9. 13.0 3.8 14.3 16.1 31.7 40.9 9.6 2.3 1.7. 6.2 2.1 8.4 9.8 17.0 11.8 5.5 1.2 0.9. -1.7 -1.5 -1.1 -2.0 -2.2 0.6 -1.5 -1.4 -2.3. -3.0 -1.1 -1.4 -2.2 -2.1 -3.5 -1.6 -1.7 -2.2. -2.1 -1.7 -1.5 -1.4 -1.8 -3.5 -1.6 -1.8 -1.9. Production of Maize (in kg/cap) Africa Asia & Pacific Europe Latin America North America West Asia Developed regions Developing regions World. 1970 98.0 37.3 80.6 224.3 755.0 26.5 232.3 61.6 111.8. 1990 57.3 39.9 89.3 125.4 730.7 15.3 255.6 50.4 91.8. 2015 65.8 54.2 106.4 143.3 699.7 10.4 267.1 62.6 94.6. 2050 85.0 57.4 135.3 187.6 762.2 5.2 304.4 72.0 100.0. 1970-1990 -2.6 0.3 0.5 -2.9 -0.2 -2.7 0.5 -1.0 -1.0. 1990-2015 0.6 1.2 0.7 0.5 -0.2 -1.5 0.2 0.9 0.1. 2015-2050 0.7 0.2 0.7 0.8 0.2 -2.0 0.4 0.4 0.2. * ** n.a.. Exclusive of modern biofuels (compare Figure 2.5) Energy intensity = Primary energy consumption divided by Gross Domestic Product = data not available. 17.
Afbeelding
+7
GERELATEERDE DOCUMENTEN
the benefits requires putting a value on improvements in environmental quality, in. health, and
(2012) Spitzer catalog of Orion YSOs is a powerful tool for the type of analysis used in this paper: it is consistent with the way other samples of Class II disks in nearby
o to transplant the features of domestic constitutionalism and to describe them in a global context as a global constitution, the global rule of law,
If there are no innovations in second-period market fundamentals, both Responsive Quotas and Endogenous Taxes implement the first best level of emissions in either period and
However, the coding procedures performed on every encoded packet must be recorded in another way, as the selection of the random coefficients at the
In lijn met deze theorieën gaan wij er in dit onderzoek vanuit dat de conversational human voice meer invloed zal hebben op de relatie tussen de perceived eWOM
Find the customers (preferably big) and sell them the complete system. Market leaders are important and can have a large influence. Price was not an issue, Hyva solutions were
This interactive workshop will act as a multidisciplinary forum where researchers, practitioners and experts from a variety of scientific domains (such as
