A comparison of concentric
isokinetic knee parameters in elite
soccer and field hockey players
Sietse Vispoel
Tim Willocx
Christophe Wozny
Promoter: Prof. dr. Damien Van Tiggelen
Cross-sectional study presented for obtaining the Master’s degree in Rehabilitation Sciences and Physiotherapy
A comparison of concentric
isokinetic knee parameters in elite
soccer and field hockey players
Sietse Vispoel
Tim Willocx
Christophe Wozny
Promoter: Prof. dr. Damien Van Tiggelen
Cross-sectional study presented for obtaining the Master’s degree in Rehabilitation Sciences and Physiotherapy
Table of contents
Acknowledgement ... 5
List of tables and figures ... 6
List of abbreviations ... 6 1. Abstract ... 6 1.1 English version ... 6 1.2 Dutch version ... 7 2. Introduction ... 9 3. Methods ... 12 3.1 Study Design ... 12 3.2 Participants ... 12 3.3 Instrumentation ... 12 3.4 Procedure ... 12 3.5 Statistical analysis ... 13 4. Results ... 15 5. Discussion ... 20 5.1 Athletes ... 20
5.2 Peak Torque per Body Weight ... 21
5.3 Hamstrings/Quadriceps Ratio ... 23
5.4 Total Work ... 26
5.5 Average Power ... 26
5.5 Strengths and Limitations ... 27
6. Conclusions ... 29
7. Conflict of interest ... 29
8. References ... 30
9. Abstract in layman’s terms ... 36
10. Appendix ... 37
Acknowledgement
Hereby, the authors want to acknowledge the following important people who helped us through the process of this Master thesis, aiding us towards the master’s degree in Rehabilitation Sciences and Physiotherapy.
First, we would like to express our gratitude to Prof. dr. Damien Van Tiggelen for providing insight in this research process and guiding us through this fascinating project. It has been genuinely delightful to work with these groups of top-level athletes. In addition, much appreciation goes to the Sporting Lokeren soccer club, particularly their under-21 players, and the athletes of the Belgian national under-21’s field hockey team for voluntarily participating in this study. This research would not have been possible without their efforts.
List of tables and figures
• Figure 1: Biodex Starting Position 13
• Table 1: Isokinetic Test Protocol 14
• Table 2: Peak Torque per Body Weight values (mean + SD) and significant
differences (*; **; ***) between soccer and field hockey 15 • Table 3: Hamstrings/Quadriceps Ratio values (mean + SD) and significant
differences (*; **; ***) between soccer and field hockey 16 • Table 4: Total Work values (mean + SD) and significant
differences (*; **; ***) between soccer and field hockey 17 • Table 5: Average Power values (mean + SD) and significant
differences (*; **; ***) between soccer and field hockey 18
• Table 6: 95% Confidence Interval 19
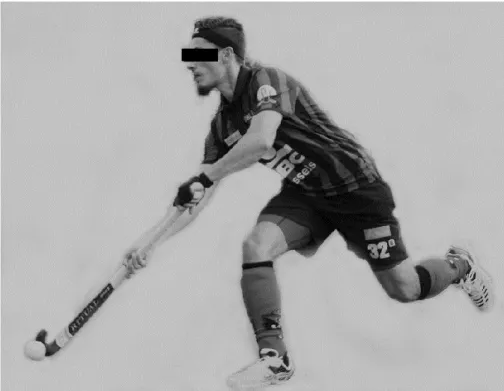
• Figure 2 & 3: Recovering from a deep lunge position in field hockey 21
• Figure 4: Leaning forward position in field hockey 22
• Figure 5: More upright position in soccer 22
List of abbreviations
• PTBW = Peak Torque per Body Weight • H/Q ratio = Hamstrings/Quadriceps Ratio • TW = Total Work
• AP = Average Power • ROM = Range of Motion
6
1. Abstract
1.1 English version
Background
Soccer and field hockey are two sports containing multiple short sprints, alternated with longer periods of time at a low intensity. Both are characterized by rapid changes of direction. There are no comparative studies between soccer and field hockey using isokinetic knee testing. Objectives
The aim of this study was to detect and discuss the differences and similarities in various isokinetic parameters between elite male soccer and hockey players. The following step was to determine the implication of the study results for these sports.
Study Design
Cross-Sectional Study. Methods
46 elite athletes were assessed to examine isokinetic strength of concentric knee extensors and flexors at 60°/s, 180°/s and 240°/s. Participants were under-21 Belgian elite soccer players (n=21) and under-21 Belgian elite field hockey players (n=25), who train regularly for four to five sessions per week and did not suffer from lower limb injury. Both groups were compared for Peak Torque per Body Weight (PTBW), Hamstrings/Quadriceps Ratio (H/Q ratio), Total Work (TW) and Average Power (AP).
Results
For the PTBW, H/Q ratio and TW parameters at 180°/s and 240°/s, significant differences (p<0.05) were found for both the left and the right side. The Hamstring muscles AP was statistically significant for both limbs at 60°/s, 180°/s and 240°/s. For the M. Quadriceps AP, there was only a statistical difference for the right limb at 60°/s, 180°/s and 240°/s. No significant differences (p>0.05) were found for PTBW and TW at 60°/s for the Hamstrings, nor for the M. Quadriceps at all angular velocities tested. The H/Q ratio showed no statistical difference either at 60°/s.
Conclusions
Differences in isokinetic strength between field hockey and soccer players were noticed, suggesting the manifestation of sport-specific muscle profiles. Minorly developed Hamstring muscles were found in soccer compared to hockey players, which contrasts to approximately equal results for the M. Quadriceps (exc. Average Power). As a result, lower H/Q ratios are
7 visible within the soccer population, inducing an increased risk of injuries (e.g., Hamstring strains, ACL ruptures, etc.). Isokinetic screening and individually tailored prevention programs could be an important factor in restoring the H/Q balance, thus diminishing the injury risk. Keywords: Isokinetic, Soccer, Field Hockey, Peak Torque per Body Weight, Hamstrings/Quadriceps Ratio
1.2 Dutch version
Achtergrond
Voetbal en hockey zijn sporten die bestaan uit multipele korte sprints, afgewisseld met langere periodes aan een lage intensiteit. Beiden worden gekenmerkt door snelle richtingsveranderingen. Er zijn geen studies te vinden waarbij men voetbal en hockey vergelijkt betreffende het isokinetisch spierwerk rond de knie.
Doelstellingen
Het doel van deze studie was om de gelijkenissen en verschillen tussen de elite voetballers en hockeyers te detecteren en analyseren via verscheidene isokinetische parameters. Daaropvolgend werd bekeken wat de implicaties kunnen zijn van de studieresultaten voor deze sporten.
Onderzoeksdesign Cross-Sectional Study. Methodes
46 topsporters stelden zich beschikbaar om de isokinetische, concentrische kracht van de knie extensoren en flexoren te testen aan 60°/s, 180°/s en 240°/s. De deelnemers waren U21 Belgische elite voetballers (n=21) en U21 Belgische elite hockeyers (n=25), die vier tot vijf keer per week trainen en geen last hadden van blessures aan de onderste ledematen. Beide groepen werden vergeleken voor Peak Torque per Body Weight, Hamstrings/Quadriceps Ratio, Total Work en Average Power.
Resultaten
Voor de PTBW, H/Q-ratio en TW parameters werd een significant verschil (p<0.05) gevonden voor zowel de linker- als rechterkant aan 180°/s en 240°/s. De AP van de Hamstringspieren was statistisch significant aan beide zijden aan 60°/s, 180°/s en 240°/s. Voor de M. Quadriceps was er enkel een statistisch verschil waarneembaar bij het rechterbeen aan 60°/s, 180°/s en 240°/s. Er werden geen significante verschillen (p>0.05) gevonden voor PTBW en
8 TW aan 60°/s voor de Hamstrings, noch voor de M. Quadriceps aan alle geteste hoeksnelheden. De H/Q-ratio toonde ook geen statistisch verschil aan 60°/s.
Conclusies
Verschillen in isokinetische kracht tussen hockey en voetballers werden opgemerkt, wat duidt op de aanwezigheid van sportspecifieke krachtprofielen. In het voetbal werden minder goed ontwikkelde Hamstrings gevonden in vergelijking met hockeyers. Dit in tegenstelling tot de M. Quadricepskracht, die tussen beide groepen ongeveer gelijk is (excl. Average Power). Als gevolg hiervan zijn lagere H/Q-ratio’s zichtbaar binnen de voetbalpopulatie, wat een verhoogd risico op blessures met zich meebrengt (bijv. Hamstringletsels, VKB-scheuren, ...). Isokinetische screening en individuele preventieprogramma's kunnen een belangrijke factor zijn bij het herstellen van de balans tussen Hamstrings en M. Quadriceps, waardoor het letselrisico vermindert.
Trefwoorden: Isokinetisch, Voetbal, Hockey, Peak Torque per Body Weight, Hamstrings/Quadriceps Ratio
9
2. Introduction
Isokinetic testing is acknowledged as the gold standard method for the evaluation of mechanical muscle abilities in both healthy and physically active subjects, as well as in a rehabilitating population (1–3). An isokinetic movement consists of a dynamic contraction at a constant angular velocity (4,5). A computer device adapts the resistance given by the dynamometer, so that the angular velocity remains constant (6). It can be useful for sport scientists and coaches to judge whether the adaptations to training are significant or not, as these measurements permit them to draw solid conclusions (7). Another application of isokinetic testing is to investigate the correlation between muscular composition and isokinetic strength, which has been explored for many years (8).
Peak Torque per Body Weight (PTBW) (9), Hamstrings/Quadriceps ratio (H/Q ratio) (10–13), Total Work (TW) (6,10,14,15) and Average Power (AP) (9) are frequently used parameters in isokinetic testing and can be an added value on a functional level. The reliability, quality and quantity of these isokinetic parameters was already assessed in a separate review for knee flexion and extension.
With an estimated 265 million active players, soccer is undoubtedly the most popular sport in the world (16). The performance in this sport depends on inextricably linked skills, abilities and qualities (17). To meet these requirements, the soccer player must feature various technical, biomechanical, tactical and physiological factors (18). An important physiological factor in soccer is agility, which represents fast movements of the body and reactive changes in directions and motions. It is a basic component in team sports such as futsal and soccer (19). Next to agility, activities such as sprinting or quickly changing direction are also crucial in a soccer game. Soccer can be categorized as a sport, requiring high speed actions, acceleration, maximum speed and agility (20).
The isokinetic muscle profile has been described several times at different levels within soccer (21). A high correlation was found between the isokinetic moment of force of the knee muscle group, and a soccer kick performance. In addition, an increase in soccer kick performance and isokinetic moment of force with increased angular velocity was found, thus emphasizing the importance of testing soccer athletes at these angular velocities. However, the reliability of isokinetic measurements at high angular velocities and eccentric conditions remains unclear (22).
10 During the soccer kick both Quadriceps and Hamstrings work concentrically and eccentrically. The knee extensor muscles produce the main force to kick the ball, whereas the antagonists (knee flexors) are activated to control the motion of the leg. This is more obvious in elite soccer players who demonstrate higher antagonist activity levels compared to untrained individuals (23).
Field hockey is one of the most widely practiced team sports, globally played in 132 countries. Although it’s recent popularity, way less research reports are being published on hockey compared to soccer related research. Field hockey is a high-intensity intermittent sport game (24), as shown by Chesher et al. (25) who states that elite female players cover up to 6800m of which 10% is at high intensity. Thus, it can be concluded that field hockey at the elite level is characterized by periods of low intensity activity alternated with short, high velocity, sprint efforts (25). Optimal skills and body composition, combined with high aerobic fitness, anaerobic power, strength and agility are needed for field hockey athletes as it is an intermittent endurance sport (26).
As noted earlier, field hockey and soccer are two sports containing multiple short sprints, alternated with longer periods of time at a low intensity (27). 90-95% of the time, soccer and field hockey players are in low intensity motions such as standing, walking and jogging. This is similar to many other team sports. Studies report a change in movement patterns every 5.5 seconds in field hockey. This is comparable to soccer in which a change of motion is mentioned every 5-7 seconds. It can be concluded that there is a high resemblance in exercise intensities and sprint activities between elite field hockey competition and elite soccer (28). Differences are noted in terms of field dimension and regulations. Both field hockey and soccer are played with a maximum of eleven players of each team on the field (29,30). In hockey there is no limit to the number of players being substituted (30). In soccer however, the maximum number of substitutes for competitions involving 1st teams of clubs in the top division or senior ‘A’ international teams, is three substitutes (29). In addition to the number of substitutes, the field dimensions also differ. A hockey field is rectangular, 91.40 meters long and 55.00 meters wide while a soccer field may vary between 45-90m for the goal lines and 90-120m for the touch lines (29,30). The duration of a hockey match is 60 minutes, consisting of four quarters of 15 minutes with a 2-minute interval between quarter 1 and 2, 3 and 4. An interval of 5 minutes is allowed between quarter 2 and 3 (30). A soccer game on the other hand lasts 90 minutes, more specifically, two equal halves of 45 minutes with a break at half-time not exceeding 15 minutes (29).
11 As there were no comparative studies found between soccer and field hockey using isokinetic testing, the aim of this study is to analyze possible differences or similarities in various isokinetic parameters (PTBW, H/Q ratio, TW & AP) tested on both groups of athletes. The following step is to determine the implications of the study results for these sports.
12
3. Methods
3.1 Study Design
Cross-Sectional Study, comparing healthy hockey and soccer players in an isokinetic manner.
3.2 Participants
This study included 46 elite athletes who train regularly for four to five sessions per week and did not suffer from lower limb injury. Participants were under-21 Belgian elite soccer players (n=21) and under-21 Belgian elite field hockey players (n=25). Descriptive characteristics (age, height, and weight) of both groups are presented in table 1.
The soccer players were selected from a national Belgian soccer team and the hockey players were selected from the Belgian national hockey team. Injured players were excluded from the study and the participating athletes were informed not to train on the day of the testing procedures. The isokinetic tests were performed at Ghent University (Department of Rehabilitation Sciences and Physiotherapy), Ghent, Belgium. The hockey athletes were tested in November 2019, the soccer athletes were tested in February 2020.
3.3 Instrumentation
The Isokinetic Dynamometer Biodex system 4 was used to evaluate the following isokinetic parameters: Peak Torque per Body Weight, Hamstrings/Quadriceps Ratio, Total Work and Average Power at 60°/s, 180°/s and 240°/s velocity.
During the isokinetic assessment, the participants executed maximal contractions of the knee joint muscles towards flexion and extension at a steady and predetermined angular velocity. The Range of Motion (ROM) was set at 90°.
3.4 Procedure
Before the actual testing started, the dynamometer was calibrated, and the lever arm was set up. When the athletes entered the laboratory, they were informed about the whole procedure of the test. First, the height and weight of each participant was measured and the date of birth, limb dominance and history of injuries were listed. A ten-minute warm-up on a cycle ergometer at a resistance of 1 Watt/Kilogram was performed by the athletes. The subjects were seated comfortably at approximately 90 degrees hip flexion and standard fixation was placed around the trunk and distal femur in order to diminish compensations. The athletes were asked to hold
13 both handles at the side of the chair during the isokinetic assessment, as presented in figure 1. The lever arm resistance pad was placed 2 cm proximal to the lateral malleolus. Furthermore, the Range of Motion was determined, and the leg was weighed by the Biodex isokinetic dynamometer. Each limb was tested individually and before measurements were taken, subjects performed submaximal trial repetitions in which they could experience the speed and resistance before recording the test. During the testing, the participants were given standard verbal encouragements by both examiners. After testing one leg, the procedure was repeated for the other side. The isokinetic test protocol is shown in table 1.
3.5 Statistical analysis
SPSS 25.0 was used for the statistical analysis of the data. Means and standard deviations were calculated for each variable via descriptive statistics. Normality tests were performed to determine the presence of a normal distribution of the data. Normal characteristics and values of the variables mentioned above were verified by the Shapiro-Wilk test. The unpaired t-test was applied to analyze the differences of all variables between both populations. Before the final interpretation, the results of the Levene’s test were necessary to clarify whether the variances could be considered equals. There were three main statistical significance levels: a significant difference (p<0.05), a strong significant difference (p<0.01) and a very strong significant difference (p<0.001).
14
Table 1: Isokinetic test protocol
Angular velocity Trial Measurement Rest
60°/s 1 repetition 3 repetitions 60 seconds
180°/s 2 repetitions 5 repetitions 60 seconds
15
4. Results
18 elite soccer players (mean ± SD; age = 17.6 ± 0.76 years; height = 180.7 cm ± 6.39; weight = 71.7 ± 6.64 kg) and 21 elite hockey players (mean ± SD; age = 18.1 ± 0.77 years; height = 179.9 cm ± 5.93; weight = 73.0 ± 9.25 kg) met the inclusion criteria and completed the whole testing procedure. 5 participants (2 soccer players and 3 hockey players) were excluded from the data due to being in a recovery stage of an injury.
The independent T-test showed a statistically significant difference (p<0.05) between soccer and hockey players for 22 out of the 45 variables. The results are presented in table 2, 3, 4 and 5. The 95% confidence interval can be found in table 6.
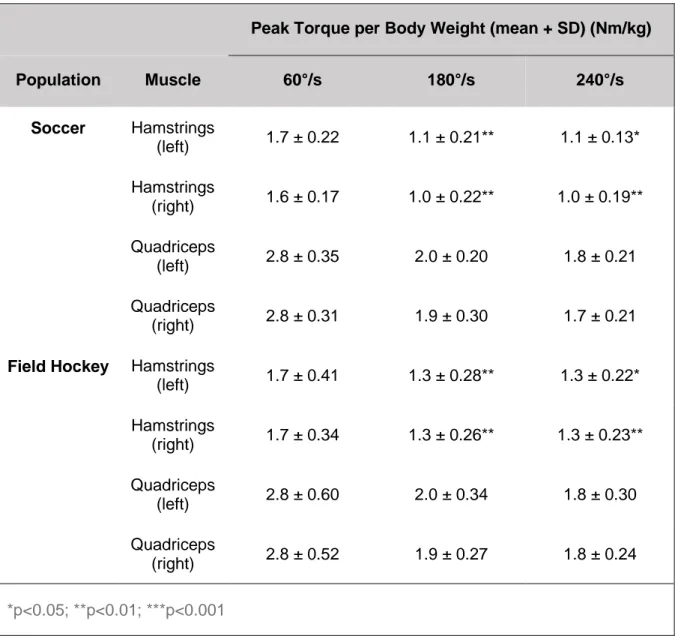
Table 2: Peak Torque per Body Weight values (mean + SD) and significant differences (*; **; ***) between soccer and field hockey
Peak Torque per Body Weight (mean + SD) (Nm/kg)
Population Muscle 60°/s 180°/s 240°/s Soccer Hamstrings (left) 1.7 ± 0.22 1.1 ± 0.21** 1.1 ± 0.13* Hamstrings (right) 1.6 ± 0.17 1.0 ± 0.22** 1.0 ± 0.19** Quadriceps (left) 2.8 ± 0.35 2.0 ± 0.20 1.8 ± 0.21 Quadriceps (right) 2.8 ± 0.31 1.9 ± 0.30 1.7 ± 0.21
Field Hockey Hamstrings
(left) 1.7 ± 0.41 1.3 ± 0.28** 1.3 ± 0.22* Hamstrings (right) 1.7 ± 0.34 1.3 ± 0.26** 1.3 ± 0.23** Quadriceps (left) 2.8 ± 0.60 2.0 ± 0.34 1.8 ± 0.30 Quadriceps (right) 2.8 ± 0.52 1.9 ± 0.27 1.8 ± 0.24 *p<0.05; **p<0.01; ***p<0.001
16
Table 3: Hamstrings/Quadriceps Ratio values (mean + SD) and significant differences (*; **; ***) between soccer and field hockey
Hamstrings/Quadriceps Ratio (mean + SD)
Population Leg 60°/s 180°/s 240°/s
Soccer Left 0.60 ± 0.11 0.53 ± 0.11** 0.65 ± 0.11*
Right 0.59 ± 0.08 0.55 ± 0.12** 0.61 ± 0.15**
Field Hockey Left 0.63 ± 0.11 0.66 ± 0.12** 0.74 ± 0.13*
Right 0.62 ± 0.11 0.67 ± 0.12** 0.73 ± 0.11**
17
Table 4: Total Work values (mean + SD) and significant differences (*; **; ***) between soccer and field hockey
Total Work (mean + SD) (J)
Population Muscle 60°/s 180°/s 240°/s Soccer Hamstrings (left) 392.9 ± 80.42 391.1 ± 135.11** 417.4 ± 100.93** Hamstrings (right) 378.8 ± 57.29 378.3 ± 141.88*** 380.4 ± 119.97*** Quadriceps (left) 567.9 ± 113.00 735.3 ± 118.80 653.0 ± 91.96 Quadriceps (right) 574.3 ± 94.98 697.0 ± 128.56 649.3 ± 69.14
Field Hockey Hamstrings
(left) 403.7 ± 82.20 527.9 ± 132.40** 510.9 ± 95.64** Hamstrings (right) 407.4 ± 69.94 537.5 ± 113.70*** 516.4 ± 101.05*** Quadriceps (left) 578.1 ± 107.03 753.0 ± 134.01 675.1 ± 121.00 Quadriceps (right) 575.6 ± 94.64 730.3 ± 100.93 671.8 ± 93.67 *p<0.05; **p<0.01; ***p<0.001
18
Table 5: Average Power values (mean + SD) and significant differences (*; **; ***) between soccer and field hockey
Average Power (mean + SD) (W)
Population Muscle 60°/s 180°/s 240°/s Soccer Hamstrings (left) 88.2 ± 15.19* 122.3 ± 42.28** 157.7 ± 45.43** Hamstrings (right) 85.3 ± 16.43** 116.5 ± 50.12*** 141.8 ± 51.31*** Quadriceps (left) 132.9 ± 24.79 236.4 ± 36.73 261.4 ± 41.77 Quadriceps (right) 130.2 ± 22.02* 224.0 ± 46.08* 256.6 ± 30.97*
Field Hockey Hamstrings
(left) 104.2 ± 24.06* 172.8 ± 44.43** 204.4 ± 38.51** Hamstrings (right) 104.4 ± 17.65** 178.2 ± 32.59*** 208.4 ± 40.35*** Quadriceps (left) 151.8 ± 36.70 259.2 ± 44.42 208.4 ± 40.35 Quadriceps (right) 153.1 ± 40.85* 256.0 ± 38.20* 286.7 ± 46.55* *p<0.05; **p<0.01; ***p<0.001
19
Table 6: 95% Confidence Interval
95% Confidence Interval (Lower - Upper)
Parameters Hamstrings left leg Hamstrings right leg Quadriceps left leg Quadriceps right leg
Peak Torque per Body Weight (Nm/kg) Concentric at 60°/s -0.23 - 0.18 -0.24 - 0.10 -0.25 - 0.40 -0.25 - 0.30 Concentric at 180°/s -0.41 - -0.09 -0.43 - -0.12 -0.18 - 0.18 -0.22 - 0.14 Concentric at 240°/s -0.26 - -0.03 -0.38 - -0.10 -0.15 - 0.18 -0.17 - 0.12 Hamstrings/Quadriceps Ratio Concentric at 60°/s -0.10 - 0.04 - 0.09 - 0.03 Concentric at 180°/s -0.20 - -0.05 -0.20 - -0.05 Concentric at 240°/s -0.17 - -0.01 -0.20 - 0.04 Total Work (J) Concentric at 60°/s -62.4 - 40.7 -69.3 - 12.3 -79.8 - 59.4 -61.3 - 58.8 Concentric at 180°/s -221.5 - -52.2 -240.0 - -78.4 -98.3 - 62.8 -105.8 - 39.3 Concentric at 240°/s -155.7 - -31.3 -205.8 - -66.2 -90.8 - 46.7 -75.2 - 30.3 Average Power (W) Concentric at 60°/s -28.9 - -3.0 -30.0 - -8.2 -39.0 - 1.2 -43.4 - -2.4 Concentric at 180°/s -79.2 - -21.8 -88.1 - -35.4 -48.8 - 3.2 -58.6 - -5.4 Concentric at 240°/s -73.1 - -20.1 -95.6 - -37.7 -53.3 - 4.5 -55.6 - -4.7
20
5. Discussion
This study maps the differences as well as the equities in isokinetic strength between elite hockey and soccer athletes, measured in different parameters such as Peak Torque per Body Weight, Hamstrings/Quadriceps Ratio, Total Work and Average Power. Several results were found in which significant differences can be noted when comparing soccer and field hockey players. de Lira et al. (32) confirms the influence of level and type of sport on isokinetic results. In contrast to these findings, Öberg et al. (33), Zakas et al. (34) & Charteris et al. (35) stated that among competitive athletes, neither the level nor the type of sport demonstrated significant effects on any isokinetic measures made.
However, the populations in these studies differ from ours in terms of level and type of sport, comparing for example elite national level soccer players with players from other levels and non-soccer players (33), basketball and soccer players (34) or even intercollegiate athletes of various sports (35). Consequently, the conclusion of the studies above may not be applicable to this study consisting of adolescent elite hockey and soccer players.
5.1 Athletes
No statistically significant differences were found between the heights (p=0.702) and body weights (p=0.616) of the hockey and soccer players.
The ages, on the other hand, appear to differ significantly (p=0.042). The soccer players are somewhat younger, with an average age of 17.6 ± 0.76 years, compared to the hockey players, who are 18.1 ± 0.77 years on average.
Yet, the clinical relevance of this statistical difference should be questioned. Forbes et al. (36), Kellis et al. (37) and Lehance et al. (38), for instance, state that in the expression of the isokinetic testing results of muscle strength compared to body weight, 17 year old highly trained soccer players have already reached a muscle strength of the flexor and extensor of the knee close to their maximal level. It was also shown by Śliwowski et al. (21) that the isokinetic strength results are mainly determined by differences in height and body weight. Since there are no significant differences noticeable within this study based on these morphological characteristics, the inequality in age appears to have little influence on the results to be interpreted (21).
21
5.2 Peak Torque per Body Weight
An important general note to make is that differences in values between soccer and field hockey populations within the PTBW parameter seem to increase as the angular velocity increases. Therefore, the identified inequalities become more apparent at higher angular velocities, as is also the case in this study.
It is striking that hockey players achieve higher isokinetic values for the Hamstrings PTBW in comparison with soccer players at any angular velocity. However, when comparing results at 60°/s, both sides were found to be not significantly different (pleft=0.807 & pright=0.388). It is
clear that, at this relatively low angular velocity, the differences between hockey and soccer are minor. At higher angular velocities, such as 180°/s and 240°/s, significant differences are observable with p-values ranging from 0.015 to 0.001.
With regard to field hockey kinematics, a recurring deep lunge position is apparent, concerning deep trunk, hip and knee joint flexion angles (39). Recovering from this position (as shown in fig. 2 & 3) demands a certain muscle activity of the hip extensors (e.g., Hamstring muscles) which seems nonexistent in soccer.
22 An additional argument for alternative loading of the Hamstrings in field hockey may be identified by the leaning forward posture (fig. 4). Higher activity of the Hamstring muscles was reported by Portnoy et al. (41) and Leinonen et al. (42) in trunk flexion postures, which could suggest higher PTBW values of the knee flexors in field hockey players, as is not the case in soccer in which more upright postures are taken (fig. 5).
Figure 4: Leaning forward position in field hockey (43)
23 Another plausible explanation for this finding could be the fact that hockey players implement more general strength training of the lower limbs. Consequently, higher isokinetic strength values are measured. However, to confirm this suggestion, more research is needed on this specific content of soccer and field hockey training regimes.
Taking all this into account, a more favorable H/Q ratio in hockey appears to be reasonable, as will be seen further on in this discussion.
The Peak Torque per Body Weight parameter for the M. Quadriceps does not appear to distinguish a significant difference between soccer and hockey players for any angular velocity.
Compared to the previous trend of values, it is striking that within the soccer population, mean values for the M. Quadriceps PTBW parameter were seen that are similar to these of the hockey players. This could be explained by the fact that both soccer and hockey players are exposed to great loading of the M. Quadriceps. Although, as discussed by Dvir et al. (9), Malina et al. (45) and de Lira et al. (32), muscular demands are sport-specific, so they vary depending on the sport one practices.
5.3 Hamstrings/Quadriceps Ratio
In contrast to the other parameters, the absolute values of the Hamstrings/Quadriceps Ratio are appropriate to be compared between different studies. There may be a possible deviation in calibration due to the use of different isokinetic devices. The variability originated by this event is normalized within this parameter by applying the ratio of two values, being Hamstrings and Quadriceps Peak Torque, respectively.
The H/Q ratios are calculated from Hamstrings and Quadriceps PTBW values. At rising angular velocities, the PTBW values of the M. Quadriceps drop more sharply than these of the Hamstring muscles, which results in increasing H/Q ratios. This statement was confirmed by Rosene et al. (46) and is also consistent with the conclusions of Kannus et al. (47) in injured knees and with those of Croce et al. (48) in nondisabled, sedentary controls.
This study seems to confirm the cited observations for the hockey players as subjects showed H/Q ratios of 0.63 ± 0.11 at 60°/s, 0.66 ± 0.12 at 180°/s and 0.74 ± 0.13 at 240°/s on the left side. These proportions were also found on the right side, with values of 0.62 ± 0.11 at 60°/s, 0.67 ± 0.12 at 180°/s and 0.73 ± 0.11 at 240°/s.
However, this trend is not reflected in the values of soccer players. Within this group, the lowest ratios are found at 180°/s, being 0.53 ± 0.11 on the left and 0.55 ± 0.12 on the right
24 side. The cause of this deviation could be found in the fact that soccer players also achieve the lowest PTBW values for the Hamstring muscles at 180°/s.
In order to give cause to this observation, further research is recommended as it has not been discussed within the literature covered by the authors of this study.
Nevertheless, it is important to mention that according to Hoshikawa et al. (49), Hamstring muscles have an event-related difference in its muscularity which cannot be explained by the difference in the lean tissue mass of the whole body, while this is not the case for the M. Quadriceps. This statement will be further elaborated later in the discussion.
Just like the Peak Torque per Body Weight parameter at 60°/s, no significant differences were distinguished between soccer and hockey players in regard to the values for the Hamstrings/Quadriceps Ratio parameter at 60°/s. Values of 0.63 ± 0.11 (left) and 0.62 ± 0.11 (right) for the hockey players are found, set against 0.60 ± 0.11 (left) and 0.59 ± 0.08 (right) for the soccer players. The H/Q ratio results are higher in the hockey population sized up to the soccer population, which is a trend that remains visible in all measured angular velocities.
The strongest significant differences were found at 180°/s. For this angular velocity, mean values of 0.66 ± 0.12 among hockey players for the left leg and 0.53 ± 0.11 at the same side in soccer players are detected. Mean values of 0.67 ± 0.12 among the hockey players and 0.55 ± 0.12 among the soccer players were determined on the right side. When comparing these results, the differences between both sides were found to be strongly significant (pleft=0.001 & pright=0.003).
The soccer players tested in this study scored remarkably lower than those reported in Rosene et al. (46). Within that study, values of 0.61 ± 0.15 for the right side and 0.58 ± 0.13 for the left side were measured at 180°/s. A potential explanation for this discrepancy is the difference in playing level. More specifically, Rosene et al. (46) investigated intercollegiate athletes while this study included top-level soccer players of the Belgian first division. Players who perform at a higher level, experience greater amounts of training (1). This finding is supported by Dvir et al. (9), Öberg et al. (33), de Lira et al. (32), Rosene et al. (46) and Silva et al. (50), who demonstrated that muscle strength and performance in sport-specific muscle power efforts are related to the competitive level of the soccer player.
On account of higher PTBW values of the Hamstring muscles versus the M. Quadriceps at 240°/s, the same significances between both groups can be distinguished for the H/Q ratio. The left side shows a significant difference (p=0.022), with mean values of 0.74 ± 0.13 for the hockey players and 0.65 ± 0.11 among the soccer players. On the right side, a strong
25 significant difference (p=0.005) was found with mean values of respectively 0.73 ± 0.11 and 0.61 ± 0.15.
Similar results were found by Gür et al. (51), investigating the H/Q ratio at 240°/s among elite male soccer players playing in the first division of the National League, confirming the hypothesis that soccer players generally achieve lower H/Q ratios.
The differences within the H/Q ratio between the two populations could be clarified by the fact that the mean PTBW values of the Hamstring muscles, both left and right, are remarkably lower in soccer athletes. Thus, contrasting with the PTBW of the M. Quadriceps, where no significant differences can be found, as discussed previously. All this leads to higher H/Q ratios for the hockey players. Since H/Q ratios follow the trend of the PTBW parameter, significant differences are only visible at 180°/s and 240°/s.
Bennell et al. (52) and Grace et al. (53) state that H/Q ratios ranged from 0.50 to 0.80 should be considered normal for any angular velocity. This is the case in this study, with a minimum of 0.53 ± 0.11 at 180°/s (soccer players) and a maximum of 0.74 ± 0.13 at 240°/s (hockey players). These obtained mean values can therefore be considered as safe in terms of injury prevention. Yet, according to several other studies, ratios lower than 0.60 have been associated with higher knee injury incidence, which puts the soccer players within this study at higher risks (32,54–61). For this reason, their H/Q ratios must be interpreted with caution. Specific Hamstrings strength training has proven to be useful in injury risk reduction by improving the H/Q ratio (32,62). A practical implication that should be made is the recommendation of isokinetic testing in order to assess H/Q ratios in preseason screenings, as already advised by de Lira et al. (32), Rosene et al. (46), Rahnama et al. (63), and Siqueira et al. (64).
Although these concentric H/Q ratios may indicate muscle function and knee stability, as discussed by Cometti et al. (1) and Cheung et al. (62), they do not include the eccentric contractions involved in for example the kicking action or a running pattern, thus do not fully reflect muscle function during sports activities (32).
As indicated by Aagaard et al. (65), calculating an H/Q ratio using the Peak Torque values of eccentric Hamstrings and concentric M. Quadriceps testing may be a better method to simulate the co-activation pattern developed in running, kicking, etc. Therefore, a more sport-specific manner of isokinetic testing is available. Eccentric isokinetic testing, however, increases the risk of delayed onset muscle soreness and possible injuries during testing (66). This argument was the main reason for only conducting concentric testing in this study.
26
5.4 Total Work
Beside PT, which is thought-out to be the favored measure of isokinetic strength performance, additional parameters such as Total Work may contribute useful information in terms of muscle endurance. Moreover the ability to generate strength over a longer period in time. Different functional requirements by players in specific positions in the game might demand various levels of muscle endurance, inducing variable results regarding the Total Work parameter. When deducing this remark made by Śliwowski et al. (21) concerning an elite soccer population to athletes of different sports, even higher alterations may be marked.
Equal to the PTBW flexion and H/Q ratio, the 60°/s values for Work flexion (Hamstring muscles) are not significantly different (pleft=0.672 & pright=0.165). When analyzing higher
velocities like 180°/s and 240°/s, a strong to very strong significant difference is recognized. Hockey players score consistently higher compared to soccer players, with the differences ranging from 93,6 J (left leg) to 136,0 J (right leg) at 240°/s and from 136,8 J (left leg) to 159,2 J (right leg) at 180°/s. As mentioned above, Hoshikawa et al. (49) acknowledged an event-related difference in muscularity of the Hamstrings that cannot be declared by a difference in lean tissue mass of the body. This statement is not convenient for the M. Quadriceps, where differences in muscularity are attributable to the lean tissue mass of the body. Consequently, a difference of Hamstring muscle strength between soccer and hockey players with approximately the same lean body mass could be argued by events such as other training methods, strength training frequency, games played, etc.
Matching the PTBW extension (M. Quadriceps) results, there are no significant inequalities at any angular velocity between soccer and hockey athletes for the Work extension parameter. P-values were detected ranging from 0.360 to 0.966. The coherence in the observations for PTBW and Total Work is consistent, as stated in the study by Perrin et al. (67).
5.5 Average Power
When considering M. Hamstrings Average Power, it is striking that the outcomes at all angular velocities were found to be significantly different in favor of the hockey players, with p-values ranging from 0.001 to 0.030. Nevertheless, the lowest significant difference is again measured at 60°/s. Namely, a considerably lower variation is evaluated at 60°/s (16 - 19,1 W) with respect to 180°/s (50,5 - 61,7 W) and 240°/s (46,7 - 66,6 W). This could identify 60°/s as being too slow to detect great differences between the two populations. As the Average Power results are noticeably higher at 180°/s and 240°/s for both hockey and soccer, greater differences between the two at these higher velocities seem justifiable. A study by Croce et al. (48)
27 displayed significantly greater Hamstrings and M. Quadriceps Average Power values at a higher angular velocity (90°/s) set against a lower angular velocity (60°/s) in a sedentary control group. By extrapolating these conclusions to this study, analogous results were found, showing greater Average Power values at 240°/s compared to 180°/s and 60°/s. This hypothesis was already validated by Kovaleski et al. (68) a long time ago (1992), reporting greater power producing potential at higher velocities and greater force production exercising at lower velocities.
A remarkable left-right alteration is defined for the M. Quadriceps AP results. Especially the left leg, showing no significant dissimilarity among hockey athletes and soccer players. For the right leg on the other hand, significant differences are demonstrated in favor of the hockey athletes at all three velocities. It is clear that a left-right distinction is apparent for the M. Quadriceps AP parameter, however the cause of this distinction could implicate multiple sports physiological factors such as different movement patterns, differentiation between standing leg and kicking leg in soccer or the push-off leg in hockey, and another function of the legs in relation to the sport. As various sports events have other movement patterns, energy demands, or training regimens, the physical and body composition of an athlete are specific to the type of sports practiced (9,32,45). This was successively confirmed by Hoshikawa et al. (49), who described a significant effect of event in both reciprocal muscle groups of the thigh, even in adolescent athletes.
Kannus et al. (47) declare that a significant correlation coefficient is apparent between Peak Torque and Average Power for both M. Quadriceps and the Hamstring muscles of each leg. Thus, proving the predictability of Average Power from Peak Torque to be statistically and clinically significant. This study can only partially confirm this statement. The M. Quadriceps PTBW values do not differ significantly comparing soccer and hockey athletes. Considering the correlation coefficients between PT and AP to be statistically significant, equal comparisons should be presumable. However, this is not the case in this study as there were significant differences found between the two athlete populations for the right leg at all velocities for the Average Power parameter. This confirms a lack of correlation with respect to the PTBW and AP parameter for at least one of the two athlete populations.
5.5 Strengths and Limitations
The strength of this research lies in the composition of participants, consisting of elite soccer and hockey players. Including such highly trained athletes may make sport-specific adaptations more apparent in isokinetic testing outcomes. Furthermore, articles covering a
28 comparison of isokinetic profiles between hockey and soccer players are scarce, especially in this youthful population. This study investigated the Average Power parameter, which is rarely discussed in isokinetic literature, distinguishing this investigation from other comparable studies. Research considers Average Power valuable to estimate the training effect on muscle function (9). For this reason, the authors consider it crucial for the AP to be examined more thoroughly in order to broaden knowledge around the relevant parameter.
Nevertheless, some limitations must be reported.
According to Cometti et al. (1), isokinetic dynamometry lacks applicability to sport-specific movements. However, it is a frequently used method in research as well as in clinical practice to assess and monitor muscle performance and pathology. Another possible restriction is that fairly young populations (17.6 ± 0.76 years for the soccer players and 18.1 ± 0.77 years for the hockey players) were tested, while the subjects of other studies are often adults. However, as mentioned above, this youthful age should have little impact on the delivered strength values (36–38). At last, as already discussed, various isokinetic devices (Cybex, Biodex, Kin-com, etc.) are used in the available literature, often causing incomparability of obtained values, thence restricting the authors of this study to compare raw data. It is clear that more research is required comparing different sports in isokinetic testing and relating these results to sport specific physiological factors. As suggested before, more insight is needed in sport-specific training regimes in order to interpret differences in isokinetic muscle performance.
29
6. Conclusions
In this study, differences in isokinetic strength between field hockey and soccer players were noticed, suggesting the manifestation of sport-specific muscle profiles.
Significant differences were mainly withheld in Hamstrings muscle strength in both PTBW, TW and AP. Apart from the AP parameter, no significant differences between hockey and soccer athletes were assigned for the M. Quadriceps isokinetic test results.
As a general conclusion, the authors describe an appearance of minorly developed Hamstring muscles in soccer compared to field hockey players, contrary to approximately equal results for the M. Quadriceps (exc. Average Power). As a result, lower H/Q ratios are visible within the soccer population, which induces an increased risk of injuries (e.g., Hamstring strains, ACL ruptures, etc.). Isokinetic screening and individually tailored prevention programs could be an important factor in restoring the H/Q balance, thus diminishing the injury risk.
By any means, a clear distinction in isokinetic strength is apparent between the two elite athlete populations.
7. Conflict of interest
30
8. References
1. Cometti, G., Maffiuletti, N. A., Pousson, M., Chatard, J. C., & Maffulli, N. (2001). Isokinetic strength and anaerobic power of elite, subelite and amateur French soccer players. International journal of sports medicine, 22(01), 45-51.
2. Knezevic, O. M., Mirkov, D. M., Kadija, M., Milovanovic, D., & Jaric, S. (2014). Evaluation of isokinetic and isometric strength measures for monitoring muscle function recovery after anterior cruciate ligament reconstruction. The Journal of Strength & Conditioning Research, 28(6), 1722-1731.
3. Paul, D. J., & Nassis, G. P. (2015). Testing strength and power in soccer players: the application of conventional and traditional methods of assessment. The Journal of Strength & Conditioning Research, 29(6), 1748-1758.
4. Baltzopoulos, V., & Brodie, D. A. (1989). Isokinetic dynamometry. Sports medicine, 8(2), 101-116.
5. Thistle, H. G. (1967). Isokinetic contraction A New concept of resistive Exercise. Arch. of Physical Med. & Rehabilitation, 48, 279-281.
6. Ayala, F., De Ste Croix, M., Sainz de Baranda, P., & Santonja, F. (2013). Absolute reliability of isokinetic knee flexion and extension measurements adopting a prone position. Clinical physiology and functional imaging, 33(1), 45-54.
7. Hopkins, W. G. (2000). Measures of reliability in sports medicine and science. Sports medicine, 30(1), 1-15.
8. Coyle, E. F., Costill, D. L., & Lesmes, G. R. (1979). Leg extension power and muscle fiber composition. Med Sci Sports, 11(1), 12-5.
9. Dvir, Z. (2004). Isokinetics: muscle testing, interpretation, and clinical applications. Elsevier Health Sciences.
10. Impellizzeri, F. M., Bizzini, M., Rampinini, E., Cereda, F., & Maffiuletti, N. A. (2008). Reliability of isokinetic strength imbalance ratios measured using the Cybex NORM dynamometer. Clinical physiology and functional imaging, 28(2), 113-119.
11. de Carvalho Froufe, A. C. P., Caserotti, P., de Carvalho, C. M. P., de Azevedo Abade, E. A., & da Eira Sampaio, A. J. (2013). Reliability of concentric, eccentric and isometric knee extension and flexion when using the REV9000 isokinetic dynamometer. Journal of Human Kinetics, 37(1), 47-53.
31 12. Ayala, F., Croix, M. D. S., de Baranda, P. S., & Santonja, F. (2012). Absolute reliability of hamstring to quadriceps strength imbalance ratios calculated using peak torque, joint angle-specific torque and joint ROM-specific torque values. International journal of sports medicine, 33(11), 909-916.
13. Duarte, J. P., Valente-dos-Santos, J., Coelho-e-Silva, M. J., Couto, P., Costa, D., Martinho, D., ... & Gonçalves, R. S. (2018). Reproducibility of isokinetic strength assessment of knee muscle actions in adult athletes: Torques and antagonist-agonist ratios derived at the same angle position. PloS one, 13(8).
14. Maffiuletti, N. A., Bizzini, M., Desbrosses, K., Babault, N., & Munzinger, U. (2007). Reliability of knee extension and flexion measurements using the Con‐Trex isokinetic dynamometer. Clinical physiology and functional imaging, 27(6), 346-353.
15. Sole, G., Hamrén, J., Milosavljevic, S., Nicholson, H., & Sullivan, S. J. (2007). Test-retest reliability of isokinetic knee extension and flexion. Archives of physical medicine and rehabilitation, 88(5), 626-631.
16. https://www.fifa.com/mm/document/fifafacts/bcoffsurv/bigcount.statspackage 7024.pdf 17. Stølen, T., Chamari, K., Castagna, C., & Wisløff, U. (2005). Physiology of
soccer. Sports medicine, 35(6), 501-536.
18. Ünveren, A. (2015). Investigating women futsal and soccer players’ acceleration, speed and agility features. The Anthropologist, 21(1-2), 361-365.
19. Hoff, J. (2005). Training and testing physical capacities for elite soccer players. Journal of sports sciences, 23(6), 573-582.
20. Milanović, Z., Sporiš, G., Trajković, N., & Fiorentini, F. (2011). Differences in agility performance between futsal and soccer players. Sport Sci, 4(2), 55-59.
21. Śliwowski, R., Grygorowicz, M., Hojszyk, R., & Jadczak, Ł. (2017). The isokinetic strength profile of elite soccer players according to playing position. PloS one, 12(7). 22. Keane, S., Reilly, T., & Borrie, A. (1997). A comparison of fitness characteristics of elite
and non-elite Gaelic football players. Science and football III, 3-6.
23. DeProft, E., Clarys, J. P., Bollens, E., Cabri, J., & Dufour, W. (1988). Muscle activity in the soccer kick. Reilly T, Lees A, Davis K, 16.
24. Vanderstukken, F., Jansen, N., Mertens, T., & Cools, A. M. (2019). Elite male field hockey players have symmetric isokinetic glenohumeral strength profiles, but show asymmetry in scapular muscle strength. Journal of sports sciences, 37(5), 484-491.
32 25. Chesher, S. M., Netto, K. J., Appleby, B. B., Jacques, A., & Wild, C. Y. (2019). Deceleration characteristics of elite Australian male field hockey players during an Olympic tournament. Journal of science and medicine in sport, 22(5), 611-615.
26. Sharma, H. B., & Kailashiya, J. (2018). Effects of 6-week sprint-strength and agility training on body composition, cardiovascular, and physiological parameters of male field hockey players. The Journal of Strength & Conditioning Research, 32(4), 894-901. 27. Reilly, T., & Borrie, A. (1992). Physiology applied to field hockey. Sports
Medicine, 14(1), 10-26.
28. Spencer, M., Lawrence, S., Rechichi, C., Bishop, D., Dawson, B., & Goodman, C. (2004). Time–motion analysis of elite field hockey, with special reference to repeated-sprint activity. Journal of sports sciences, 22(9), 843-850.
29. https://football-technology.fifa.com/media/1245/lotg_17_18_en.pdf
30. http://fih.ch/media/13164482/fih-rules-of-hockey-2019-final-website-11112019-typo-edits.pdf
31. https://orlandosportsmedicine.com/biodex-isokinetic-rehabiliation-and-testing/
32. De Lira, C. A., Mascarin, N. C., Vargas, V. Z., Vancini, R. L., & Andrade, M. S. (2017). Isokinetic knee muscle strength profile in Brazilian male soccer, futsal, and beach soccer players: a cross-sectional study. International journal of sports physical therapy, 12(7), 1103.
33. Öberg, B., Möller, M., Gillquist, J., & Ekstrand, J. (1986). Isokinetic torque levels for knee extensors and knee flexors in soccer players. International journal of sports medicine, 7(01), 50-53.
34. Zakas, A., Mandroukas, K., Vamvakoudis, E., Christoulas, K., & Aggelopoulou, N. (1995). Peak torque of quadriceps and hamstring muscles in basketball and soccer players of different divisions. The Journal of sports medicine and physical fitness, 35(3), 199-205.
35. Charteris, J. (1999). Effects of velocity on upper to lower extremity muscular work and power output ratios of intercollegiate athletes. British journal of sports medicine, 33(4), 250-254.
36. Forbes, H., Bullers, A., Lovell, A., McNaughton, L. R., Polman, R. C., & Siegler, J. C. (2009). Relative torque profiles of elite male youth footballers: effects of age and pubertal development. International Journal of Sports Medicine, 30(08), 592-597.
33 37. Kellis, S., Gerodimos, V., Kellis, E., & Manou, V. (2001). Bilateral isokinetic concentric and eccentric strength profiles of the knee extensors and flexors in young soccer players. Isokinetics and Exercise Science, 9(1), 31-39.
38. Lehance, C., Binet, J., Bury, T., & Croisier, J. L. (2009). Muscular strength, functional performances and injury risk in professional and junior elite soccer players. Scandinavian journal of medicine & science in sports, 19(2), 243-251.
39. Ogurkowska, M. B., & Kawałek, K. (2017). Evaluation of functional and structural changes affecting the lumbar spine in professional field hockey players. Acta of bioengineering and biomechanics, 19(2).
40. https://www.youtube.com/watch?v=veYDjYfSvkQ&gl=BE
41. Portnoy, H., & Morin, F. (1956). Electromyographic study of postural muscles in various positions and movements. American Journal of Physiology-Legacy Content, 186(1), 122-126.
42. Leinonen, V., Kankaanpää, M., Airaksinen, O., & Hänninen, O. (2000). Back and hip extensor activities during trunk flexion/extension: effects of low back pain and rehabilitation. Archives of physical medicine and rehabilitation, 81(1), 32-37.
43. https://nl.wikipedia.org/wiki/Tanguy_Cosyns
44. https://www.shutterstock.com/search/cristiano+ronaldo+portugal
45. MALINA, R., HARPER, A., AVENT, H., & CAMPBELL, D. (1971). Physique of female track and field athletes. Medicine and science in sports, 3(1), 32-38.
46. Rosene, J. M., Fogarty, T. D., & Mahaffey, B. L. (2001). Isokinetic hamstrings: quadriceps ratios in intercollegiate athletes. Journal of athletic training, 36(4), 378. 47. Kannus, P. (1988). Ratio of hamstring to quadriceps femoris muscles' strength in the
anterior cruciate ligament insufficient knee: relationship to long-term recovery. Physical Therapy, 68(6), 961-965.
48. Croce, R. V., Pitetti, K. H., Horvat, M., & Miller, J. (1996). Peak torque, average power, and hamstring/quadriceps ratios in nondisabled adults and adults with mental retardation. Archives of physical medicine and rehabilitation, 77(4), 369-372.
49. Hoshikawa, Y., Muramatsu, M., Iida, T., Uchiyama, A., Nakajima, Y., & Kanehisa, H. (2010). Event-related differences in the cross-sectional areas and torque generation capabilities of quadriceps femoris and hamstrings in male high school athletes. Journal of physiological anthropology, 29(1), 13-21.
34 50. Silva, J. R., Magalhães, J. F., Ascensão, A. A., Oliveira, E. M., Seabra, A. F., & Rebelo, A. N. (2011). Individual match playing time during the season affects fitness-related parameters of male professional soccer players. The Journal of Strength & Conditioning Research, 25(10), 2729-2739.
51. Gür, H., Akova, B., Pündük, Z., & Küçükoǧlu, S. (1999). Effects of age on the reciprocal peak torque ratios during knee muscle contractions in elite soccer players. Scandinavian Journal of Medicine & Science in Sports, 9(2), 81-87.
52. Bennell, K., Wajswelner, H., Lew, P., Schall-Riaucour, A., Leslie, S., Plant, D., & Cirone, J. (1998). Isokinetic strength testing does not predict hamstring injury in Australian Rules footballers. British journal of sports medicine, 32(4), 309-314.
53. Grace, T. G., Sweetser, E. R., Nelson, M. A., Ydens, L. R., & Skipper, B. J. (1984). Isokinetic muscle imbalance and knee-joint injuries. A prospective blind study. The Journal of bone and joint surgery. American volume, 66(5), 734-740.
54. Chena, D. R., Kurth, A. L., Thomas, M., & Mayhew, J. (1991). Torque characteristics of the quadriceps and hamstring muscles during concentric and eccentric loading. Journal of Orthopaedic & Sports Physical Therapy, 14(4), 149-154.
55. Bittencourt, N. F. N., Amaral, G. M., Anjos, M. T. S., D’Alessandro, R., Silva, A. A., & Fonseca, S. T. (2005). Isokinetic muscle evaluation of the knee joint in athletes of the Under-19 and Under-21 Male Brazilian National Volleyball Team. Rev Bras Med Esporte, 11(6), 331-6.
56. Ruas, C. V., Minozzo, F., Pinto, M. D., Brown, L. E., & Pinto, R. S. (2015). Lower-extremity strength ratios of professional soccer players according to field position. The Journal of Strength & Conditioning Research, 29(5), 1220-1226.
57. Coombs, R., & Garbutt, G. (2002). Developments in the use of the hamstring/quadriceps ratio for the assessment of muscle balance. Journal of sports science & medicine, 1(3), 56.
58. Portes, E. M., Portes, L. A., Botelho, V. G., & Souza Pinto, S. D. (2007). Isokinetic torque peak and hamstrings/quadriceps ratios in endurance athletes with anterior cruciate ligament laxity. Clinics, 62(2), 127-132.
59. Knapik, J. J., Bauman, C. L., Jones, B. H., Harris, J. M., & Vaughan, L. (1991). Preseason strength and flexibility imbalances associated with athletic injuries in female collegiate athletes. The American journal of sports medicine, 19(1), 76-81.
35 60. Zvijac, J. E., Toriscelli, T. A., Merrick, W. S., Papp, D. F., & Kiebzak, G. M. (2014). Isokinetic concentric quadriceps and hamstring normative data for elite collegiate American football players participating in the NFL Scouting Combine. The Journal of Strength & Conditioning Research, 28(4), 875-883.
61. Andrade, M. S., Cohen, M., Piçarro, I. D. C., & Silva, A. C. (2002). Knee performance after anterior cruciate ligament reconstruction. Isokinetics and Exercise Science, 10(2), 81-86.
62. Cheung, R., Smith, A., & Wong, D. (2012). H: Q ratios and bilateral leg strength in college field and court sports players. Journal of human kinetics, 33(1), 63-71.
63. Rahnama, N., Lees, A., & Bambaecichi, E. (2005). A comparison of muscle strength and flexibility between the preferred and non-preferred leg in English soccer players. Ergonomics, 48(11-14), 1568-1575.
64. Siqueira, C. M., Pelegrini, F. R. M. M., Fontana, M. F., & Greve, J. M. D. (2002). Isokinetic dynamometry of knee flexors and extensors: comparative study among non-athletes, jumper athletes and runner athletes. Revista do Hospital das Clinicas, 57(1), 19-24.
65. Aagaard, P., Simonsen, E. B., Trolle, M., Bangsbo, J., & Klausen, K. (1995). Isokinetic hamstring/quadriceps strength ratio: influence from joint angular velocity, gravity correction and contraction mode. Acta Physiologica Scandinavica, 154(4), 421-427. 66. Mair, J., Mayr, M., Mullet, E., Koller, A., Haid, C., Artner-Dworzak, E., ... & Puschendorf,
B. (1995). Rapid adaptation to eccentric exercise-induced muscle damage. International journal of sports medicine, 16(06), 352-356.
67. Perrin, D. H., Robertson, R. J., & Ray, R. L. (1987). Bilateral isokinetic peak torque, torque acceleration energy, power, and work relationships in athletes and nonathletes. Journal of Orthopaedic & Sports Physical Therapy, 9(5), 184-189.
68. Kovaleski, J. E., Heitman, R. J., Scaffidi, F. M., & Fondren III, F. B. (1992). Effects of isokinetic velocity spectrum exercise on average power and total work. Journal of athletic training, 27(1), 54.
9. Abstract in layman’s terms
In dit onderzoek werden 46 topsporters van een elite voetbal- en hockeyploeg aangeworven voor een isokinetisch krachtonderzoek. Dit is een test waarbij de hoeksnelheid op het gewricht constant wordt gehouden tijdens de uitvoering. De resultaten worden bepaald door de kracht die een proefpersoon biedt tegen de weerstand gegenereerd door het toestel. Deze testen werden verricht in het laboratorium van de vakgroep Kinesitherapie en Revalidatiewetenschappen in het UZ Gent te Gent, België.
Hierbij werden de spieren rond het kniegewricht getest en daaropvolgend beoordeeld aan de hand van verscheidene parameters. Vervolgens werden de resultaten door de auteurs via statistische programma’s geanalyseerd en werden beide groepen vergeleken. Tenslotte werd er gekeken naar andere, gelijkaardige literatuurstudies omtrent hetzelfde topic. Op basis hiervan werden de verkregen onderzoeksresultaten beschreven met betrekking tot het belang voor beide sporten.